DOI:10.32604/iasc.2023.028290
| Intelligent Automation & Soft Computing DOI:10.32604/iasc.2023.028290 | |
| Article |
An Efficient ResNetSE Architecture for Smoking Activity Recognition from Smartwatch
1Department of Computer Engineering, Image Information and Intelligence Laboratory, Faculty of Engineering, Mahidol University, Nakhon Pathom, 73170, Thailand
2Department of Computer Engineering, School of Information and Communication Technology University of Phayao, Phayao, 56000, Thailand
3Department of Mathematics, Faculty of Applied Science, King Mongkut’s University of Technology North Bangkok, Bangkok, 10800, Thailand
4Intelligent and Nonlinear Dynamic Innovations Research Center, Science and Technology Research Institute, King Mongkut’s University of Technology North Bangkok, Bangkok 10800, Thailand
*Corresponding Author: Anuchit Jitpattanakul. Email: anuchit.j@sci.kmutnb.ac.th
Received: 07 February 2022; Accepted: 20 March 2022
Abstract: Smoking is a major cause of cancer, heart disease and other afflictions that lead to early mortality. An effective smoking classification mechanism that provides insights into individual smoking habits would assist in implementing addiction treatment initiatives. Smoking activities often accompany other activities such as drinking or eating. Consequently, smoking activity recognition can be a challenging topic in human activity recognition (HAR). A deep learning framework for smoking activity recognition (SAR) employing smartwatch sensors was proposed together with a deep residual network combined with squeeze-and-excitation modules (ResNetSE) to increase the effectiveness of the SAR framework. The proposed model was tested against basic convolutional neural networks (CNNs) and recurrent neural networks (LSTM, BiLSTM, GRU and BiGRU) to recognize smoking and other similar activities such as drinking, eating and walking using the UT-Smoke dataset. Three different scenarios were investigated for their recognition performances using standard HAR metrics (accuracy, F1-score and the area under the ROC curve). Our proposed ResNetSE outperformed the other basic deep learning networks, with maximum accuracy of 98.63%.
Keywords: Smoking activity recognition; deep residual network; smartwatch sensors; deep learning
Smoking is now globally recognized as one of the most harmful human habits, impacting not only the well-being of smokers but also those around them. Smoking also increases the danger of fires due to the carelessness with which it is practiced, and also leads to issues with health care and finances. People who smoke have nicotine cravings, making it tough to quit. Systems that can identify when a person is about to relapse anywhere and at any time are required to help kick the habit. The process of mining statistical data such as smoking recurrence can be used to better comprehend smoking patterns [1] and help people to enhance their standard of health and boost their wellness. Inertial sensors are now utilized to track physical activity utilizing wearable intelligent products such as smartwatches. Smoking Activity Recognition (SAR) is also commonly used as a research tracking activity [2].
Many motion sensors can be included in commercialized wearable or portable devices such as accelerometers, gyroscopes and magnetometers found in smartphones and other wearable devices. Motion sensor data from wristwatches can be analyzed to better understand smoking-related hand movements and identify higher-level activities on an Android-based system [3]. Smoking can be monitored by linking a wristwatch with an Android smartphone and running detection algorithms [4]. Numerous researchers have utilized smartphone sensor information to detect smoking occurrences [4,5]. However, the effectiveness of online smoking prediction using a mobile phone has not been examined in detail because movement domains from a wristwatch or smartphone are usually employed as standalones.
Traditional identification classifier approaches such as Naive Bayes [6], Support Vector Machine [7] and Random Forest [8] have been extensively used as learning approaches in earlier SAR studies. The Random Forest algorithm has proven advantages and has been effectively employed in various research studies of smoking event detection and activity identification. Deep Learning (DL) approaches such as Convolutional Neural Networks (CNNs) and Recurrent Neural Networks (RNNs) have also gained popularity [9].
Here, a DL-based framework for recognizing smoking activities was proposed, with CNNs and RNNs examined as five baseline DL models (CNN, LSTM, BiLSTM, GRU and BiGRU). To increase recognition performance, a deep residual network was proposed to identify complicated hand motions utilizing inertial sensors. The UT-Smoke dataset was used to investigate the recognition efficiency of basic deep learning models and our proposed model.
The remainder of this article is organized as follows. Section 2 introduces current research relevant to the topic under consideration. Details of the proposed deep learning model (ResNetSE) are presented in Section 3. Section 4 describes experiments conducted to compare accuracy and efficiency, while Section 5 evaluates the experimental results. Finally, Section 6 outlines some of the major anticipated future challenges.
Recently, increased research has focused on recognizing smoking activities. Video-based and sensor-based approaches are the two most common methods for classifying smoke occurrences and distinguishing human activities [1,3,7,10,11]. The former examines images or videos from a single camera that contains human motion, whereas the latter examines signal data from sensors like gyroscopes, accelerometers, WiFis and sound sensors [12,13]. This article focuses on sensor-based SAR and presents the latest research results and deep learning approaches.
2.1 Sensor-based Smoking Activity Recognition
The goal of smoking activity recognition (SAR) is to understand human behavior so that computer systems can classify smoking activity using available data. Hand movements for smoking, drinking and eating can be specified as a series of complex hand activities that the user performs over time in each protocol. Copious research has been conducted on SAR over the past decade.
A feasibility study utilizing a wrist-worn accelerometer was one of the earliest efforts on smoking detection [14]. The researchers achieved a user-specific recall rate of 70% and accuracy of 51%. Despite the limited identification performance, they found some useful results using wrist-worn sensors to discriminate smoking activity, focusing exclusively on smoking whilst standing. The researchers in [15] employed two Support Vector Machine (SVM) classifiers; one for the initial detection of high-level activity in a window of sensor data and the other to detect micro activity within the same window. They claimed a very high smoking detection rate but this study only examined smoking while standing and the quantity of training and testing data was not reported. Furthermore, this study collected data from sensors at the foot position in addition to the wrist as a very conspicuous position. These two investigations did not take into account the intervening gestures of smoking while walking and while conversing in a group. They also did not include temporal information contained in a smoking activity that could be beneficial. In [16], the researchers employed accelerometers across both wrists to detect smoking. Six participants smoked and engaged in other activities over 11.8 hours (comprising 34 smoking episodes or 481 puffs). Several different types of smoking were considered as standing, sitting, walking, eating, talking on the phone and talking in a group. A two-layer technique was used to classify smoking habits.
With advances in wearable sensor technology and ubiquitous computing, sensor-based smart gadgets such as wristbands and smartwatches are becoming more prevalent. Several studies employed wristbands or smartwatches because of their wearability and simplicity to track smoking and other related activities such as eating and drinking. Maramis et al. [16] and Bhandari et al. [17] utilized a single gyroscope or accelerometer on the wrist to distinguish cigarette-to-mouth movements and smoking activities, using traditional approaches to find anomalies on remote servers. Shoaib et al. [3] used an Android wristwatch to collect data from multiple sensors and perform activity detection processes in real-time, while Skinner et al. [18] employed two decision tree classifiers to recognize typical hand movements of cigarette smoking using accelerometer and gyroscope motion data from an Android smartwatch. The two smoke event detection systems discussed above were powered by low-cost smartwatches that required more computing power.
2.2 Deep Learning Approaches in HAR
Machine learning techniques used in the past required a thorough understanding of the domain to implement, let alone develop. The main problem with using manually developed features is that it is difficult to find an exact characteristic or set of characteristics that accurately distinguishes all activities.
Classification methods traditionally used in SAR research include the Naïve Bayes classifier [6], Support Vector Machine classifier [19] and Random Forest classifier [8]. Among these, the Random Forest classifier has been effectively applied to smoke event detection and activity recognition in several studies, while deep learning technologies such as convolutional neural networks and recurrent neural networks have also achieved higher performances and significant results [9].
Deep learning algorithms have recently acquired prominence in a variety of fields [20,21]. Convolutional Neural Networks are deep neural networks that operate as feature extractors by automatically learning numerous layers of characteristics. However, CNNs are not able to learn subsequent correlations, while Long Short-Term Memory (LSTM) [22,23] recurrent neural networks are ideally adapted to modeling temporal dynamics. For time series problems such as speech recognition and human activity recognition, combining CNNs with LSTMs provides a state-of-the-art approach [24,25].
Deep learning networks spontaneously combine low, medium and high level features [25] and classifiers in a multi-layer end-to-end method, with the number of layers (depth) stacked enhancing feature levels. The latest findings [26] show that the depth of the network is crucial. He et al. [27] added residual connectivity, which is necessary for training extremely deep convolutional models. Residual connectivity allows the proposed method to grow while maintaining performance and avoiding overfitting, which is a common problem with existing deep neural networks. In the field of human activity recognition, Ronald et al. [28] employed the iSPLInception model to increase the performance of HAR by using the residual connection and the inception module.
Squeeze-and-Excitation block [29] is a channel attention method that can be applied to existent CNNs to increase their performance. The SE block has been shown to be effective in congestive heart failure detection [30] and object detection tasks [31]. Motivated by [27,29], the ResNetSE model was introduced here for smoking activity classification and compared with ResNet baseline deep learning models in the same scenario.
The sensor-based SAR framework used in this study consisted of four main processes as data acquisition, data pre-processing, data generation, model training and evaluation, as shown in Fig. 1.

Figure 1: SAR framework based on smartwatch sensors
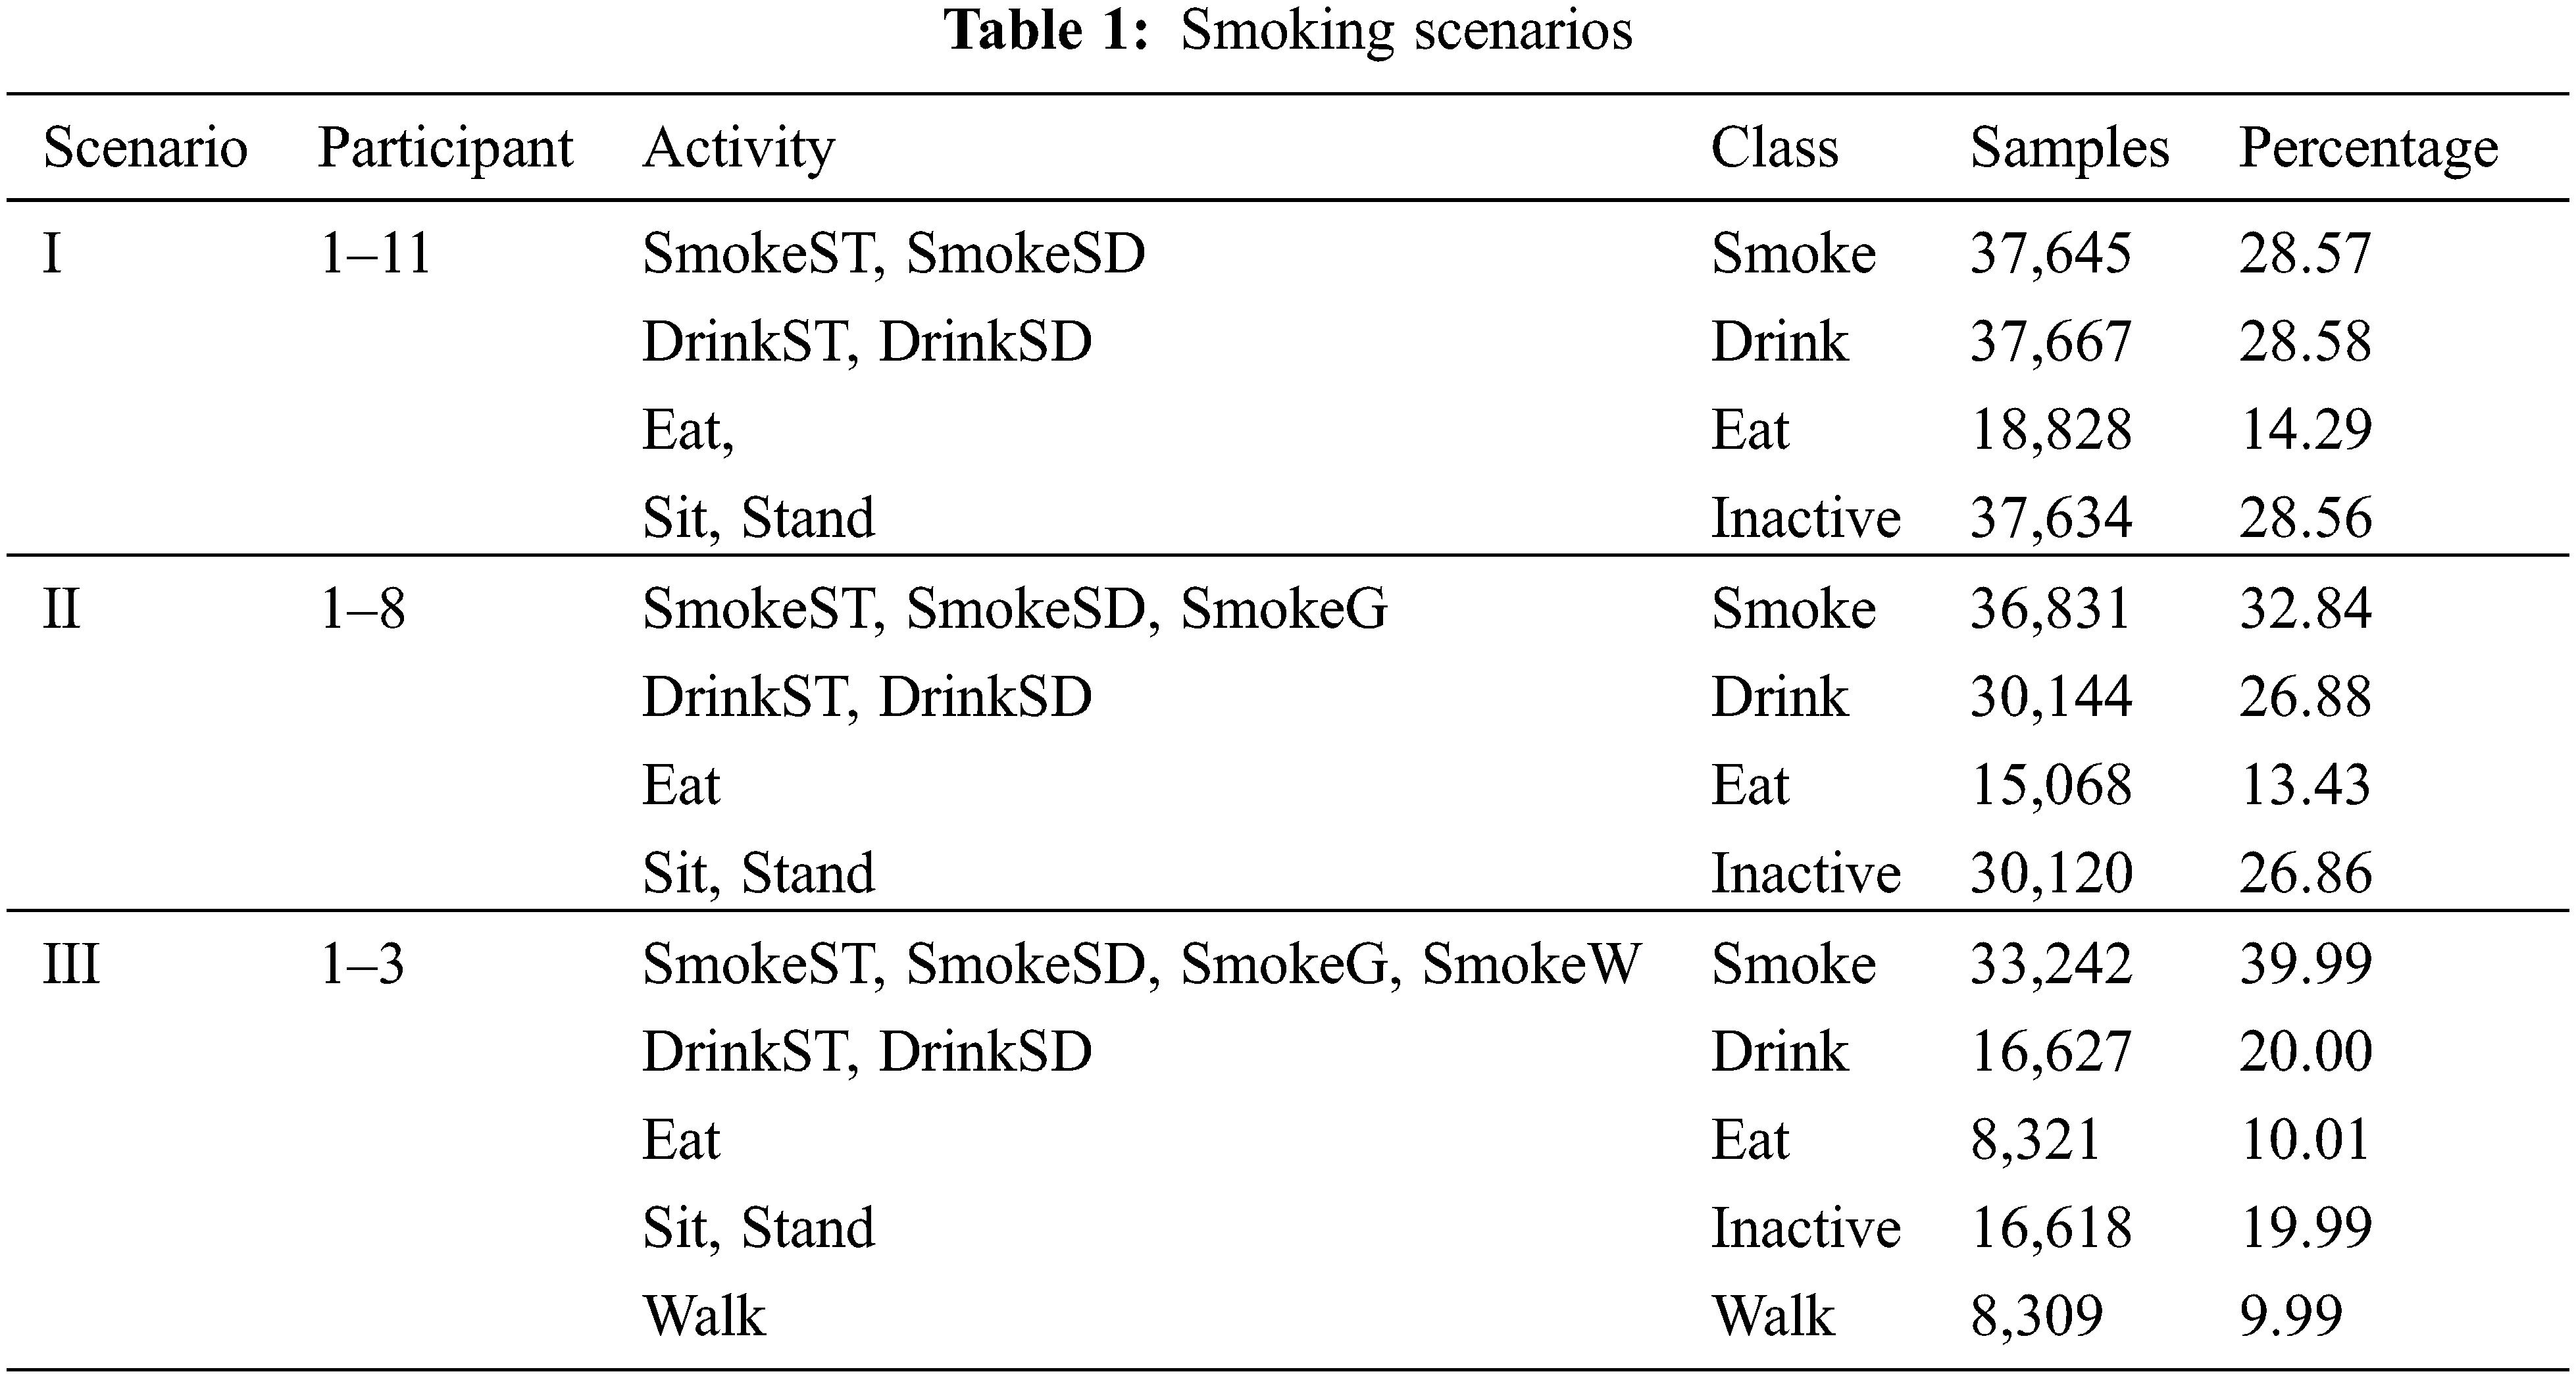
In this study, the UT-Smoke dataset was used as a previously published public smoking activity dataset [3,32]. Over the course of three months, 11 volunteers (2 females and 9 males ranging in age from 20 to 45) provided data via a smartwatch application. Both a smartwatch and a smartphone were used to collect timestamps, triaxial accelerometer, gyroscope and magnetometer measurements. All data were sampled at 50 Hz. The activities performed included smoking while standing (SmokeSD), smoking while sitting (SmokeST), smoking while walking (SmokeW), smoking in a group conversation (SmokeG), drinking while standing (DrinkSD), drinking while sitting (DrinkST), eating (Eat), standing (Stand), sitting (Sit) and walking (Walk). This dataset focused on detecting different types of smoking as well as comparable actions that could be mistaken for smoking. With the exception of SmokeG and SmokeW, which were completed by 8 and 3 participants, respectively all exercises were completed by all participants. Fig. 2 shows a variety of smartwatch sensor data samples.

Figure 2: Samples of smartwatch sensor data from the UT-smoke dataset
Raw sensor data generally cannot be used to directly detect smoke events. Therefore, data pre-processing is essential to prepare the data for the next training task. In sensor-based HAR, inertial signals from various body components, such as accelerometer or gyroscope data, are preserved at a lower frequency. However, during excitation, generation and transmission, the signals can be confronted with numerous types of high-frequency noise. The Butterworth filter is one of the most commonly used low-pass filter because it has an apartment amplitude response and preserves phase information without distortion. To achieve this purpose, a 6th order Butterworth filter with a 12 Hz cutoff frequency was used to confine the signal bandwidth to frequencies common in human motion.
Furthermore, different types of sensors have diverse value ranges. As a result, each data channel should be rescaled to provide a uniform contribution. The normalized data followed a typical normal distribution with mean of zero (μ = 0) and unit variance (δ = 1).
Many forms of inertial signals are continually created over time, with long data sequences occurring from discrete sampling at a specific frequency. The inertial signals in this study were separated into frames using a sliding window with a predetermined width of 2 s, as suggested in [33] and an overlap fraction of 50%, as suggested in [34] to improve feature extraction and subsequent training processes.
3.3 Baseline Deep Learning Models
In this study, our proposed ResNetSE model was compared with five baseline CNN and RNN models, with specifications of each model given below. The CNN model is a conventional convolutional neural network with N convolutional layers, ReLU activation [35] and a hidden dense layer. An example of applying CNNs to time series data can be found in [36]. The CNN architecture is shown in Fig. 3.

Figure 3: CNN architecture
The number of convolutional layers, as well as the number of filters for each convolutional layer and the number of neurons in the hidden dense layer, are CNN hyperparameters. Pooling layers were excluded in this study since reducing the spatial size of the sequence is usually unnecessary when there are enough convolutional layers.
The Long Short-Term Memory (LSTM) network is a commonly used variant of the recurrent neural network architecture. LSTM was proposed by [35] to solve the vanishing gradient problem in long-term dependency learning. To model long-range dependencies in temporal sequences, LSTM employs memory cells with three gates and parameters as a solution. These gates determine when states are updated and earlier concealed states are forgotten, and hence control the general operation of the memory cells. Fig. 4 depicts the RNN-based architecture.

Figure 4: RNN-based architecture: (a) LSTM, (b) BiLSTM, (c) GRU and (d) BiGRU
Schuster et al. [36] presented the Bidirectional LSTM (BiLSTM) to improve the amount of knowledge available in the LSTM network. The BiLSTM is connected with two hidden layers in different directions. This structure simultaneously learns from previous and subsequent sequences. The LSTM is a viable alternative to RNNs with vanishing gradients but the architecture’s memory cells result in increased memory requirements. The Gated Recurrent Unit (GRU) network, a new RNN-based model, was introduced in 2014 by Cho et al. [37]. The GRU is a simplified version of the LSTM that lacks a dedicated memory cell. In a GRU network, there is an update and reset gate that controls the degree of change of each hidden state. The GRU determines what knowledge must and must not be transferred from one state to the next. A major disadvantage is that the GRU network is unidirectional. This means that the output at a given time step, apart from the current input, depends solely on the previous information in the input sequence. However, in other situations, it may be more useful to make predictions by considering not only the past but also the future [38]. Alsarhan et al. [39] presented a human activity recognition model based on bidirectional gated recurrent units (BiGRU). Results showed that the BiGRU model was successfully applied for human activity recognition from sensor data.
3.4.1 Architecture of the Proposed Models
To detect smoking activities, a deep learning model inspired by ResNet called the ResNetSE model was presented in this article. Fig. 5 shows the architecture of ResNetSE, which includes a convolutional block and eight ResNetSE blocks, a Global Average-Pooling layer (GAP), a flattening layer and a fully connected layer.

Figure 5: Proposed ResNetSE model
Most convolutional architectures are based on the discipline of image classification, containing the first and most important achievements of DL. Skip-connections (also known as residual connections) represent connections that skip numerous layers in higher neural networks [25] as a particularly successful strategy to deal with them efficiently. Such a neural network was also developed for time series classification [20] and showed similar performance in a variety of situations [40]. The number of residual modules is one of the hyperparameters of ResNet architecture. As shown in Fig. 6, a ResNetSE module consists of two convolutional layers and a skip connection that connects the two layers.

Figure 6: Structure of the ResNetSE block
Convolutional neural networks combine spatial and channel-wise information [29] to extract features. The SE block was developed to increase the representability of the model from the perspective of channel relationships. After the convolution operation, various feature maps are obtained, with some containing data redundancy. The SE block performs feature recalibration to enhance the informative aspects while suppressing the less beneficial ones. In the squeezing process, global pooling is first performed for each feature map, followed by weight vector determination. The feature weights are then redistributed in the excitation procedure, which uses fully linked layers and a sigmoid activation function. A gradient descent approach is used to manage redistribution. Finally, the weights are used to reweight the feature maps. In this study, the SE block in each residual block was positioned behind the BN to recalibrate the feature maps obtained with the stacked layers.
The experimental setup and results used to evaluate deep learning models for SAR using smartwatch sensor data are described and demonstrated in this section.
The wristwatch sensor data from the UT-Smoke dataset were divided into three scenarios for investigation because not all activities were completed by all participants. Scenario 1 considered all participants; however, smoking while walking and during group conversations were excluded because not all participants engaged in these two smoking activities. Scenario 2 used the first eight participants since they all smoked during group discussions but ignored the first three participants who smoked while walking. Scenario 3 evaluated the first three participants from Tab. 2 as well as all of their activities. These three participants were selected since they were the only ones who smoked while walking [32]. These scenarios are summarized in Tab. 1.
All experiments were conducted on the Google Colab Pro platform using a Tesla V100, and Python 3.6.9, Numpy 1.18.5, TensorFlow 2.2.0, Scikit-Learn, Keras 2.3.1 and Pandas 1.0.5 libraries. The recognition performances of the deep learning models were evaluated and results were compared with standard metrics (accuracy and F1-score). The performance metrics used were:
Accuracy as the first statistic quantifies the proportion of accurate estimates to all predicted values in the validation data. Eq. (1) was used to compute the accuracy. The recall is defined as the proportion of correctly categorized positives to the number of actual class activities in the testing dataset. Recall is also referred to as sensitivity and was computed using Eq. (2). The third statistic is the F1-score as the average accuracy and recall multiplied by two (3). This is also referred to as the symmetrical F1-score. It considers false positives (FP) and false negatives (FN) and is a more helpful statistic for assessment than accuracy. The lowest possible outcome for each of the four measures is 0%, while the highest possible result is 100%.
The area under the receiver operation characteristic (ROC) curve (AUC) was used to evaluate the models. This is specified in terms of the integral of the true positive rate (TPR) and the false positive rate (FPR). Eqs. (4)–(6) define TPR, FPR and AUC. The AUC value has to be in the range of 0 to 1. A high AUC value indicates that a proposed method can discriminate across distinct types of human activity. Thus, the model with the most significant AUC is the optimal solution for identification. The TPR is calculated as the ratio of true positives (TP) to the total of true positives and false negatives (TP + FN), while FPR is the ratio of false positives (FP) to false positives and true negatives (FP + TN). The assessment indicators “accuracy, F1-score, and area under the ROC curve” were considered because they help to analyze and assess the performance of the suggested model [41].
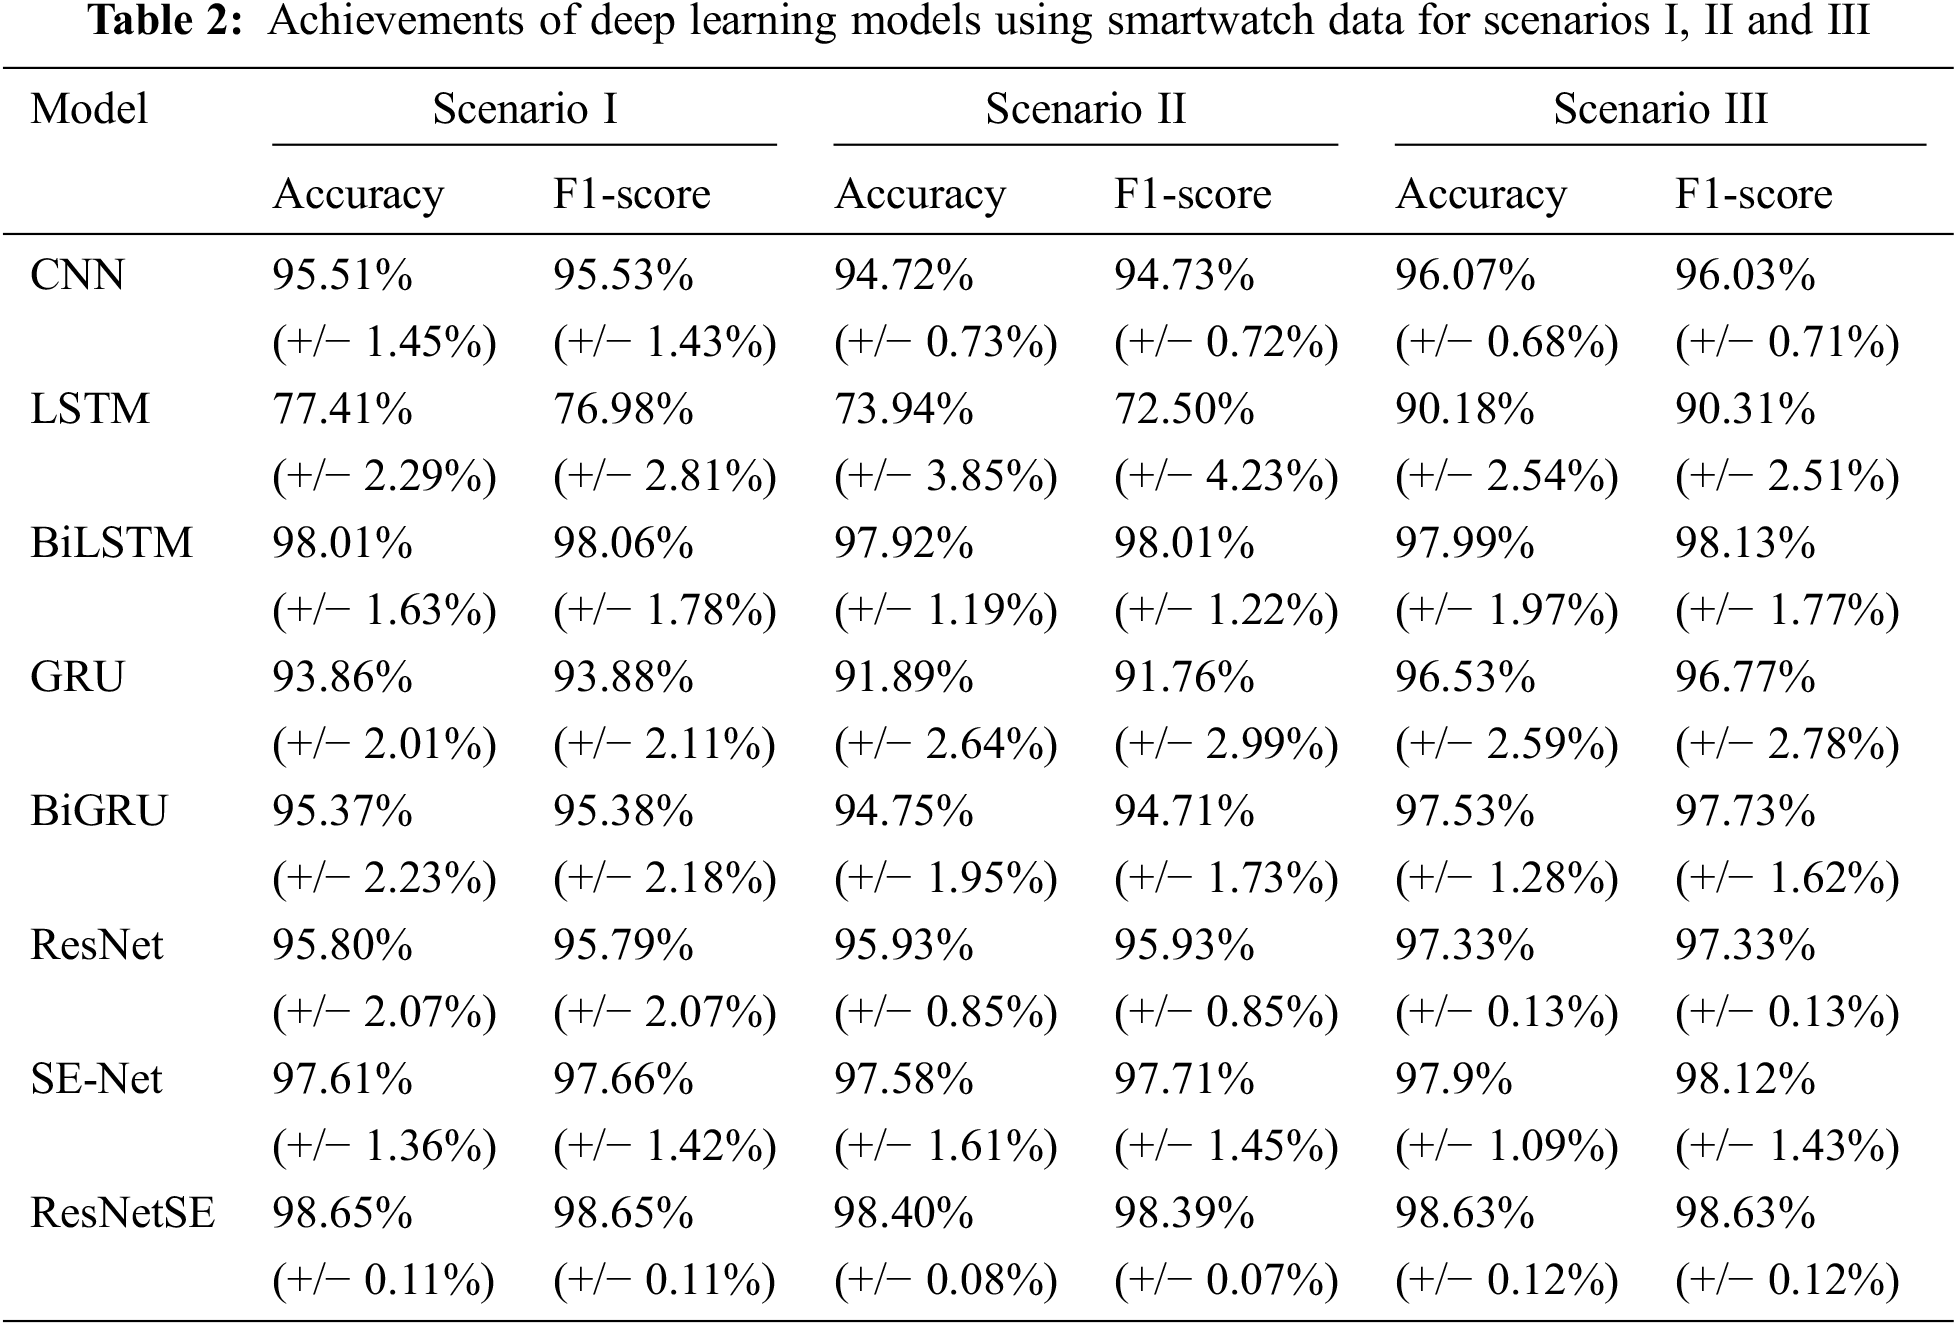
These results were obtained using 5-fold cross-validation. Various analyses were performed to determine the recognition efficiency of five fundamental deep learning models (CNN, LSTM, BiLSTM, GRU and BiGRU) and known classification networks (ResNet and SE-Net), along with the recommended ResNetSE model. These deep learning models were evaluated using a variety of metrics including accuracy and F1-score (Tab. 2). The ROC curves compared the recognition performances of these DL models, as shown in Fig. 7.

Figure 7: Comparative findings of the area under the ROC curves of DL models produced from each experimental setup scenario I, II and III: (a) ROC curves and (b) ROC curves with zoomed representation
These experimental results showed that our proposed ResNetSE outperformed the other deep learning networks in scenarios I, II and III with highest accuracy of 98.65%, 98.39% and 98.63%, respectively. Fig. 7 shows the confusion matrices of the CNN, LSTM and ResNet.
ROC probability curves were used to evaluate the models, with the true positive rate (TPR) on the vertical axis and the false positive rate (FPR) on the horizontal axis for threshold values ranging from 0.0 to 1.0. Fig. 7b demonstrates ROC curves zoomed in at the top left of curves in Fig. 7a. Highest values for the three scenarios were obtained from the proposed ResNetSE model, indicating that the ResNetSE achieved better performance results than the other models.
5.1 Impact of Squeeze-and-Excitation Modules
The squeeze-and-excitation module was developed to improve the explanatory capability of deep learning models in terms of channel relationships. Multiple feature maps are needed after convolutional processes in the recommended ResNetSE structure, as seen in Fig. 6. Several feature maps included duplicate data. The SE module performed feature recalibration to improve significant features and disabled less supportive features. To determine the effect of the SE module, further investigations were conducted comparing the recommended ResNetSE to a model with the SE module excluded. Fig. 8 shows the comparative findings.
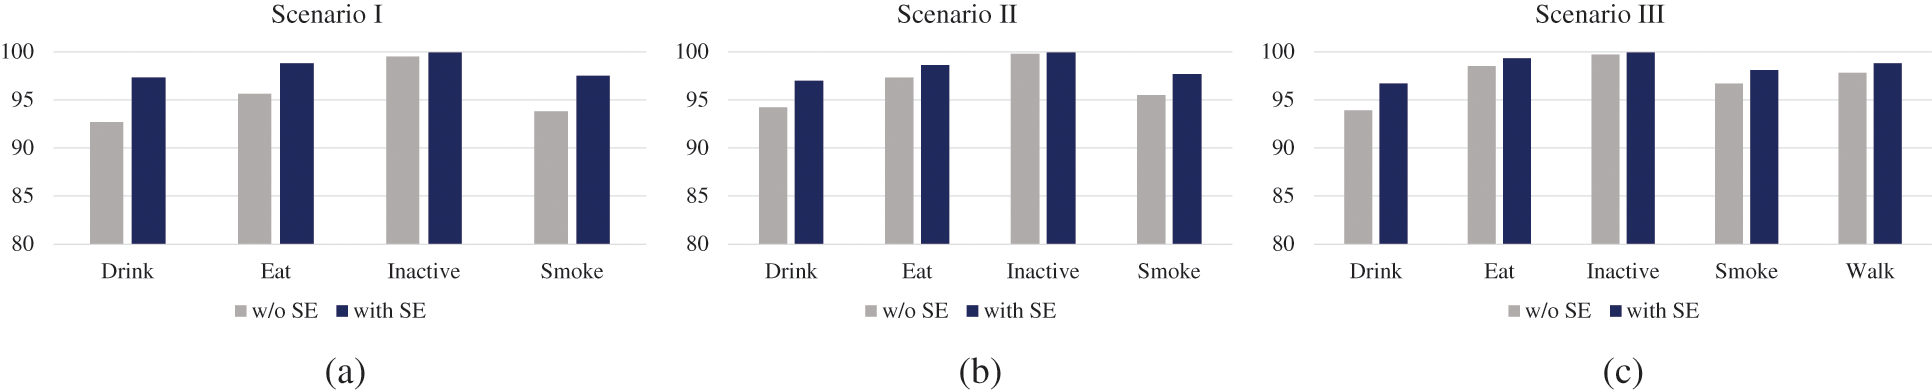
Figure 8: Comparative results showing the impact of the squeeze-and-excitation module on different scenarios: (a) scenario I, (b) scenario II and (c) scenario III
Fig. 8 illustrates comparative results obtained by utilizing the squeeze-and-excitation mechanism to enhance the SAR experience in various settings. Our recommended ResNetSE model with the squeeze-and-excitation module outperformed the multivariate model without the squeeze-and-excitation module in terms of identification effectiveness. The squeeze-and-excitation module combined a channel attention mechanism approach to significant valuable data to map channel reliance. Our suggested ResNetSE recalibrated the filter outputs, resulting in increased effectiveness.
5.2 Impact of Residual Connections
To investigate the effect of residual connectivity on the suggested method, the ResNetSE was adjusted by discarding residual connections of the previous model and repeating the experiment. Fig. 9 shows the comparative findings.

Figure 9: Comparative results showing the impact of residual connectivity for different scenarios: (a) scenario I, (b) scenario II and (c) scenario III
As seen in Fig. 9, the suggested ResNetSE outperformed its upgraded structure without residual connections in various circumstances because the residual connections efficiently addressed the deteriorating issue associated with SAR. The residual link also improved the suggested ResNetSE convergence rate. As seen in Fig. 10, the residual connection layer considerably accelerated the convergence of the proposed method.

Figure 10: Change in loss and accuracy curves of the proposed models: (a) with residual connections, (b) without residual connections
5.3 Comparison with Existing Works
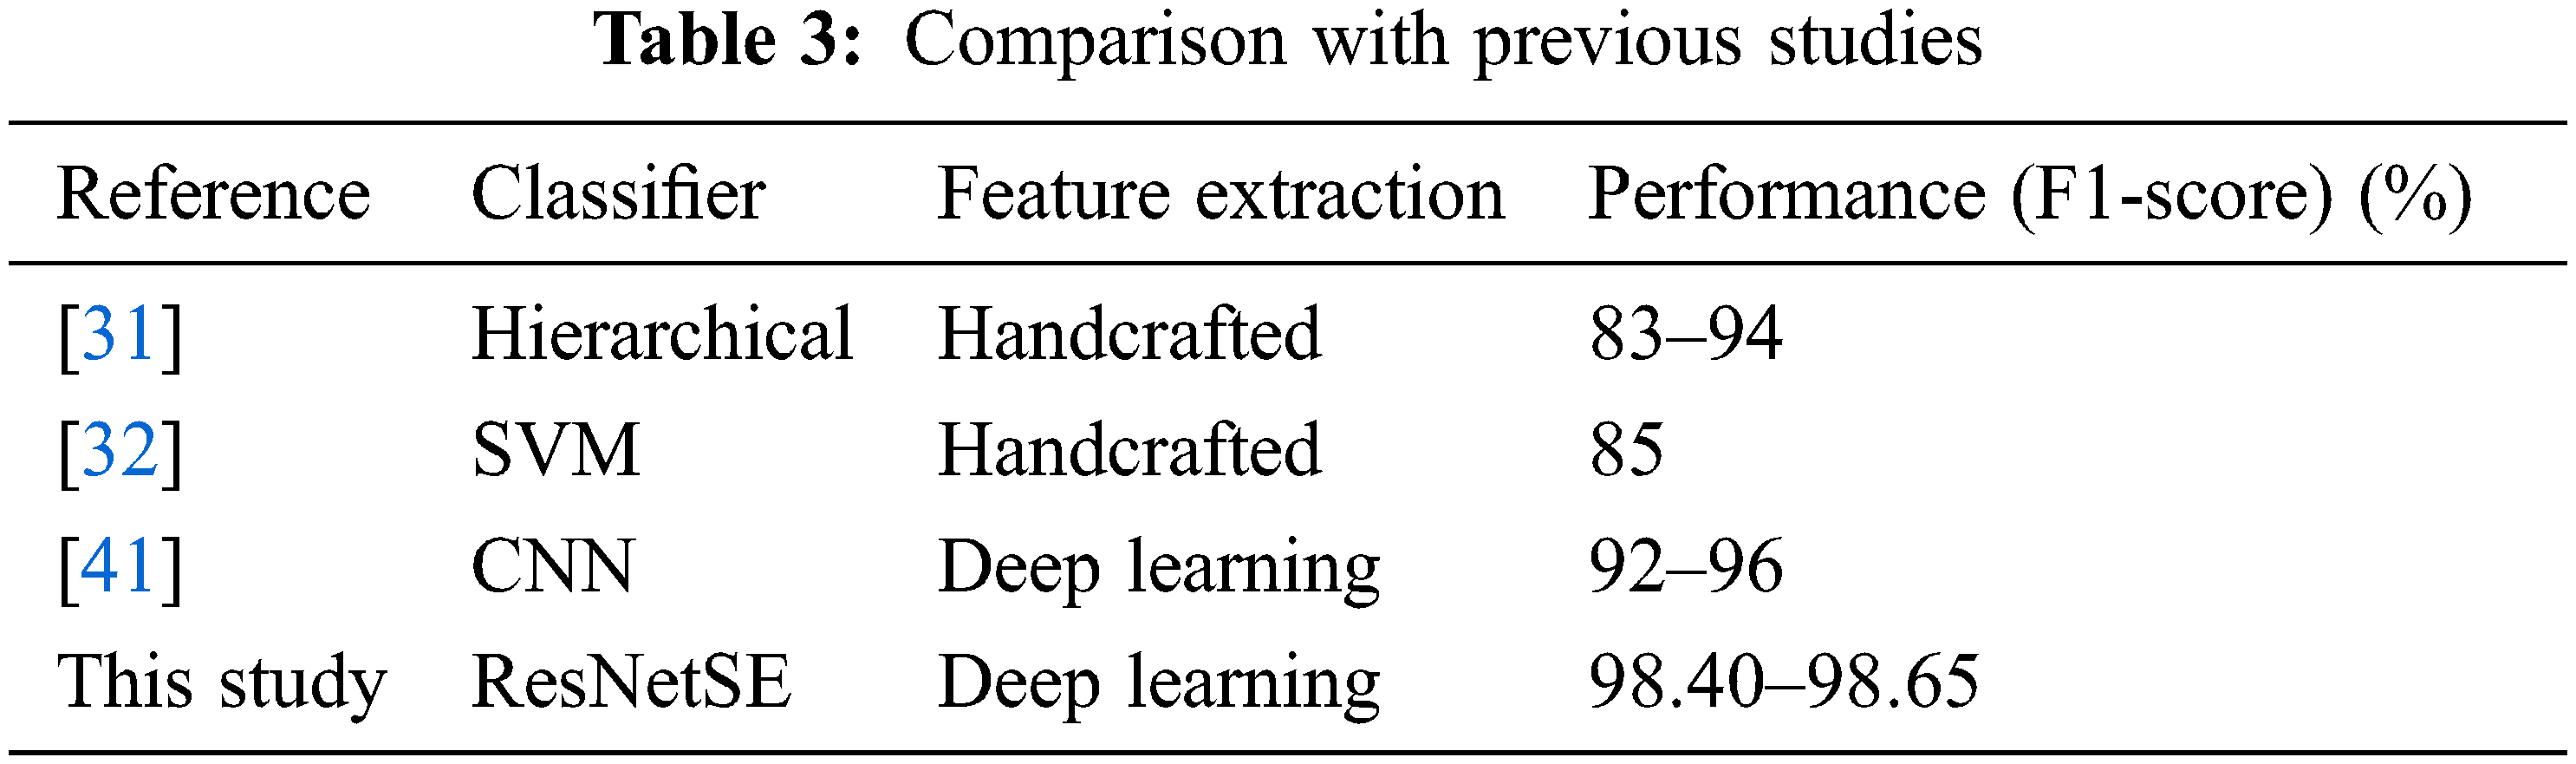
Our progressive approach was then assessed against other approaches to the SAR issue. Tab. 3 compares the UT-Smoke dataset with previous studies. The F1-score of our model showed enhanced SAR capabilities. Machine learning classification models in [31,32] relied on handcrafted classifiers to extract the features, resulting in reduced accuracy. However, the ResNetSE model had a superior F1-score to the CNN classification model in [41] because it used residual functionalities to identify high-level abstract features.
DL-based SAR was studied using smartwatch sensor data. Five standard deep learning algorithms as CNN, LSTM, BiLSTM, GRU and BiGRU as well as two residual networks (ResNet and SE-Net) were compared with our suggested ResNetSE model. To evaluate the recognition performance of SAR, a public benchmark dataset called UT-Smoke was conducted for three experimental scenarios. Results revealed that the ResNetSE model significantly outperformed the other baseline models, with highest accuracy of 98.63%. Additional investigations were performed to evaluate results compared to the other current models. Findings demonstrated that our suggested ResNetSE model outperformed other previously examined approaches regarding classification effectiveness. Furthermore, the impacts of end-to-end functionalities, such as a squeeze-and-excitation module and a residual connection module, were also studied. Results showed that the squeeze-and-excitation module improved detection capability by mapping channel dependence and approaching potential information through a channel attention method, while the residual connection module tackled the deterioration issue for SAR satisfactorily and benefited the suggested ResNetSE in terms of faster convergence. Findings demonstrated a practical method for detecting smoking activity using inertial sensors from smartwatches.
However, more instances are required for modeling in actual applications. Validation of the proposed DL models using datasets with larger numbers of subjects and different smoking activity patterns should be included in future research. Further improvements in the performance would be achieved by developing more complicated and lightweight deep learning networks, as well as unique data representations based on time-frequency analysis.
Funding Statement: The authors gratefully acknowledge the financial support provided by Thammasat University Research fund under the TSRI, Contract No. TUFF19/2564 and TUFF24/2565, for the project of “AI Ready City Networking in RUN”, based on the RUN Digital Cluster collaboration scheme. This research project was also supported by the Thailand Science Research and Innonation fund, the University of Phayao (Grant No. FF65-RIM041), and supported by King Mongkut’s University of Technology North Bangkok, Contract No. KMUTNB-65-KNOW-02.
Conflicts of Interest: The authors declare that they have no conflicts of interest to report regarding the present study.
1. C. Fan and F. Gao, “A new approach for smoking event detection using a variational autoencoder and neural decision forest,” IEEE Access, vol. 8, pp. 120835–120849, 2020. [Google Scholar]
2. W. Qi, H. Su, C. Yang, G. Ferrigno, E. D. Momi et al., “Fast and robust deep convolutional neural networks for complex human activity recognition using smartphone,” Sensors, vol. 19, pp. 3731, 2019. [Google Scholar]
3. M. Shoaib, O. D. Incel, H. Scholten and P. Havinga, “SmokeSense: Online activity recognition framework on smartwatches,” in 9th EAI Int. Conf. on Mobile Computing, Applications and Services, Osaka, Japan, pp. 106–124, 2018. [Google Scholar]
4. C. A. Cole, J. F. Thrasher, S. M. Strayer and H. Valafar, “Resolving ambiguities in accelerometer data due to location of sensor on wrist in application to detection of smoking gesture,” in IEEE-EMBS Int. Conf. on Biomedical and Health Informatics, Orlando, FL, USA, pp. 489–492, 2017. [Google Scholar]
5. E. V. Añazco, P. R. Lopez, S. Lee, K. Byun and T. -S. Kim, “Smoking activity recognition using a single wrist IMU and deep learning light,” in 5th Int. Conf. on Digital Signal Processing, Tokyo, Japan, pp. 48–51, 2018. [Google Scholar]
6. M. Shoaib, S. Bosch, O. D. Incel, H. Scholten and P. J. M. Havinga, “Complex human activity recognition using smartphone and wrist-worn motion sensors,” Sensors, vol. 16, no. 4, pp. 426, 2016. [Google Scholar]
7. Q. Tang, D. Vidrine, E. Crowder and S. Intille, “Automated detection of puffing and smoking with wrist accelerometers,” in 8th Int. Conf. on Pervasive Computing Technologies for Healthcare, Oldenburg, Germany, pp. 80–87, 2014. [Google Scholar]
8. D. Yazdansepas, A. H. Niazi, J. L. Gay, F. W. Maier, L. Ramaswamy et al., “A multi-featured approach for wearable sensor-based human activity recognition,” in IEEE Int. Conf. on Healthcare Informatics, Chicago, IL, USA, pp. 423–431, 2016. [Google Scholar]
9. J. Wang, Y. Chen, S. Hao, X. Peng and L. Hu, “Deep learning for sensor-based activity recognition: A survey,” Pattern Recognition Letters, vol. 119, pp. 3–11, 2019. [Google Scholar]
10. K. He, X. Zhang, S. Ren and J. Sun, “Deep residual learning for image recognition,” in IEEE Conf. on Computer Vision and Pattern Recognition, NV, USA, pp. 770–778, 2016. [Google Scholar]
11. P. Wu, J. W. Hsieh, J. C. Cheng, S. C. Cheng and S. Y. Tseng, “Human smoking event detection using visual interaction clues,” in 2010 20th Int. Conf. on Pattern Recognition, WA, USA, pp. 4344–4347, 2010. [Google Scholar]
12. X. R. Zhang, W. F. Zhang, W. Sun, X. M. Sun and S. K. Jha, “A robust 3-D medical watermarking based on wavelet transform for data protection,” Computer Systems Science & Engineering, vol. 41, no. 3, pp. 1043–1056, 2022. [Google Scholar]
13. X. R. Zhang, X. Sun, X. M. Sun, W. Sun and S. K. Jha, “Robust reversible audio watermarking scheme for telemedicine and privacy protection,” Computers, Materials & Continua, vol. 71, no. 2, pp. 3035–3050, 2022. [Google Scholar]
14. P. M. Scholl and K. V. Laerhoven, “A feasibility study of wrist-worn accelerometer based detection of smoking habits,” in IEEE 6th Int. Conf. on Innovative Mobile and Internet Services in Ubiquitous Computing, DC, USA, pp. 886–891, 2012. [Google Scholar]
15. J. P. Varkey, D. Pompili and T. A. Walls, “Human motion recognition using a wireless sensor-based wearable system,” Personal and Ubiquitous Computing, vol. 16, no. 7, pp. 897–910, 2012. [Google Scholar]
16. C. Maramis, V. Kilintzis, P. Scholl and I. Chouvarda, “Objective smoking towards smoking detection using smartwatch sensors,” in 3rd Int. Conf. in Biomedical and Health Informatics, Thessaloniki, Germany, pp. 211–215, 2018. [Google Scholar]
17. B. Bhandari, J. Lu, X. Zheng, S. Rajasegarar and C. Karmakar, “Non-invasive sensor based automated smoking activity detection,” in IEEE 39th Annual Int. Conf. of the IEEE Engineering in Medicine and Biology Society, Jeju Island, South Korea, pp. 845–848, 2017. [Google Scholar]
18. A. L. Skinner, C. J. Stone, H. Doughty and M. R. Munafá, “StopWatch: The preliminary evaluation of a smartwatch-based system for passive detection of cigarette smoking,” Nicotine & Tobacco Research, vol. 21, no. 2, pp. 257–261, 2018. [Google Scholar]
19. A. A. Ali, S. M. Hossain, K. Hovsepian, M. M. Rahman, K. Plarre et al., “MPuff: Automated detection of cigarette smoking puffs from respiration measurements,” in ACM/IEEE 11th Int. Conf. on Information Processing in Sensor Networks, Beijing, China, pp. 269–280, 2012. [Google Scholar]
20. S. Hochreiter and J. Schmidhuber, “Long short-term memory,” Neural Computation, vol. 9, pp. 1735–1780, 1997. [Google Scholar]
21. S. Mekruksavanich and A. Jitpattanakul, “Deep convolutional neural network with RNNs for complex activity recognition using wrist-worn wearable sensor data,” Electronics, vol. 10, no. 14, pp. 1685, 2021. [Google Scholar]
22. F. J. Ordóñez and D. Roggen, “Deep convolutional and LSTM recurrent neural networks for multimodal wearable activity recognition,” Sensors, vol. 16, no. 1, pp. 115, 2016. [Google Scholar]
23. S. Mekruksavanich and A. Jitpattanakul, “LSTM networks using smartphone data for sensor-based human activity recognition in smart homes,” Sensors, vol. 21, no. 5, pp. 1636, 2021. [Google Scholar]
24. Y. Zhang, W. Chan and N. Jaitly, “Very deep convolutional networks for end-to-end speech recognition,” in 9th IEEE Int. Conf. on Acoustics, Speech and Signal Processing, LA, USA, pp. 4845–4849, 2017. [Google Scholar]
25. M. D. Zeiler and R. Fergus, “Visualizing and understanding convolutional neural networks,” in 13th European Conf. on Computer Vision, Zurich, Switzerland, pp. 818–833, 2014. [Google Scholar]
26. C. Szegedy, W. Liu, Y. Jia, P. Sermanet, S. Reed et al., “Going deeper with convolutions,” in 2015 IEEE Conf. on Computer Vision and Pattern Recognition, MA, USA, pp. 1–9, 2015. [Google Scholar]
27. K. He, X. Zhang, S. Ren and J. Sun, “Deep residual learning for image recognition,” in IEEE Int. Conf. on Computer Vision and Pattern Recognition, NV, USA, pp. 770–778, 2016. [Google Scholar]
28. M. Ronald, A. Poulose and D. S. Han, “iSPLInception: An inception-ResNet deep learning architecture for human activity recognition,” IEEE Access, vol. 9, pp. 68985–69001, 2021. [Google Scholar]
29. J. Hu, L. Shen and G. Sun, “Squeeze-and-excitation networks,” in IEEE Int. Conf. on Computer Vision and Pattern Recognition, Salt Lake City, UT, USA, pp. 7132–7141, 2018. [Google Scholar]
30. M. Lei, J. Li, M. Li, L. Zou and H. Yu, “An improved UNet++ model for congestive heart failure diagnosis using short-term RR intervals,” Diagnostics, vol. 11, no. 3, pp. 534, 2021. [Google Scholar]
31. Z. Lin, K. Ji, X. Leng and G. Kuang, “Squeeze and excitation rank faster R-CNN for ship detection in SAR images,” IEEE Geoscience and Remote Sensing Letters, vol. 16, pp. 751–755, 2018. [Google Scholar]
32. M. Shoaib, S. Hans, P. J. M. Havinga and O. D. Incel, “A hierarchical lazy smoking detection algorithm using smartwatch sensors,” in 18th IEEE Int. Conf. on E-Health Networking, Application & Services, Munich, Germany, pp. 1–6, 2016. [Google Scholar]
33. O. Banos, J. -M. Galvez, M. Damas, H. Pomares and I. Rojas, “Window size impact in human activity recognition,” Sensors, vol. 14, no. 4, pp. 6474–6499, 2014. [Google Scholar]
34. Y. Wang, S. Cang and H. Yu, “A survey on wearable sensor modality centred human activity recognition in health care,” Expert Systems with Applications, vol. 137, pp. 167–190, 2019. [Google Scholar]
35. V. Nair and G. E. Hinton, “Rectified linear units improve restricted boltzmann machines,” in 27th IEEE Int. Conf. on Machine Learning, Haifa, Israel, pp. 807–814, 2010. [Google Scholar]
36. M. Schuster and K. Paliwal, “Bidirectional recurrent neural networks,” IEEE Transactions on Signal Processing, vol. 45, pp. 2673–2681, 1997. [Google Scholar]
37. K. Cho, B. V. Merriënboer, D. Bahdanau and Y. Bengio, “On the properties of neural machine translation: Encoder-decoder approaches,” in SSST-8, Eighth Workshop on Syntax, Semantics and Structure in Statistical Translation, Doha, Qatar, pp. 103–111, 2014. [Google Scholar]
38. H. M. Lynn, S. B. Pan and P. Kim, “A deep bidirectional GRU network model for biometric electrocardiogram classification based on recurrent neural networks,” IEEE Access, vol. 7, pp. 145395–145405, 2019. [Google Scholar]
39. T. Alsarhan, L. Alawneh, M. Al-Zinati and M. Al-Ayyoub, “Bidirectional gated recurrent units for human activity recognition using accelerometer data,” in Int. Conf. on IEEE Sensors 2019, Montreal, QC, Canada, pp. 1–4, 2019. [Google Scholar]
40. H. I. Fawaz, G. Forestier, J. Weber, L. Idoumghar and P. A. Muller, “Deep learning for time series classification: A review,” Data Mining and Knowledge Discovery, vol. 33, no. 4, pp. 917–63, 2019. [Google Scholar]
41. M. Haggag, M. M. Tantawy and M. M. S. El-Soudani, “Implementing a deep learning model for intrusion detection on apache spark platform,” IEEE Access, vol. 8, pp. 163660–163672, 2020. [Google Scholar]
 | This work is licensed under a Creative Commons Attribution 4.0 International License, which permits unrestricted use, distribution, and reproduction in any medium, provided the original work is properly cited. |