DOI:10.32604/iasc.2023.027618
| Intelligent Automation & Soft Computing DOI:10.32604/iasc.2023.027618 | |
| Article |
Creating Smart House via IoT and Intelligent Computation
1Department of Electrical Engineering, National Chin-Yi University of Technology, Taichung, 411030, Taiwan
2Department of Information Technology, Takming University of Science and Technology, Taipei City, 11451, Taiwan
*Corresponding Author: Sung-Jung Hsiao. Email: sungjung@gs.takming.edu.tw
Received: 21 January 2022; Accepted: 01 March 2022
Abstract: This study mainly uses the concept of the Internet of Things (IoT) to establish a smart house with an indoor, comfortable, environmental, and real-time monitoring system. In the smart house, this investigation employed the temperature- and humidity-sensing module and the lightness module to monitor any condition for an intelligent-living house. The data of temperature, humidity, and lightness are transmitted wirelessly to the human-machine interface. The correlation of the weight of the extension theory is used to analyze the ideal and comfortable environment so that people in the indoor environment can feel better thermal comfort and lightness. In this study, improved particle swarm optimization (IPSO) is employed—an effective evolutionary method used to search the function extreme. It is simple and has a fast convergence. The convergence accuracy of this algorithm is not high at the beginning, and it can easily fall into the local extreme points. The effect of the inertia weight in mix extension theory and PSO becomes IPSO-Extension Neural Network (ENN), which was analyzed and found reliable. Motivated by the idea of power function, a new non-linear strategy for decreasing inertia weight (DIW) was proposed based on the existing linear DIW. Then, a novel hierarchical multi-sensor data fusion algorithm adopting this strategy was presented, and the weight factor of the data fusion was estimated. The distinctive feature of this algorithm is its capability of fusing data in a near-optimal manner when there is no available information about the reliability of the information sources, the degree of redundancy/complementarities of the information sources, and the structure of the hierarchy. It obtained effective information from the fusion data, successfully removed the noise disturbance, and achieved favorable results.
Keywords: IoT; data fusion; extension theory; particle swarm optimization; decreasing inertia weight; IPSO-ENN
As proposed by MIT, IoT uses the Internet to deliver information and a huge amount of computing to expand the future of the IoT. In recent years, IoT technology has been applied to various fields, such as environmental monitoring, logistics management, smart home, transportation, access control systems, and medical applications. The sensor is loaded into various items so that in the future, people will not control items but gradually make them automatic and intelligent, allowing them to judge situations and analyze what they should pay attention to. The temperature- and humidity-monitoring group and the illumination module are currently widely used in smart houses, such as farms, and companies. For example, accurate analysis of temperature, humidity, and illumination is conducive to the activity comfort of crops or organisms on local farms. However, the accuracy of measuring these data in the early days was very different. In order to improve the accuracy of the monitoring stations we have produced, we added algorithms to control our monitoring stations accurately [1].
Multi-sensor information fusion (data fusion) refers to the multi-level, multi-faceted, and multi-level processing of data from N sensors to generate new meaningful information and obtain judgments about the target state or target characteristics lead. The information being fused may be redundant or complementary. To make the fused data most effective, there must be a reasonable algorithm as much as possible. The fusion law is a better method to adjust the proportion of measurement data in the fusion result by a weighting coefficient, of which determining the weighting factor is the key. The basic method of the extension theory is the goodness evaluation method, which is advantageous as it is simple, straightforward, and easy to understand. However, the disadvantage lies in the subjective judgment ratio of the classic domain, node domain, and weight coefficient [2].
Because of this gap, many scholars began to study methods of extenics and artificial intelligence. Combining some current research, they proposed an extended neural network with a dual-weight link structure. The method includes two learning models with learning guidance and non-learning guidance, but both use the upper and lower bounds of the characteristic index classical domain as the dual weight of the extended neural network and use the extended distance as the metric optimization tool. Although this method has the advantages of simple structure design, less stringent sample data requirements, and fast convergence speed, it uses the upper and lower bounds of the classical domain as the dual weight of the neural network, ignores the role of the node domain, and uses the extended distance as a measurement tool. Making the algorithm too early may not be able to obtain the optimal solution. Therefore, this research proposes an extended neural network based on particle swarm optimization. On the basis of avoiding the shortcomings of the original extension neural network, the feature vector is based on the interval, and the system’s optimal solution effect is significantly improved to the global optimization [3,4].
2 Proposal System Mathematical Model
The Extension Theory, founded in 1983, was established by Professor Cai Wen and was founded in 1983. Extension Theory can use matter elements’ divergence, extensibility, additive, conjugate, and others to solve incompatible problems. Further, it is used to solve all kinds of contradictions encountered in our lives. Under its framework, it establishes applications in areas such as artificial intelligence, control, and detection. What is described in the early classic collections is that the relations among elements, sets, and discourses are invariable. The extension set solves the contradictory problem and makes up for the insufficiency of the classical set. It is the data of which the membership function and the membership degree are uncertain. A positive value represents the extent of the property, and a negative value represents no. If it is just 0, it may or may not have the property [5,6].
In the Extension Theory, the definition of matter element R refers to the name N, the relevant feature c, and the Value v. The three elements constitute the three elements of the matter, which are used to distinguish and identify things. We will use different names to call them, such as black tea, apples, bananas, and so on. In the extension, N is used to represent the name as long as it can express the function of a thing, the state of behavior, the relation between things, and the nature. These are all called the characteristics of the crop element. Like yellow, long can be used to indicate the characteristics of the banana. The quantity, degree, and range, used to describe a particular feature are the magnitudes of matter elements, such as red, 5, and 30 meters. We can use Eq. (1) to represent matter elements [7].
However, as a thing has multiple characteristics, we must use n (c1, c2, c3…, cn) and its relative magnitude to represent n features as v1, v2, v3…, vn. It can also be represented by Eq. (2):
2.2 Distance and Bit Value for Extension Correlation Function
In the classic set, to distinguish the authenticity of things, they are represented by Eigen functions. In the fuzzy set, subordinate functions are used to represent the degree of the membership of things, while they are used to represent certain things in the extension set. The degree of quality is the use of correlation functions. The quantity can be divided into quantification quantity and non-quantity quantity value. The non-quantization quantity value can be converted into quantification quantity value through quantification to be calculated. Then, the correlation function is used to represent the magnitude of the extension set on the real axis and the relationship between things. Therefore, establishing the correlation function can create a key method in solving contradictory problems. Suppose we set X to be any point on the real domain, (−∞, +∞) and Xo = a, b are an arbitrary interval on the real domain. Then, the definition of the distance between point X and interval Xo is expressed by Eq. (3):
The concept of this distance is slightly different from the distance in the classic set of mathematics. When point x is within Xo, in classical mathematics, the distance d = 0 is considered negative in the extension, depending on the size of the negative value. The represented point is in a different position in the interval Xo. When weakness x is outside Xo, it is as if the distance from the end of the interval to point x is the closest. In addition to the above-mentioned relationship between points and intervals, the positional relationship between one point and two intervals is often considered in the Extension Theory. The above relationship is represented by a position, which is called bit value. Let
Before calculating the correlation function, it is necessary to understand the classical domain and the specification of the section domain of the matter element. For example, Eqs. (5) and (6) are the classical domain and the section domain of the object to be measured [8,9].
After learning the classical domain and the festival domain of the matter-element, the distance between the classical domain and the festival domain is calculated using the definition of the extension distance between the object and subject for testing and the given classical and festival domains, such as Eqs. (7) and (8):
After knowing the extension distance, the correlation function can be used to calculate the value of the correlation function. If the value to be measured falls within the range of the classical domain, it is calculated by method (a) in Eq. (9). However, if it is to be measured, Values outside the classical domain are calculated using (b) in Eq. (9). The correlation function formula is shown in Formula (9):
After calculating the correlation function’s value, the weight coefficient is determined according to the condition of each measurement. This weight coefficient is assigned with a value between [0, 1], respectively, according to the importance degree, and the sum must be one. The weight coefficient size affects the level of goodness, and different weight coefficients will have different results. The weight coefficient is represented by Eq. (10):
After determining the weight coefficient, the degree of goodness is calculated by calculating the degree of relevance, and the associated value can be either positive or negative. The degree of association is defined by Eq. (11):
The particle swarm optimization (PSO) algorithm is a heuristic global optimization algorithm proposed by Eberhart and Kennedy et al. As an efficient parallel optimization algorithm, PSO solves a large number of nonlinear, non-differentiable, and multi-peak complex problems. It has a good performance and has been valued by a lot of people. Due to its simple implementation and few parameters to be adjusted, it has developed rapidly. A variety of improved PSO algorithms have appeared, which have been successfully applied in many fields of science and engineering. Based on the strong optimization ability of PSO and its series of outstanding performances in neural network weight optimization, this paper uses the non-linear inertia weight to improve PSO based on the research on the inertia weight of the important parameters of PSO. In estimating the weighting factor in data fusion, the results show that using this improved algorithm can effectively extract useful information from various fusion data, successfully eliminate noise interference, and achieve good fusion results. PSO is an evolutionary computing technology. The basic idea is to find the optimal solution through collaboration and information sharing among individuals in a group. The mathematical description is as follows: the position of the particle i in the d-dimensional space is xi = (xi1, xi2, …, xin) and the flying speed is vi = (vi1, vi2, …, vin) [10,11].
Each particle has a fitness value determined by the objective function and knows the best position (pbest) it has found so far and its current position. This can be regarded as the particle’s own flight experience. In addition, each particle also knows the best position (gbest) found by all the particles in the group so far. The calculation formula is as follows:
i = 1, 2, …, n, n is the total number of particles in the group. c1 and c2 are the statistical acceleration weights that push particles to pbest and gbest, which is usually 2. The rand() and Rand() are random numbers between [0, 1].
Eqs. (12) and (13) constitute the basic PSO algorithm. The first part of Eq. (12) is the memory term, which is the previous velocity of the particle. The second and third parts of Eq. (12) are the acceleration term, which is the contraction of the particle toward the optimal solution position based on its own cognition. This shows that the first term enables particles to have the ability to expand the search space, which is a performance of global search ability. The last two items show the particle’s local search capability. The experimental results of this research show that the basic PSO algorithm has a fast convergence speed in the early stage. However, having the disadvantage of poor local search ability makes the algorithm’s convergence speed slow in the later stage, and the solution accuracy is reduced. The reason is that the first term in formula (12) does not match the second and third terms. In order to improve this defect, the improved PSO algorithm proposed in this research injects the first part of the memory term of Eq. (12) into the inertia weight w to weigh the global search and the local search. Eq. (12) becomes as shown in Eq. (14):
Through research, it is found that a larger W enhances the global search ability of the particle swarm, which is beneficial to jumping out of the local minimum and to the convergence of the algorithm. On this basis, this study proposes to replace the fixed weight with a changing W, as shown in Eq. (15):
In Eq. (15), tmax is the maximum allowable number of iterations, z is the current number of iterations, Wstart and Wend are the initial value of the inertia weight and the value when it evolves to the maximum allowable number of iterations. After several experiments, it is found that when Wstart = 0.8 and Wend = 0.3, the performance of the IPSO algorithm will be greatly improved because the linear weight reduction strategy is simple and intuitive and has better optimization performance. However, the search process of the particle swarm is nonlinear and complex. In the complex process of making W, linear transition does not accurately reflect the search process. The particle swarm should have a larger value of W at the beginning of the iteration and should have a smaller value of W at the end of the iteration. Based on this, this research improves the decreasing strategy as shown in Eq. (16):
At the initial stage of the IPSO algorithm in formula (16), the value of W is set to be larger to avoid a premature phenomenon. At the same time, the value of W at the end of the IPSO algorithm is set to be smaller, which can increase the convergence at the end of the algorithm [12].
2.4 Extension Neural Network Model Proposed
With the deepening and perfection of extension theory, the research on Extension Neural Network (ENN) has gradually deepened. Extension neural network is a neural network model that combines extension and neural networks. Due to the dual-weight connection, ENN has outstanding performance in classifying and clustering problems. Therefore, this article adopts the ENN based on dual-rights connection. The structure of dual-rights connection ENN is a two-layer structure, including input and output, as shown in Fig. 1 [13].

Figure 1: Extension neural network model proposed in this research
The learning steps of the dual-weight connection extension neural network proposed in this research are as follows:
(1) Establish a sample node domain matter-element model.
(2) Give the t-th sample Nc and its expected output.
(3) Calculate the correlation degree according to the correlation function. The correlation function of ENN is shown in Eq. (17) from the modified Eq. (9).
(4) Calculate the comprehensive correlation degree according to formula (18).
The Ki(xt) is the weight coefficient.
(5) The fitness function is calculated after each learning process. The fitness function in this paper is shown in Eq. (19):
In formula (19), T is the number of samples, while R is the number of samples correctly predicted by ENN. When using ENN, double weight determines the final result. This paper uses a particle swarm algorithm to optimize the weight of ENN. The basic idea is that particles constantly adjust their speed and experience in the solution space and find the optimal solution through iteration [14].
Temperature sensors are used in various applications, such as food processing, Heating, Ventilation, Air-conditioning and Cooling (HVAC) environmental control, medical devices, chemical processing, and internal monitoring of automobile hoods (e.g., coolant, air intake holes, and cylinder head temperature,). The temperature sensor can measure the temperature to ensure that the process is maintained within a specific range for safe application. It can also ensure compliance with legal requirements when handling extremely high temperatures and dangerous or inaccessible measuring points.
There are two main types of temperature sensors: contact and non-contact. Contact sensors include thermocouples and thermistors, which touch the object to be measured during measurement. On the other hand, non-contact sensors measure the temperature radiation released by the heat source to determine its temperature. Non-contact sensors can measure temperature from a distance and are usually used in hazardous environments.
Humidity refers to the ratio of absolute humidity to maximum humidity in a unit volume of air. Its value is used to show the water vapor’s saturation. If the moisture in the air is saturated at the current temperature, the relative humidity will be 100%. When the humidity exceeds 100%, it will begin to condense. As the temperature rises, the water content in the air increases. However, when the temperature is lower, the relative humidity rises when the water vapor is the same. Therefore, when providing relative humidity, it is also necessary to attach temperature data. The dew point can then be determined by the temperature and maximum humidity. The relative humidity is often used when forecasting weather as it can reflect the possibility of rain and fog. When the relative humidity is too high, it can stifle humans or animals because this prevents the evaporation of sweat, and humans also set out a hot index [15].
Illuminance is the luminous flux received per unit area. The SI unit is lux (lx = lux) or radiation (ph = phot), 1 lux = 1 lumen/square meter, 1 radiance = 1 lumen/cm 2, 1lx = 0.0001 ph. The general illumination of the home is recommended between 300 and 500 lux.
The improved PSO algorithm proposed in this study can effectively avoid the wrong judgment of the system entering a local large value. When the front-end sensing data is sent to the central processing unit through the ZigBee wireless protocol, the system will perform an improved PSO algorithm calculation, and then the system will transmit the most appropriate control signal to the electrical equipment in the home to adjust the indoor environment. Therefore, the proposed system is a very intelligent monitoring and control system and is also a system based on the Internet of Things architecture. Liu et al. [16] proposed related literature on particle swarm optimization in IoT. Zhang et al. [17] emphasized related algorithms for IoT fault detection based on edge computing and blockchain. Lin et al. [18] proposed the secure sharing of IoT environment.
3 System Architecture and Hardware Architecture
This study divides the system architecture into four parts: environment awareness, wireless transmission, analysis, and load control. The first part involves placing three sets of temperature and humidity sensors in the lab and a set of temperature and humidity sensations outside. For each group, the Arduino UNO version, the temperature and humidity sensor, and ZigBee are placed. In the first part, three sets of indoor temperature and humidity sensors return ambient temperature data processed by the Arduino UNO board. The second part involves the ZigBee wireless transmission to the terminal computer Python interface and the use of the expansion theory to analyze the best situation on the screen. The fourth part, after data analysis, indicates that a user is using air conditioners, fans, or windows to achieve comfort and save energy. It determines the comfortability and wastefulness of using energy. Finally, it properly controls the load until it reaches the ideal value of room temperature and retransmits the signal to the load to stop. The complete system architecture diagram is shown in Fig. 2.

Figure 2: System architecture
The environmental monitoring system flow chart, as shown in Fig. 3, was initially sent back to the Arduino UNO board via the sensors we placed. After processing by the development board, the signal was sent by the ZigBee coordinator in broadcast mode. It receives four groups of sensors returned by the module and transmits the data to the computer’s C# interface via wireless transmission. Then, the Extension Theory is used to analyze the current environment data suitable for the load, such as air conditioners, fans, humidifiers, curtains, and lights. The load is maintained until the end before the ideal environment is reached.
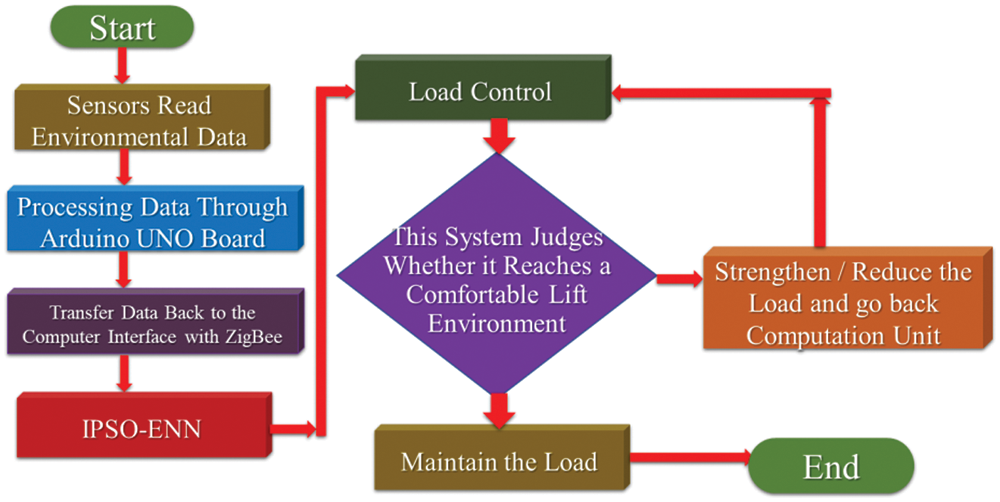
Figure 3: System flow chart
This study uses the Arduino UNO board as a development board, as shown in Fig. 4a. Compared to the previous board, it has more SDA and SCL I2C interface and IOREF (input and output voltage reference), input voltage 7–12 V, and operating voltage 5 V. There are 14 I/O pins, including 6 PWM outputs, also supports TX, RX Feet. Thus, we also connect all sensors with it [19].
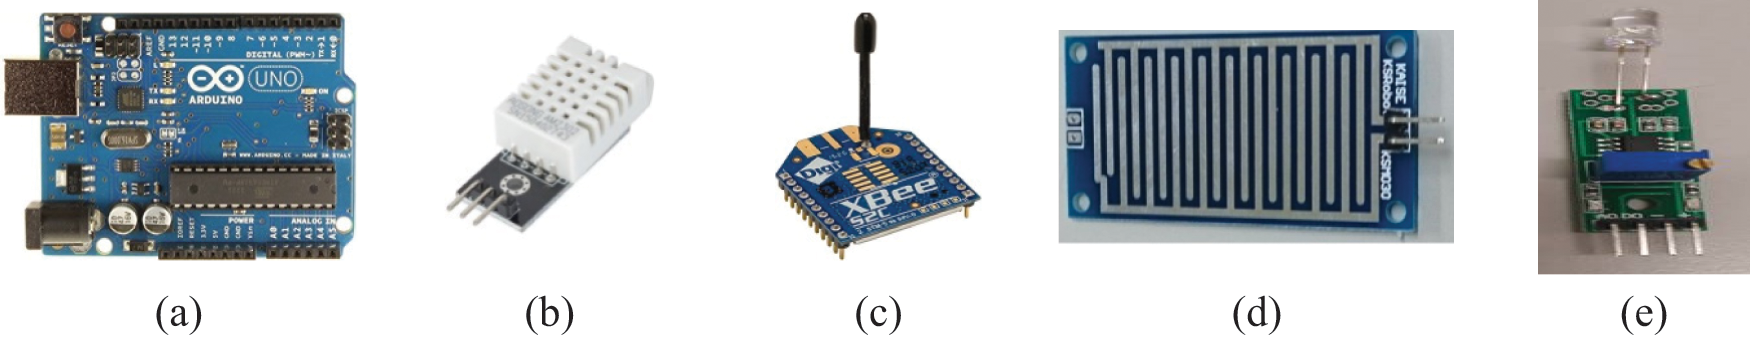
Figure 4: (a) Arduino UNO Development Board (b) DHT22 temperature and humidity sensing module (c) ZigBee module (d) Rain sensor (e) Light sensor
When sensing temperature and humidity in the lab, the sensor module is used as DHT22, as shown in Fig. 4b. The power supply used is DC 3.3∼5.5 V. In temperature measurement, the range can be from −40∼80°C, with an accuracy of ±0.2°C. In humidity measurement, the range is 0%∼10%RH; it is plus or minus 1% RH. Its advantages are extremely low power consumption, small size, fast backhaul, and strong anti-interference ability. The ZigBee module is used as a tool for transmitting environmental signals in this study, as shown in Fig. 4c, to communicate with the computer through the ZigBee Coordinator. This module is often used because of its feature, including low power consumption, low cost, low speed, short distance, short delay, high capacity, and high security [20].
The rain sensor, shown in Fig. 4d, can be used to monitor changes in various weather conditions and convert digital signal outputs. It has anti-oxidation, conductivity, lasting performance, comparator output, good waveform, and strong drive capability. When the 5 V power supply is connected, the power indicator light is on, and when there is no water drop on the sensor board, the digital output is high, and the switch indicator is off. However, when a drop of water is dropped, the digital output is low, and the switch indicator is on. Moreover, the rain sensor can be used to detect if there is rain and rainfall [21].
This investigation employed KSM019 as the illuminance sensor, shown in Fig. 4e, which can detect the analog output of the brightness output or set a certain brightness value to output the digital quantity. Moreover, it has high sensitivity, stable performance, working 5 V voltage, and dual digital-analog output. This sensor uses a directional photodiode that is directional that can sense light in a fixed direction [22].
There are three types of loads that are mainly controlled in this paper: air conditioners, fans, humidifiers, curtains, and lights, as shown in Fig. 5.
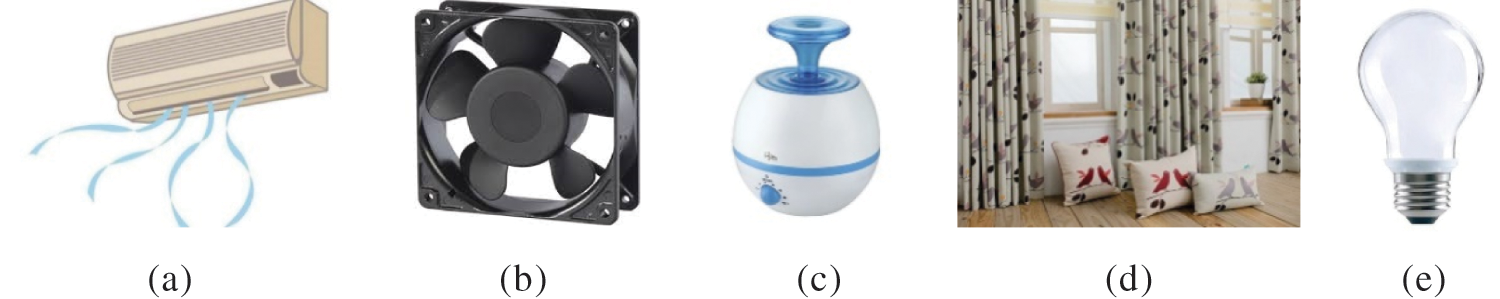
Figure 5: (a) Air Conditioner (b) Fan (c) Humidifier (d) curtain (e) LED light
This study uses Python codes to design the human-machine interface, as shown in Fig. 6. We first set up the temperature- and humidity-sensing device and the illuminance device in three different locations, as shown in Fig. 7. Then, we turned on the power and waited until the three room-temperature values are sent back to the Arduino board. These three groups would be collected. Further, we calculated the average of the data and sent it to the interface. The humidity in the room was the same. We only set a group outdoors, so we went back directly to the interface. It was then stored in Python codes for future big data analysis. The upper left part is the data returned by the temperature- and humidity-sensing device, while the upper right part is the data that determines whether the load is on or off. Meanwhile, the lower right part is the correlation value analyzed by the extended theory when receiving the environmental data. It is the common ground (COM) end of the main controller and the program end button. The middle left warning is a feature of this study because foreign studies have shown that when an indoor or outdoor temperature difference is 7°C, it causes asthma and allergies. Thus, a warning would be displayed; the slogan warns the user. The middle right side is the Thermal Comfort Index (PMV) [23]. Fig. 8 is IoT smart house prototype in this study.
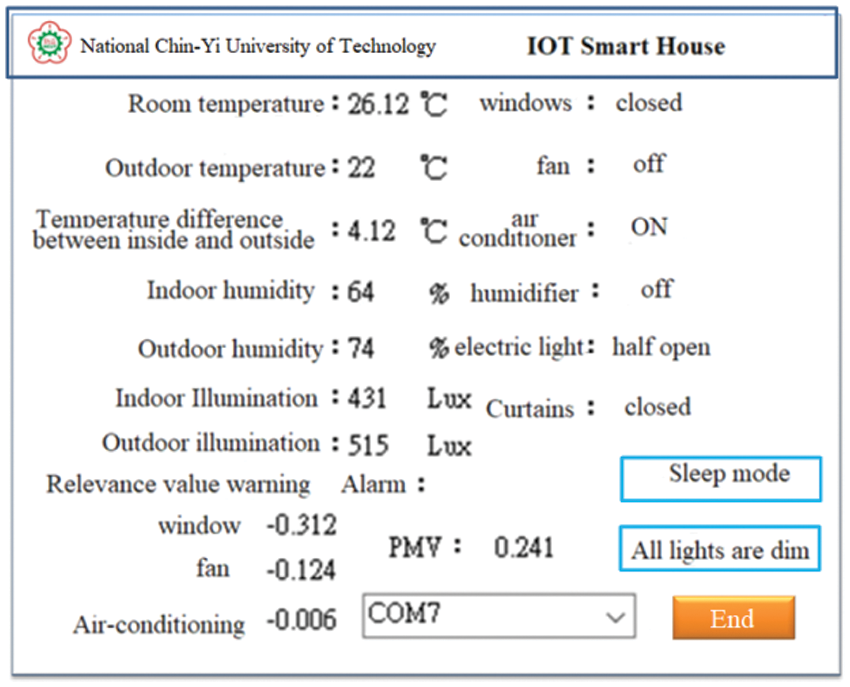
Figure 6: Indoor and outdoor temperature and humidity, illumination monitoring system
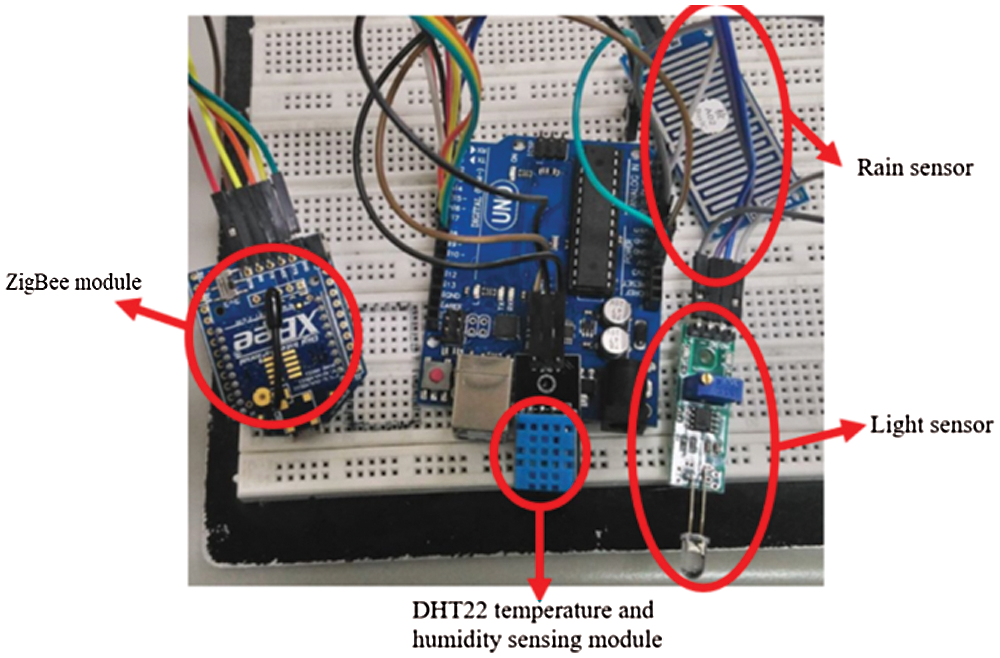
Figure 7: Environmental monitoring equipment

Figure 8: IoT smart house
4.2 IPSO’s Data Fusion Weight Factor Estimation
The fusion algorithm in this paper uses the generalized mean operator defined as:
In (20), p is the ambiguity, wi is the weighting factor on xi, and
By changing the value of p between − ∞ and + ∞, the value between end and start can be obtained. The overall flow of the algorithm is as follows [24,25]:
(1) Initialization: Determine the parameters of the improved PSO algorithm and uniformly design the optimal weight vectors
In (22), desiredk indicates the expected output and
(2) According to formula (23), the improved particle swarm algorithm updates the position yid of each particle. The determined weight of each sensor after fusion is called wid.
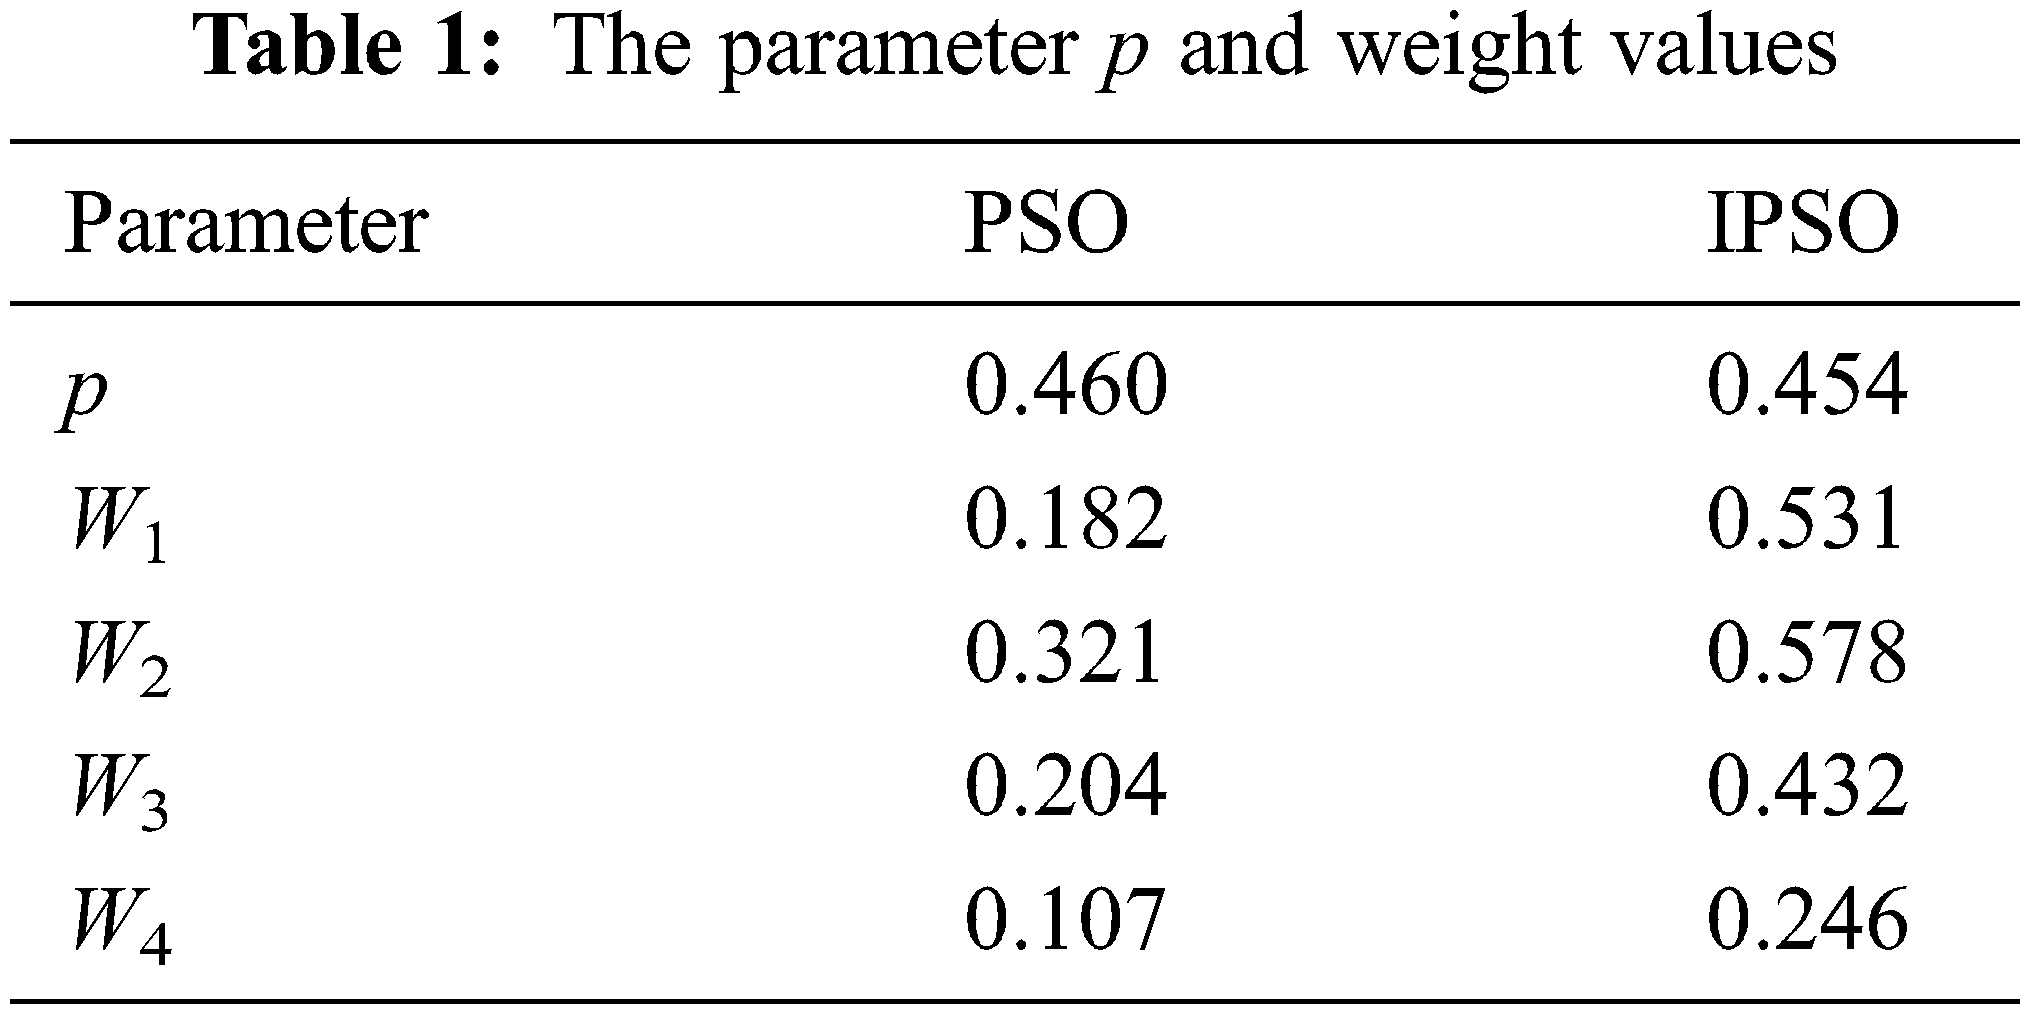
This article selects four sensors, two of which are specified values, and the last two are the first two with 10% to 40% noise. The improved PSO algorithm and the general traditional PSO algorithm are used to input the four sensors and obtain the parameter P and their respective weights, as shown in Tab. 1. The effect of improving PSO optimization is significantly better than that of genetic algorithm (GA), except for a small amount of noise that cannot be eliminated. Nevertheless, most of the noise interference can be eliminated.
4.3 IPSO-ENN Model Effect and Evaluation
In order to verify the effectiveness of the model proposed in the article, we established IPSO-ENN (the method proposed in this research), PSO-ENN (traditional particle swarm optimization and extension neuron method), ENN (traditional extension neuron method), and PSO-ET model (traditional particle swarm the optimization is added to the extension theory method), as shown in Tab. 2. This experiment measured and simulated 1200 data of the calculated fitness, correlation coefficient (R), root mean square error (RMSE), and mean absolute error (NAE) value of the smart house. The result is shown in Fig. 9.
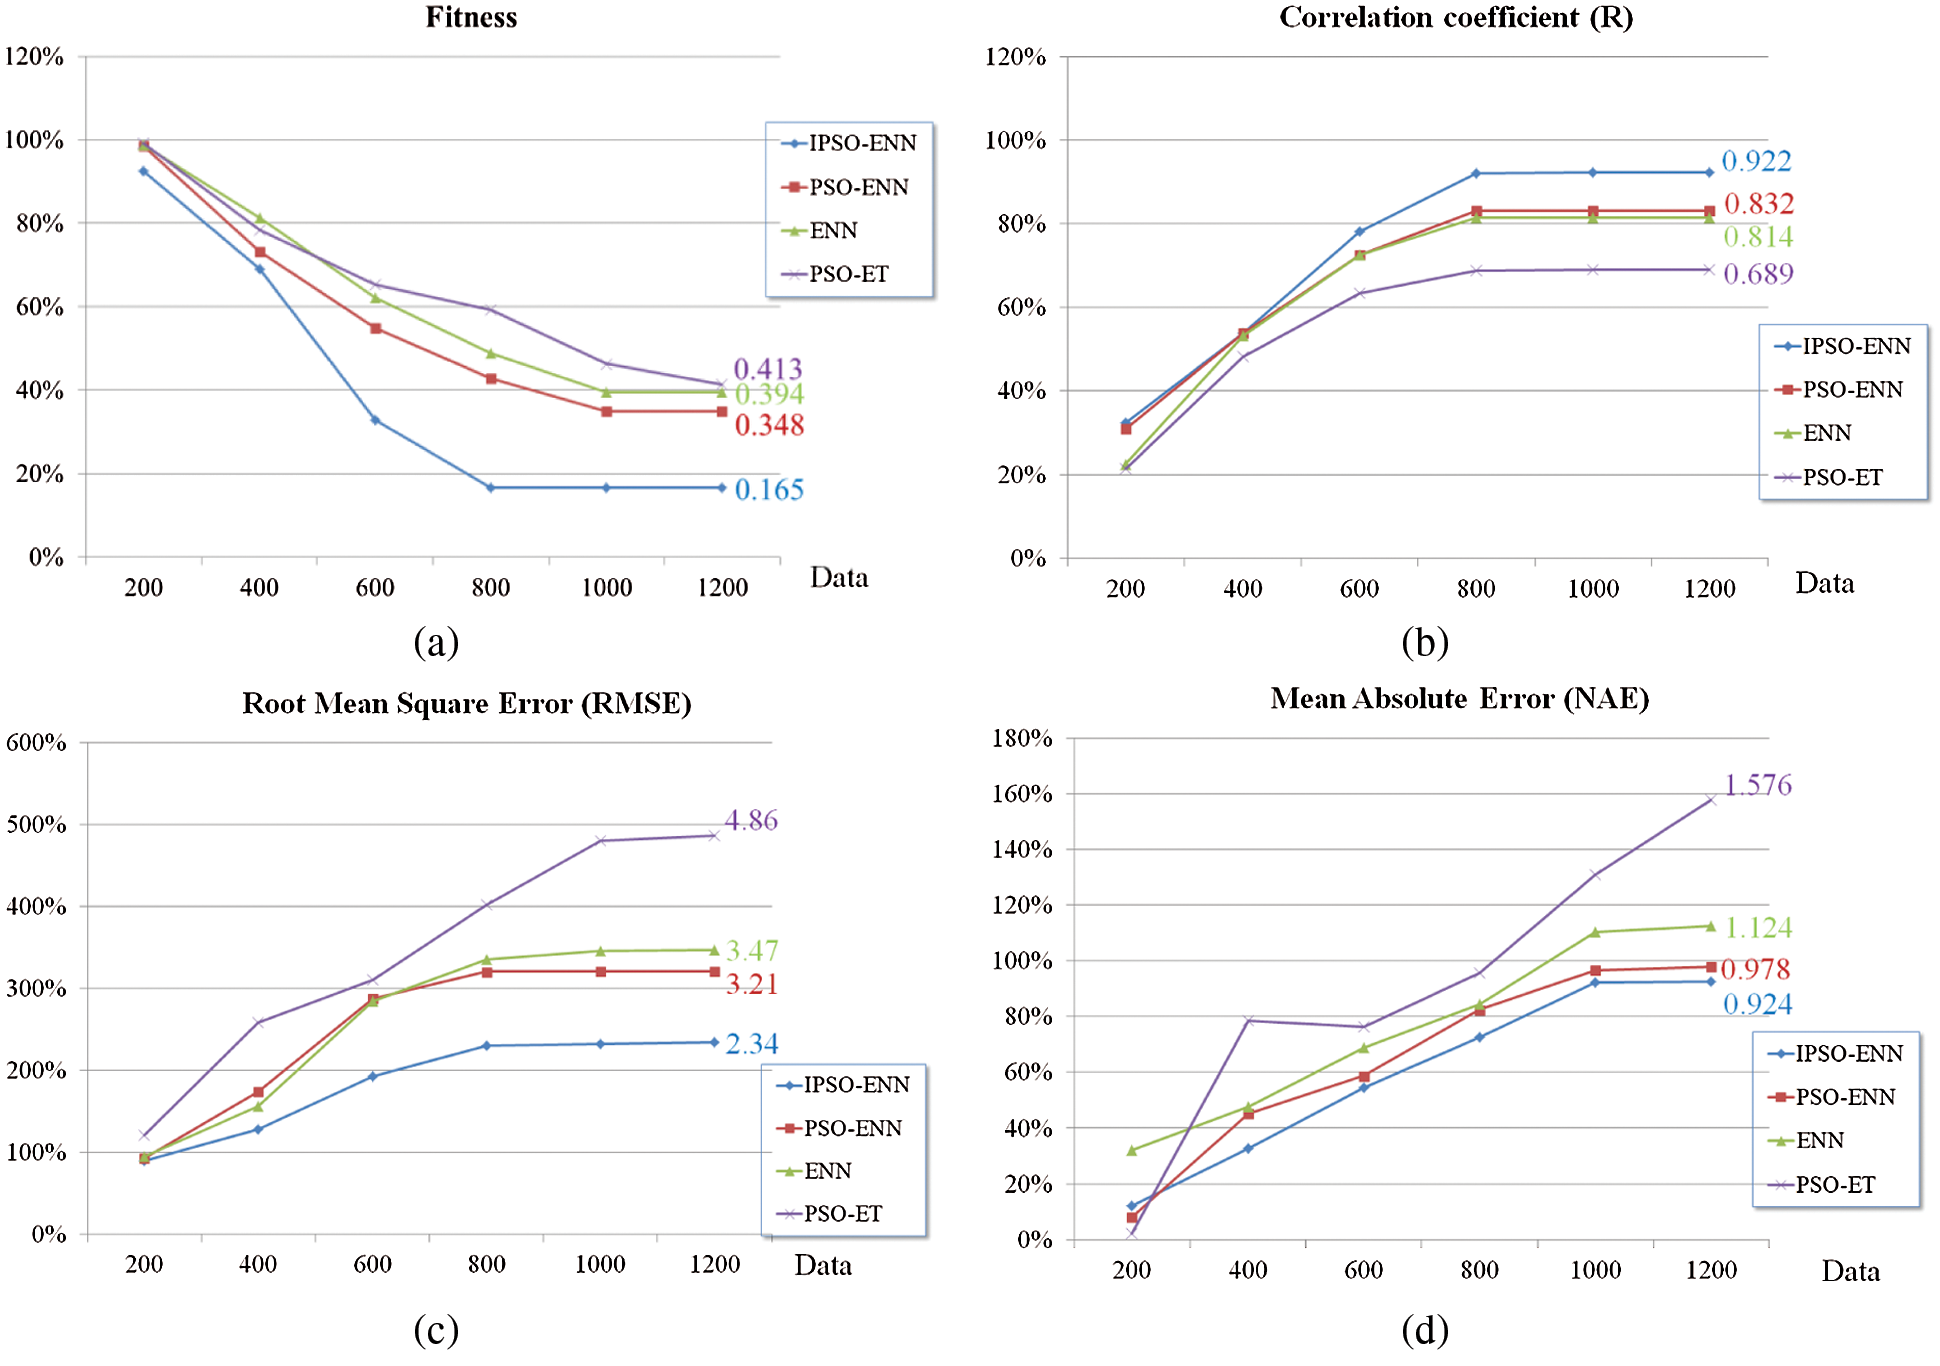
Figure 9: IPSO-ENN model evaluation (a) fitness (b) correlation coefficient (R) (c) root mean square error (RMSE) (d) mean absolute error (NAE)
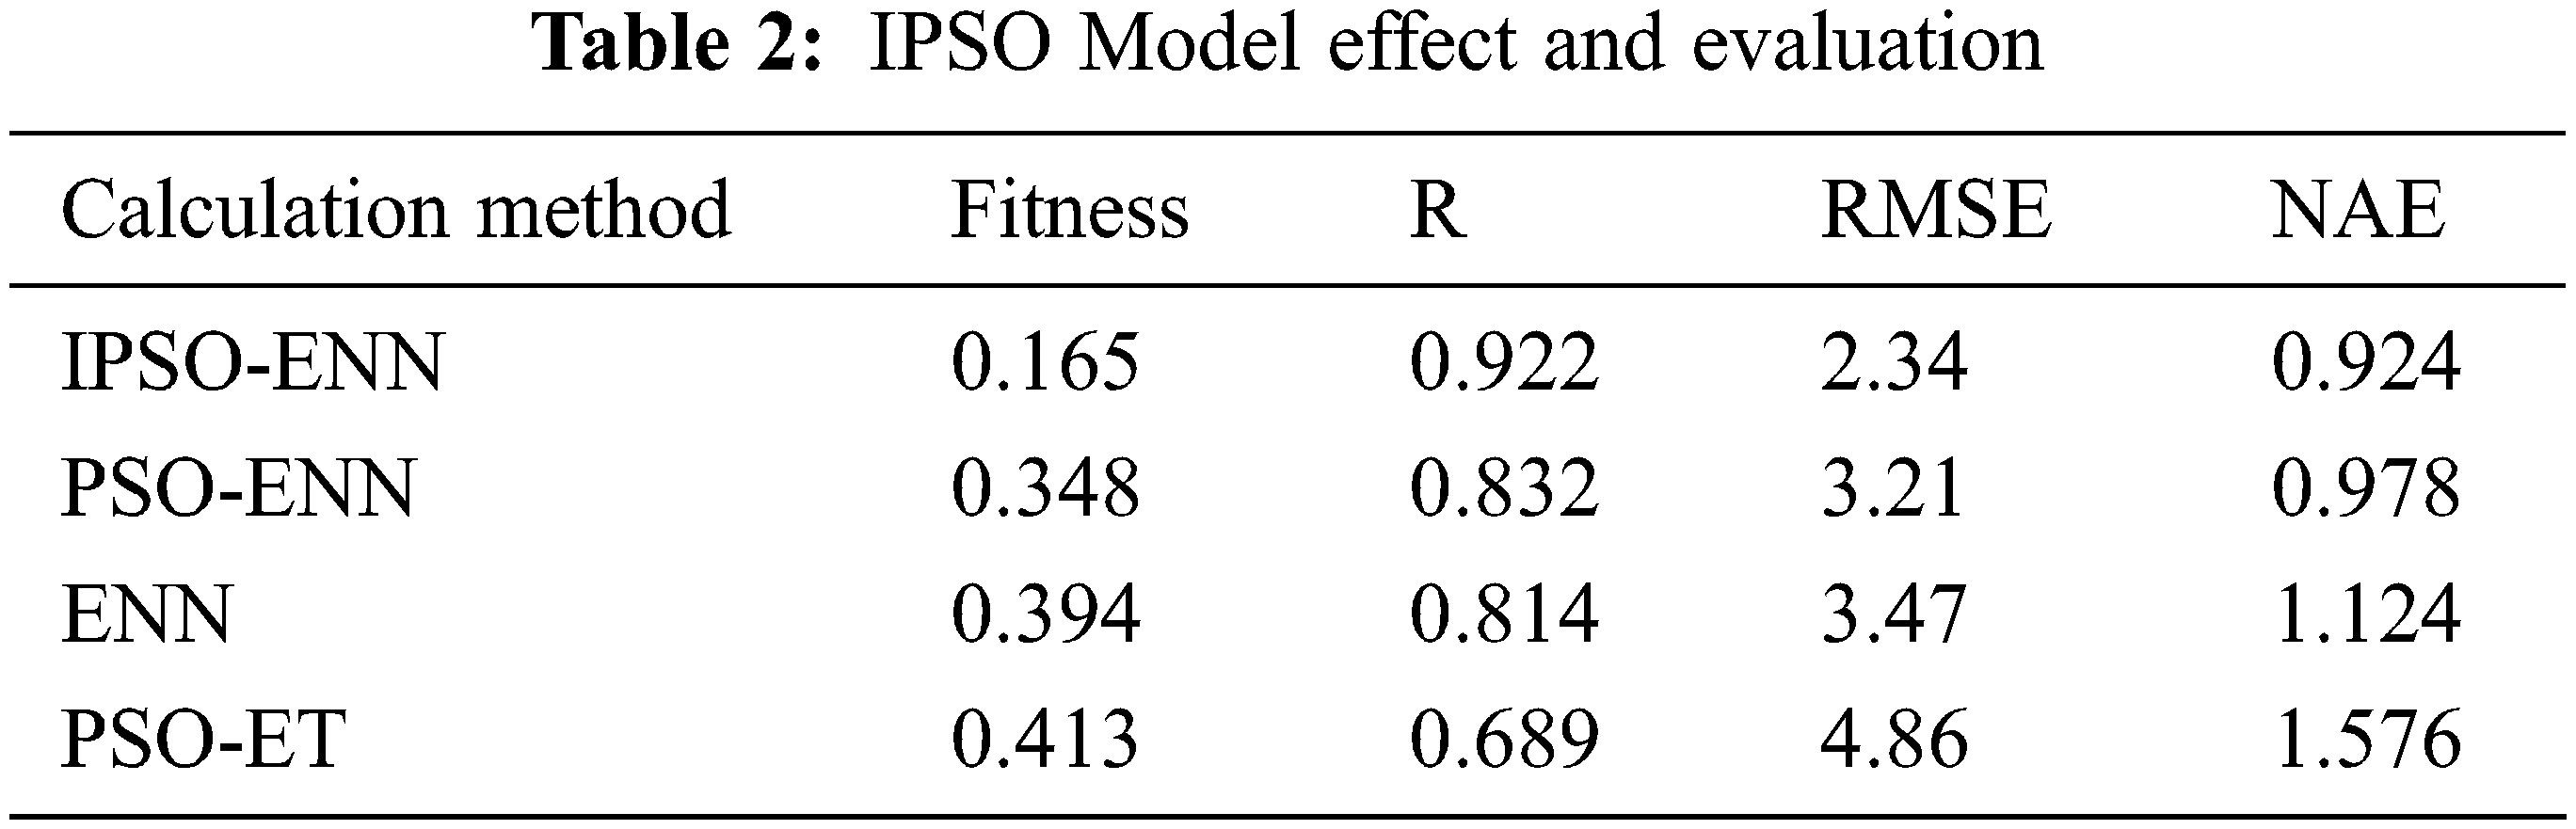
This experiment shows that the larger the R, the smaller the MAE and RMSE, the better the fitting performance of the model, and the smaller its fitness value [26]. It can be seen from Tab. 2 that the MAE and RMSE values of the IPSO-ENN model proposed in this study are smaller than the other three models, while the correlation coefficient R is larger than the other three models. Further, the fitness value is the smallest, which means global convergence is at its fastest. This result shows that the PSO-ENN model has the strongest correlation. Therefore, the performance of the particle swarm extension neural network model proposed in this paper is better than the other three models and can predict the global state of the smart house in the fastest and most effective way. The prediction accuracy is high, and the effect is good. It has certain significance for the optimization of computational scientific research and can also provide references for other predictions [26].
However, the IPSO-ENN is a more successful option in determining the anchor nodes in this kind of simulation. In a large-scale IoT, optimization methods may take longer to execute than the deterministic techniques in simulations due to the use of various parameters for all nodes in the IoT. Thus, the execution times of IPSO-ENN have an important role in long and continuous simulations. If it takes too long, it adversely affects the efficiency of the technique. In our experiments, where the authors measure the elapsed time to run the algorithms, the simulation was performed in a 2000 meter × 3000 meter size network. In addition, it has 350 nodes with communication ranging 30 meters. As shown in Fig. 10, the simulations were performed with 200–2400 s time intervals. According to the results, IPSO-ENN took less time during the simulation. The difference between IPSO-ENN and PSO-ENN is increased as time goes by [27,28].
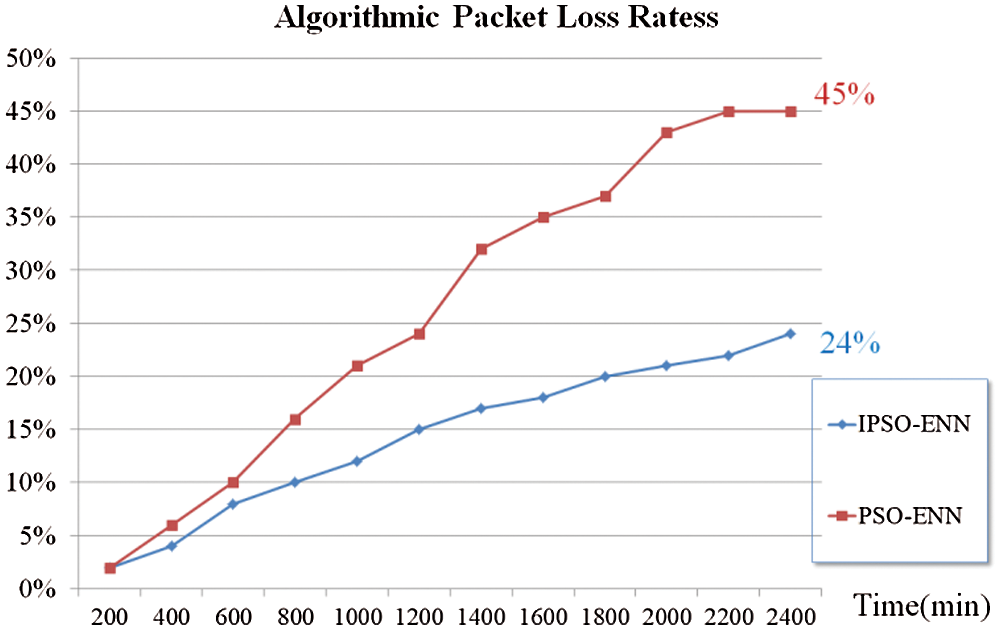
Figure 10: Algorithm execution times of IPSO-ENN and PSO-ENN algorithms in a 2000 m × 3000 m IoT for 2400 s
This paper proposes to replace the original linear decrease strategy with the non-linear decrease strategy of the wi function so that the IPSO-ENN algorithm has different degrees of improvement in the optimization ability and accuracy requirements. Because of its efficient parallelism, it has fast convergence, it is not easy to fall into the feature of local optimization, and it can better solve the problem of multi-parameter optimization. Further, it can be applied to the field of multi-sensor fusion. The results show that using this method to integrate multiple sensors successfully filtered out the noise interference added by 10% to 40%. Compared with the traditional PSO-ENN, the IPSO-ENN proposed in this study reached a higher level. The accuracy of convergence achieved good results.
This research aims mainly to monitor the temperature, humidity, and lighting around life so that people can enjoy a comfortable living environment without consuming too much energy. In the early stage, they may feel the heat and start to heat up. However, they can employ the IPSO-ENN algorithm to find the most comfortable solution in the whole domain. Although the use of certain operating loads, such as turning on the fan, can improve thermal comfort to an ideal state, it will take much time. We used the IPSO-ENN algorithm proposed in this research to allow us to achieve the lowest performance quickly. Consumption that achieves the best comfort is the focus of this research. In addition, under special circumstances, system warning messages will be generated. For example, when our system has internal problems, the system would issue a warning. Timely judgment is also one of the functions provided by the system. For example, the system will issue a warning when the temperature difference between the indoor and outside temperatures exceeds seven degrees celsius. Because the temperature difference between the indoor and outdoor temperatures is too significant at this time, people will have some unsuitable situations requiring special attention. Moreover, as it can easily cause respiratory diseases, such as asthma, this research can also enable people to achieve environmental safety, smart living effects, and save energy. In the future, we can conduct big data analysis and more research through the data stored. In terms of the future work of this research, the follow-up research development and improvement of this research will be carried out by using the combination of cloud computing and blockchain, and the system developed by this research will be more abundant and stable.
Acknowledgement: This research was supported by the Department of Electrical Engineering at National Chin-Yi University of Technology. The authors would like to thank the National Chin-Yi University of Technology, Takming University of Science and Technology, Taiwan, for supporting this research.
Funding Statement: The authors received no specific funding for this study.
Conflicts of Interest: The authors declare that they have no conflicts of interest to report regarding the present study.
1. K. Zhang, Z. Wang, L. Guo, Y. Peng and Z. Zheng, “An asynchronous data fusion algorithm for target detection based on multi-sensor networks,” IEEE Access, vol. 8, pp. 59511–59523, 2020. [Google Scholar]
2. F. Deng, Y. Huang, S. Lu, Y. Chen, J. Chen et al., “A Multi-sensor data fusion system for laser welding process monitoring,” IEEE Access, vol. 8, pp. 147349–147357, 2020. [Google Scholar]
3. Z. Wang, Y. Wu and Q. Niu, “Multi-sensor fusion in automated driving: A survey,” IEEE Access, vol. 8, pp. 2847–2868, 2020. [Google Scholar]
4. T. Dong and T. Huang, “Neural cryptography based on complex-valued neural network,” IEEE Transactions on Neural Networks and Learning Systems, vol. 31, no. 11, pp. 4999–5004, 2020. [Google Scholar]
5. S. Sulun and M. E. P. Davies, “On filter generalization for music bandwidth extension using deep neural networks,” IEEE Journal of Selected Topics in Signal Processing, vol. 15, no. 1, pp. 132–142, 2021. [Google Scholar]
6. M. Mulenga, S. A. Kareem, A. Q. M. Sabri, M. Seera, S. Govind et al., “Feature extension of gut microbiome data for deep neural network-based colorectal cancer classification,” IEEE Access, vol. 9, pp. 23565–23578, 2021. [Google Scholar]
7. E. Dong, H. Jian, S. Du and C. Dong, “Infrared target extraction based on immune extension neural network,” IEEE Access, vol. 8, pp. 47569–47579, 2020. [Google Scholar]
8. J. A. Russer, M. Haider, D. Bajon, S. Wane and P. Russer, “An extension of the transverse wave formulation to model stochastic electromagnetic fields,” in Proc. 2017 IEEE MTT-S Int. Microwave Symposium (IMS), Honololu, HI, USA, pp. 700–703, 2017. [Google Scholar]
9. H. Saito, A. Monden and Z. Yücel, “Extended association rule mining with correlation functions,” in Proc. 2018 IEEE Int. Conf. on Big Data, Cloud Computing, Data Science & Engineering (BCD), Yonago, pp. 79–84, 2018. [Google Scholar]
10. W. Peng, Z. Yang, C. Liu, J. Xiu and Z. Zhang, “An improved PSO algorithm for battery parameters identification optimization based on Thevenin battery model,” in Proc. 2018 5th IEEE Int. Conf. on Cloud Computing and Intelligence Systems (CCIS), Nanjing, China, pp. 295–298, 2018. [Google Scholar]
11. V. Lodhi, D. Chakravarty and P. Mitra, “A study of PSO and its variants for fractional abundance estimation in hyperspectral data,” in Proc. 2018 Fourth Int. Conf. on Research in Computational Intelligence and Communication Networks (ICRCICN), Kolkata, India, pp. 197–201, 2018. [Google Scholar]
12. G. Q. Qiu, W. M. Zhao and G. Y. Xiong, “Estimation of power battery SOC based on PSO-Elman neural network,” in Proc. 2018 Fourth Int. Conf. on Research in Computational Intelligence and Communication Networks (ICRCICN), Xi’an, China, pp. 91–96, 2018. [Google Scholar]
13. F. A. Ruslan, A. M. Samad, Z. M. Zain and R. Adnan, “Prediction of 4 hours ahead flood water level using improved ENN structure: Case study Kuala Lumpur,” in Proc. 2014 IEEE Int. Conf. on Control System, Computing and Engineering (ICCSCE 2014), Penang, Malaysia, pp. 349–354, 2014. [Google Scholar]
14. S. Sakib, M. A. B. Siddique and M. A. Rahman, “Performance evaluation of t-SNE and MDS dimensionality reduction techniques with KNN, ENN and SVM classifiers,” in Proc. 2020 IEEE Region 10 Symposium (TENSYMP), Dhaka, Bangladesh, pp. 5–8, 2020. [Google Scholar]
15. Y. Su, G. Xie, S. Wang, H. Tai, Q. Zhang et al., “Self-powered humidity sensor based on triboelectric nanogenerator,” in Proc. 2017 IEEE Sensors, Glasgow, UK, pp. 1–3, 2017. [Google Scholar]
16. J. Liu, D. Yang, M. Lian and M. Li, “Research on intrusion detection based on particle swarm optimization in IoT,” IEEE Access, vol. 9, pp. 38254–38268, 2021. [Google Scholar]
17. W. Zhang, J. Wang, G. Han, S. Huang, Y. Feng et al., “A data set accuracy weighted random forest algorithm for IoT fault detection based on edge computing and blockchain,” IEEE Internet of Things Journal, vol. 8, no. 4, pp. 2354–2363, 2021. [Google Scholar]
18. J. C. Lin, J. M. Wu, P. Fournier, Y. Djenouri, C. Chen et al., “A sanitization approach to secure shared data in an IoT environment,” IEEE Access, vol. 7, pp. 25359–25368, 2019. [Google Scholar]
19. S. B. Jarad, V. D. Lohar, S. P. Choukate and S. D. Mangate, “Automatic optimization and control of power factor, reactive power and reduction of THD for linear and nonlinear load by using Arduino UNO,” in Proc. 2018 Second Int. Conf. on Inventive Communication and Computational Technologies (ICICCT), Coimbatore, India, pp. 11128–1132, 2018. [Google Scholar]
20. R. Anand, R. K. Pachauri, A. Gupta and Y. K. Chauhan, “Design and analysis of a low cost PV analyzer using Arduino UNO,” in Proc. 2016 IEEE 1st Int. Conf. on Power Electronics, Intelligent Control and Energy Systems (ICPEICES), Delhi, India, pp. 1–4, 2016. [Google Scholar]
21. O. Omoruyi, S. N. John, O. Chinonso, O. Robert, A. A. Adewale et al., “Wireless sensor network for rainfall measurement using a tipping bucket rain gauge mechanism,” in Proc. 2017 Int. Conf. on Computational Science and Computational Intelligence (CSCI), Las Vegas, NV, USA, pp. 740–744, 2017. [Google Scholar]
22. M. Kozlok and P. Žák, “Photodetectors for cylindrical illuminance sensor,” in Proc. 2020 21st Int. Scientific Conf. on Electric Power Engineering (EPE), Prague, Czech Republic, pp. 1–5, 2020. [Google Scholar]
23. A. A. A. Abuelnuor, A. A. M. Mohammedali, A. A. M. Omara, S. A. M. Wedaa, M. O. A. Mohammed et al., “Evaluation of thermal comfort in academic buildings at Khartoum locality: A case study,” in Proc. 2020 Int. Conf. on Computer, Control, Electrical, and Electronics Engineering (ICCCEEE), Khartoum, Sudan, pp. 1–5, 2020. [Google Scholar]
24. Y. Li, W. Dai and W. Zhang, “Bearing fault feature selection method based on weighted multidimensional feature fusion,” IEEE Access, vol. 8, pp. 19008–19025, 2020. [Google Scholar]
25. S. Zhao, L. Xu, J. Zhang, S. Zhang, X. Chen et al., “Combine assembly quality detection based on multi-entropy data fusion and optimized LSSVM,” IEEE Access, vol. 9, pp. 63188–63198, 2021. [Google Scholar]
26. G. H. H. Sudhan, R. G. Aravind and K. P. Thanaraj, “Multispectral analysis of satellite images using heuristic algorithm,” in Proc. 2018 Int. Conf. on Communication and Signal Processing (ICCSP), Chennai, India, pp. 1–4, 2018. [Google Scholar]
27. N. Zhang, J. Xiong, J. Zhong and L. Thompson, “Feature selection method using BPSO-EA with ENN classifier,” in Proc. 2018 Eighth Int. Conf. on Information Science and Technology (ICIST), Cordoba, Granada, and Seville, Spain, pp. 364–369, 2018. [Google Scholar]
28. C. Shen, L. Cheng, Q. Liu, Y. Chen and H. Wu, “Spatial-temporal evolution prediction of gas distribution based on PSO-Elman neural network,” in Proc. 2020 39th Chinese Control Conf. (CCC), Shenyang, China, pp. 7582–7588, 2020. [Google Scholar]
 | This work is licensed under a Creative Commons Attribution 4.0 International License, which permits unrestricted use, distribution, and reproduction in any medium, provided the original work is properly cited. |