DOI:10.32604/iasc.2023.027568
| Intelligent Automation & Soft Computing DOI:10.32604/iasc.2023.027568 | |
| Article |
An Optimized Algorithm for Renewable Energy Forecasting Based on Machine Learning
1College of Engineering at Wadi Addawaser, Prince Sattam bin Abdulaziz University, Wadi Aldawaser, 11991, Saudi Arabia
2Electrical Engineering Department, Aswan Faculty of Engineering, Aswan University, Aswan, 81542, Egypt
3Production Engineering and Mechanical Design Department, Faculty of Engineering, Mansoura University, Mansoura, 35516, Egypt
4Department of Computer, College of Science and Arts in Ar Rass, Qassim University, Ar Rass, Saudi Arabia
5Department of Electrical Engineering, University of Engineering and Technology, Peshawar, 814, Pakistan
*Corresponding Author: Ziad M. Ali. Email: dr.ziad.elhalwany@aswu.edu.eg
Received: 20 January 2022; Accepted: 25 February 2022
Abstract: The large-scale application of renewable energy power generation technology brings new challenges to the operation of traditional power grids and energy management on the load side. Microgrid can effectively solve this problem by using its regulation and flexibility, and is considered to be an ideal platform. The traditional method of computing total transfer capability is difficult due to the central integration of wind farms. As a result, the differential evolution extreme learning machine is offered as a data mining approach for extracting operating rules for the total transfer capability of tie-lines in wind-integrated power systems. K-medoids clustering under the two-dimensional “wind power-load consumption” feature space is used to define representative operational scenarios initially. Then, using stochastic sampling and repetitive power flow, a knowledge base for total transfer capability operating rule mining is created. Then, a novel method is used to filter redundant characteristics and find features that are closely associated to the total transfer capability in order to decrease the ultra-high dimensionality of operational features. Finally, by feeding the training data into the proposed algorithm, the total transfer capability operation rules are derived from the knowledge base. It can be seen that, the proposed algorithm can optimize the system performance with good accuracy and generality, according to numerical data.
Keywords: Load forecasting; distribution network; machine learning; renewable energy
In the real-time operation of the power grid, dispatchers often rely on a series of safe and stable operation rules to judge and maintain the security of the power system. The limit transmission power or total transmission capacity of the key transmission section of the interconnected power grid is one of the important operation indicators. For a long time, various safe and stable operation rules, including the total transmission capacity (TTC) of the transmission section, are often calculated and formulated in the offline phase under typical operating conditions. However, after large-scale intermittent clean energy is connected to the grid, the grid operation mode is random and uncertain [1,2]. In order to ensure the stability of the power grid, it can only be operated with conservative operating rules, which will easily lead to abandonment of light and wind, and reduce the operating efficiency of the power grid.
In recent years, the development and wide application of big data and artificial intelligence technologies have provided new technical means for fine modeling of operating rules and even smart grid dispatching. Reference [3] was the first to propose the concept of fine operation rules of power system, and comprehensively used sensitivity analysis technology and data mining technology to establish fine rules of transmission section total transmission capacity. On the basis of [3], the authors in [4] further constructs a distributed security feature selection method, which provides technical support for online training and learning of fine rules. Reference [5] considered the influence of intermittent wind power on the TTC of the transmission section, and used the scene clustering method to extract representative scenes. For the representative scenes, TTC rules were mined and a knowledge base was formed, which was better adapted to real-time monitoring of the safety of wind power transmission channels. Reference [6] uses the correlation classification method to extract the power grid stable operation rules. Since the proposed method introduces the time factor, the obtained rules can not only reveal the information of the strongly correlated influencing factors of the stable operation of the power grid, but also extract the influence factor changes on the system state change the internal relationship, thus providing support for scheduling operation decisions. In [7], a method for extracting fine operating rules based on artificial neural network (ANN) is proposed. Compared with linear models, the operating rules based on ANN are improved in prediction accuracy. Compared with traditional rules, the fine-grained rule-learning modeling method based on big data and artificial intelligence technology can consider more refined power grid security feature states, has stronger adaptability to real-time operating conditions, and has stronger nonlinear extraction ability [8,9].
Based on the idea of big data-driven power system rule extraction and operation decision-making, this paper proposes a method for extracting limit transmission power operation rules of wind power system transmission section based on differential evolution extreme learning machine. Considering the uncertainty of wind power output and the time series fluctuation characteristics of load, the grid operating conditions are represented by the two-dimensional feature of “wind power-load”, and the extraction of typical operating conditions is realized based on the K-medoids clustering method. On the basis of each typical operating condition, a random operating condition set is generated by random sampling, and the repeated power flow method with embedded transient stability check is used to search and obtain the limit transmission power of key transmission sections under random operating conditions, and record random operating conditions and their corresponding critical transmission section limit transmission power constitute a big data knowledge base. Aiming at the high-dimensional operation feature attribute set of complex interconnected power grids, the feature dimensionality reduction is realized based on the RELIEF-F algorithm, and the differential evolution extreme learning machine is further used to learn and extract the association prediction rules of the transmission section limit transmission power in the dimensionality reduction feature space. In the real-time operation stage, through the two-stage working condition matching and rule prediction, the fast and accurate estimation of the limit transmission power of the transmission section can be realized, so as to provide a basis for the monitoring and control of power grid stability. The effectiveness of the proposed method is verified in the simulation of a New England 39-node system with wind power.
2 Clustering of Time Series Running Scenarios
The limit transmission power total transmission capacity refers to the maximum transmission capacity of the transmission section subject to the stability constraints of various power grids, and it is time-varying with changes in the operating conditions of the power grid. The randomness and volatility of wind power output make the operating conditions of the power grid change rapidly, and the total transmission capacity setting calculated based on typical operating conditions has the risk of failure, which may lead to misjudgment of stability. If the full operating condition set considering the influence of various uncertain factors is adopted, it will greatly increase the difficulty of fitting the operating rules [10].
Scene clustering is an important means to reduce the scene dimension and extract typical operating conditions. It is used in intermittent clean energy grid-connected spinning reserve demand assessment [11], reactive power optimization assessment [12], wind farm site selection planning [13] and other issues successfully applied. In order to effectively extract representative typical operating conditions, the “wind power-load” two-dimensional feature is used to characterize any operating condition, and the historical record of “wind power-load demand” data is used to form a complete set of scenarios, based on the K-medoids clustering method. [14] implements scene clustering and representative typical scene extraction. After obtaining the representative typical scene set, the big data knowledge base construction and operation rule extraction can be carried out for each representative scene, so as to adapt to the real-time operation scene where the total transmission capacity operation rules of the transmission section change with the change of “wind power-load”.
3 Big Data Knowledge Base Construction
3.1 Repeated Power Flow Calculation
In order to extract the operation rules of the transmission section limit transmission power total transmission capacity, in the knowledge base construction stage, the calculation of the limit transmission power of the specified transmission section needs to be carried out for random working conditions. The total transmission capacity calculation methods include continuous power flow method [15,16] and optimal power flow method [17,18]. In actual operation, important transmission sections are often constrained by transient stability. The continuous power flow method generally adopts a quasi-steady-state model, so the transient stability constraints of the section cannot be considered. For the optimal power flow method, the introduction of temporary stability constraints makes it difficult to solve the model, and how to improve the solution speed and robustness of the algorithm remains to be studied. Therefore, a repeated power flow binary search method for the transmission power growth of the transmission section is proposed. The algorithm flow is as follows.
(1) Given the initial operating conditions of the power grid, initialize the binary search interval [λs, λu] of the load growth factor.
(2) Take the median value of the interval λL = (λs + λu)/2, substitute λL into Eq. (1) to update the load demand at the receiving end, and at the same time adjust the output of the generator at the sending end according to Eq. (2) as follows:
In the formula, kLi is the growth rate factor of the receiving end grid load i; ΔPL is the total load increment of the receiving end grid;
(3) Calculate the power flow of the power grid after the synchronous increase of load and power generation, consider the set of fault scenarios where a three-phase short circuit occurs in any transmission line of the section, and conduct time-domain simulations one by one. In this paper, the generator model shown in Eq. (4) is used, and the transient stability check is carried out based on Eq. (5).
In the formula, Δδmax represents the maximum unit power angle difference at any simulation time step. If the transient stability index S is less than 0, the grid is judged to be unstable after the fault. Conversely, the grid can remain stable after a fault.
(4) If the current operating condition of the power grid satisfies the transient stability constraint of the section fault set, update the binary search interval, let λs = λL; otherwise, let λu = λL.
(5) If the interval gap satisfies the calculation accuracy (λu − λs < Δλth), the critical load growth factor λcr = (λs + λu)/2 is obtained, and the power flow under the critical operating condition is calculated. At this time, the total transmission power of the section is the initial total transmission capacity for operating conditions.
3.2 Big Data Knowledge Base Construction
A set of typical operating conditions can be obtained through the clustering of time series scenarios in Section 1 of this paper. Considering the uncertainty of wind power output, synchronous machine output, and load demand respectively, random sampling is used to generate random operating conditions for each typical operating condition:
(1) For any typical operating condition, calculate the maximum offset radius
(2) Based on the repeated power flow method proposed in Section 3.1, calculate the ultimate transmission power of the transmission section under typical and random conditions.
(3) Mark the k-th operating characteristic parameter of the i-th random working condition with
In order to find the features with implicit relationship to total transmission capacity as completely as possible, this paper retains all the data that can be collected by supervisory control and data acquisition (SCADA). The sample data set must contain a large number of redundant features and noise data, which will lead to a large computational burden for subsequent extraction of fine rules. The accuracy of the rules decreases, so it is necessary to perform feature screening on the original sample set.
RELIEF-F is a filtering feature selection algorithm that does not need to rely on subsequent learners. It is suitable for preprocessing of sample sets containing redundant features and noisy data. Its core idea is to evaluate the ability of features to distinguish adjacent samples, using the evaluation value to quantify the correlation between the feature and the target, the larger the evaluation value, the greater the contribution of the feature to the predicted target, and the feature is retained.
In the regression problem, the target value is a set of continuous values, and the traditional RELIEF-F algorithm is not suitable [19]. Reference [20] proposed an improved method of RELIEF-F applied to regression problems and aiming at the problem that the traditional RELIEF-F algorithm cannot obtain the sample category information in the regression problem, the improved RELIEF-F algorithm uses the distance between the predicted values of the samples to construct a probability model. Since it is difficult to solve the probability model directly, consider using the following algorithm for estimation, and then obtain the evaluation value of each feature. The specifics steps are shown in Algorithm 1.

The NdP, NdF(F), NdPdF(F) correspond to the approximate values of
In the formula, rank(Ri, Ij) is the position sequence sorted according to the distance between the nearest neighbor Ij and the selected sample Ri; σ is the self-defined parameter m. In this paper, σ = 50.
5 Differential Evolution Extreme Learning Machine
The extraction of fine rules for transmission sections requires the learner to be able to construct models quickly and accurately, and the fine rules extracted by the learner must ensure strong generalization ability. As a new single-layer feed-forward neural network (SLFNN) learning algorithm is proposed and extreme learning machine has the advantages of fast training speed, simple generation network structure, and strong generalization ability, and has been widely used in power systems.
The extreme learning machine randomly generates the weight and threshold matrix between the input layer and the hidden layer, approximates the sample with zero error, and directly solves the problem by least squares on the weight of the hidden layer and the output layer. Compared with the error back-propagation (BP) algorithm, extreme learning machine directly obtains the feedforward network structure through analytical solution, which is not easy to fall into local optimum and has strong generalization ability. The specific execution steps of extreme learning machine can be found in [21], which can be briefly described in Fig. 1.

Figure 1: Working principle of extreme learning machine
5.2 Differential Evolution Extreme Learning Machine
When extreme learning machine is used to extract fine rules of transmission section, due to the disturbance of random factors in the power system, the accuracy of actual prediction may be reduced. Therefore, in order to enhance the generalization ability of extreme learning machine under the influence of uncertain factors, this paper uses intelligent The optimization algorithm is combined with extreme learning machine.
Compared with other evolutionary algorithms, the differential evolution algorithm has the advantages of simple execution, fast convergence speed and good global search performance [22], and is especially suitable for neural network optimization. The specific implementation steps of differential evolution (DE) can be found in [23]. This article focuses on the specific steps of applying differential evolution to extreme learning machine:
1) Real-number coding is performed on the weight matrix ω and the threshold vector b from the SLFNN input layer to the hidden layer, and the population is randomly initialized.
2) Perform 5-fold cross-validation on the input samples, use each individual in the population to construct SLFNN for ELM training, input the validation set into SLFNN to obtain the predicted output
In the formula, pop represents the current individual number, and Epop(⋅) represents the extreme learning machine constructed by the current individual;
3) Perform differential evolution selection, crossover, and mutation operations.
4) Obtain the offspring, calculate the individual fitness of the offspring, and select the optimal individual.
5) Whether the maximum evolutionary algebra is reached, if yes, output the current optimal extreme learning machine, otherwise return to step 3) until the maximum evolutionary algebra.
6 Experimental Results and Analysis
The calculation example adopts an improved 3-zone New England 39-node system, which is centrally connected to the wind farm at busbar 17, with an installed capacity of 600 MW (See Fig. 2). In this paper, the time domain simulation is performed based on MATLAB-PSAT software, and the wind turbine adopts the classic wind double-fed induction generator (DFIG) model provided by PSAT.

Figure 2: System configuration
In addition, the squared correlation coefficient (SCC) and the mean squared error (MSE) indicators are used to measure the precision of the section fine rules extracted by the proposed method.
For the standard example system, due to the lack of historical data, it is not possible to directly use the historical “wind power-load” time series data for scene clustering. In order to verify the method proposed in this paper, the time series model of reference [24] is used to generate the “wind power-load” time series data. After obtaining the “wind power-load” scene data through time series simulation, the scene clustering and representative typical scene extraction based on the K-medoids method are carried out, and five types of representative scene centers are obtained as shown in Tab. 1.

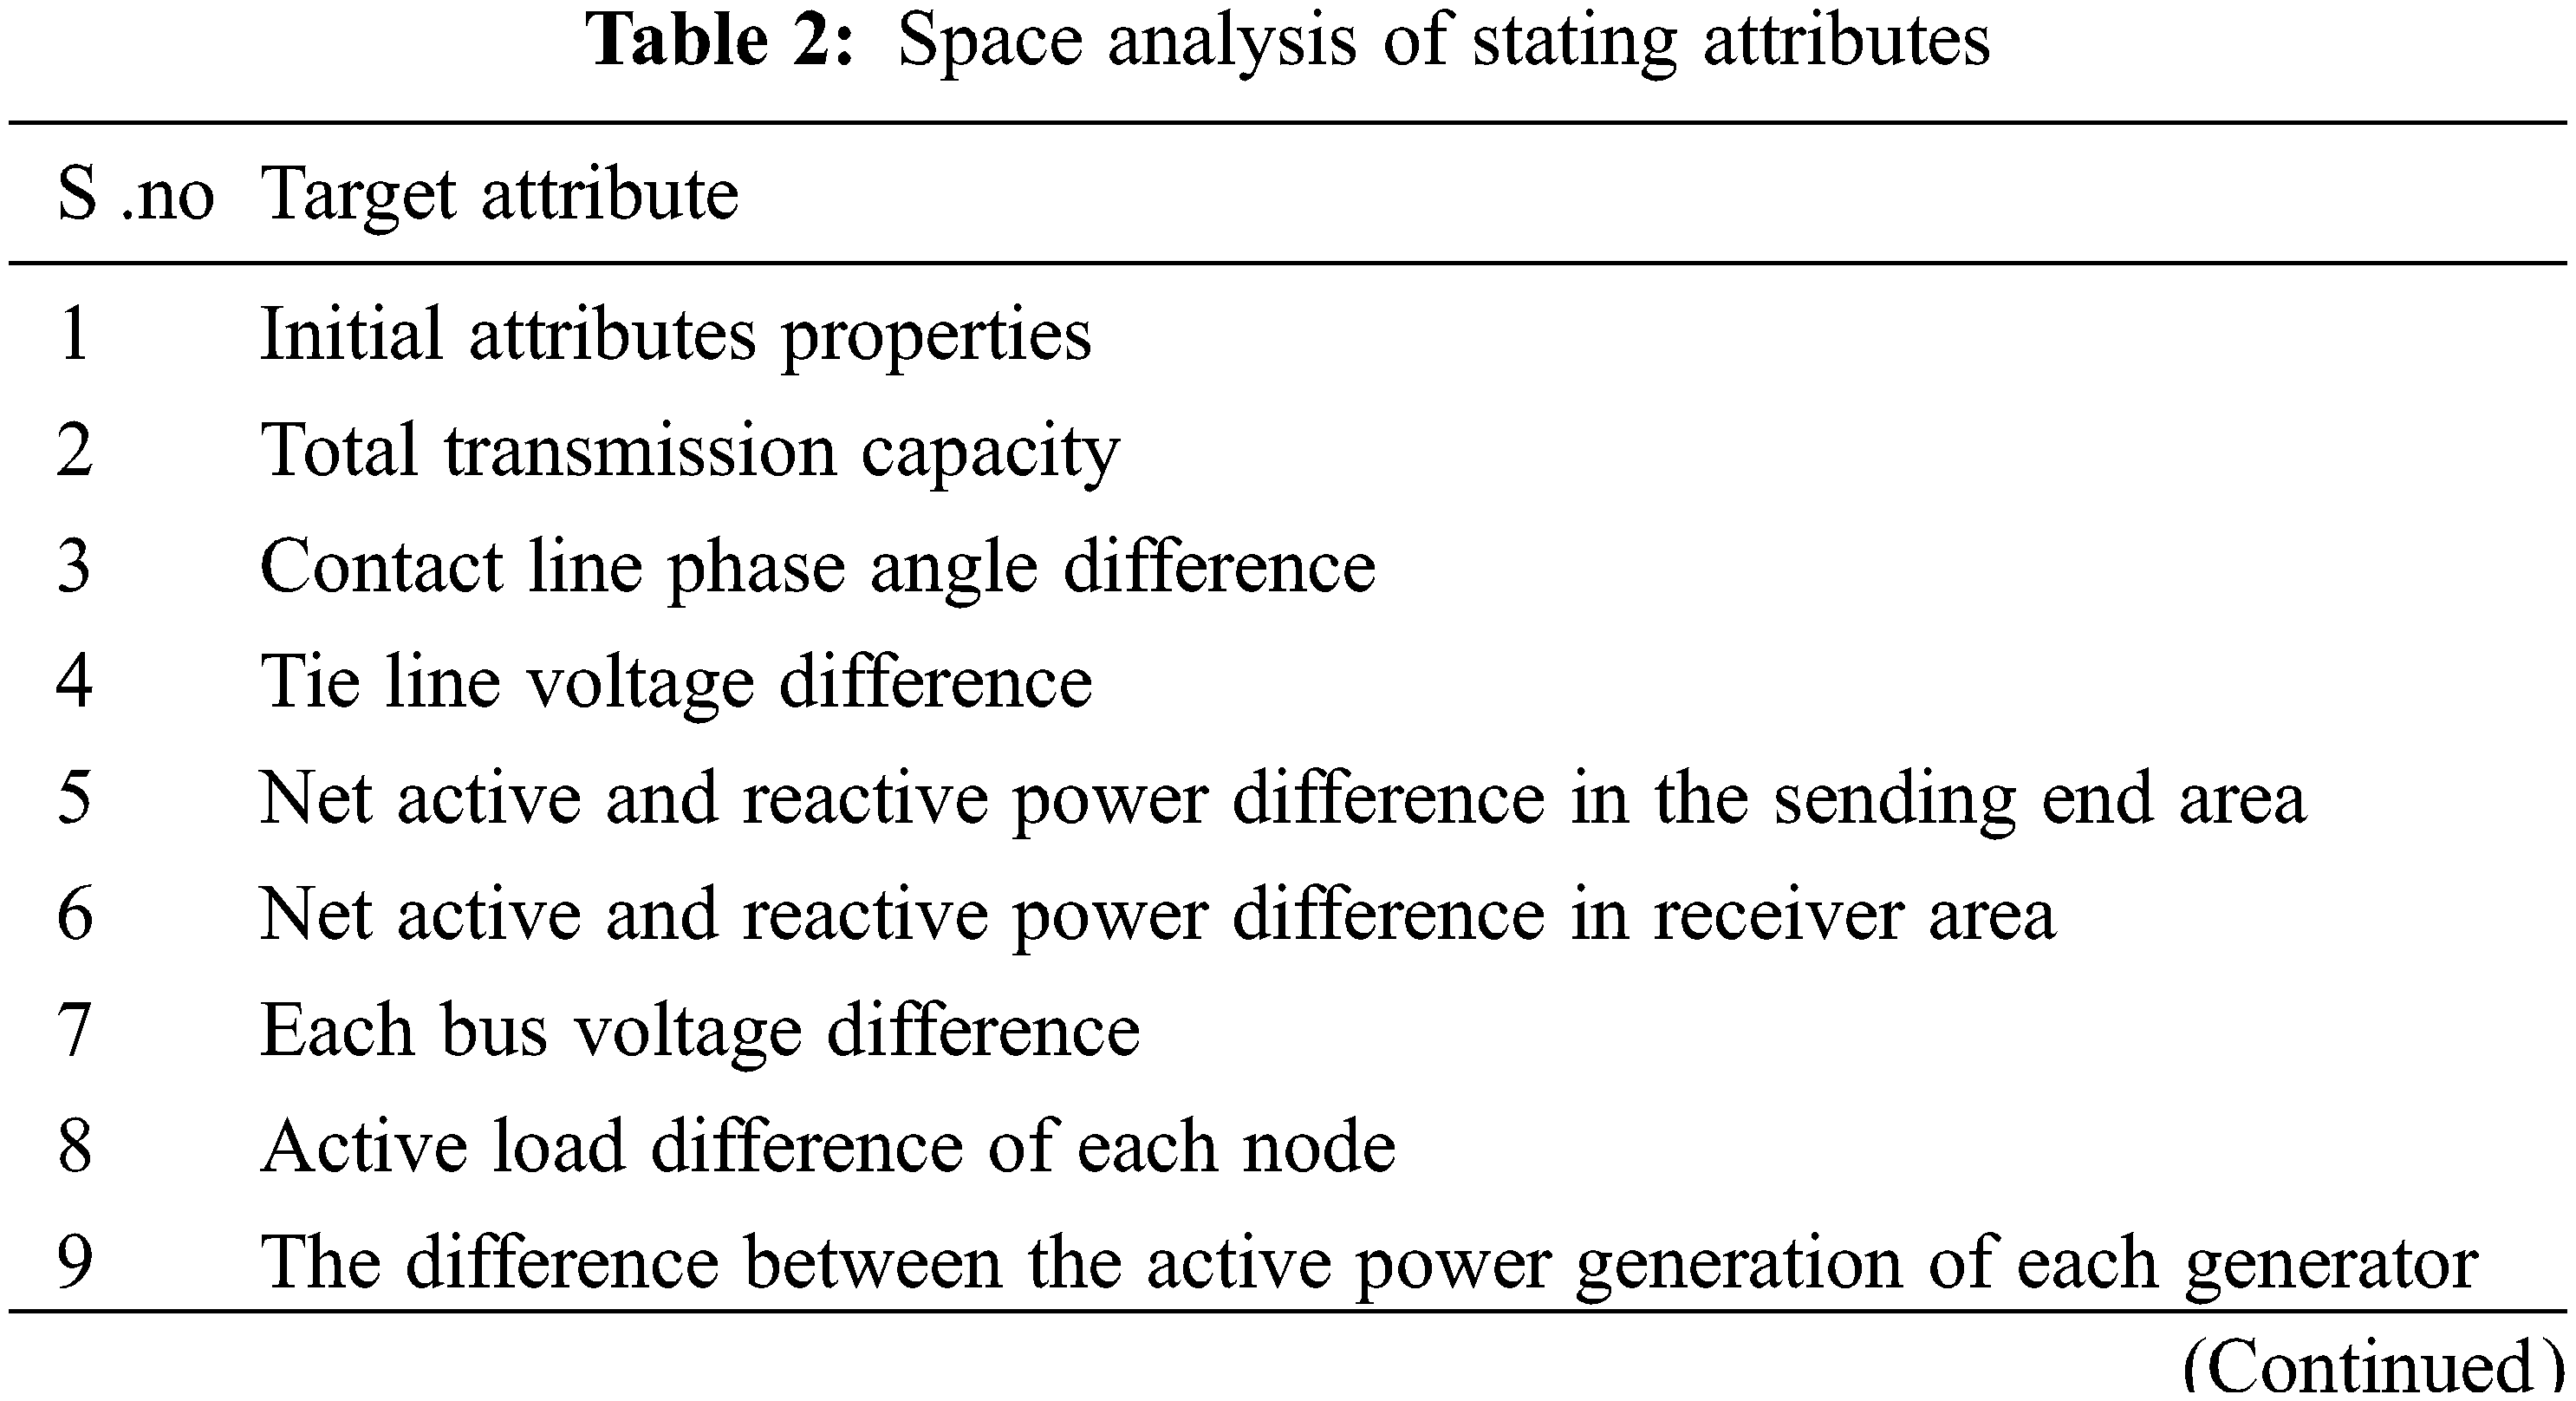
The starting feature space is shown in Tab. 2. Using the proposed algorithm to perform feature selection on the training samples in scene cluster 3, the evaluation value of the prediction correlation of each feature with respect to the target value can be obtained as shown in Fig. 3.

Figure 3: Corresponding values of attributes
In order to verify the effectiveness of feature selection, this paper selects the best top 5 and top 10 features and the worst top 5 and top 10 features as input to proposed method, and obtains Tab. 3.

It is obvious from Tab. 3 that the fine rule accuracy obtained by selecting the best features into the final input set is significantly better than that obtained by selecting the worst features into the final input set. Moreover, as the number of features selected in the input set increases, the accuracy of the extracted fine rules also increases, and the training time also increases relatively. Therefore, it is necessary to select the features that can ensure the accuracy of the fine rules of the transmission section without costing Features for a lot of training time.
6.3 Section Fine Rule Extraction
According to the results in Section 6.2, this paper selects the top 40 features with the highest feature evaluation value as the training data for the final input to the learner, and the final selected feature space is shown in Tab. 4.

The section fine rule of scene 3 is established by proposed method, and the fine rule will be used to predict the test set total transmission capacity. The result is that the MSE is 0.054, and the SCC is 0.9859. The error distribution between the predicted value and the actual value is shown in Fig. 4.

Figure 4: Histogram of error prediction
Similarly, for other clustering scenarios, the algorithm proposed in this paper can also accurately extract the fine rules of the section. Based on the number of samples in scene 3, the number of samples of other scene clusters is obtained by scaling according to the coverage size of the clustering scene, and 200 test samples are also selected to test the performance of fine rules. The rule prediction performance of all scene clusters is shown in Tab. 5, and the error distribution is shown in Fig. 5.

Figure 5: All clusters evaluation of the proposed algorithm
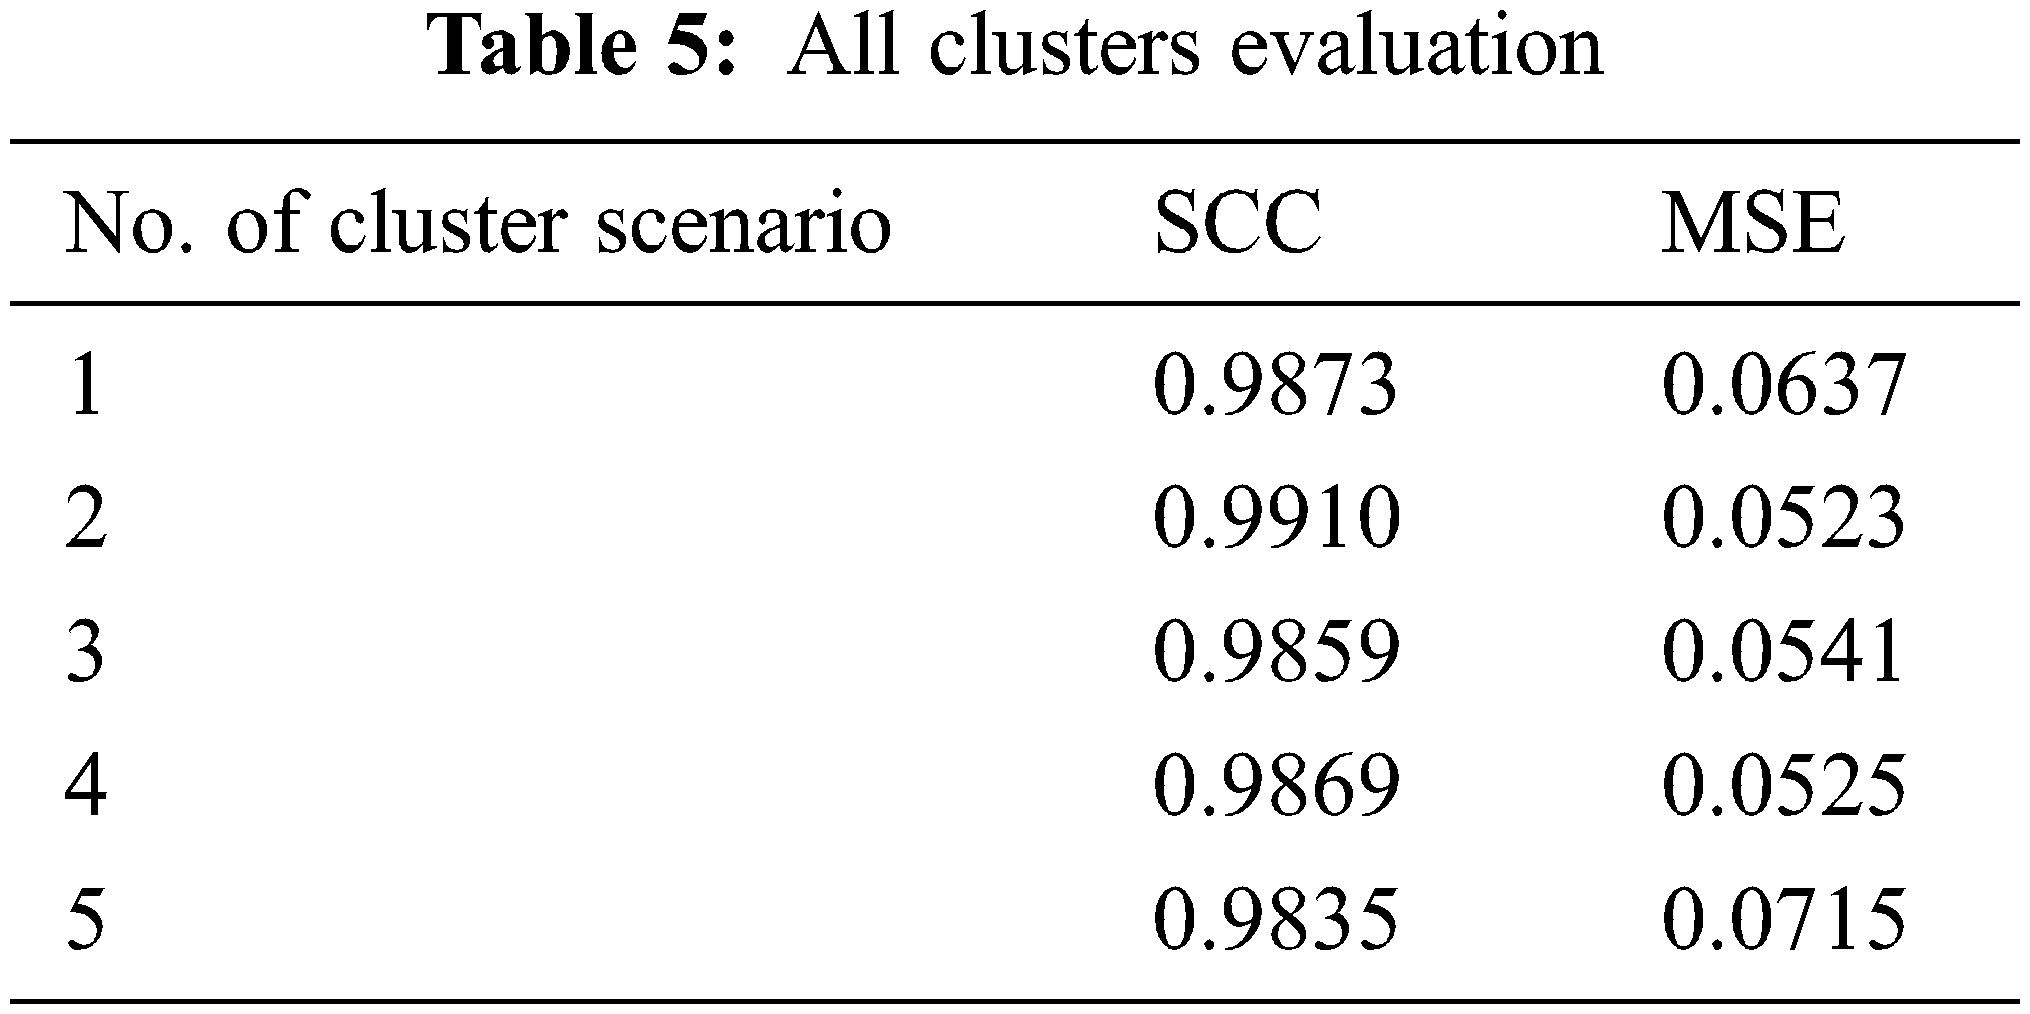
It can be seen that the method proposed in this paper can adapt to the extraction of fine rules for transmission sections in different scenarios. The fine rules constructed by proposed algorithm have strong generalization ability and can quickly and accurately predict the section total transmission capacity.
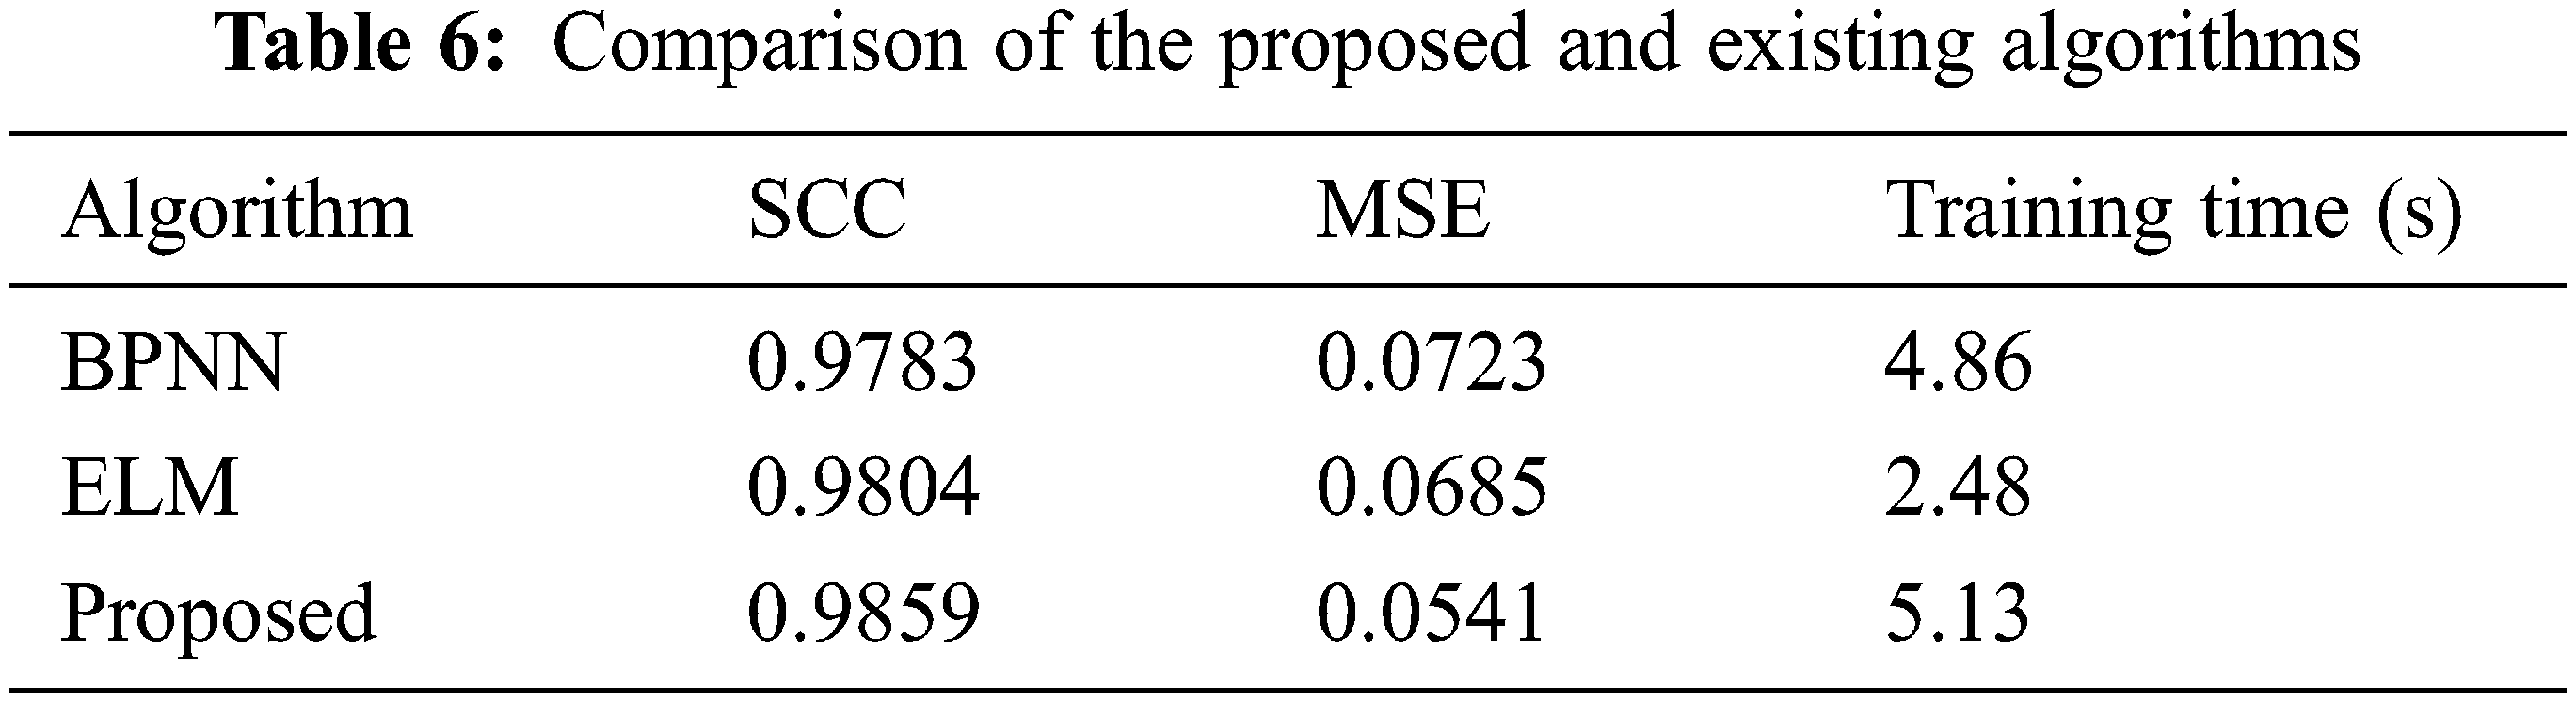
This section gives the performance indicators when the fine rules extracted by different algorithms are applied to the prediction of scene cluster 3, and the input features are all consistent with those in Section 6.3. As shown in Tab. 6. As can be seen from Tab. 6, compared with traditional back propagation neural network (BPNN), the extreme learning machine (ELM) has faster training speed and stronger generalization ability, while the training speed of the proposed algorithm is relatively slow, which is due to the differential evolution optimization. At the same time, all individuals need to perform extreme learning, which reduces the overall training speed. But compared with BPNN and ELM, the proposed algorithm has higher accuracy and stronger generalization ability. Considering that the extraction of fine rules can be performed offline, and the time required for online prediction by the learner is basically in milliseconds, the use of higher-precision proposed algorithm is more suitable for this scenario.
This paper proposes a novel algorithm to optimize the power flow in electrical distribution system. The large-scale connection of intermittent clean energy such as wind power to the power grid makes the real-time operating conditions of the power grid more random and uncertain. The traditional safe and stable operation rules based on calculation of typical operating conditions have the risk of failure, and it is difficult to ensure the efficiency and safety of the power grid. In order to solve the above problems, based on the idea of big data-driven power system rule extraction and operation decision-making, this paper proposes an adaptive differential evolution extreme learning machine extraction method containing the limit transmission power operation rules of the transmission section of the wind power system. Firstly, the power grid operating conditions are characterized by the two-dimensional feature of “wind power-load”, and the typical operating conditions are extracted based on the K-medoids clustering method. Then, on the basis of each typical operating condition, a random operating condition set is generated by random sampling, and the repeated power flow method with embedded transient stability check is used to search and obtain the limit transmission power of key transmission sections under random operating conditions. Aiming at the high-dimensional operation feature attribute set of complex interconnected power grids, the RELIEF-F algorithm is used to achieve feature dimensionality reduction, and the feature attributes that are strongly coupled with the transmission section are identified. Finally, the differential evolution extreme learning machine is used to learn the association prediction rules for extracting the ultimate transmission power of the transmission section in the dimensionality reduction feature space. In the real-time operation stage, the fast and accurate estimation of the limit transmission power of the transmission section can be realized through two-stage working condition matching and rule prediction. The example of New England 39 nodes including wind power verifies that the proposed method has strong correlation fitting and nonlinear generalization ability, and can realize fast and accurate optimization of the limit transmission power of wind power transmission section. Future work will to be consider the transient characteristics and evaluate the proposed method in different deployment scenarios.
Acknowledgement: The authors extend their appreciation to the Deputy ship for the Research & innovation, Ministry of Education in Saudi Arabia for funding this research work through the Project Number (IF-PSAU-2021/01/18432).
Funding Statement: The authors extend their appreciation to the Deputy ship for the Research & innovation, Ministry of Education in Saudi Arabia for funding this research work through the Project Number (IF-PSAU-2021/01/18432).
Conflicts of Interest: The authors declare that they have no conflicts of interest to report regarding the present study.
1. Z. Skibko, M. Tyminska, W. Romaniuk and A. Borusiewicz, “Impact of the wind turbine on the parameters of the electricity supply to an agriculture farm,” Sustainability, vol. 13, no. 13, pp. 1–18, 2021. [Google Scholar]
2. M. Alzubaidi, K. N. Hasan, L. Meegahapola and M. Rahman, “Identification of efficient sampling techniques for probabilistic voltage stability analysis of renewable-rich power systems,” Energies, vol. 14, no. 8, pp. 1–18, 2021. [Google Scholar]
3. C. Oh, J. Choi, S. Yun and S. Ahn, “Short-term cooperative operational scheme of distribution system with high hosting capacity of renewable-energy-based distributed generations,” Energies, vol. 14, no. 19, pp. 1–15, 2021. [Google Scholar]
4. T. Huang, Q. Guo and H. Sun, “A distributed computing platform supporting power system security knowledge discovery based on online simulation,” IEEE Transactions on Smart Grid, vol. 8, no. 3, pp. 1513–1524, 2017. [Google Scholar]
5. O. Mohammad, M. Mustafa, D. Mohammad and A. Otuoze, “Available transfer capability calculation method: A comprehensive review,” Electrical Energy Systems, vol. 29, no. 6, pp. 845–853, 2019. [Google Scholar]
6. P. Sarajcev, A. Kunac, G. Petrovic and M. Despalatovic, “Artificial intelligence techniques for power system transient stability assessment,” Energies¸, vol. 15, no. 2, pp. 1–13, 2022. [Google Scholar]
7. A. Anwar, A. Mahmood, B. Ray, M. Mahmud and Z. Tari, “Machine learning to ensure data integrity in power system topological network database,” Electronics, vol. 9, no. 4, pp. 1–11, 2020. [Google Scholar]
8. T. Zhongda, “Kernel principle component analysis-based least squares support vector machine optimized by improved grey wolf optimization algorithm and application in dynamic liquid level forecasting of beam pump,” Transactions of the Institute of Measurement and Control, vol. 42, no. 6, pp. 1135–1150, 2020. [Google Scholar]
9. K. Sun, P. Tian, H. Qi, F. Ma and G. Yang, “An improved normalized mutual information variable selection algorithm for neural network-based soft sensors,” Sensors, vol. 19, no. 24, pp. 1–15, 2019. [Google Scholar]
10. H. Zhang, H. Sun, Q. Zhang and G. Kong, “Microgrid spinning reserve optimization with improved information gap decision theory,” Energies, vol. 11, no. 9, pp. 1–17, 2018. [Google Scholar]
11. S. Abbas, S. Kazmi, M. Naqvi, A. Javed, S. Naqvi et al., “Impact analysis of large-scale wind farms integration in weak transmission grid from technical perspectives,” Energies, vol. 13, no. 20, pp. 1–17, 2020. [Google Scholar]
12. G. Wang, Y. Yang, H. Wang, B. Zhou, J. Qiu et al., “Low carbon oriented power-to-gas station and integrated energy system planning with ancillary service provision and wind power integration,” IET Renewable Power Generation, vol. 14, no. 17, pp. 3356–3367, 2020. [Google Scholar]
13. Z. Zhou, L. Shi and Y. Chen, “An optimal over-frequency generator tripping strategy for regional power grid with high penetration level of renewable energy,” Journal of Modern Power Systems and Clean Energy, vol. 9, no. 5, pp. 1007–1017, 2021. [Google Scholar]
14. O. Yan and C. Singh, “Improvement of total transfer capability using TCSC and SVC,” in IEEE Power Engineering Society Summer Meeting, Vancouver, Canada, pp. 944–948, 2001. [Google Scholar]
15. M. Vankateswara, S. Sivanagaraju and C. Suresh, “Available transfer capability evaluation and enhancement using various FACTS controllers: Special focus on system security,” Ain Shams Engineering Journal, vol. 7, no. 1, pp. 191–207, 2016. [Google Scholar]
16. F. Falaghi, M. Ramezani and C. Singh, “Probabilistic assessment of TTC in power systems including wind power generation,” IEEE Systems Journal, vol. 6, no. 1, pp. 181–190, 2012. [Google Scholar]
17. D. Gupta and S. Jain, “Available transfer capability enhancement by FACTS devices using metaheuristic evolutionary particle swarm optimization,” Energies, vol. 14, no. 4, pp. 1–13, 2021. [Google Scholar]
18. R. Urbanowicz, M. Meeker, W. Cava, R. Olson and J. Moore, “Relief-based feature selection: Introduction and review,” Journal of Biomedical Informatics, vol. 85, no. 6, pp. 189–203, 2018. [Google Scholar]
19. M. Wulder, J. White, R. Fournier, J. Luther and S. Magnussen, “Spatially explicit large area biomass estimation: Three approaches using forest inventory and remotely sensed imagery in a gis,” Sensors, vol. 8, no. 1, pp. 1–21, 2008. [Google Scholar]
20. N. Huang, H. Chen, S. Zhang, G. Cai, W. Li et al., “Mechanical fault diagnosis of high voltage circuit brakers beased on wavelet time-frequency entropy and one-class support vector machine,” Entropy, vol. 18, no. 1, pp. 1–22, 2016. [Google Scholar]
21. T. Jumani, M. Mustafa, Z. Hussain, M. Rasid, M. Saeed et al., “Jaya optimization algorithm for transient response and stability enhancement of a fractional-order PID based automatic voltage regulator system,” Alexandria Engineering Journal, vol. 59, no. 4, pp. 2429–2440, 2020. [Google Scholar]
22. M. Ahmad, N. Isa, W. Lim and K. Ang, “Differential evolution: A recent review based on state-of-the-art works,” Alexandria Engineering Journal, pp. 3831–3872, 2022. [Google Scholar]
23. Y. Li, K. Xie, L. Wang, Y. Xiang, R. Xiao et al., “Day-ahead scheduling of power system incorporating network topology optimization and dynamic thermal rating,” IEEE Access, vol. 7, pp. 35287–35301, 2019. [Google Scholar]
24. W. Liu, H. Liu, F. Wang, C. Wang, L. Zhao et al., “Practical automatic planning of MV distribution network considering complementation of load characteristic and power supply unit partitioning,” IEEE Access, vol. 8, pp. 91807–91817, 2020. [Google Scholar]
 | This work is licensed under a Creative Commons Attribution 4.0 International License, which permits unrestricted use, distribution, and reproduction in any medium, provided the original work is properly cited. |