DOI:10.32604/iasc.2023.027039
| Intelligent Automation & Soft Computing DOI:10.32604/iasc.2023.027039 | |
| Article |
Intrusion Detection Using Ensemble Wrapper Filter Based Feature Selection with Stacking Model
1Department of ECE, Kongunadu, College of Engineering and Technology, Trichy, 621215, India
2Department of IT, Sona College of Technology, Salem, 636005, India
*Corresponding Author: D. Karthikeyan. Email: dkarthikeyanres21@outlook.com
Received: 09 January 2022; Accepted: 06 March 2022
Abstract: The number of attacks is growing tremendously in tandem with the growth of internet technologies. As a result, protecting the private data from prying eyes has become a critical and tough undertaking. Many intrusion detection solutions have been offered by researchers in order to decrease the effect of these attacks. For attack detection, the prior system has created an SMSRPF (Stacking Model Significant Rule Power Factor) classifier. To provide creative instance detection, the SMSRPF combines the detection of trained classifiers such as DT (Decision Tree) and RF (Random Forest). Nevertheless, it does not generate any accurate findings that are adequate. The suggested system has built an EWF (Ensemble Wrapper Filter) feature selection with SMSRPF classifier for attack detection so as to overcome this problem. The UNSW-NB15 dataset is used as an input in this proposed research project. Specifically, min–max normalization approach is used to pre-process the incoming data. The feature selection is then carried out using EWF. Based on the selected features, SMSRPF classifiers are utilized to detect the attacks. The SMSRPF is integrated with the trained classifiers such as DT and RF to create creative instance detection. After that, the testing data is classified using MCAR (Multi-Class Classification based on Association Rules). The SRPF judges the rules correctly even when the confidence and the lift measures fail. Regarding accuracy, precision, recall, f-measure, computation time, and error, the experimental findings suggest that the new system outperforms the prior systems.
Keywords: Intrusion detection system (IDS); ensemble wrapper filter (EWF); stacking model with significant rule power factor (SMSRPF); classifier
Phenomenal increase in network traffic and explosions in the field of information technology have created multitude of challenges in securing public and private networks. Adversary events which lead to compromises in the area of networks and they have exploited the conditions in terms of endangering integrity, confidentiality and availability [1]. Current Firewalls fail to detect and analyze the network packets that are malicious. Hence, IDSs (Intrusion Detection Systems) are a part of cyber security and designed to protect networks from intrusions and attacks [2]. IDSs identify the attacks based on signatures which are previously defined or from anomalies found in analysis or misuse of networks [3]. The signature based IDSs search previously the stored patters of attacks for identifying them. Anomaly-based IDSs look for differences in the behavior/activity of network and correct them as an attack on identifying any activity that deviates from the usual. Anomaly detection helps to discover zero-day threats that have never been observed before, whereas misuse detection has a high detection rate. The identification of anomalies and the detection of misuse are mutually exclusive.
The effectiveness of IDS is assessed based on its capability to detect the attacks, but needs a comprehensive amount of network behavior data [4]. KDDCUP 99 and NSLKDD Datasets were created for IDS evaluations [5]. These datasets do not project true performances of IDSs [6–8] for many reasons as discussed below: KDDCUP 99 is filled with redundant information affecting the results as they are based on record frequencies and subsequently, the missing values in records change the interpretations. NSLKDD is an improved KDDCUP 99 and handles data imbalances in the base dataset. However, this improved version fails to reflect the current attack foot prints. As an effort to overcome the above said issues, UNSW-NB15 dataset with nine attack types is considered for evaluating IDSs.
Several MLTs (Machine Learning Techniques) have been used [9,10] to select features for IDS evaluations including kNNs (k-Nearest-Neighbours), LRs (Logistic Regressions), Artificial Neural Network (ANNs), Support Vector Machine (SVMs), DTs and XGBoost methodology employing UNSW-NB15 database [11]. The MLTs have not performed satisfactorily in terms of execution times or accuracy. This is mainly due to the fact that the evaluated datasets have a greater number of redundant or unrelated features which impact their performances detrimentally. The presence of such features also increases the computational complexities. Thus, dimensionality reduction plays a significant role while processing these datasets with MLTs.
The proposed research improves the performance by contributing wrapper filter with stacking classifier. The ensemble filter operation is performed to attain a better result. The classification is carried out using the essential power factors in stacking. As a result, the outcome is evaluated and compared.
The paper has been organized with 5 sections. Section 2 discusses the related works, Section 3 introduces the proposed methodology. Section 4 elaborates the implementation and evaluation of the result. Section 5 concludes the research work.
IDS with feature selections were presented in various studies. The scheme used XGBoost algorithm for feature reductions. A multitude of MLTs were used in the study. SVMs, k-NNs, LRs, Artificial Neural Network (ANNs) and DTs were applied on the feature space for the reduction of dimensionality. The proposal aimed at binary and multiclass classifications. Their experimentations that were evaluated on UNSW-NB15 Dataset showed an increase in accuracy of tree-based classifiers like DTs through XGBoost-based feature selections and their results increased the testing accuracy from 88.13% to 90.85% in binary classifications [12].
IDS used HKELM for attack detections. The scheme's hybrid kernel had combined GSA and DE method for their proposed HKELM parameter optimizations. This combination improved both local and global optimization of predictions during attacks. Additionally, their use of KPCA (Kernel Principal Component Analysis) had reduced the feature space dimensionality and thus resulting in minimal features for intrusion detections. The scheme called KPCA-DEGSA-HKELM was benchmarked on the databases like KDD CUP 99, UNSW-NB15, industrial IDS from Tennessee Eastman process where the scheme performed satisfactorily [13].
Rough sets were combined with other techniques by Al-Daweri et al. (2020) in their study. The IDS proposal used RST, BPNN and D-CFA. scheme computed dependency ratio of features and classes utilizing RST and every feature output was fed into BPNN for measuring their classification ability. The proposals of multiple-run feature selections had indicated a selection frequency of the feature. Their study implies that certain features of KDD99 dataset were detrimental in order to achieve above 84% of accuracy in the classification. Their new found features from the datasets had contributed highly towards the enhanced classifications [14].
Extreme tree classifier was used by Shi et al. (2020) for their proposed IDS. The proposal selected the features for improved efficiency while extreme tree bagging enhanced the accuracy and adaptability. Their tree model was integrated with QDA (Quadratic Discriminant Analysis) to maximize the learning of the study. The exhaustive experimentations on KDD CUP 99 and UNSW-NB15 databases verified the shortened training and testing times of suggested system while clocking higher accuracy than GBDT model. The training time of GBDT on UNSW-NB15 database was 3.68 times higher than the proposed system while accuracy was 2.27% lesser. The study also extracted Fuzzers and Shellcode attacks from UNSW-NB15 for testing it separately and thus proving the adaptability detect network attacks through their proposed model. The study combined their model with blacklists/detection rules for anomaly detections in networks [15].
An error pruning tree was used by Roy et al. (2020) in their study where feature selections were performed on the UNSW-NB15 dataset. The proposal used REPTrees (Reduced Error Pruning Trees) for detecting the network anomalies. The proposed scheme successfully identified 99.94% of worms using the REPTrees with 0.00 False Alarms on the UNSW-NB15 dataset. Thus, it performed better than the other techniques while identifying attacks in the dataset [16].
The proposed system designed an Ensemble Wrapper Filter (EWF) feature selection with Stacking as well as SMSRPF classification model for intrusion detection in UNSW-NB15 dataset. Fig. 1. depicts the flow diagram of the proposed work.

Figure 1: Flow diagram of the proposed work
3.1 Data Pre-Processing MinMax Normalization
UNSW-NB15 is the dataset taken for the study as it encompasses normal and current attack categories found in networks. The dataset with 82,332 training and 1, 75,341 testing samples has values in a variety of data types including binary, float, nominal and integers. The samples also have service name, port numbers, protocols, packets transmission details and IP addresses, labels include 9 attack types with one NO-ATTACK label.
Data pre-processing is the initial process of this work where samples are normalized before processing. This research work uses Min-max normalization for normalizing values that occur out of given ranges. This normalization alters the values linearly and based on a minimum/maximum value as given in Eq. (1)
where, A is the data attribute, Min(A) is the minimum absolute value of the attribute, Max(A) is the maximum absolute value of the attribute, v′ the modified attribute value, v is the existing attribute and new_max(A)/ new_min(A) are the maximum and minimum value ranges.
3.2 EWF (Ensemble Wrapper Filter)
This study uses EWF as a preprocessing step for its feature selections and is not dependent on the classifier. EWF feature selections are based on IG (Information Gain) and ASMBO (Adaptive Sensor Modality based Butterfly Optimization) algorithm. Scores are added to the features and based on a pre-defined threshold values, the unwanted features are eliminated as depicted in Fig. 2.

Figure 2: Ensemble wrapper filter (EWF) based feature selection method
IG (Information Gain)
Datasets generally have multiple irrelevant or redundant attributes which may affect the mining tasks. Manual alignment of useful features by domain experts is a time consuming and complex task. Non-consideration of relevant attributes is also an issue in the feature selections.
IG plays a significant role in choosing effective features. It can easily be implemented and popular amongst feature selection techniques. IG uses a weighting method on features to obtain scores where it drops the features with low IG scores. Its assessment of feature and class label dependencies is based on high IG values of features which are then selected for learning. The maximum value of IG is 1.
Assuming A is an attribute, C is class, Eqs. (2) and (3) depict entropy of the class prior and after its observations
Information entropy of the attribute w. r. t to the class can be defined as Eq. (3)
Entropy value of the class decreases the reflect additional information provided by the attribute of the class (IG). Every attribute Ai is provided with a score depending on IG and class;
In IDS implementations, IG of individual features is measured for predicting the categories that are present or absent in the attributes. Based on Eq. (3) IG for classifications can be defined as Eq. (5)
where, Ci–class attribute, P (Ci)-ith class probability value, P(t)-probability of occurrence of the feature t occurs, P(
ASMBO Algorithm
This work uses ASMBO for the selection of optimal features. BOA (Butterfly Optimization Algorithm) is being used lately. BOA is a meta-heuristics method based on the natural behavior of butterflies, which mimics their mating and foraging behaviors. Fragrance of butterflies attracts the other butterflies while searching for food and mating [17,18]. Search operators of BOA are butterflies that optimize solutions within the search spaces in an organized manner [19–25]. Butterflies are equipped with sense receptors which identify the fragrance for their food discoveries. The fragrance is scattered all over its body in receptors or nerve cells called chemo receptors.
BOA mimics the butterflies in many aspects. The fragrance of the butterfly is associated with its fitness and while on the move, the fitness values are liable to changes. The distribution of fragrance in butterflies suggests that they may pass on their own information to other butterflies, implying that they are part of a social learning system. When a butterfly senses the fragrance from others, it moves towards the fragrance (Global Search). Butterflies that cannot sense fragrances move randomly in the herd depict (Local Search). In BOA, each fragrance is different and individualistic. It is this aspect which differentiates BOA from other meta-heuristics. In order to derive the objective function of BOA, the parameters such as sound, light or temperature are to be understood.
In this methodology, the crude information of the vitality of the sensor is quantified and processed. The procedure uses I (stimulus intensity), c (sensory modality), and a power exponent (a). In BOA, I represent the fitness of the butterfly/solution. The dataset samples are the butterflies in the suggested research study and the objective function is the classification accuracy. The discharge of fragrance by a butterfly measured as (Av) where random butterflies detect and get attracted towards a more fragrant butterfly based on this value. Increases in intensity depict a solution and is the parameter a. Researches presume that the insects are not affected by changes in the environment. Hence, in BOA, the fragrance is computed by
Where in, fi-apparent fragrance of ith butterfly, c–modality of sensor, I-objective function and a–modality exponent for calculating the absorption level. BOA has two key phases in searches which are global and local. The fragrance of a butterfly can be identified from anywhere. In global searches, features step towards the fittest features g* represented as
where,
where,
The parameters I, c and a are responsible for communications between butterflies where optimality is the objective. The sensor modality measured is a form of energy which is processed as it is used to analyze the fragrance emitted by butterflies in movements or attracting other butterflies. Traditional BOA algorithm uses c as a constant where its increments result in improved performances. In ASMBO, the value of c changes in the iterations of the algorithm. ASMBO's value of c is computed as
where,
t–Executing current iteration number
MaxGeneration-maximum number of iterations
Using the concepts, in ASMBO, the fragrance is updated as

3.3 Stacking Model with Significant Rule Power Factor (SMSRPF) Classifier for Attack Detection
Here, SMSRPF is designed for attack detection. The SMSRPF is a collective decision-making mechanism that creates creative instance detection by combining the detection of trained classifiers like DTs and RF. Levels as diverse as 0 and l state can be considered in the stacking step. Take the labels of the training data set from label 0 in which the occurrences of meta features are p1 … pm in this suggested detection approach. The labels of the classes are q1 …qm which the instances of training and the testing data are to be classified using MCAR in level 1.
A) DTs
DTs are supervised learning algorithms where their aim and objective are in training a model that can be used for predicting the classes or values of target variables. The model learns from simple decision rules which it infers from data samples. Accuracy is judged by inferring samples placed in the correct class.
ID3 (Iterative Dichotomiser 3)
ID3 proposed by Ross Quinlan generates DTs for datasets and is generally used in MLTs and NLPs (Natural Language Processing). DTs construct trees for modeling classifications. On building a tree, each sample from the dataset is validated before being inducted into the tree. The tree is then used for classifying samples. DTs have dis-advantages as detailed below:
• Selection of attributes to be split
• Arranging the split attributes
• Assessing the count of splits
• Balancing the tree and pruning
• Termination criteria
ID3 classifies based on Information Entropy where categories are mapped to different values in the set of attributes with the intention of forming the best condition for the attribute set. The splitting attributes are selected using Entropy and Information Gain. The split attribute of the current node is chosen among attributes with maximum information gain. Information entropy is divided into subsets to have smaller values. Based on these values, the branches of the tree are created. It is a recursive operation where each branch creates its nodes and the process is carried till all samples are categorized.
B. RF
RF is a popular MLT and categorized as a supervised learning technique. It is an ensemble learning since it combines the multiple classifiers to solve complex issues and thus enhance performance of the model. Rf works in two stages where a random forest is created by joining N DTs. In the next stage, predictions are made based on the created trees. RF is described as steps
Step-1: K data points are randomly chosen for training
Step-2: DTs are formed employing selected data points (Subsets).
Step-3: Define count of DTs (N) to be built.
Step-4: Repeat Steps 1 and 2.
Step-5: Predict based on new data points of each DT and categorize new data points based on voting.
C. MCAR
MCARs use items in ranking rules resulting in detailed rules with high confidences for classifications efficiently. MCARs work in two stages where the first stage is rules generation followed by building a classifier. First stage involves MCAR scanning training data to find frequency in items, which are then recursively combined to construct things with more characteristics. As a result, MCAR ranks are created and saved as rules. Then, the framed rules produce a classifier based on the effectiveness of the training set. MCAR algorithm is detailed below:

D. SRPF Interest Measure
SRPF-based classifiers employed certain key features of associative classification theory, such as interaction processing rules, fertilization rules, and classification rules. This lists the most important guidelines for making the classifier light and accurate. Furthermore, the SRPF classifier employed the MCAR classifier for this operation. The current interest measure known as SRPF has shown to be theoretically successful interest measure. The SRPF is expected to be
The components X and Y are linked at a point. P (X) denotes the likelihood of item X occurring, whereas P (Y) denotes the likelihood of item Y occurring. The chance of both X and Y having reciprocal incidence is P (XY). To design the rules, the classifier has one assistance limit, but the SRPF classifier offers support schemes. This classifier is also excellent for dealing with the unusual situation. Furthermore, the SRPF classifier has the rules on dependent classes, which is a new provision for the development of association mining.
For both current and new research methodologies, an empirical assessment was carried out in a Matlab simulation environment, and the performance of the methods was assessed. In order to train and test all ML implementations, the “UNSW-NB15” dataset was used. The dataset contained 82,332 records for training and 1, 75,341 records for testing and thus included both normal and modern synthetic network traffic assault activities. Every record was made up of several data kinds’ attributes (e.g., binary, float, nominal and integer). Port numbers, service names, protocols, IP addresses, packet transmission statistics, and ten labels were among the features. There were nine distinct sorts of attack names, as well as a default (“NO-ATTACK”) option. The overall prediction is shown in Fig. 3.

Figure 3: Overall results
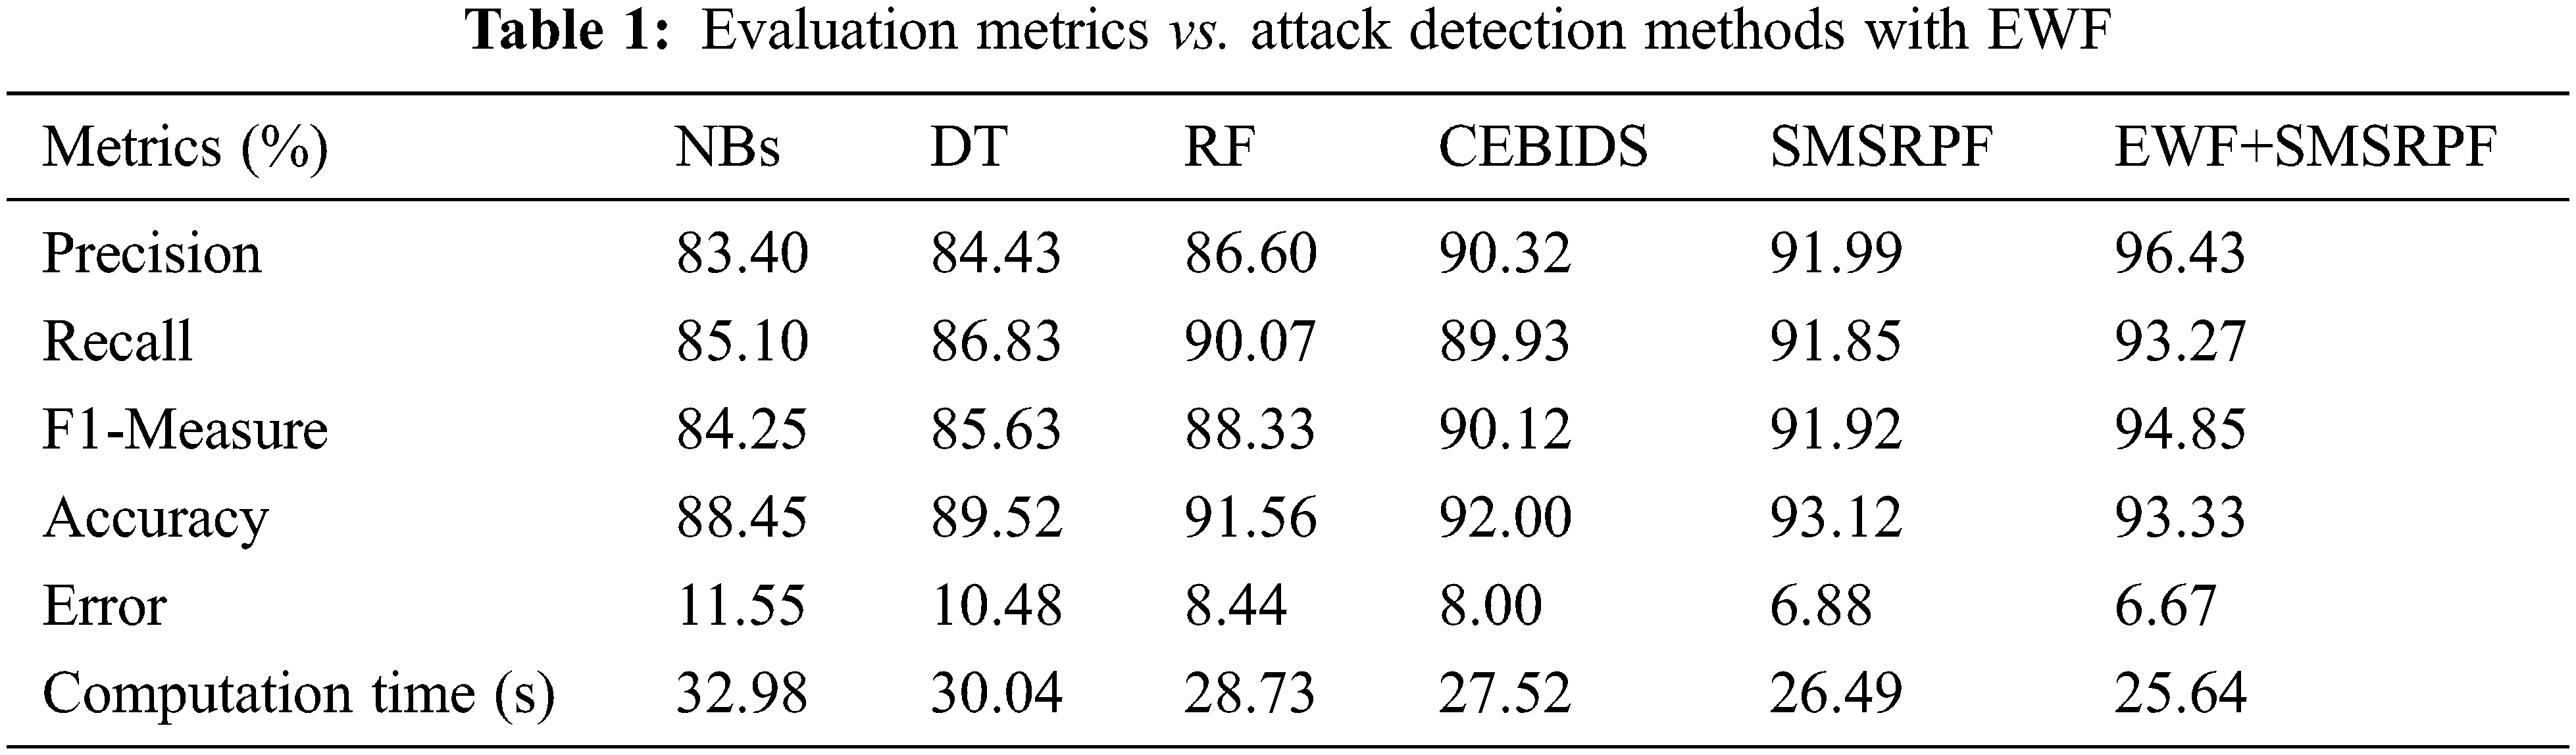
Efficiency of suggested SMSRPF method was contrasted with current Naive Bayes (NBs), DT, RF and Classifier Ensemble Based Intrusion Detection Systems (CEBIDS) methods. The performance metrics utilized in the simulation included accuracy, precision, recall, f-measure, computation time and error. Result comparison metrics with respect to classifiers is shown in Tab. 1.
As illustrated in the equation below, precision was used to assess true-positive occurrences in proportion to false-positive cases.
Precision results of proposed EWF+SMSRPF method is compared with the existing NBs, DT, RF, CEBIDS and SMSRPF methods which is illustrated in Fig. 4. The proposed EWF+SMSRPF provided higher precision results of 96.43%, whereas the other methods such as NBs, DT, RF, CEBIDS and SMSRPF had achieved 83.40%, 84.43%, 86.60%, 90.32% and 91.99% respectively. In this proposed research work, EWF+SMSRPF had integrated with two feature selection methods to improve the precision rate.

Figure 4: Precision results comparison of IDS methods
The goal of recall is to compare and contrast true-positive and false-negative events. The following equation expresses the recollection in mathematical terms:
Fig. 5 depicts the recall of suggested EWF+SMSRPF technique and the existing NBs, DT, RF, CEBIDS and SMSRPF methods. Experiential findings suggested that EWF+SMSRPF technique had obtained 93.27% of recall when the other methods such as NBs, DT, RF, CEBIDS and SMSRPF had attained 85.10%, 86.83%, 90.07%, 89.93% and 91.85% respectively. From the findings, it is indicated that suggested EWF+SMSRPF method provides higher recall rate compared to the other methods.

Figure 5: Recall results comparison of IDS methods
The average of recall and accuracy is the F1-score criteria. The following equation can be used to compute it.
The proposed EWF+SMSRPF method is compared with the existing NBs, DT, RF and CEBIDS methods in terms of f-measure as shown in Fig. 6. From findings, it is indicated that suggested EWF+SMSRPF gives high f-measure results of 94.85%, whereas 84.25%, 85.63%, 88.33%, 90.12% and 91.92% are recorded for the existing methods such as NBs, DT, RF, CEBIDS and SMSRPF respectively.

Figure 6: F-measure results comparison of IDS methods
As specified in the following formula, the accuracy criteria is used to determine how many cases are accurately classified as normal and attack:
TP-True Positives
Tn-True Negatives
Fp-False Positives
Fn-False Negatives
Fig. 7 shows the performance of NBs, DT, RF, CEBIDS, SMSRPF AND EWF+SMSRPF methods with respect to accuracy. From experimental findings, it is indicated that suggested EWF+SMSRPF gives improved accuracy results of 93.33%, whereas the other methods such as NBs, DT, RF, CEBIDS and SMSRPF attains 88.45%, 89.52%, 91.56%, 92.00% and 93.12% respectively. In this proposed work, feature selection is done using Ensemble Wrapper Filter (EWF) approach. EWF method combines the output of two methods such as IG, and ASMBO so as to select optimal features. It improves the accuracy rate.

Figure 7: Accuracy results comparison of IDS methods
Fig. 8 shows the performance comparison of NBs, DT, RF, CEBIDS, SMSRPF and proposed EWF+SMSRPF method via error rate. Classifiers are plotted in x-axis, error rate along y-axis. Error rate of the proposed system is 6.67% whereas the other methods such as NBs, DT, RF, CEBIDS and SMSRPF algorithm attain 11.55%, 10.48%, 8.44%, 8.00%, and 6.88% respectively.

Figure 8: Error rate comparison of IDS methods
Fig. 9 shows the computation time of the previous NBs, DT, RF, CEBIDS, SMSRPF and proposed EWF+SMSRPF methods are compared. From findings, it is indicated that suggested EWF+SMSRPF has consumed lesser computation time of 25.648 s, whereas the other methods such as NBs, DT, RF, CEBIDS and SMSRPF attained 32.985, 30.04, 28.73, 27.52 and 26.49 s respectively.

Figure 9: Computation time results of IDS methods
The proposed system works with Ensemble Wrapper Filter (EWF) based feature selection with SMSRPF classification method for accurate attack identification. In order to enhance the detection accuracy, Ensemble Wrapper Filter (EWF) was designed for optimal feature selection. EWF had integrated with IG and ASMBO based feature selection methods. The final output of EWF was calculated by combining the results of every filter technique and applied a predetermined threshold to decide the final feature by a simple majority vote. Then, SMSRPF classification method was utilized to detect the attacks. The test findings showed that suggested model had received 93.33% accuracy, 96.43% of precision, 93.27% of recall, 94.85% of f-measure, 6.67% of error and 25.64 s of computation time which were better than the previous methods such as NBs, DT, RF and CEBIDS. In future, machine learning model can be implemented for improving performance.
Funding Statement: The authors received no specific funding for this study.
Conflicts of Interest: The authors declare no conflict of interest regarding the publication of the paper.
1. V. Kumar, D. Sinha, A. K. Pandey and R. T. Goswami, “An integrated rule based intrusion detection system: Analysis on UNSW-NB15 data set and the real time online dataset,” Cluster Computing, vol. 23, no. 2, pp. 1397–1418, 2020. [Google Scholar]
2. T. Su, H. Sun, J. Zhu, S. Wang and Y. Li, “BAT: Deep learning methods on network intrusion detection using NSL-KDD dataset,” IEEE Access, vol. 8, pp. 29575–29585, 2020. [Google Scholar]
3. M. Masdari and H. Khezri, “A survey and taxonomy of the fuzzy signature-based intrusion detection systems,” Applied Soft Computing, vol. 92, pp. 106301–325, 2020. [Google Scholar]
4. P. Gogoi, M. H. Bhuyan, D. K. Bhattacharyya and J. K. Kalita, “Packet and flow based network intrusion dataset,” in Proc. Int. Conf. on Contemporary Computing, Noida, India, pp. 322–334, 2012. [Google Scholar]
5. U. Fayyad, S. Chaudhuri and D. Madigan, “The fifth international conference on knowledge discovery and data mining,” New York. (2000). [Online]. Available: http://kdd.ics.uci.edu/databases/kddcup99/KDDCUP99.html. [Google Scholar]
6. M. John, “Testing intrusion detection systems: A critique of the 1998 and 1999 DARPA intrusion detection system evaluations as performed by Lincoln laboratory,” ACM Transactions on Information and System Security, vol. 3, pp. 262–294, 2000. [Google Scholar]
7. V. Mahoney and K. Philip, “An analysis of the 1999 DARPA/Lincoln laboratory evaluation data for network anomaly detection,” Recent Advances in Intrusion Detection, vol. 6, pp. 220–237, Springer, Berlin Heidelberg, 2003. [Google Scholar]
8. A. Vasudevan, E. Harshini and S. Selvakumar, “SSENet-2011: A network intrusion detection system dataset and its comparison with KDD CUP 99 dataset,” in Proc. Asian Himalayas Int. Conf. on Internet, (AH-ICI), Kathmundu, Nepal, 2012. [Google Scholar]
9. T. B. Prasad, P. S. Prasad and K. P. Kumar, “An intrusion detection system software program using KNN nearest neighbors approach,” International Journal of Science Research and Innovation Engineering (IJSRIE), vol. 1, pp. 1–6, 2020. [Google Scholar]
10. M. Nawir, A. Amir, N. Yaakob and O. B. Lynn, “Multi-classification of UNSW-NB15 dataset for network anomaly detection system,” Journal of Theoretical & Applied Information Technology, vol. 96, no. 15, pp. 5094–5104, 2018. [Google Scholar]
11. N. Moustafa, B. Turnbull and K. K. R. Choo, “An ensemble intrusion detection technique based on proposed statistical flow features for protecting network traffic of internet of things,” IEEE Internet of Things Journal, vol. 6, no. 3, pp. 4815–4830, 2018. [Google Scholar]
12. S. M. Kasongo and Y. Sun, “Performance analysis of intrusion detection systems using a feature selection method on the UNSW-NB15 dataset,” Journal of Big Data, vol. 7, no. 1, pp. 1–20, 2020. [Google Scholar]
13. L. Wang, Z. Zhang and X. Liu, “A novel intrusion detection system based on an optimal hybrid kernel extreme learning machine,” Knowledge-Based Systems, vol. 195, pp. 1–17, 2020. [Google Scholar]
14. M. S. Daweri, K. A. Zainol Ariffin and S. Abdullah, “An analysis of the KDD99 and UNSW-NB15 datasets for the intrusion detection system,” Symmetry, vol. 12, no. 10, pp. 1–32, 2020. [Google Scholar]
15. X. Shi, Y. Cai and Y. Yang, “Extreme trees network intrusion detection framework based on ensemble learning,” in Proc. Int. Conf. on Advances in Electrical Engineering and Computer Applications (AEECA), Dalian, China, pp. 91–95, 2020. [Google Scholar]
16. A. Roy and K. J. Singh, “Multi classification of UNSW NB15 dataset for network anomaly detection system,” in Proc. Int. Conf. on Communication and Computational Technologies, Namakkal, India, pp. 429–451, 2020. [Google Scholar]
17. G. G. Wang, S. Deb and Z. Cui, “Monarch butterfly optimization,” Neural Computing and Applications, vol. 31, no. 7, pp. 1995–2014, 2019. [Google Scholar]
18. S. Arora and S. Singh,“Butterfly optimization algorithm: A novel approach for global optimization,” Soft Computing, vol. 23, no. 3, pp. 715–734, 2019. [Google Scholar]
19. B. Nebojsa, T. Bezdan, K. Venkatachalam and F. A. Turjman. “Optimized convolutional neural network by firefly algorithm for magnetic resonance image classification of glioma brain tumor grade,” Journal of Real-Time Image Processing, vol. 18, no. 4, pp. 1085–1098, 2021. [Google Scholar]
20. K. Venkatachalam, S. Siuly, B. Nebojsa, H. Stepan and T. Pavel, “An efficient gabor walsh-hadamard transform based approach for retrieving brain tumor images from MRI,” IEEE Access, vol. 9, pp. 119078–119089, 2021. [Google Scholar]
21. S. Ramamoorthy, G. Ravikumar, B. Saravana Balaji, S. Balakrishnan and K. Venkatachalam, “MCAMO: Multi constraint aware multi-objective resource scheduling optimization technique for cloud infrastructure services,” Journal of Ambient Intelligence and Humanized Computing, vol. 12, no. 6, pp. 5909–5916, 2021. [Google Scholar]
22. R. S. Ponmagal, S. Karthick, B. Dhiyanesh, S. Balakrishnan and K. Venkatachalam, “Optimized virtual network function provisioning technique for mobile edge cloud computing,” Journal of Ambient Intelligence and Humanized Computing, vol. 12, no. 6, pp. 5807–5815, 2021. [Google Scholar]
23. K. Venkatachalam, P. Prabu, B. Saravana Balaji, B. Kang, N. Yunyoung et al., “Cross-layer hidden markov analysis for intrusion detection,” Computers, Materials & Continua, vol. 70, pp. 3685–3700, 2021. [Google Scholar]
24. B. Jameer, B. Nebojsa, V. Nikola, Z. Miodrag, K. Venkatachalam et al., “Chaotic harris hawks optimization with quasi reflection based learning: An application to enhance CNN design,” Sensors, vol. 21, no. 19, pp. 1–33, 2021. [Google Scholar]
25. M. Amin Salih, B. Saleem, P. N. Asha and K. Venkatachalam, “FCO—fuzzy constraints applied cluster optimization technique for wireless adhoc networks,” Computer Communications, vol. 154, pp. 501–508, 2020. [Google Scholar]
 | This work is licensed under a Creative Commons Attribution 4.0 International License, which permits unrestricted use, distribution, and reproduction in any medium, provided the original work is properly cited. |