DOI:10.32604/iasc.2023.026255
| Intelligent Automation & Soft Computing DOI:10.32604/iasc.2023.026255 | |
| Article |
Holt-Winters Algorithm to Predict the Stock Value Using Recurrent Neural Network
1Department of Computer Science & Engineering, SRM University, Sonepat, Haryana, India
2Department of Electronics & Communication Engineering, SRM University, Sonepat, Haryana, India
3Department of Computing Technologies, SRM Institute of Science and Technology, Chennai, India
4Department of Computer Science & Engineering, SRM Institute of Science and Technology, Modinagar, Ghaziabad, India
*Corresponding Author: M. Mohan. Email: mmohanit.2006@gmail.com
Received: 20 December 2021; Accepted: 15 February 2022
Abstract: Prediction of stock market value is highly risky because it is based on the concept of Time Series forecasting system that can be used for investments in a safe environment with minimized chances of loss. The proposed model uses a real time dataset of fifteen Stocks as input into the system and based on the data, predicts or forecast future stock prices of different companies belonging to different sectors. The dataset includes approximately fifteen companies from different sectors and forecasts their results based on which the user can decide whether to invest in the particular company or not; the forecasting is done for the next quarter. Our model uses 3 main concepts for forecasting results. The first one is for stocks that show periodic change throughout the season, the ‘Holt-Winters Triple Exponential Smoothing’. 3 basic things taken into conclusion by this algorithm are Base Level, Trend Level and Seasoning Factor. The value of all these are calculated by us and then decomposition of all these factors is done by the Holt-Winters Algorithm. The second concept is ‘Recurrent Neural Network’. The specific model of recurrent neural network that is being used is Long-Short Term Memory and it’s the same as the Normal Neural Network, the only difference is that each intermediate cell is a memory cell and retails its value till the next feedback loop. The third concept is Recommendation System which filters and predict the rating based on the different factors.
Keywords: Stock market; stock market prediction; time series forecasting; efficient market hypothesis; National stock exchange India; smoothing observation; trend level; seasonal factor
The stock market prediction aims to help a person to invest in the stock market by providing the forecast of closing price of stocks in various sectors in the stock market. The system takes three inputs which are the user investment, the duration of the investment, and how much can bear the loss or minimum profit to gain. The system uses the information given by the user and applies machine learning algorithms to come up with a solution that suggests the user where to invest the money for maximum profit and minimize the risk of loss. Understanding the stock marketplace and making an investment in it’s far the intricate part. So, this research helps the user to give upper hand in the prediction of stock price. Using Machine learning algorithms that work and manipulate the data in real time, this approach provides a much more efficient way to come up with the best solution. The system with the help of Machine Learning recognizes the previous patterns and tries to suggest the future stock price prediction. Various algorithms that are being used to achieve this goal are Holt-Winters Algorithm, Recurrent Neural Network and Recommendation System to suggest the best stock market investment [1–5].
The Efficient-market hypothesis (EMH) is presumption states that share prices and all available information. This states that it is unachievable to overcome the stock market due to share prices that are already registered and depicting relevant information. According to EMH, trading of stocks is always done at fair value on stock exchanges. Thus it becomes unachievable for the investors to either buy stocks which are riskier investments due to below value or sell stocks for inflated prices. This in turn leads to buying becoming impractical to outshout the overall market through stock selection given by experts [6].
EMH has supporters on the basis of academics pointing to large entities of evidence but the theory has confronters too. Warren Buffet is a great example of this he has invariably beaten the market over the years which is in contradiction to what the theory states “it is impossible…..” cynics of the EMH also point to certain occurrences such as DJIA (Dow Jones Industrial Average) which depreciated by 20% in a day pointing to the fact that stock prices can disgrace from their fair values [7].
Supporters of the EMH conclude that investors must invest in low-cost shares because of the haphazard nature of the market. This has been supported in the 2015, by an active/passive parameter study by morning star Inc. This comparison study states that the active manager returns are made with index-related funds and exchange-related funds. The study concludes that year after year US small growth funds and diversified emerging market funds have surpassed the passive funds more than 50% of the time.
As surveyed, there exist many systems that can perform stock market prediction. The chronic element has always been there in our life and data can be gathered in a variety of applications. For instance, when buying an item online, the item is automatically registered. The investigation of chronic information can hence be applied in various areas and eventually the user preferences change over the time. For instance, the choice of childhood preferences is completely changed in the choice of adulthood. It is of a great deal to incorporate such changes in the Recommendation System. In this paper, the same approach is adapted and predicted the user preferences by learning user history over time. The suggestion is composed of 3 steps. Firstly, user features based on matrix factorization and buying time are obtained. Next, user preference vectors from features are predicated using the kalman filter. Finally, a list is generated and two recommendations will be given using real-world dataset. The proposed method is efficient with other methods [8–10].
The recommendation system which is based on trust relationship and a multisource attribute trust prophecy method. The quantitative analysis is done using the user attribute. The four user attributes are selected and the trust relationship is obtained using the fusing method. In the modeling, the trust prediction result is verified by the gene fold cross-validation method. Results prove that the trust fusion method is more efficient with existing methods [11].
The author proposed and evaluated new approaches to Time Series, Non-Intervention Forecasting. The enhanced model compared with 24 methods used in Makridakis Competition (M-Competition), around 111 datasets of M-Competition compared monthly, quarterly and yearly. This Heuristic approach provides improved analysis and comparable accuracy [12–14].
The financial investors and researchers have great ideas to utilize the concept of Deep Learning. Used 6 market indices and the index are applied in Deep Learning framework of wavelength transform, long-short term memory (LSTM), and stacked auto-encoder for forecasting the stack price. At the end of the proposed model, it gives efficient predictive analysis and accountability performance [15–18].
Stock market is a risky investment, the author proposed the sentiment model based on investor’s sentiment correlated to three criteria, (i). Positive correlation between stock market trends and Guba-based sentiment, (ii) Arrival of bear market analyzed by a long lasting Guba-based sentiment, (iii) Huge in post volumes and agreement, would be more proficiency bullishness, and (iv) News sentimental model analysis [19–21].
It is believed that it is of no importance to search for stocks which are much below the value rather than undervalued, and the trends predict the market either through fundamental or technical analysis based on ensemble of trees in a random forest using least square boost (LS-RF). Thus this theory has become controversial and has been perceived as a cornerstone of the financial theory of the modern era. The author proposed financial time series forecasting using three steps, (i) Textual data representation for feature vector, (ii) Combining autoregressive integrated moving average (ARIMA) and Support vector regression (SVR) and (iii) To verify the effectiveness, the proposed method compared the six security companies quarterly Return of Equity (ROE) and they got superior result [22–26].
There are 14 Deep Learning models based on Extreme learning machine (ELM), Convolutional neural network (CNN), Long-Short Term Memory and Gated recurring unit (GRU). Stock value forecasting designed and validated on all stocks in the BSE-Bankex index, National stock exchange (NSE) of India and New York stock exchange (NYSE). Performance identified in terms of Median absolute percentage error (MAPE), Root mean square error (RMSE) and Directional accuracy (DA) [27–29].
Various optimization algorithms have been studied, Coverage-based techniques, Rule-based state machine, Pair wise testing and Back propagation network (BPN) [30].
There are many stock market prediction conventional techniques that are used, like rumors-based feed systems and news-based feed systems. But it is unable to forecast the long-term based prices due to unpredictable news and rumors pertaining to the events taking place in the future. The proposal of this system to overcome the hurdles in the long-term based to predict the stock market prices in the given interval of time using recurrent neural networks, Holt-Winters Triple Exponential Implementation, and using historical data to predict the closing price of individual stocks.
The proposed system requires the dataset of one of the stock exchanges from around the world, and now needs to gather the data. There are various datasets available on stock market exchange websites. These datasets are in various formats like intraday data, day data or weekly data or Monthly data. The proposed system operates on closing price of each day. The method is used to select a particular stock exchange and then choose a particular data format.
A large number of stock exchange markets are available throughout the world but the proposed model decided to choose the biggest Indian stock exchange. National stock exchange, now NSE is the biggest stock exchange available for stock traders in India. It has the biggest online digital exchange that gives the option to users to buy or sell their stocks online without any problems. NSE has more than fifteen thousand securities listed under the equity section making it the biggest stock exchange in Asia. The following procedures are selecting the Stock exchange market, choosing in the proposed model and selecting particular stocks.
4.1.1 Selecting Suitable Stocks
The proposed system uses the list of stocks which are traded on a daily basis in the stock market. It chooses the stocks that give the best periodical graph on the close price of the stock market and is constantly being traded. It chose the stocks that give linear curves and ignores the intraday trading prices.
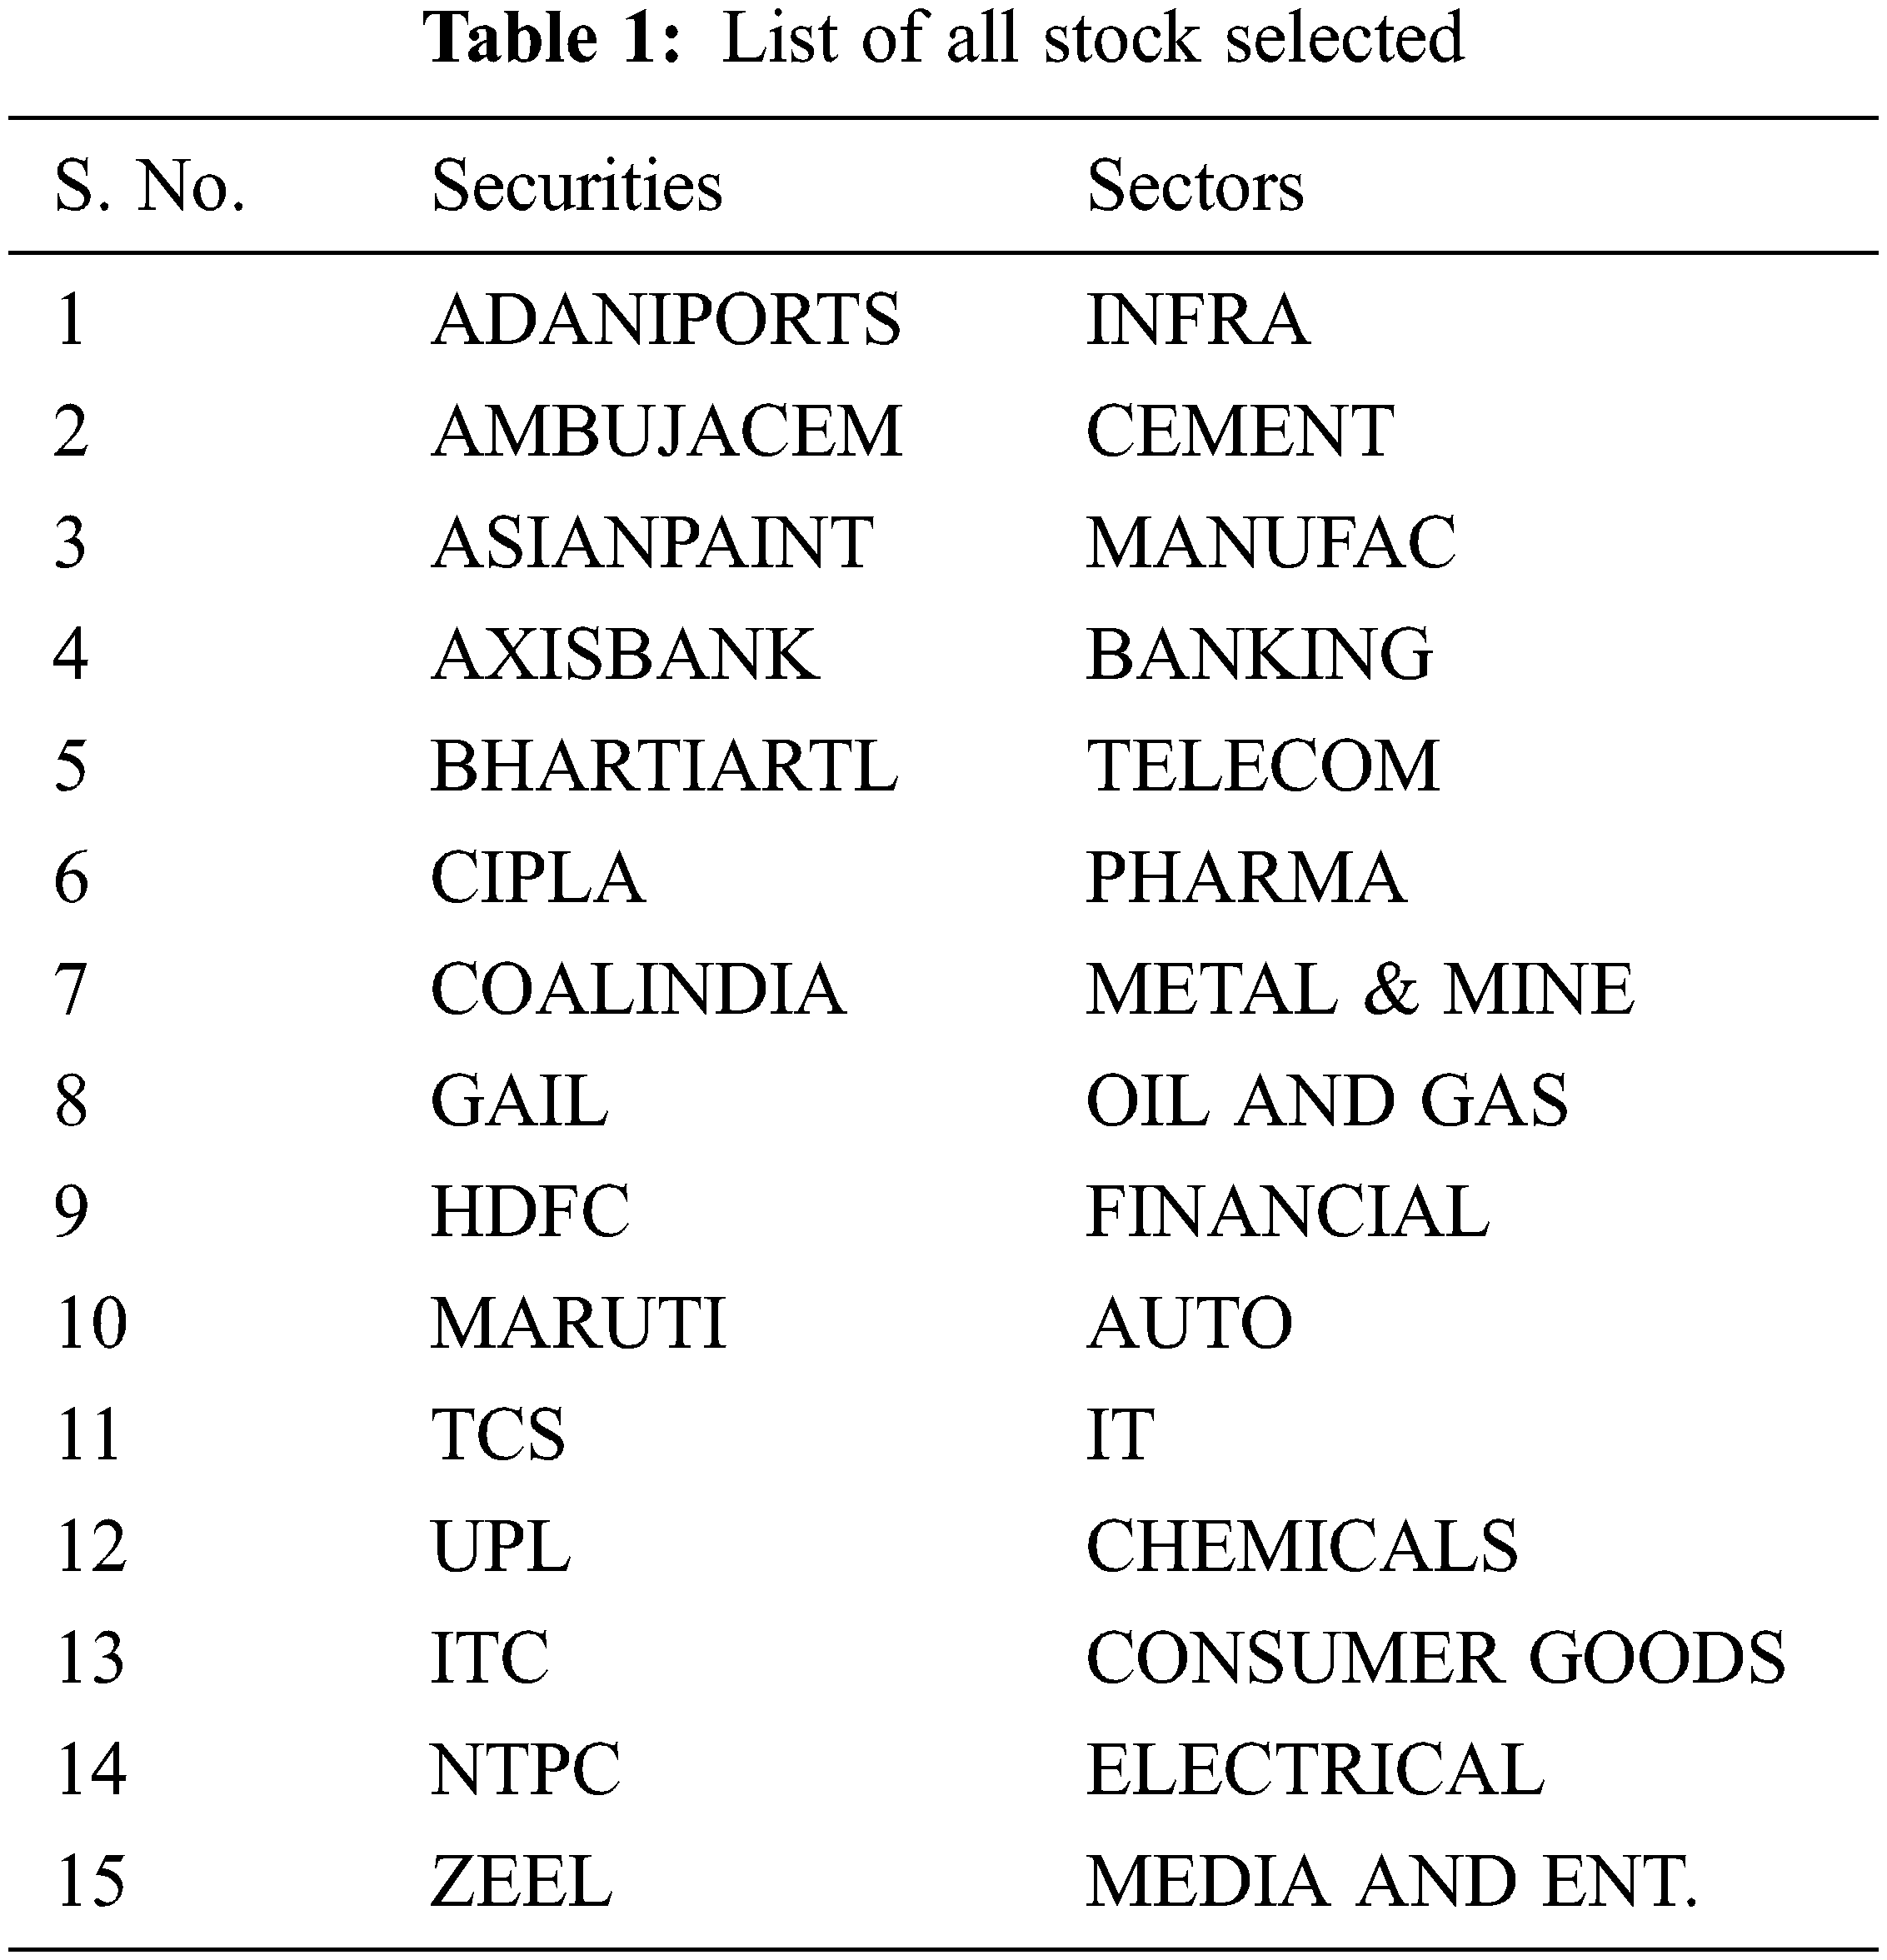
All Stocks in NSE are divided into sectors each sector has hundreds of stocks. There are a total of fifteen sectors. Thus decide to select one stock from each sector for optimal system performance: For example, see Tab. 1.
4.1.2 Data Format of Downloaded Files
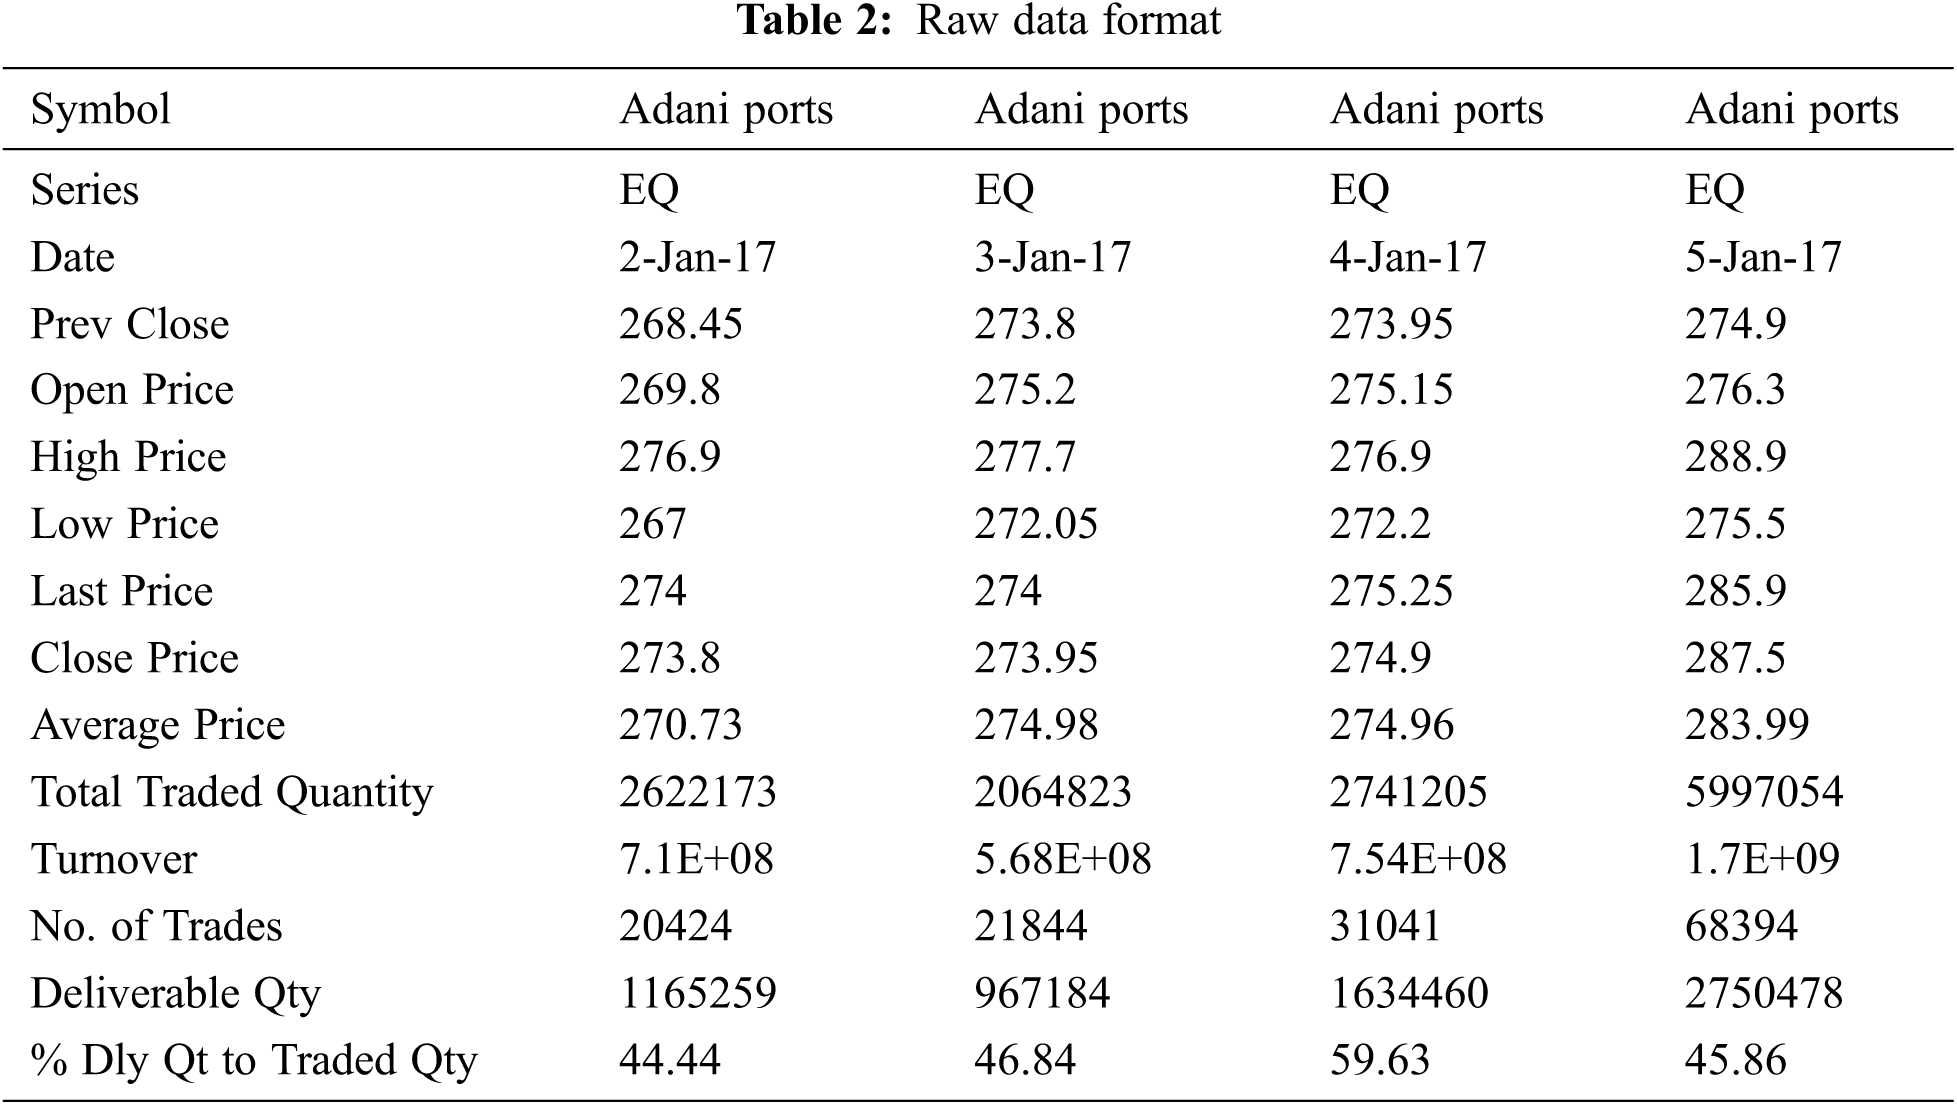
The data format was received in comma separated values (.csv) files. For example see Tab. 2 raw data format.
The stock entity table is created and records the value of every stock available for evaluation. All stocks entities include columns like StockId, Stock Name, Sector of that particular stock, Current P/E Ratio of that particular stock, Dividend Yield, Root mean square error value to forecast. The Fig. 1. The entity relationship diagram clearly shows the three types of entities.
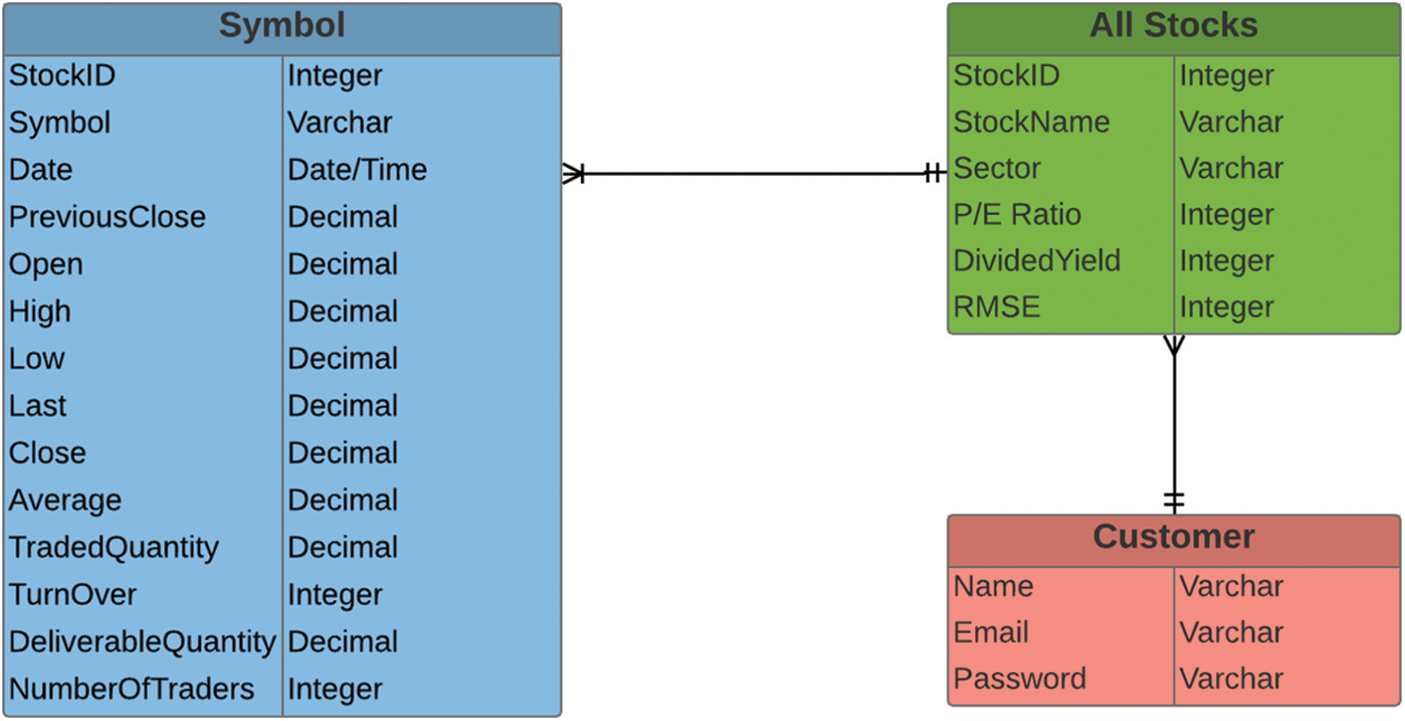
Figure 1: Entity diagram of data set
There exist fourteen stock entity tables all linked to the “All Stocks” table, each of the stock tables is named after the symbol of that entity. This table records daily data of every stock traded in the last three years, one row for each day. It includes columns like StockId, Symbol, Date, Previous Close, Open, High, Low, Close, Last, Average, Traded Quantity, TurnOver, Deliverable Quantity, Number of Trades.
Customer Table, records the login ID of every customer. This table is updated at the time of new customer registration. It stores data like Name, Email, and Password.
4.2.1 Description of Each Attribute
All Stocks (Entity)
Stock ID: ID Assigned to each stock (Primary Key), Name: Name of Stock, Sector: Sector to which Stock Belongs, P/E Ratio: Price to Earnings ratio, Dividend Yield:-Stipend distributed by securities to stockholders per share percentage, and RMSE: Root Mean Square Error of testing data of each stock.
Stocks (Entity)
StockID: ID Assigned to each stock (Primary Key), Symbol: Symbol of the stock, Date: Date of the data that row represents, Previous Close: The -closing price of previous day, Open: Opening price of that particular day, High: Recorded High Value of the day, Low: Recorded Lowest traded stock of the day, Last: Price of the Last stock Traded, Close: Closing Price of the stock of that particular day, Average: Average price of the stock throughout the day, Traded Quantity: Total Amount of trade on that day, TurnOver: TurnOver of that particular day and company, Deliverable Quantity: Number of stocks that need to be delivered to new shareholders within two days, and Number Of trades: Number of Stocks Traded.
The java programming language is used in the proposed model. Java is a general purpose programming language that is pure Object Oriented. However, using machine learning in java is not an easy task as there is no suitable predefined function. The stock market prediction system uses three different algorithms namely Holt-Winters Triple Exponential Algorithm, Recurrent Neural Network, Recommendation System.
The proposed model uses Java IDE (Integrated Development Environment) NetBeans 8.1 to simulate and analyze the results. This research work operates as a Java standalone application in the independent platform and requires MySQL as well as the latest JDK (Java Development Kit) to execute the proposed model.
This proposed model provides a single jar file that can be transferred to any platform to run the required code. Also used many libraries for deep learning as well as user interface development. All the libraries used are open source and registered under open source License.
The implementation can easily be divided into three sections. These three sections are different concepts and use different algorithms, let’s discuss them
• Holt-Winters Triple Exponential Algorithm: This algorithm is used to give time series forecast of the closing price of stocks that uses three factors which are discussed in the following chapter
• Recurrent Neural Network: Long Short Term Memory RNN is part of deep learning algorithms and used for stock price prediction.
• Recommendation System: This algorithm gives us the best possible way to recommend a particular stock to the user by giving each stock a rating based on different factors.
This proposed method mainly works on three major concepts. The proposed system provides three years of data of fifteen stocks and wants to predict the next quarter of next year. Thus, visualize 750 rows of historical data of each security and wish to predict the closing price of the next 59 days.
5.1 Holt-Winters Triple Exponential Smoothing Algorithm
Holt-Winters Triple Exponential Algorithm is used when data exhibits trend or reasonability. It captures the level of demand as well as trend overtime. The proposed method break demand observation into 3 components they are Baselevel, Trend, and Seasonal Factor.
When the forecast is developed the proposed algorithm is used to recompose the demand expectation by summing up all three elements. It is exponential smoothing with trend and seasonality, thus the reason the proposed model used smoothing factors.
The proposed model differ and break down demand observation into three components, then apply a smoothing constant to each one of them, that is the reason the model have three smoothing factors ie. α, β, γ. Start with the first period of data and take the actual demand observation to subtract it from average demand observation of the course of 3 years. Here the proposed method takes 2 weeks of data then drag down the same formula from the remaining weeks of the year. It will all sum up to 0 as average demand was subtracted from each actual demand.
Start from week 52 to the final base level and subtract seasonable factors from actual demand. The basic equations for their method are given in Eqs. (1)–(4)
where ‘y’ is the observation, ‘S’ is the smoothed observation, ‘b’ is the trend factor, ‘I’ is the seasonal index, ‘F’ is the forecast at m periods ahead, ‘T’ is an index denoting a time period. Assigned base level Alpha equal to 0.200, Betta equal to 0.300 and gamma equal to 0.200. The combination of these three factors gives the best yield of the Week 53 actual demand minus seasonal factor of week. Break POS into three distinct components and they are estimated. Two different ways of estimating each of these components and weight them by applying the respective weighting factors. Simply copy them down throughout the remainder of week 5 of Years 3.
Now, the week forecast of week 6 of year 3 till end of week 52 of year 3. Most recent seasonal factors is week 6 of year 2, then drag down for a year and need to separate training data as well as testing data.
To achieve an error ratio from the proposed algorithm, first prepare the model and then run the algorithm on testing data. The received RMSE from the error parameter.
Training Data is from 01/012015 to 31/09/2017 counting total rows up to 743 rows.
Testing Data is from 01/10/2017 to 31/12/2017 counting total rows up to 59 rows.
Forecasted Data is from 01/01/2018 to 31/03/2018 counting total rows up to 58 rows.
LSTM or Long Short-Term Memory is an evolution of a Recurrent Neural Network, commonly known as RNN. Normal RNN module took the output of the last layer over a single Tanh function. LSTM uses feedback loops and gates to remember. It has four interacting RNNs layers in each module.
The Core idea behind LSTMs is the “module state” β, β is the main chain of data flow. In a neural state, it allows data to flow almost unchanged albeit some linear transformations. The add/remove data from β via sigmoid “gates” in LSTM can be used, though the implementation of LSTM modules differ.
In LSTM if the output gets output multiplied repeatedly even by 1 then the output gets smaller quickly and this reduces the learning rate. LSTM behaves. Differently, they have 4 functions in one module state which allows the LSTM modules to loop both LSTM memory.
Gates takes the input and then decides how much data used to update the module state. Example, Sigmoid, 1 decides how much of the input should be used to update. For instance of 0, it does not update anything but for 1 it updates the whole module state or anything in between. It’s the neurons, to keep the long term memory of intermediate results.
Example - Time Series Approach:
This approach has the following steps:
1) SIN wave predictor
2) Load 500 1 time periods
3) Split into windows of length 50
4) Split into train/test sets (90/10)
5) Reshape into numpy array
3Dimentional Array
- total windows, window size, 1
-
Steps to follow:
1) Create LSTM model
-(1,50,100,1)
-50 and 100 are LSTM neurons
-1 fully connected output (linear activation)
2) Train the model
-Only require 1 epoch
3) Test Prediction for next 500 steps
-Initialize with 1st sequence of testing data
-Feed forward sequence windows to get singular next step prediction
-Shift sequence windows to remove 0th element and push predicted value as nth element.
-After >50 steps window will be only predicting on predictions.
5.3 Modified Recommendation System
Subclass of information filtering system that seeks to predict the best possible stock available for the user. A normal recommendation system would accept the values that are Boolean for example a commodity being liked or disliked. However the proposed model uses a weighted recommendation system. This will accept the various factors of the stock market as its parameter to compare different stock prices. Let’s discuss these factors first (Table 3).
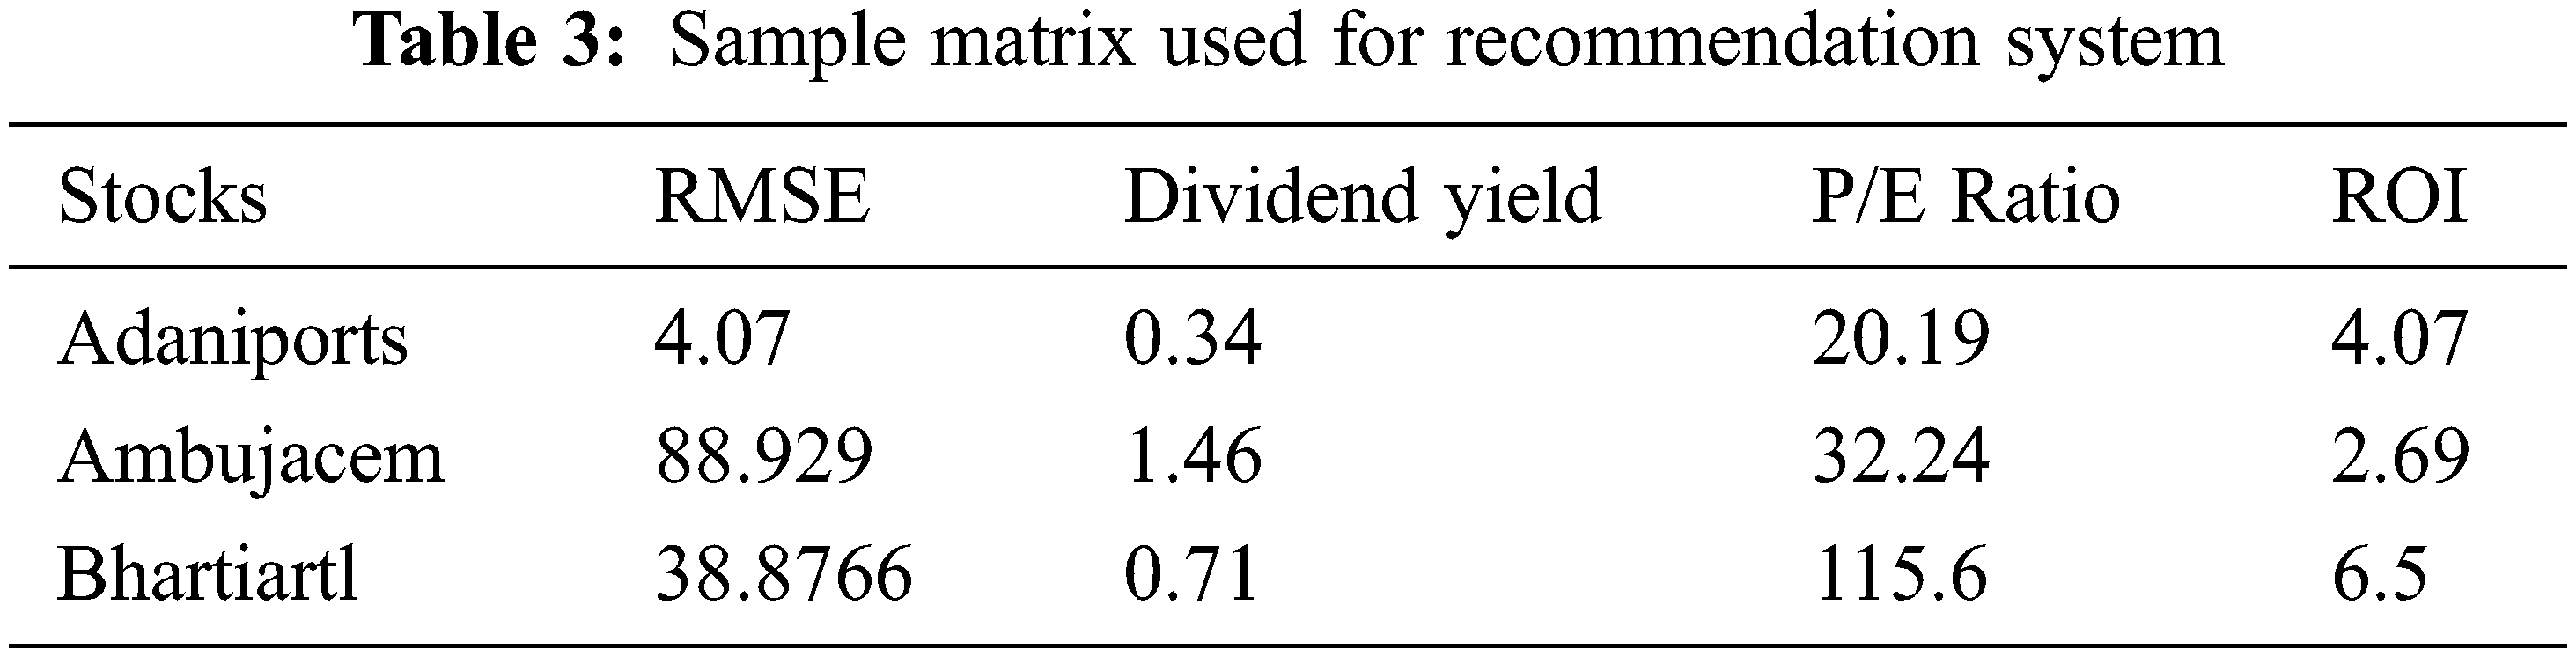
RMSE: Root Mean Square Error, received the RMSE values when forecasted the data using RNN algorithm or Holt-Winters triple exponential algorithm. This factor gives an accuracy rate of prediction. If the higher RMSE value, it gives lower rating to the stock and if the lower value of RMSE, it says the forecast is good and trusts the reading. Thus the proposed model gives a higher rating to that stock.
Dividend Yield: Dividend Yield is a percentage value that stays common for the particular stock. In reality the stock market securities give dividends to their shareholders as any commodity. This is given once every month or quarterly as an incentive to long term investors to hold their stocks also this dividend value varies directly proportional to the profits of security. Thus more the dividend yield better the stock and vice versa.
P/E Ratio: Price Earnings Ratio. It is the ratio of price per share upon earning per share. This basically gives the price status of the stock. The price-earnings ratio is the ratio for evaluating a company that measures the current share price to its per-share earnings. The price-earnings ratio is also sometimes known as the price multiple or the earnings multiple. This gives the evaluation of the stock, larger P/E ratio means stock price is overrated and going to fall anytime thus the proposed model chose the lower rating and vice versa.
ROI: Stands for Return On Investment, this can be calculated as
This is a percentage quantity if the Return on Investment is more, then the better rating is given to the stock.
After giving ratings to each of the user, the proposed model displays all available options to buy stock from the sorted list in the recommendation system.
6 Validation for Actual and Predicted Values
The validation phase is important to determine the accuracy of the predicted values. This proposed method mainly works on three techniques and provided with three years of data of fifteen stocks. The proposed model predicts the next quarter of next year. It has visualized the 750 rows of historical data of each security and to predict the closing price of next 59 days and taken the training data from 01/012015 to 31/09/2017 and the testing data from 01/10/2017 to 31/12/2017. The proposed model forecasted data from 01/01/2018 to 31/03/2018 and uses Holt-Winters algorithm as well as recurrent neural network. The accuracy of predicted value is validated using root me square error. The historical data of TCS stock price are depicted in Fig. 2

Figure 2: Historical data of TCS stock price
The actual and forecasted values are depicted in Fig. 3 and list of stocks are suggested by recommended system in Fig. 4

Figure 3: Forecasted value of TCS stock price

Figure 4: Recommendation system suggesting list of stocks
The forecasted values for different stocks are validated by recommended systems and shown in Fig. 5

Figure 5: Forecasted values for different stocks
The stock market prediction tool was executed and displayed desired results from a real-time dataset. The sample database chosen worked fine for the system and represented the behavior of every sector correctly. Further, the forecasting algorithms like Holt-Winters algorithm and Recurrent Neural Network LSTM forecasted the closing price of one quarter of the year from 01-01-2018 to 31-03-2018 with an average RMSE value of less than 50 in many cases. The recommendation system also worked properly displaying the best stock to buy in a given interval of time.
The future work will be focused on implementation in Machine Learning, Automated data collection, and Artificial Intelligence concept. So that the prediction accuracy will be improved.
Funding Statement: The authors received no specific funding for this study.
Conflicts of Interest: The authors declare that they have no conflicts of interest to report regarding the present study.
1. Y. Bengio, A. Courville and P. Vincent, “Representation learning: A review and new perspectives,” IEEE Transactions on Pattern Analysis & Machine Intelligence, vol. 35, no. 8, pp. 1798–1828, 2013. [Google Scholar]
2. T. Mikolov, M. Karafiat, L. Burget and J. Cernocky, “Recurrent neural network based language model,” in Proc. Conf. of the Int. Speech Communication Association, USA, pp. 1045–1048, 2010. [Google Scholar]
3. D. Selvamuthu, V. Kumar and A. Mishra, “Indian stock market prediction using artificial neural networks on tick data,” Financial Innovation, vol. 5, no. 1, pp. 5–16, 2019. [Google Scholar]
4. A. Sharma, D. Bhuriya and U. Singh, “Survey of stock market prediction using machine learning,” in Proc. Int. Conf. of Electronics, Communication and Aerospace Technology, vol. 2, USA, pp. 506–509, 2017. [Google Scholar]
5. S. Vazirani, A. Sharma and P. Sharma, “Analysis of various machine learning algorithm and hybrid model for stock market prediction using python,” in Proc. Int. Conf. on Smart Technologies in Computing, Electrical and Electronics, India, pp. 203–207, 2020. [Google Scholar]
6. W. Chen, Y. Zhang, C. K. Yeo, C. T. Lau and B. S. Lee, “Stock market prediction using neural network through news on online social networks,” in IEEE Int. Smart Cities Conf. (ISC2), China, pp. 1–6, 2017. [Google Scholar]
7. V. Cho, “MISMIS - A comprehensive decision support system for stock market investment,” Knowledge Based System, vol. 23, no. 6, pp. 626–633, 2010. [Google Scholar]
8. K. Inuzuka, T. Hayashi and T. Takagi, “Recommendation system based on prediction of user preference changes,” in Proc. IEEE WIC ACM Int. Conf. on Web Intelligence, Omaha, NE, USA, pp. 192–199, 2016. [Google Scholar]
9. Y. Wang and Y. Wang, “Using social media mining technology to assist in price prediction of stock market,” in IEEE Int. Conf. on Big Data Analysis, China, pp. 1–4, 2016. [Google Scholar]
10. Q. Li, Y. Chen, J. Wang, Y. Chen and H. Chen, “Web media and stock markets: A survey and future directions from a big data perspective,” IEEE Transactions on Knowledge and Data Engineering, vol. 30, no. 2, pp. 381–399, 2018. [Google Scholar]
11. W. Yuji, “A trust prediction method for recommendation system,” in Proc. Int. Human Machine Systems and Cybernetics, Hangzhou, China, pp. 64–68, 2017. [Google Scholar]
12. J. T. Mentzer and R. Gomes, “Further extensions of adaptive extended exponential smoothing and comparison with the M-Competition,” Journal of the Academy of Marketing Science, vol. 22, no. 4, pp. 372–382, 1994. [Google Scholar]
13. M. Alsulmi, “Reduced manual effort to label stock market data by applying a metaheuristics search: A case study from the Saudi stock market,” IEEE Access, vol. 9, pp. 110493–110504, 2021. [Google Scholar]
14. S. M. Idrees, M. A. Alam and P. Agarwal, “A prediction approach for stock market volatility based on time series data,” in IEEE Access, vol. 7, pp. 17287–17298, 2019. [Google Scholar]
15. W. Bao, J. Yue and Y. Rao, “A Deep Learning Framework for financial time series using stacked autoencoders and long short term memory,” Plos One, vol. 12, no. 7, China, pp. 1–24, 2017. [Google Scholar]
16. G. Li, M. Xiao and Y. Guo, “Application of deep learning in stock market valuation index forecasting,” in Proc. IEEE 10th Int. Conf. on Software Engineering and Service Science, pp. 551–554, 2019. [Google Scholar]
17. J. Lee, R. Kim, Y. Koh and J. Kang, “Global stock market prediction based on stock chart images using deep Q-Network,” IEEE Access, vol. 7, pp. 167260–167277, 2019. [Google Scholar]
18. M. Nabipour, P. Nayyeri, H. Jabani, S. Shahab and A. Mosavi, “Predicting stock market trends using machine learning and deep learning algorithms via continuous and binary data: A comparative analysis,” IEEE Access, vol. 8, pp. 150199–150212, 2020. [Google Scholar]
19. Y. Sun, M. Fang and X. Wang, “A novel recommendation system using Guba sentiment analysis,” Personal and Ubiquitous Computing, vol. 22, no. 3, pp. 575–587, 2018. [Google Scholar]
20. D. Shah, H. Isah and F. Zulkernine, “Predicting the effects of news sentiments on the stock market,” in IEEE Int. Conf. on Big Data Analysis, USA, pp. 4705–4708, 2018. [Google Scholar]
21. S. Kalra and J. S. Prasad, “Efficacy of news sentiment for stock market prediction,” in Proc Int. Conf. on Machine Learning, Big Data, Cloud and Parallel Computing, India, pp. 491–496, 2019. [Google Scholar]
22. B. Wang, H. Huang and X. Wang, “A novel text mining approach to financial time series forecasting,” Neurocomputing, vol. 83, no. 6, pp. 136–145, 2012. [Google Scholar]
23. Z. Guo, H. Wang, Q. Liu and J. Yang, “A feature fusion based forecasting model for financial time series,” Plos One, vol. 9, no. 6, pp. 172–200, 2014. [Google Scholar]
24. M. C. R. Leles, M. V. L. Pereira, R. A. Iquiapaza, E. F. Sbruzzi and C. L. Nascimento Júnior, “Evaluation of technical analysis trading rules in a artificial stock market environment,” IEEE Latin America Transactions, vol. 18, no. 10, pp. 1707–1714, 2020. [Google Scholar]
25. R. Ren, D. D. Wu and T. Liu, “Forecasting stock market movement direction using sentiment analysis and support vector machine,” IEEE Systems Journal, vol. 13, no. 1, pp. 760–770, 2019. [Google Scholar]
26. N. Sharma and A. Juneja, “Combining of random forest estimates using LSboost for stock market index prediction,” in Proc. Int. Conf. for Convergence in Technology, India, pp. 1199–1202, 2017. [Google Scholar]
27. A. J. Balaji, D. S. H. Ram and B. B. Nair, “Applicability of deep learning models for stock price forecasting an empirical study on BANKEX data,” in Proc. Int. Conf. on Computing Intelligence and Data Science, India, pp. 947–953, 2018. [Google Scholar]
28. M. Hiransha, E. A. GopalaKrishnan, V. K. Menon and K. P. Soman, “NSE stock market predicition using deep-learning models,” in Proc. Int. Conf. on Computing Intelligence and Data Science, India, pp. 1351–1362, 2018. [Google Scholar]
29. S. O. Ojo, P. A. Owolawi, M. Mphahlele and J. A. Adisa, “Stock market behavior prediction using stacked LSTM networks,” in proc. Int. Multidisciplinary Information Technology and Engineering Conf., India, pp. 1–5, 2019. [Google Scholar]
30. M. Mohan and T. Shrimali, “Back propagation network approach for prioritizing test cases in regression testing,” Journal of Advanced Research in Dynamical and Control System, vol. 9, no. 2, pp. 1791–1804, 2017. [Google Scholar]
 | This work is licensed under a Creative Commons Attribution 4.0 International License, which permits unrestricted use, distribution, and reproduction in any medium, provided the original work is properly cited. |