DOI:10.32604/iasc.2023.026243
| Intelligent Automation & Soft Computing DOI:10.32604/iasc.2023.026243 | |
| Article |
IM-EDRD from Retinal Fundus Images Using Multi-Level Classification Techniques
1Department of Computer Science and Engineering, R.M.K. Engineering College, Chennai, 601206, India
2Department of Computer Science and Engineering, School of Engineering and Technology, Christ University, Bengaluru, 560029, India
*Corresponding Author: M. P. Karthikeyan. Email: mpk.cse@rmkec.ac.in
Received: 20 December 2021; Accepted: 17 February 2022
Abstract: In recent years, there has been a significant increase in the number of people suffering from eye illnesses, which should be treated as soon as possible in order to avoid blindness. Retinal Fundus images are employed for this purpose, as well as for analysing eye abnormalities and diagnosing eye illnesses. Exudates can be recognised as bright lesions in fundus pictures, which can be the first indicator of diabetic retinopathy. With that in mind, the purpose of this work is to create an Integrated Model for Exudate and Diabetic Retinopathy Diagnosis (IM-EDRD) with multi-level classifications. The model uses Support Vector Machine (SVM)-based classification to separate normal and abnormal fundus images at the first level. The input pictures for SVM are pre-processed with Green Channel Extraction and the retrieved features are based on Gray Level Co-occurrence Matrix (GLCM). Furthermore, the presence of Exudate and Diabetic Retinopathy (DR) in fundus images is detected using the Adaptive Neuro Fuzzy Inference System (ANFIS) classifier at the second level of classification. Exudate detection, blood vessel extraction, and Optic Disc (OD) detection are all processed to achieve suitable results. Furthermore, the second level processing comprises Morphological Component Analysis (MCA) based image enhancement and object segmentation processes, as well as feature extraction for training the ANFIS classifier, to reliably diagnose DR. Furthermore, the findings reveal that the proposed model surpasses existing models in terms of accuracy, time efficiency, and precision rate with the lowest possible error rate.
Keywords: Retinal fundus images; exudate; diabetic retinopathy; SVM; ANFIS; morphological component analysis
According to a recent World Health Organization (WHO) survey, India has the world's largest diabetic population, with 80% of diabetics susceptible to exudates and diabetic retinopathy. Exudates are commonly thought to be the first symptoms of Diabetic Retinopathy (DR). Exudates in the eyes are caused by protein and lipid leaking in the retina caused by damaged blood nerves. Fig. 1 depicts normal (A) and abnormal (B) retinal pictures, as well as exudates and diabetic retinopathy. Early diagnosis of exudates and DR can significantly lower the risk of blindness in diabetic individuals. A closer look at the retina is required for this, as is severe pupil dilation.
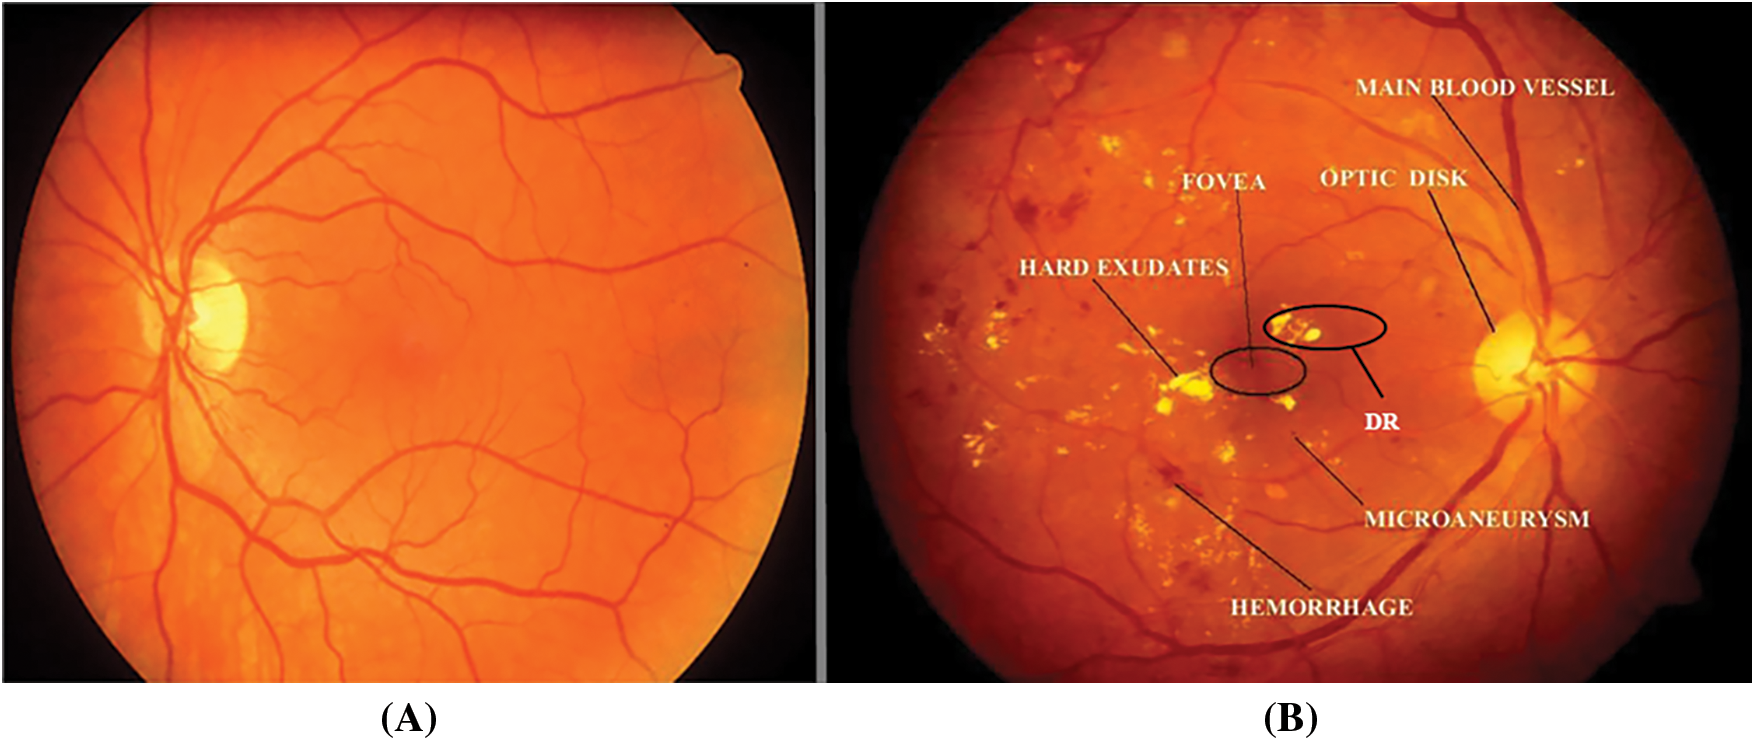
Figure 1: Retinal images (A). normal image and (B). abnormal image with DR and exudates
It is critical for patients with DR symptoms to monitor their retinal health in order to avert blindness. Exudates, which are the lipid peaks of blood vessels that appear in the early stages of diabetic retinopathy, are also to be detected in the retina [1]. The process is evaluated using colour fundus photographs of aberrant retinal characteristics, as discussed previously. Because ophthalmologists’ manual illness analysis and identification takes time, automated detection models are in high demand. The extra benefits are cost effectiveness and time savings. Image processing methods are reportedly used for calculating the size, position, and severity rate of exudates and DR in input fundus images for this purpose.
Exudate's lesion destroys the tiny blood vessels of the retina. Nonetheless, the pathogenic facts are not accurately realised because the qualities are distinct and easily noticed. Exudates are classified into three categories in general:
1. Soft Exudates
2. Encircled plaques of exudates
3. Hard Exudates
The hard exudates have deep yellow spots in the retina; the surrounding plague exudates vary in size and are in the shape of a modest lipo-protein accumulation. In the concrete retina, soft exudates have a pale-yellow colour. Furthermore, the exudates differ in size, shape, and colour spectrum. The exudates lesion is a deep area with greater pixel intensity and somewhat distinct margins [2]. Furthermore, the non-proliferative DR demonstrates the exact and primary indications of DR. Early diagnosis of this condition is a time-consuming and inefficient process for clinical assistants. Because there are no early indicators of diabetic retinopathy, regular eye exams are the only method to detect it. However, most diabetic patients do not have frequent check-ups for a variety of reasons [3]. According to the work [4] eye analysis can take up to a year to evaluate the eye retinal images.
Some current works serve as models for automated retinal image analyses in disease diagnosis. The model in [5] proposes a mechanism for identifying DR by effective classification training utilising 1273 retinal pictures. For hard exudates detection, [6] presents a median filter-based object segmentation and dynamic thresholding-based image processing approach. Reference [7] presents a detection strategy for brilliant exudates, and [8] presents a wavelet transform-based model detection for hard exudates. The Integrated Model for Exudate and Diabetic Retinopathy Diagnosis (IM-EDRD) with multi-level classifications is used in this paper to detect and categorise both diabetic retinopathy and exudates. The following are the suggested model's contributions:
i) A multi-level classification model for diagnosing Exudate and Diabetic Retinopathy from retinal fundus images is constructed.
ii) For identifying normal and pathological fundus images, Support Vector Machine-based classification is applied, and GLCM-based feature extraction is performed.
iii) In the second level of classification, the Adaptive Neuro Fuzzy Inference System (ANFIS) is used to accurately detect DR and exudates.
iv) ANFIS training is supplied by processing pictures using Morphological Component Analysis (MCA)-based image enhancement and retrieved features.
v) The assessments are performed using images from the datasets E-Ophtha [9] and DIARETDB1 [10], and classification accuracy and time efficiency are measured.
The remainder of this work is structured as follows:
Section 2 describes a literature review based on image processing in the detection of eye diseases. Section 3 details the operation of the Integrated Model for Exudate and Diabetic Retinopathy Diagnosis (IM-EDRD) from input retinal images containing normal and pathological retinal images. Section 4 describes the dataset and its evaluations. Section 5 includes comparison graphics. Section 6 concludes the work by discussing conclusions and future work.
Random Forest (RF) based categorization was utilised in study [11] to detect retinal image anomalies. For image classification, K-means clustering-based segmentation and Machine Learning approaches were used. In [12], diabetic macular edoema was diagnosed using machine learning concepts based on the presence of exudates. Reference [13] used AlexNet and GoogleNet Convolutional Neural Networks to assess the various phases of diabetic retinopathy (CNN). Furthermore, the paper discusses disease malfunctions and the limitations of CNN in retinal image classifications.
In the machine learning-based classification model [14], feature extraction is combined with object edge strength and standard deviation to distinguish regions with and without exudates. Recent study focuses on model analysis of Computer Aided Diagnosis (CAD) for medical image processing, and various works address challenges in DR recognition in [15–17]. The precision in automated retinal lesion detection is hampered due to the specific anatomical nature of the optic disc in the ocular retina. Furthermore, in the study [18], optic disc removal in retinal pictures is processed with the Hough Transform, and the authors [19] derived a novel geometrical parametric model for localising optic disc by surveying several fundus image processing methods. The mathematical model was developed to offer the vessel direction in order to coordinate the disc's centre. The model is tested using 40 photos, including normal and fundus images for illness identification.
Morphological approaches were critical in finding retinal abnormalities in [20]. To process the diverse fundus image features, the morphological functions are defined and operated with various structures. Furthermore, in the first step of segmentation, pure spitting of coloured pictures was performed, followed by morphological operations to produce adequate segmentation results. Furthermore, in the work [21], the multi-class segmentation approach was used in conjunction with ensemble-based classification to determine the localisation of DR. Furthermore, Gabor filter-based pre-processing was performed, and morphological reconstruction techniques were applied to extract features. The photos were classified using trained ensemble classifiers into two categories: exudates and non-exudates.
The authors of [21] developed a model for exudate detection in three stages of processing:
a) Morphological operation-based feature extraction
b) Contour method-based boundary segmentation
c) Exudate Detection Using a Region-wise Classifier
The Markovian segmentation approach was utilised in [22] for object segmentation of retinal pictures with exudates. Following that, a region-wise classifier was employed to detect diseases. [23–25] describes a new approach for identifying diabetic macular edoema that employs wavelet decomposition-based processing and segmentation. The evaluations were conducted out using benchmark datasets and yielded a maximum value of 94% classification accuracy [26–28].
3 Working Process of IM-EDRD with Multi-Level Classifications
For identifying fundus pictures, the proposed IM-EDRD employs the Support Vector Machine (SVM) classification and the Adaptive Neuro Fuzzy Inference System (ANFIS) classifier. The first stage of classification entails classifying normal and abnormal fundus images using Gray Level Co-occurrence Matrix (GLCM)-based feature extraction. The second level of categorization is used to categorise exudates and pictures containing DR. Morphological Component Analysis (MCA)-based techniques are used for proper categorization. The proposed model's workflow is represented in Fig. 2, and the complete technique is described below.
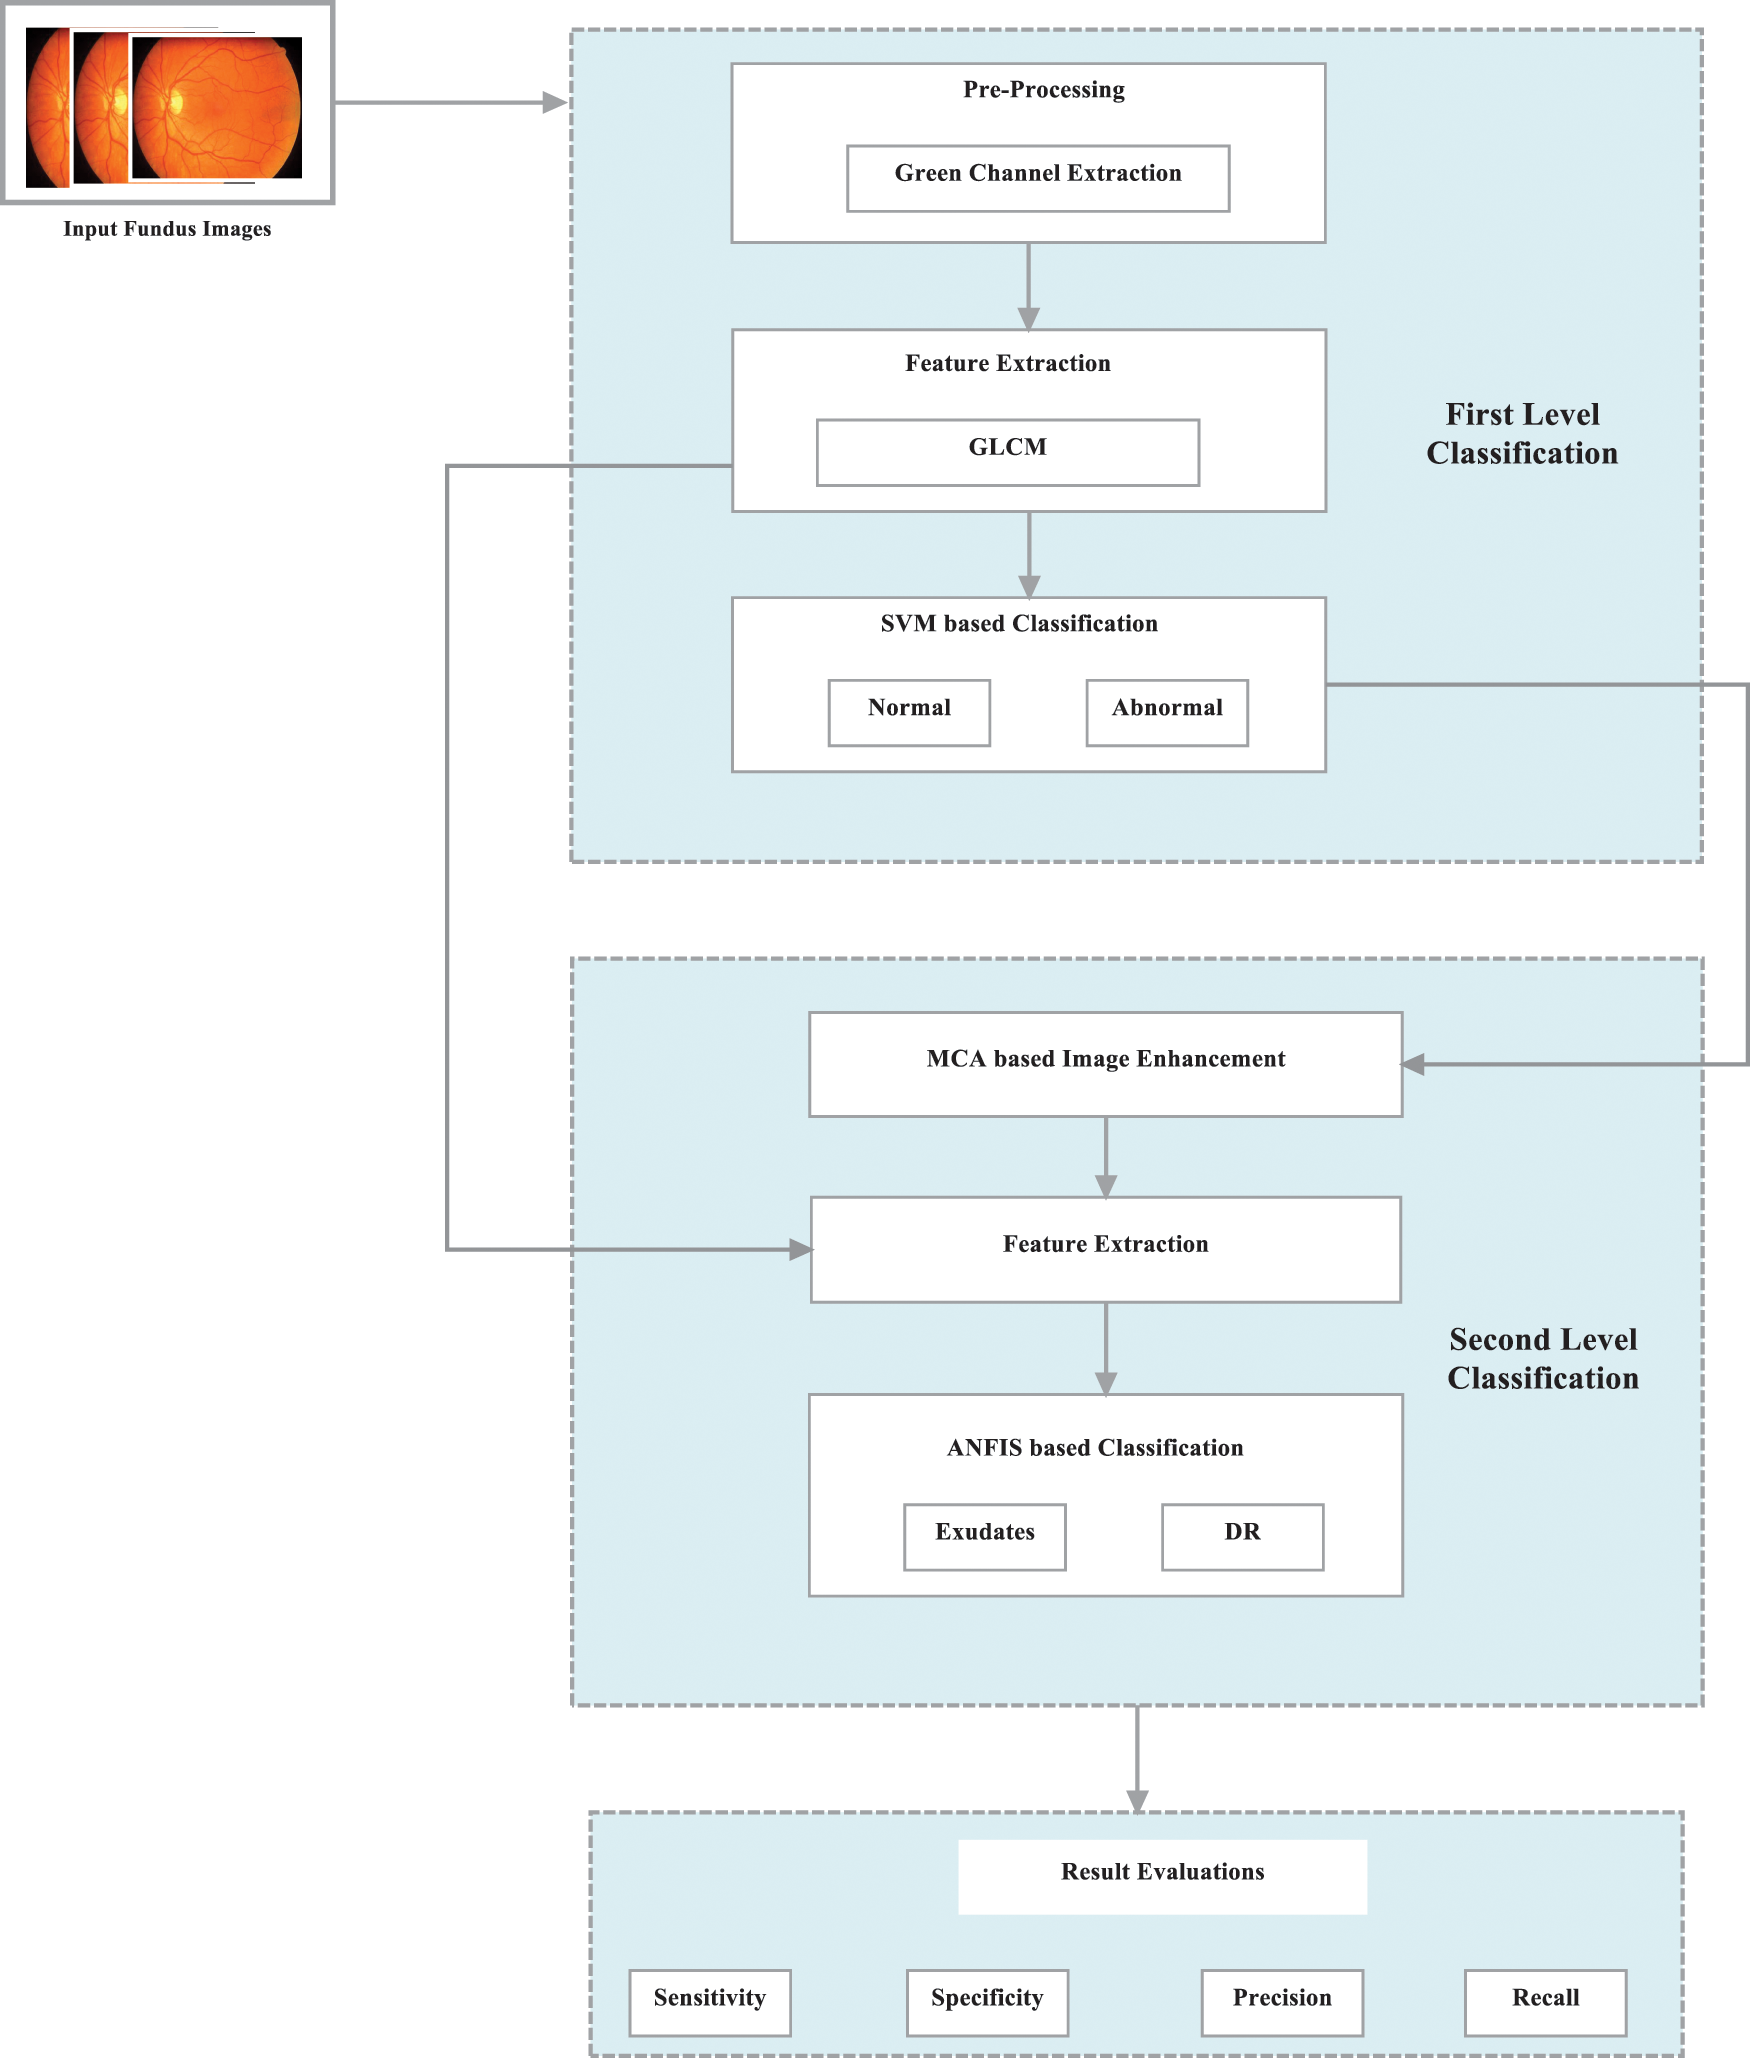
Figure 2: Workflow of IM-EDRD with multi-level classifications
3.1 First Level Classification
This section comprises pre-processing, feature extraction, and SVM-based categorization of normal and abnormal pictures. Furthermore, images from the abnormal class are provided for second level classification in order to properly categorise exudates and DR images.
Image analysis, scaling, and filtering are all part of the pre-processing process. The input photos in this case are taken from benchmark datasets (presented in Section 4). The images are enlarged to 256*256 for implementation purposes, and the undesired noises are removed using a median filter by dividing the retinal pixels into multiple smaller sections. Green channel extraction is then performed on the resultant retinal image with Red, Green, and Blue colour planes. Among these colours, the green plane provides the most visibility and contrast to the impacted area. The plane projects the contrast between exudates, blood vessels, and haemorrhages using proper illumination and saturation point. As a result, the green plane is recovered from the input retinal image, and the resulting sample images are depicted in Fig. 3.
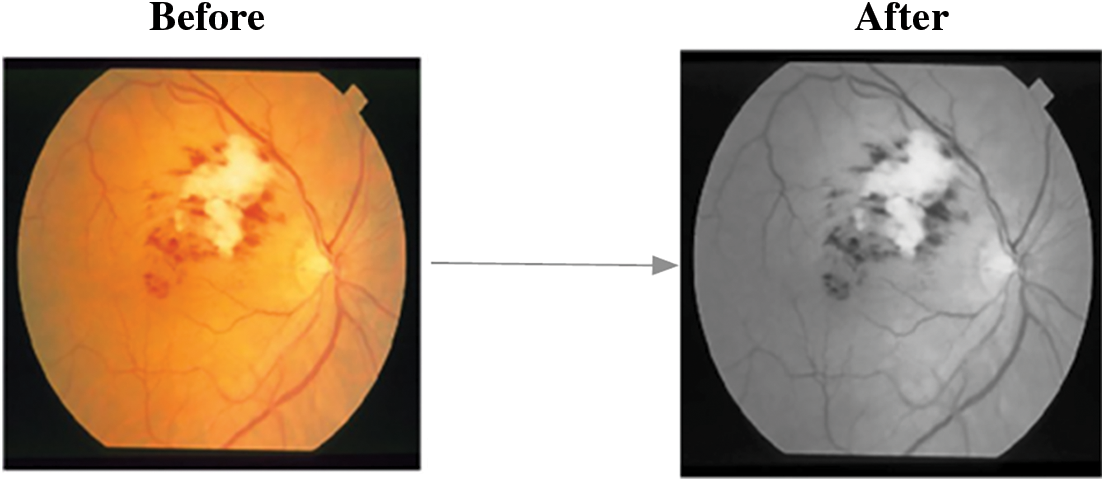
Figure 3: Sample image after green channel extraction
3.1.2 GLCM Based Feature Extraction
In first level classification, the feature extraction process is employed using Grey Level Co-occurrence Matrix (GLCM), that contains pixel positions with similar rates of grey levels. The Co-occurrence matrix is the two-dimensional array which contains rows * columns as they denote the values of images, termed as M v[a, b], where ‘v’ is the displacement vector v = (va, vb) and measuring all pixel-pairs divided by ‘v’ with (va, vb). Using this, 6 distinctive features such as, Contrast, Homogeneity, Entropy, Correlation, Energy and Maximum Probability are evaluated.
i) Contrast
The local differentiations presented in the images are measures as in (1)
Homogeneity:
It denotes the measure of co-occurrence matrix with object distribution on to the matrix diagonals. And, the equation is presented as follows,
ii) Entropy
Entropy measures the uncertainness in intensity distribution and the equation is given as,
Correlation:
Image linearity is calculated and termed as correlation, which are ranges between −1 to +1. The equation is given as,
where, ‘μ’ is the mean and ‘σ’ is the standard deviation.
iii) Energy:
Energy of the input image is computed as the sum of the squared value of each pixels and the equation is given as,
Maximum Probability:
The largest value in the matrix ‘M’ is given as the maximal probability (MP) and its derivation is presented in (6).
3.1.3 SVM Based Classification
Based on a Support Vector Machine Classification is utilised in this case to analyse data and uncover learning patterns for classification and analysis. It uses binary classification to determine the normal and abnormal classes of input retinal pictures. The model points input vector with high dimensional vector space, in which the ideal hyperplane is framed. The following is the etymology of the term hyperplane:
where, ‘X’ is the set of input training samples, ‘A’ perpendicular vector that divides hyper plane and ‘B’ is the offset factor.
In SVM, the testing step is carried out utilising the image features obtained during the training phase and classes based on each training input. The results distinguish between normal and infected retinal images, with normal images requiring no further processing and abnormal images being considered for the second level classification for detecting the presence of exudates and diabetic retinopathy.
3.2 Second Level Classification
The objective of the second level of categorization is to divide retinal images into two categories: exudates and diabetic retinopathy images. To do this, Morphological Component Analysis-based segmentation is used to categorise the condition, hence assisting clinical practitioners exactly.
3.2.1 MCA Based Fundus Retinal Image Segmentation
The major idea of MCA is to process with the distinctive image structures and features. Using MCA, it is applicable to design a signal in linear mixture pattern contains many distinctive morphological elements. Moreover, the morphological components are featured with the redundant dictionaries, measures the result accuracy. The input fundus image is considered as FI0. FIA is the images with some region of blood vessels and FIB is the images without blood vessels. The steps for removing the blood vessels using morphological operations are presented below.
1. Here, ‘S’ denotes the structuring element that processes the image opening function
2. The vessels that are equivalent to ‘S’ are preserved and the others are discarded using,
where, ‘θ’ is the angle between the ‘S’ and blood vessels, ‘Len’ and ‘Wid’ are the length and width of the blood vessels, respectively.
3. Image opening function is performed in 12 different angular positions for enhancing accuracy and the equation is given as,
where, ‘Si’ is the factor of structuring element in ‘i'th angular position.
4. The same operation is performed for FIB and it is given as,
5. The equation of blood vessel separation is given as,
Fig. 4 depicts the corresponding findings after blood vessel elimination, and the steps for MCA-based object segmentation are detailed below.
1. The size of image FI0 is considered as M × M and it is converted into one dimensional vector as M2.
2. The one-dimensional vector is defined as a collection of ‘N’ different input features, which are denoted as,
where, ‘β’ is the image components and it is given as
3. Using the morphological component analysis, each element in ‘Ai’ can be obtained with the optimization issue with the condition, min‖θi‖.
4. Further, the value of ‘θi’ is given as thresholding rate obtained with the remaining marginal element, as in (14).
5. Here, all the elements, except the ‘i’ the element is fixed with the marginal remaining data of the element ‘Ai’.
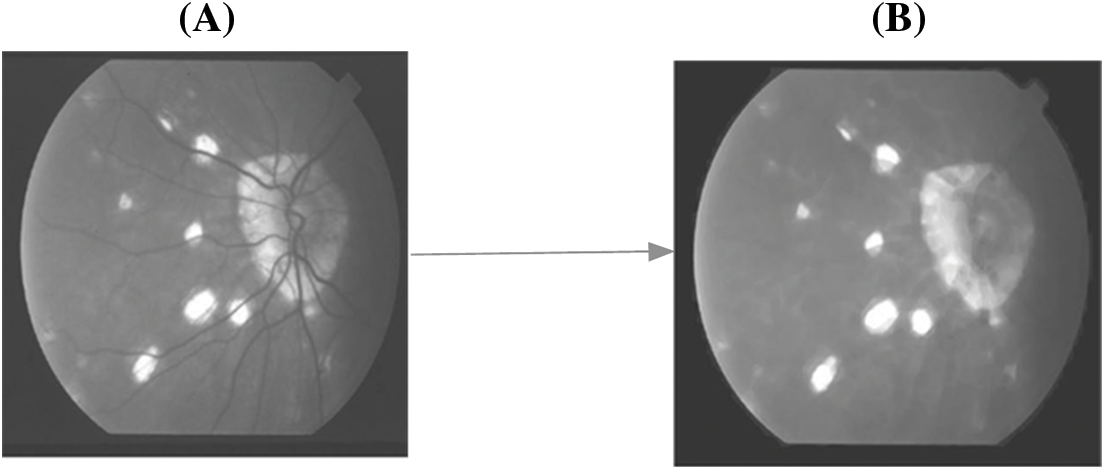
Figure 4: A. FI with blood vessels B. FI without blood vessels
Based on the hard threshold rates, the process continues to obtain all ‘remi’ and the segmented object of the affected area from the fundus image is obtained. The corresponding sample figure is portrayed in Fig. 5.
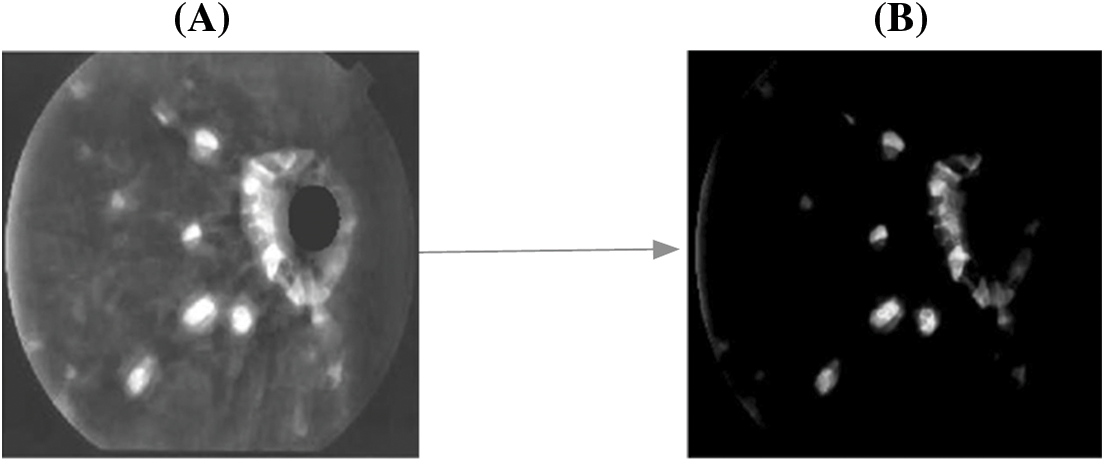
Figure 5: A. Before segmentation B. After segmentation
3.2.2 Adaptive Neuro Fuzzy Inference System (ANFIS) Based Classification
The ANFIS classifier is implemented in this second level of classification to classify exudates and diabetic retinopathy from the aberrant images received from the first level classification results. The classifier is developed using the Sugeno Fuzzy Inference model, which results in an association-based data base, and the rules are built using IF-THEN scenarios. The ANFIS classifier framework is made up of five layers that work together to process the task using the retrieved characteristics.
In the first layer, the feature vector of the input image is translated into values ranging from 0 to 1, which correspond to the linguistic grades Low, High, and Medium. This layer's output is the grade rate of fuzzy elements. The elements with the generalised bell function are listed below.
where, ‘Cw’ is the width, ‘Cc’ is the center and ‘Cs’ is the slope of the curve, respectively.
Further, the curve factors are modified based on the element function and reports the fuzzy logic rules with ‘IF’ condition.
a) The second layer is responsible for developing fuzzy rules throughout the training phase. The output is derived from the IF-THEN rules, and the procedure is carried out using fuzzy logics.
b) The fuzzy logic is derived in the final layer, which is based on normalised computations with some adjustments in the output of the preceding layer.
c) The fourth layer defines the consequent factor, which signifies the to-be-executed THEN condition.
d) In the final layer, the cumulative results are obtained by merging the results of all layers with a single value-based feature vector.
The classifiers show two classes, namely, Exudates and DR; that is, images with hard exudates symptoms and features are classified as DR. Additionally, the Fuzzy Inference based Ruleset is given as,
The classification accuracy in the ANFIS model and its learning model is reliant on proper feature extraction and MCA-based segmentation, which are done well in the proposed model and the results are classified appropriately.
The fundus pictures obtained from benchmark datasets are described in this section. The analysis is carried out with two datasets, namely,
i) E-Ophtha and
ii) DIARETDB1.
The E-Ophtha dataset contains 47 example fundus pictures ranging in resolution from 1400*960 to 2544*1696 pixels. Another dataset, DIARETDB1, includes 89 fundus pictures with pixel rates of 1500 *1152. Those images are recorded using a digitally specified fundus imaging camera with a 500-degree inclination, and the results are examined by five ophthalmologists. The image scale's size is governed by the size of the retinal optic disc. Fig. 6 shows examples of photos from both datasets.
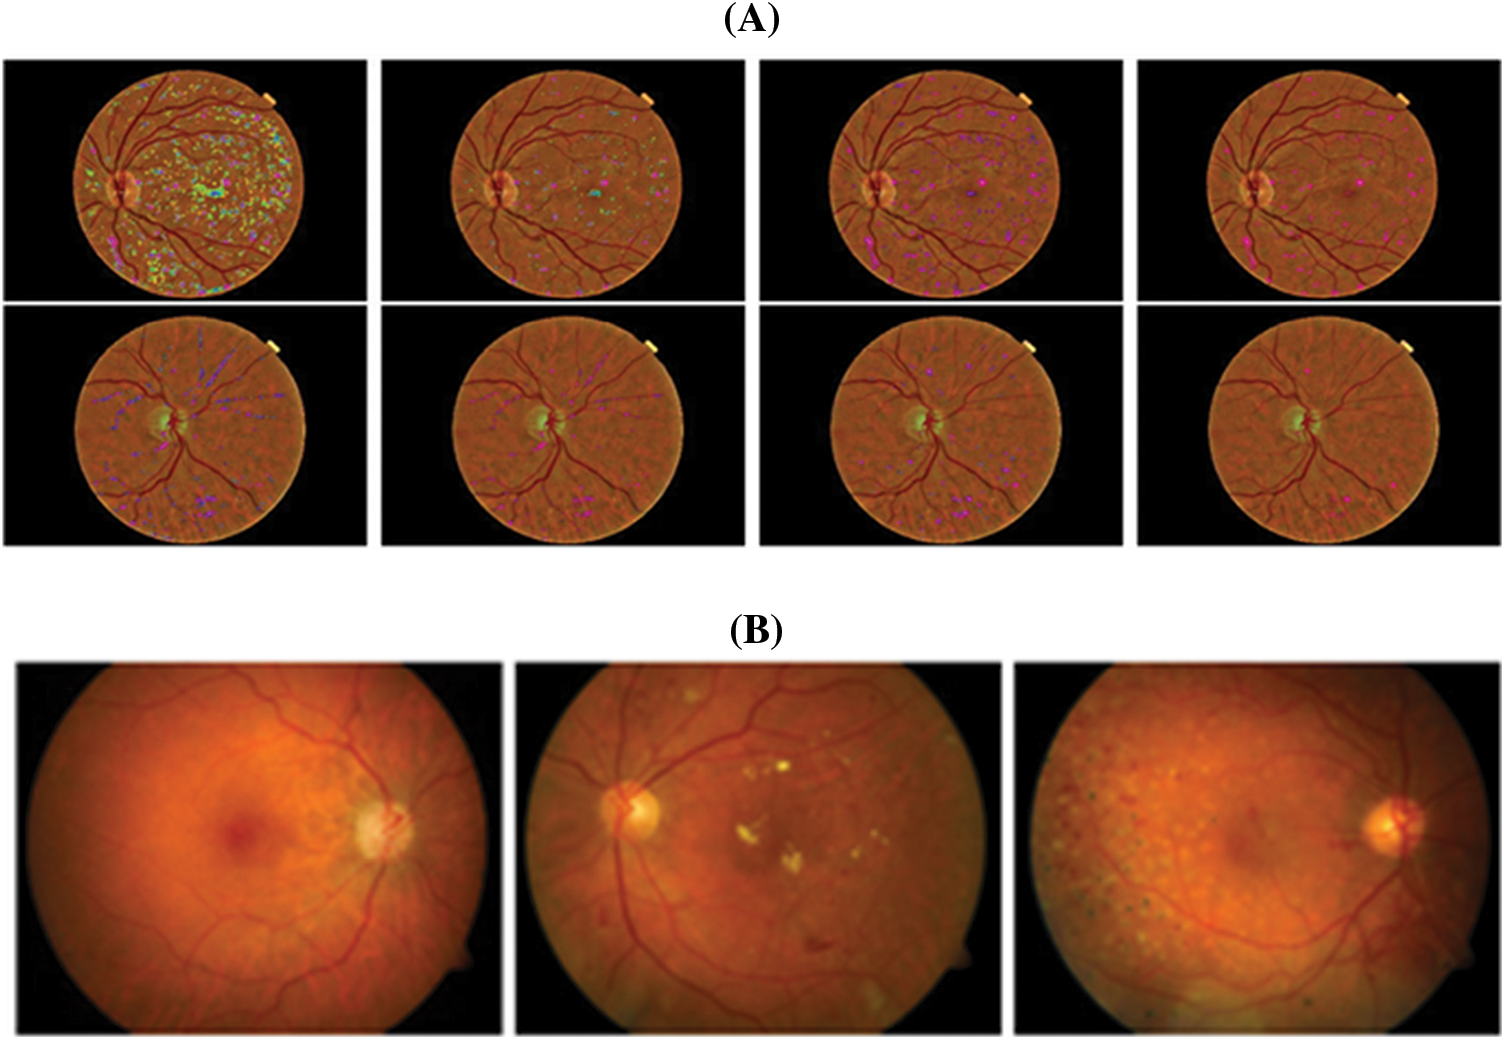
Figure 6: Sample images from datasets A. E-Ophtha and B. DIARETDB1
The proposed model is tested using the simulation programme MATLAB 9.6 R2019a. Classification accuracy, precision rate, F-Score, and Average Error rate are the metrics evaluated for analysis. The classification accuracy is calculated using a cross-analysis of training and testing images. The values of True Positive (TP), True Negative (TN), False Positive (FP), and False Negative (FN) are assessed and examined to ensure the accuracy measure. The True Negative rates are the number of DR images that are correctly categorised as DR. The number of DR images incorrectly categorised as Exudates in the diagnosis results is shown by False Positive. The number of exudates images that have been classified as false negatives is represented by the false negative rate. The number of exudates photos that are correctly categorised is defined as the True Positive rate. The classification accuracy is therefore defined as the ratio of correctly identified photos to the total number of input images evaluated. Because the classification is supplied for k-fold cross validation, the classification model's performance is measured by computing the mean error value. The equation is as follows:
Further, the precision, recall and F-Score is measured with the following Eqs. (18), (19) and (20) for measuring the efficiency of the proposed model.
The suggested model's performance is demonstrated by comparing the results to existing classification models in fundus image processing such as Random Forest (RF), Convoutional Neural Networks (CNN), and Support Vector Machine (SVM).
Figs. 7, 9, and 11 show a comparison of classification accuracy, precision rate, and error rate evaluations with images from the E-Ophtha dataset, respectively. Similarly, the graphs depicted in Figs. 8, 10, and 12 represent the results obtained with the DIARETDB1 dataset.
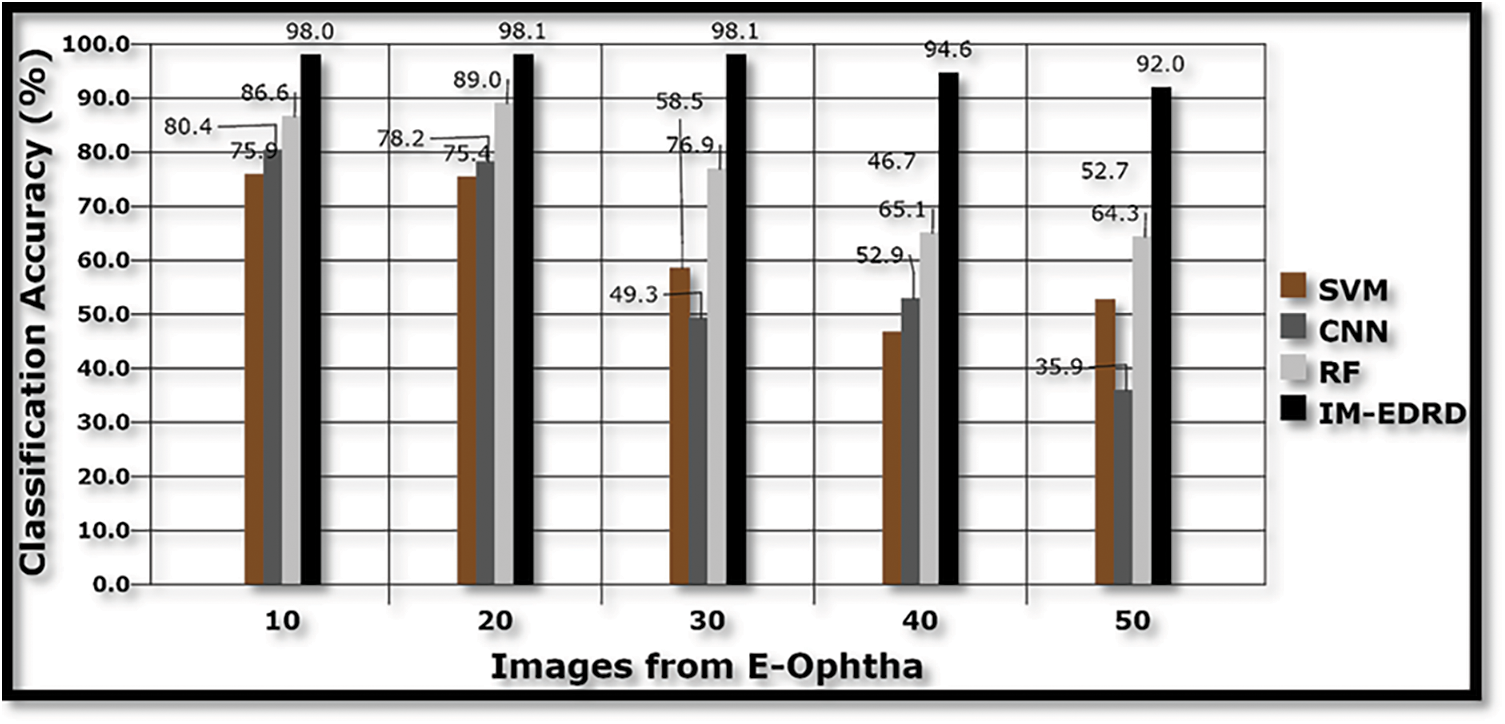
Figure 7: Classification accuracy with E-Ophtha dataset images
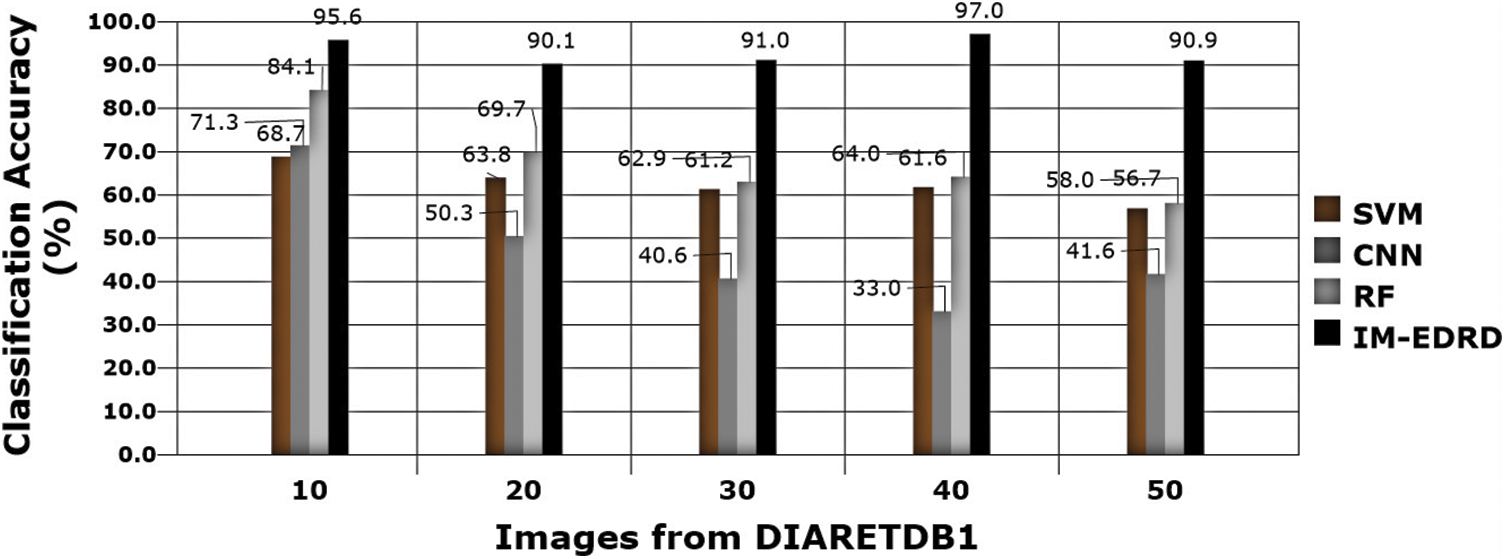
Figure 8: Classification accuracy with DIARETDB1 dataset images
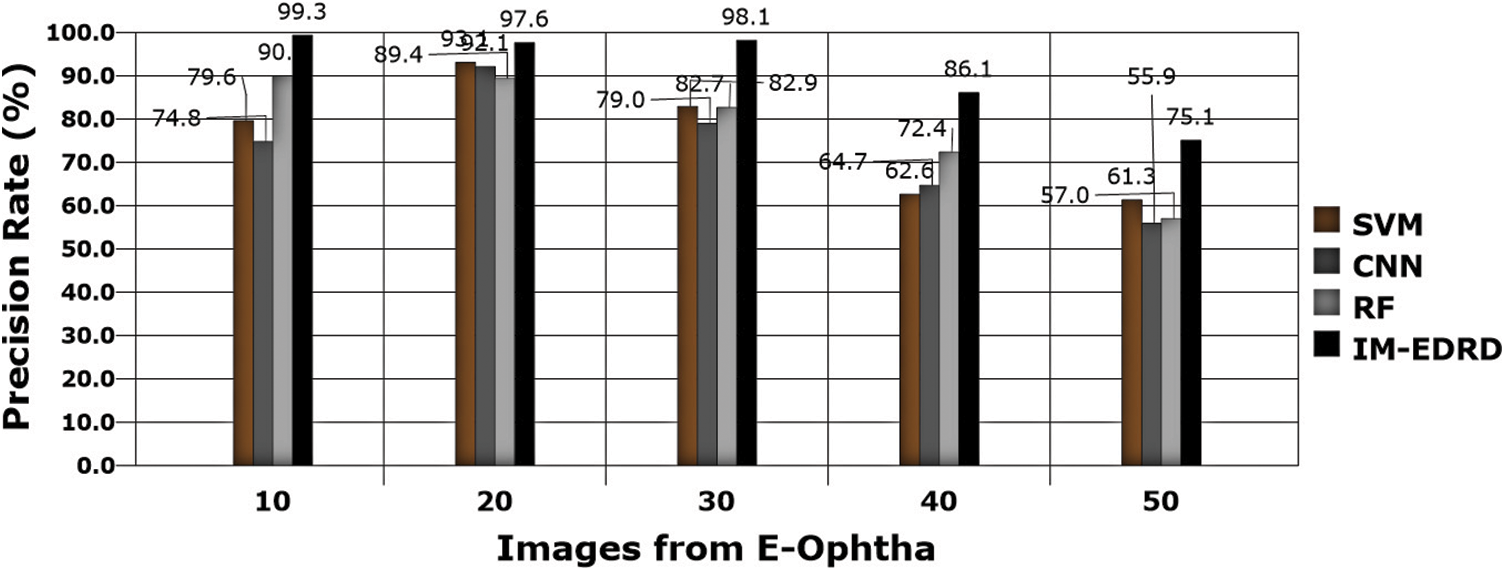
Figure 9: Precision rate analysis with E-Ophtha dataset images
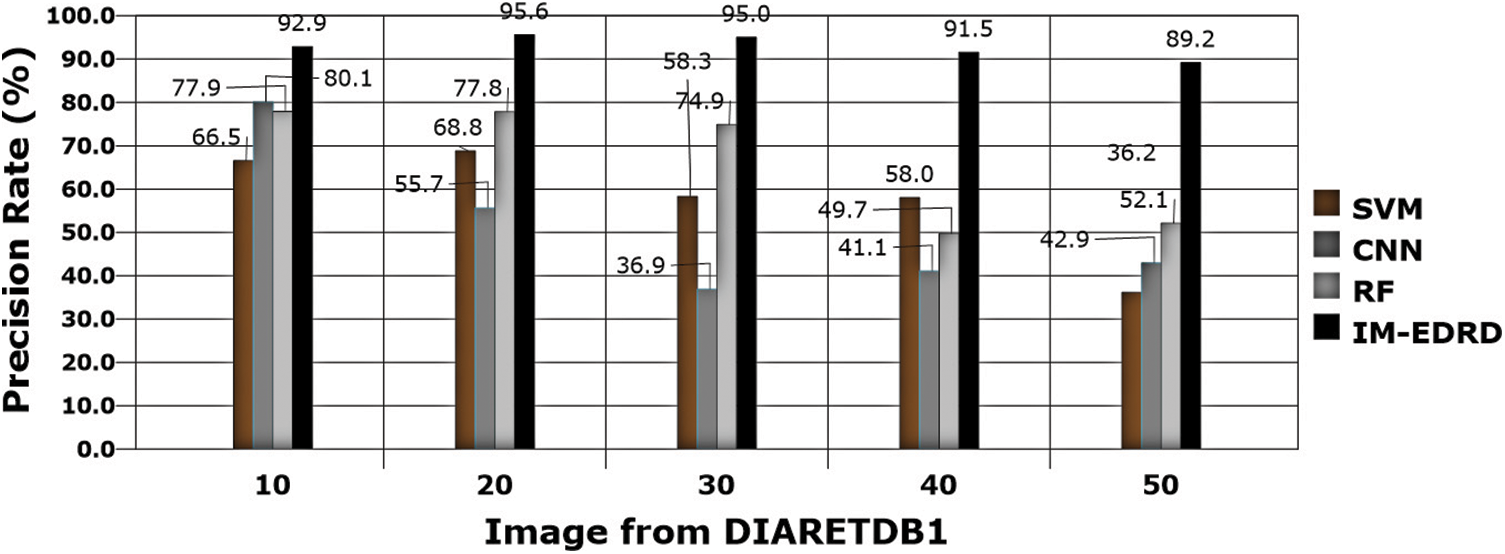
Figure 10: Precision rate with DIARETDB1 dataset images
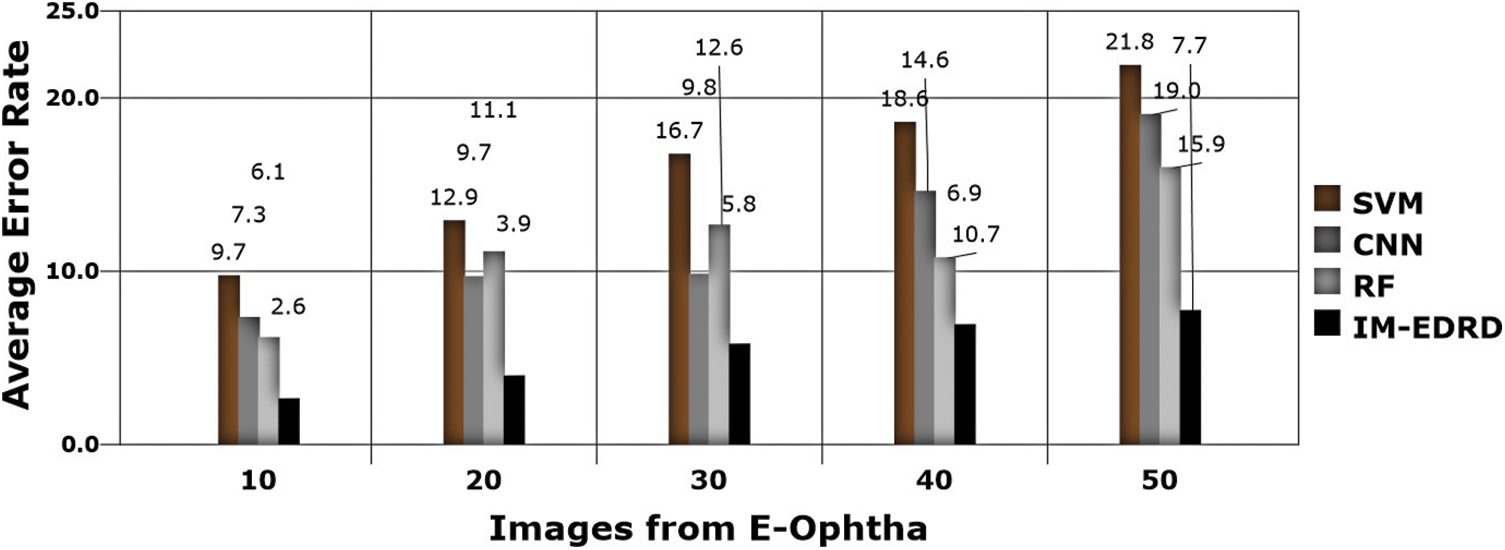
Figure 11: Error analysis with E-Ophtha dataset images
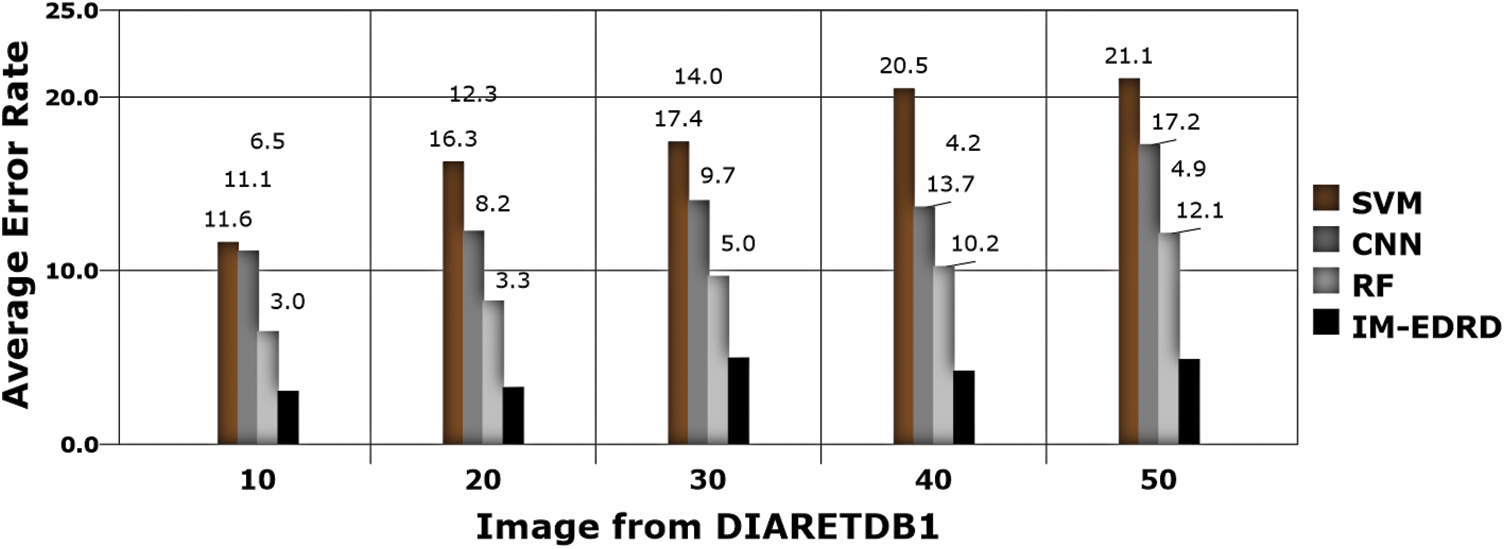
Figure 12: Error rate analysis with DIARETDB1 dataset images
The accuracy of the models SVM, CNN, RF, and IM-EDRD with the aforementioned two types of datasets is evident in Figs. 7 and 8. As the accuracy rate in the suggested work applying multi-level classification is considered, the results of classification of exudates images and DR images are more accurate. The proposed model's average accuracy value for both datasets is calculated to be 94.54%.
Precision rate evaluations are another important thing to consider while developing a classification model. Eq. (18) contains the computations, and Figs. 9 and 10 show the comparison findings. The precision rate of outcomes processed with both datasets is improved by MCA-based segmentation. The proposed model's average precision rate in processing using E-Ophtha and DIARETDB1 is 91.24% and 92.84%, respectively. The graphical findings also show that the output precision rates are higher than those of the other models tested.
The error rate in classification is the next significant aspect to consider, which is computed using (17), and the results are shown in Figs. 11 and 12. The classifiers, SVM and ANFIS, classify the input fundus images appropriately with the effective application of GLCM-based feature extraction and MCA-based segmentation. The suggested model accurately categorises the two eye abnormalities with small changes due to the successful design of multi-level classification. Furthermore, when compared to other models, the model delivers the least amount of error in categorization.
Since there are various challenges in detecting Exudates and DR, screening from fundus retinal pictures, an effective diagnostic model is always in demand. In this regard, this work proposes an Integrated Model for Exudate and Diabetic Retinopathy Diagnosis (IM-EDRD) with multi-level classifications. The suggested model also addresses automated illness categorization using SVM and ANFIS-based classifiers to aid ophthalmologists in appropriately identifying abnormalities. To do this, a GLCM-based feature extraction is used to train the SVM to categorise NORMAL and ABNORMAL retinal pictures. Following that, the images in the ABNORMAL class are analysed for further processing utilising MCA-based segmentation. The data are sent to the ANFIS, and after training, the classifier detects EXUDATES and DR in retinal fundus images. The outcomes are evaluated using the error rate, classification accuracy, and precision rate. The results clearly outperform existing classifiers in detecting eye diseases. The work can be improved in a variety of ways in the future, considering numerous flaws in the Human Eye. The work can also be improved so that it can be used in a real-time context and tested.
Funding Statement: The authors received no specific funding for this study.
Conflicts of Interest: The authors declare that they have no conflicts of interest to report regarding the present study.
Reference
1. M. Porta and F. Bandello, “Diabetic retinopathy,” Diabetologia, vol. 45, no. 12, pp. 1617–1634, 2002. [Google Scholar]
2. S. Joshi and P. T. Karule, “A review on exudates detection methods for diabetic retinopathy,” Biomedicine & Pharmacotherapy, vol. 97, no. 2, pp. 1454–1460, 2018. [Google Scholar]
3. M. R. K. Mookiah, U. R. Acharya, M. Roshan Joy, C. K. Chua, C. M. Lim et al., “Evolutionary algorithm based classifier parameter tuning for automatic diabetic retinopathy grading: A hybrid feature extraction approach,” Knowledge-Based Systems, vol. 39, no. 2, pp. 9–22, 2013. [Google Scholar]
4. M. D. Saleh and C. Eswaran, “An automated decision-support system for non-proliferative diabetic retinopathy disease based on MAs and HAs detection,” Computer Methods and Programs in Biomedicine, vol. 108, no. 1, pp. 186–196, 2012. [Google Scholar]
5. C. Sinthanayothin, J. F. Boyce, T. H. Williamson, H. L. Cook, E. Mensah et al., “Automated detection of diabetic retinopathy on digital fundus images,” Diabetic Medicine, vol. 19, no. 2, pp. 105–112, 2002. [Google Scholar]
6. D. Kayal and B. Sreeparna, “A new dynamic thresholding based technique for detection of hard exudates in digital retinal fundus image,” in 2014 Int. Conf. on Signal Processing and Integrated Networks (SPIN), Noida, India, pp. 141–144, 2014. [Google Scholar]
7. K. Wisaeng, H. Nualsawat and P. Ekkarat, “Automatic detection of exudates in retinal images based on threshold moving average models,” Biophysics, vol. 60, no. 2, pp. 288–297, 2015. [Google Scholar]
8. G. Quellec, M. Lamard, P. M. Josselin, G. Cazuguel, B. Cochener et al., “Optimal wavelet transform for the detection of microaneurysms in retina photographs,” IEEE Transactions on Medical Imaging, vol. 27, no. 9, pp. 1230–1241, 2008. [Google Scholar]
9. E. Decenciere, G. Cazuguel, Z. Xiwei, T. Guillaume, J. C. Klein et al., “TeleOphta: Machine learning and image processing methods for teleophthalmology,” Irbm, vol. 34, no. 2, pp. 196–203, 2013. [Google Scholar]
10. M. A. Berlin, S. Tripathi, V. Brindha Devi, B. Indu and N. Arul Kumar, “IoT-Based traffic prediction and traffic signal control system for smart city,” Soft Computing, vol. 25, no. 10, pp. 12241–12248, 2021. [Google Scholar]
11. A. R. Chowdhury, T. Chatterjee and S. Banerjee, “A random forest classifier-based approach in the detection of abnormalities in the retina,” Medical & Biological Engineering & Computing, vol. 57, no. 1, pp. 193–203, 2019. [Google Scholar]
12. O. Perdomo, S. Otalora, F. Rodr´ıguez, J. Arevalo, and F. A. Gonz´alez, “A novel machine learning model based onexudate localization to detect diabetic macular edema,” in Proc. of the Ophthalmic Medical Image Analysis Int. Workshop, Athens, Greece, October 2016. [Google Scholar]
13. C. Lam, D. Yi, M. Guo and T. Lindsey, “Automated detection of diabetic retinopathy using deep learning,” AMIA Summits on Translational Science Proceedings, vol. 38, no. 4, pp. 147, 2018. [Google Scholar]
14. P. R. Asha and S. Karpagavalli, “Diabetic retinal exudates detection using machine learning techniques,” in 2015 Int. Conf. on Advanced Computing and Communication Systems, Coimbatore, India, pp. 1–5, 2015. [Google Scholar]
15. A. F. Aqeel and S. Ganesan, “Automated algorithm for retinal image exudates and drusens detection, segmentation, and measurement,” in in IEEE Int. Conf. on Electro/Information Technology, Mankato, MN, pp. 206–215, 2014. [Google Scholar]
16. R. Kamalraj, M. Ranjith Kumar, V. Chandra Shekhar Rao, R. Anand and H. Singh, “Interpretable filter based convolutional neural network (IF-CNN) for glucose prediction and classification using PD-SS algorithm,” Measurement, vol. 183, pp. 109804, 2021. [Google Scholar]
17. C. Ramalingam, “An efficient applications cloud interoperability framework using i-anfis,” Symmetry, vol. 13, no. 2, pp. 268, 2021. [Google Scholar]
18. C. Pretty Diana Cyril, J. Rene Beulah and A. Harshavardhan, “An automated learning model for sentiment analysis and data classification of twitter data using balanced CA-SVM,” Concurrent Engineering: Research and Applications, vol. 29, no. 4, pp. 386–395, 2021. [Google Scholar]
19. A. B. Jain, V. J. Prakash and M. Bhende, “Techniques of fundus imaging,” Med Vis Res Found, vol. 33, no. 2, pp. 100, 2015. [Google Scholar]
20. P. Asha, L. Natrayan, B. T. Geetha, J. Rene Beulah, R. Sumathy et al., “IoT enabled environmental toxicology for air pollution monitoring using AI techniques,” Environmental Research, vol. 205, no. 1, pp. 1–12, 2022. [Google Scholar]
21. N. Subramani, A. Arun, R. R. Bhukya, B. M. Hardas, T. Ch et al., “An automated word embedding with parameter tuned model for web crawling,” Intelligent Automation & Soft Computing, vol. 32, no. 3, pp. 1617–1632, 2022. [Google Scholar]
22. P. V. Rajaram and M. Prakash, “Intelligent deep learning based bidirectional long short term memory model for automated reply of e-mail client prototype,” Pattern Recognition Letters, vol. 152, no. 1, pp. 340–347, 2021. [Google Scholar]
23. L. Giancardo, F. Meriaudeau, T. P. Karnowski, Y. Li, S. Garg et al., “Exudate-based diabetic macular edema detection in fundus images using publicly available datasets,” Medical Image Analysis, vol. 16, no. 1, pp. 216–226, 2012. [Google Scholar]
24. S. Manikandan, S. Satpathy and S. Das, “An efficient technique for cloud storage using secured de-duplication algorithm,” Journal of Intelligent & Fuzzy Systems, vol. 41, no. 2, pp. 2969–2980, 2021. [Google Scholar]
25. D. K. Jain, P. Boyapati and J. Venkatesh, “An intelligent cognitive-inspired computing with big data analytics framework for sentiment analysis and classification,” Information Processing & Management, vol. 59, no. 1, pp. 1–15, 2022. [Google Scholar]
26. A. Ruggeri, M. Forrachia and E. Grisan, “Detecting the optic disc in retinal images by means of a geometrical model of vessel network,” in Proc. of the 25th Annual Int. Conf. of the IEEE Engineering in Medicine and Biology Society, Milan, Italy, vol. 1, pp. 902–905, 2003. [Google Scholar]
27. D. Youssef and N. H. Solouma, “Accurate detection of blood vessels improves the detection of exudates in color fundus images,” Computer Methods and Programs in Biomedicine, vol. 108, no. 3, pp. 1052–1061, 2012. [Google Scholar]
28. B. Harangi and A. Hajdu, “Detection of exudates in fundus images using a markovian segmentation model,” in 2014 36th Annual Int. Conf. of the IEEE Engineering in Medicine and Biology Society, USA, pp. 130–133, 2014. [Google Scholar]
 | This work is licensed under a Creative Commons Attribution 4.0 International License, which permits unrestricted use, distribution, and reproduction in any medium, provided the original work is properly cited. |