DOI:10.32604/iasc.2023.025930
| Intelligent Automation & Soft Computing DOI:10.32604/iasc.2023.025930 | |
| Article |
Automated Skin Lesion Diagnosis and Classification Using Learning Algorithms
1Department of Information and Communication Engineering, Anna University, Chennai, 600025, Tamil Nadu, India
2Department of Electronics and Communication Engineering, Excel Engineering College, Namakkal, 638052, Tamil Nadu, India
*Corresponding Author: A. Soujanya. Email: annaramsoujanya05@gmail.com
Received: 09 December 2021; Accepted: 10 January 2022
Abstract: Due to the rising occurrence of skin cancer and inadequate clinical expertise, it is needed to design Artificial Intelligence (AI) based tools to diagnose skin cancer at an earlier stage. Since massive skin lesion datasets have existed in the literature, the AI-based Deep Learning (DL) models find useful to differentiate benign and malignant skin lesions using dermoscopic images. This study develops an Automated Seeded Growing Segmentation with Optimal EfficientNet (ARGS-OEN) technique for skin lesion segmentation and classification. The proposed ASRGS-OEN technique involves the design of an optimal EfficientNet model in which the hyper-parameter tuning process takes place using the Flower Pollination Algorithm (FPA). In addition, Multiwheel Attention Memory Network Encoder (MWAMNE) based classification technique is employed for identifying the appropriate class labels of the dermoscopic images. A comprehensive simulation analysis of the ASRGS-OEN technique takes place and the results are inspected under several dimensions. The simulation results highlighted the supremacy of the ASRGS-OEN technique on the applied dermoscopic images compared to the recently developed approaches.
Keywords: Computer aided diagnosis; deep learning; image segmentation; skin lesion diagnosis; dermoscopic images; medical image processing
According to the Skin Cancer Foundation, the global incidence of skin cancer is growing [1]. Melanoma cases are predicted to reach 192,310 in the United States in 2019. However, non-melanocytic skin malignancies such as Squamous Cell Carcinoma (SCC) and Basal Cell Carcinoma (BCC) are more prevalent [2,3]. Early diagnosis of the skin lesion is critical for optimising outcomes and is associated with a 99 percent overall survival rate (OS). However, when illnesses spread beyond the skin, survival rates might be low [4]. A dermatologist examines a patient visually using polarised light magnification using dermoscopy in current clinical practise. Medicinal diagnoses are frequently made on the basis of ethnic origin, patient history, sun exposure, and social habits. Concerning lesions are sent to the laboratory, biopsied in the office, evaluated on representative glass slides, and processed as permanent paraffin sections by pathologists for diagnosis [5]. A computer-aided diagnostics (CAD) system powered by artificial intelligence is on the verge of changing health care and medicine, notably in the field of medicinal imaging. Medical imaging procedures such as computed tomography (CT), magnetic resonance imaging (MRI), and ultrasound are widely used in clinical practise [6]. In numerous types of research, AI systems outperform/equal physician performance in diagnosing disease using medical imaging. Recent advances in deep learning have enabled the detection of anomalies such as brain tumours, breast cancer, esophageal cancer, skin lesions, foot ulcers, and lung cancer across a variety of image modalities used in medical imaging [7]. Convolutional Neural Networks (CNNs) have been identified as an invaluable tool for biomedical image classifiers and have been proposed as a tool for medical diagnosis in the histology, radiology, dermatology, and ophthalmology disciplines in the last few years [8]. The rapid growth of CNN and other deep learning algorithms has necessitated that non-experts get familiar with and grasp this sophisticated instrument. A comprehensive assessment of introductory publications providing a fundamental overview of CNN applications and principles exists [9]. Banerjee et al. [10] offer a DL-based ‘You Only Look Once’ (YOLO) approach that is based on Deep Convolutional Neural Network (DCNN) applications to diagnose melanoma using digital and skin lesion images and produces more precise and faster output than typical CNN methods. In terms of the location of detected items within the cell, these networks predict the bounding box for both the class confidence score and the recognised object. However, this study distinguishes itself through the incorporation of several resourceful models, including two-stage segmentation performed with the integration of the graph concept via L-type fuzzy numbers and the minimum spanning tree concept, as well as numerical extractions of the cancer area's actually infected region during the feature extraction processes. Khan et al. [11] employ a (IMFO) algorithm to determine the most discriminating feature. The generated feature is then combined with classifiers based on Multiset Maximum Correlation Analysis (MMCA) and Kernel Extreme Learning Machine (KELM).
Sikkandar et al. [12] integrate Adaptive Neuro-Fuzzy Classifier (ANFC) and GrabCut algorithms to offer novel segmentation-based classification models for skin lesion diagnosis. Segmentation, preprocessing, classification, and feature extraction are the four primary phases of the described model. To begin, preprocessing can be accomplished using inpainting and Top hat filter approaches. Following that, the pre-processed image is segmented using the Grabcut algorithms. Then, the feature extraction is performed using the Inception module, which is based on deep learning. Finally, an ANFC model is used to classify the skin lesion photos. Srinivasu et al. [13] demonstrated an automated technique for identifying skin illnesses using the Distributed Learning (DL)-based MobileNet V2 and Long Short-Term Memory (LSTM). The MobileNet V2 technique has been demonstrated to be effective, with enhanced performance on lightweight compute devices. The rise of illness progression is quantified using a grey level co-occurrence matrix.
This work develops an ARGS-OEN technique for segmenting and classifying skin lesions. The suggested ASRGS-OEN technique entails creating an ideal EfficientNet model and tweaking the hyperparameters using the FPA. Additionally, a classification model based on MWAMNE is used. The ASRGS-OEN technique is subjected to a thorough simulation examination, with the findings analysed across a variety of dimensions.
In this study, a novel ASRGS-OEN technique is developed for diagnosing and classifying the distinct stages of skin diseases. The proposed ASRGS-OEN technique incorporates different sub-processes namely preprocessing, SRG based segmentation, EfficientNet based feature extraction, and MWAMNE based classification. Fig. 1 demonstrates the overall process of the ASRGS-OEN model. The working of these modules is offered in the subsequent sections.
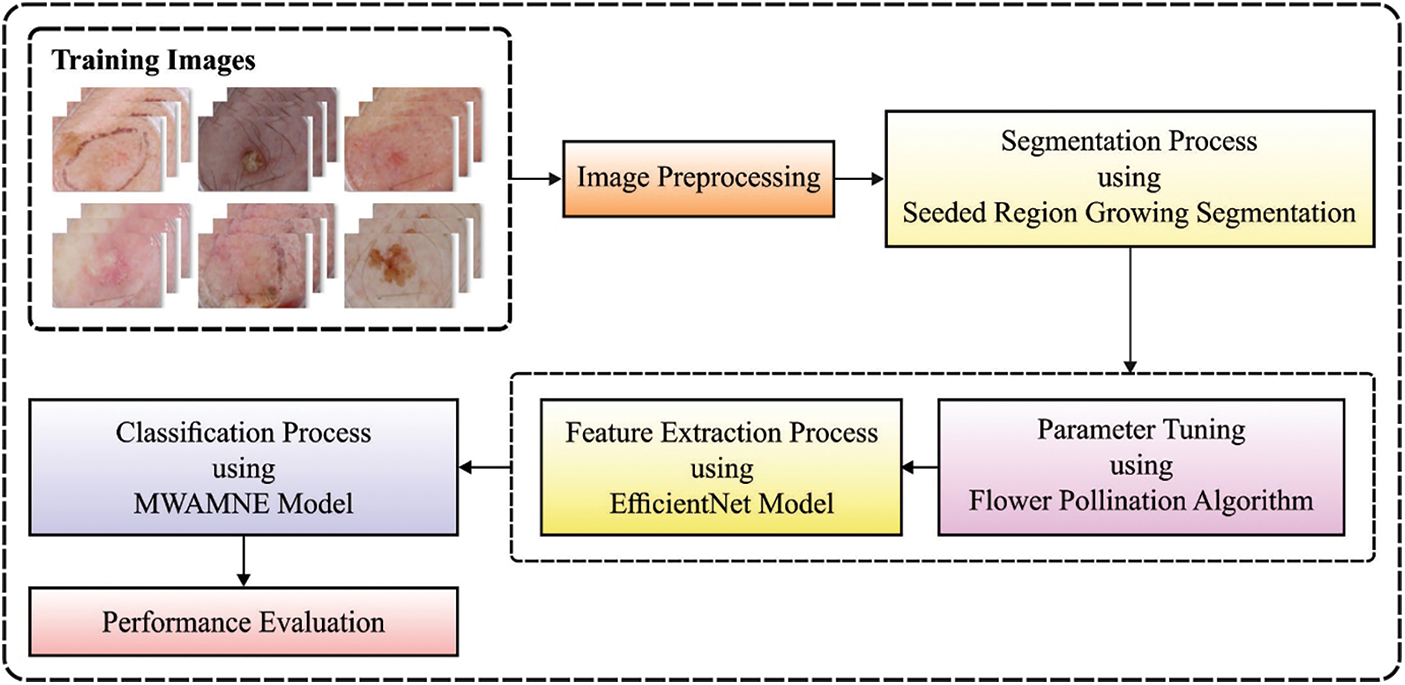
Figure 1: Overall block diagram of ASRGS-OEN model
The image pre-processed manner contains identifying of lesion place under the image as well as hair removals. Primarily, the images have been resized as to uniform size, and class label procedure occurs. This data composes values of in-between coordinate points such as width (w) and height (h) of bounding boxes in which class description of objects requires that defined. Also, the hair removals procedure happens on the dermoscopic image with utilize of DullRazor [14] manner for precisely detecting as well as removing hairs. For achieving this, initially, the place of hair has been identified utilizing the grayscale morphological closing functions. Afterward, the hair place has been making sure that defining the length as well as thickness of the defined shape, and pixel obtain replaced with utilize of bilinear interpolation manner.
2.2 Image Segmentation Using SRG Technique
At this stage, the preprocessed image is applied to the SRG technique to determine the affected lesion regions in the image. The Seeded Region Growing (SRG) technique is an effective image segmentation method for medicinal images since it can be fast and robust. In these techniques, the seed point is automatically selected and the rest of the neighbor pixels are related based on automatically chosen threshold T. It has a variety of applications in different areas: In the medicinal image segmentation, it is applied to skin lesion areas. It employs a data structure known as Sequentially Sorted List (SSL). The SSL might be a connected list i.e., well-ordered according to certain features. Once a novel pixel is connected with the region, it should be maintained as per the pixel value of the ordered attribute. The SRG is the same as flood fill and Breadth-First Search (BFS) models [15]. Region growing image segmentation is practiced considerably while the region of interest and the background have overspreading pixels intensity. The steps of the original SRG are given below:
Step 1: The first seed point is fixed as
Step 2: When
Step 3: The novel boundary of Ci is estimated as novel seed point i.e., Pis. The mean pixel intensity value of segments Ci must be recomputed, correspondingly.
Step 4: Continue Steps 2 & 3 till the points where each pixel in an image species to one of the segments.
2.3 Feature Extraction Using Optimal EfficientNet Model
Next to image segmentation, the optimal subset of feature vectors is derived by the use of EfficientNet model. The EfficientNet technique is presented by Tan that is attain an appropriate outcome on the increase of depth, width, and resolution of networks, and next attain optimum technique efficiency. Initial, it can determine a CNNs as function: Yi = Fi(Xi), where Fi implies the operators (op), Yi refers the tensor of outputs, Xi signify the input tensor of shape 〈Hi, WI, Ci〉, where Hi, Wi, and Ci refers the height, width, and amount of channels of input images. The CNN Net is explained as a series of collected layers:
where
where w, d, r implies the coefficients are utilized to scaling network width, depth, and resolution;
where α, β, γ implies the constants. Amongst them, ϕ has been identified value which defines several more resources are valid to model increasing, but α, β, γ define that distributing these extra resources for network width, depth, and resolution correspondingly. Also, it can be detailed connection amongst the FLOPS of regular convolutional op and d, w2, r2. As the convolutional ops frequently controlling the computation cost from CNN, increasing a CNN by utilizing Eq. (3) is around improve entire FLOPS by
Since hyper-parameters play a vital role in classification efficiency, they are optimally adjusted by the use of FPA. The abiotic pollination, cross-pollination, self-pollination, and biotic pollination approaches have been determined in domain optimizing as well as embedding under the FPA. This pollination procedure contains an order of difficult methods during plant-making approaches. The flower and their pollen gametes procedure a solution of the optimized issue. Conversely, the local pollination in a restricted region of unique flower occurs in shading with wind or water. Global pollination happens with probabilities that are known as switch probability. When this step has been eliminated, local pollination changes it. During the FPA technique 4 principles are followed: (i) live pollination and cross-pollination have been regarded as global pollination and the carry or pollen pollinator transfers in the direction which follows levy fight; (ii) abiotic and self-pollination were assumed as local pollination; (iii) pollinators containing insects are made flower constancies. The flower constancy has been production probabilities which are proportional to the comparison of 2 difficult flowers, and (iv) the interaction of global as well as local pollination are managed with switch probabilities.
The 1st and 3rd principles are written as:
where
where Γ(λ) represents the typical gamma function.
For local pollination, the 2nd and 3rd principles are provided as:
where
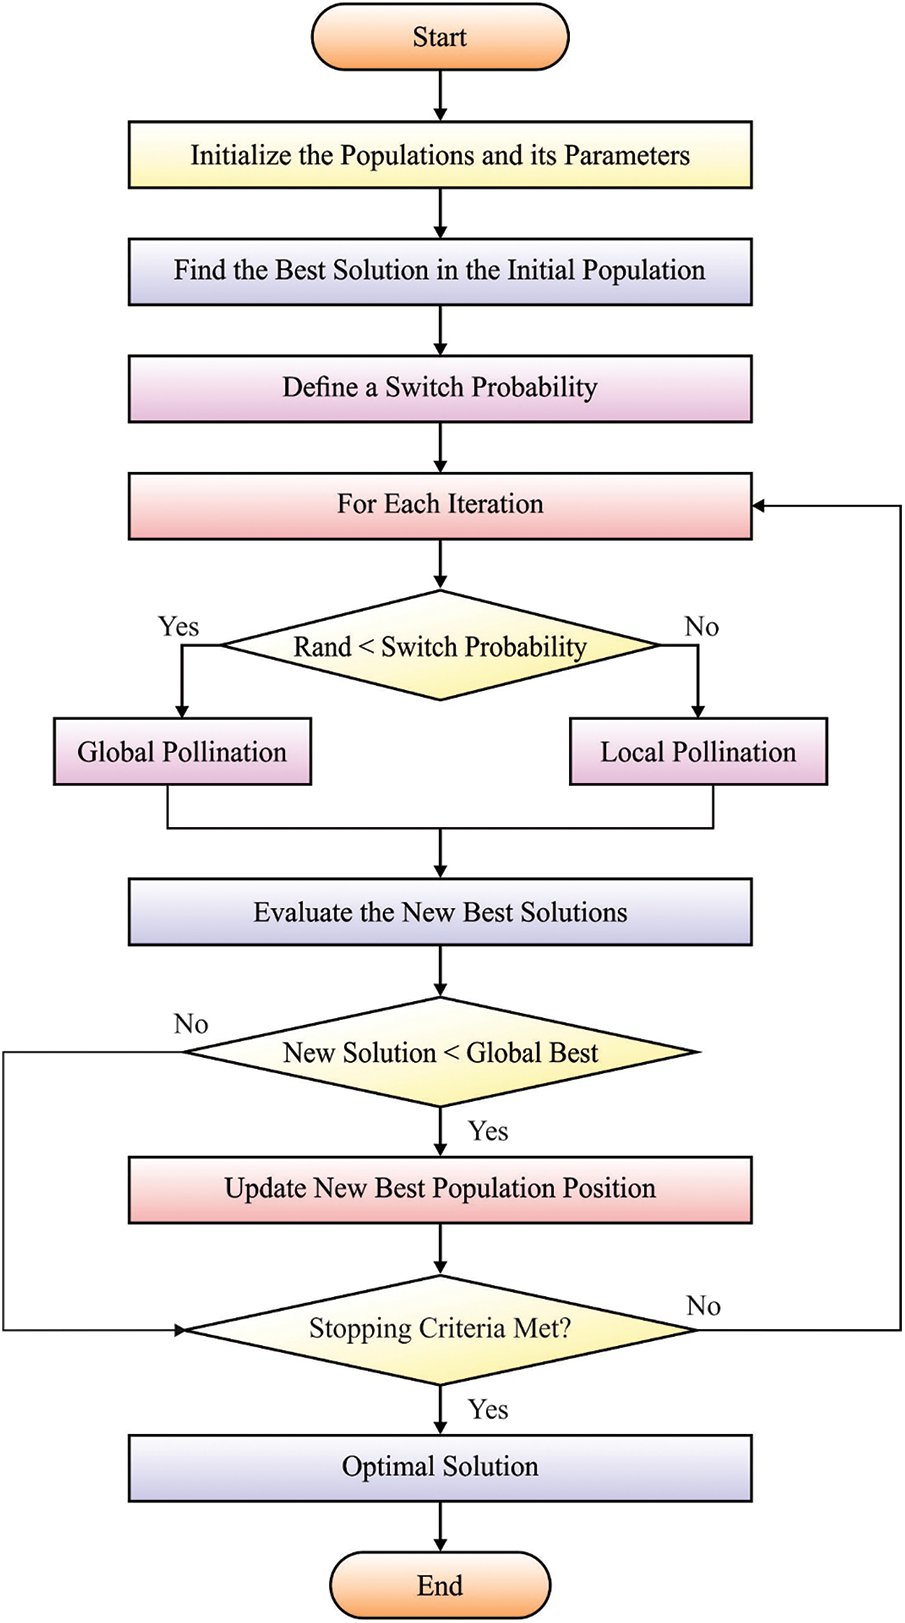
Figure 2: Flowchart of FPA
2.4 Image Classification Using MWAMNE Technique
At the last stage, the feature vectors are passed into the MWAMNE technique to allot the proper class labels. Assumed an imagef, its class is c, represented as fc in this work. Firstly, input the images to the benchmark LSTM model and later utilize the LSTM method for calculating the vector of an image as
where each problem shares the encoder LSTMf. This study proposes a network model with many rounds of attention mechanism. Therefore, it allows more precise class identification
In the equation, r stands for the attention mechanism round. si is a measure of similarities among
In the equation, Wi,h, Wu ∈ Rk×d, &
This section investigates the performance of the ASRGS-OEN technique on the applied ISIC dataset [19]. It comprises dermoscopic images of different class labels like Angioma (0), Nevus (1), Lentigo NOS (2), Solar Lentigo (3), Melanoma (4), Seborrheic Keratosis (5), and Basal Cell Carcinoma (6). The confusion matrix of the ASRGS-OEN technique takes place on the applied dataset under the training dataset in Fig. 3. The figure has shown that the ASRGS-OEN technique has categorized 16 images under Angioma class, 41 images in Nevus, 40 images in Lentigo NOS, 62 images in Solar Lentigo, 49 images in Melanoma, 51 images in Seborrheic Keratosis, and 33 images in BCC.
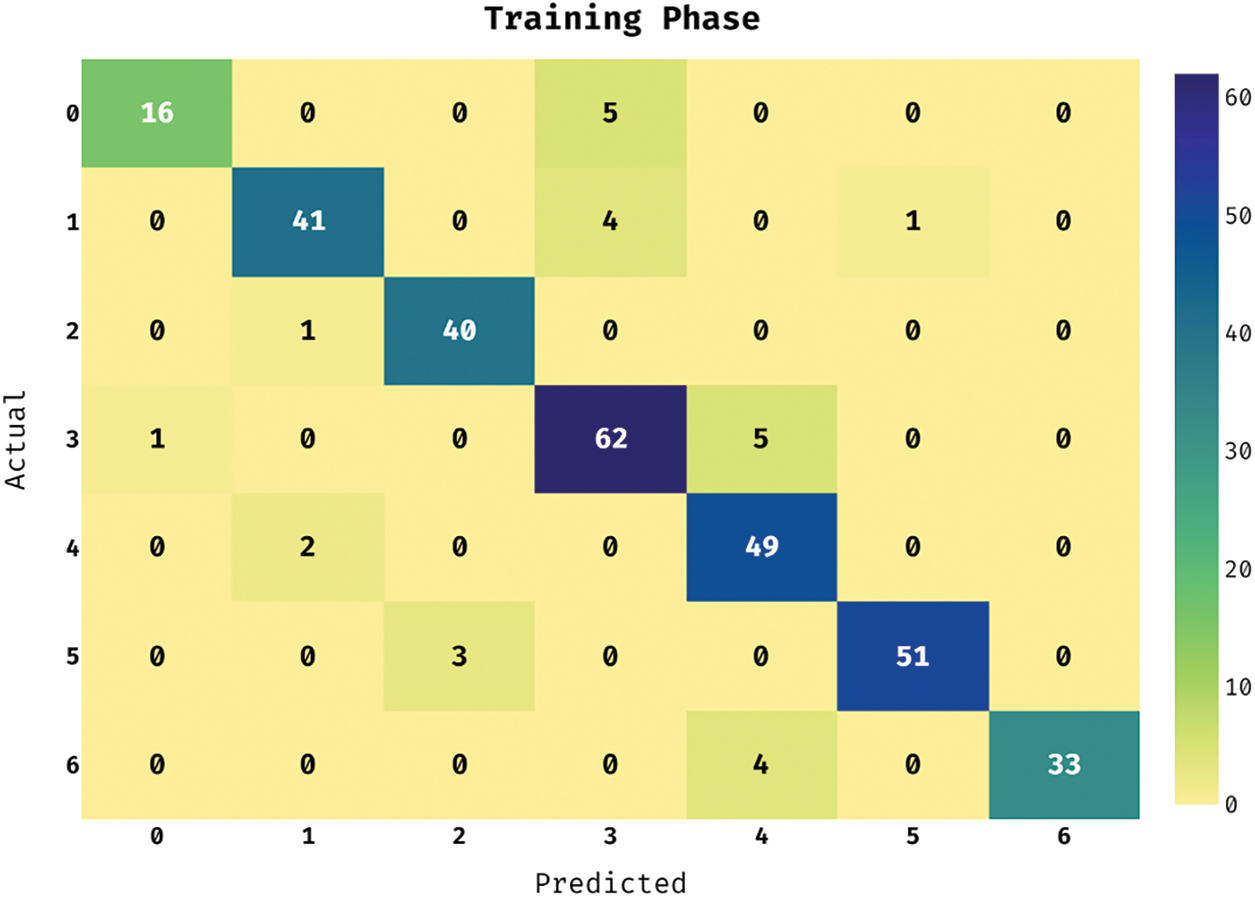
Figure 3: Confusion matrix analysis of under training phase
The confusion matrix of the ASRGS-OEN method takes place on the applied dataset in the testing dataset in Fig. 4. The figure showcased that the ASRGS-OEN approach has categorized 16 images in Angioma class, 41 images in Nevus, 36 images in Lentigo NOS, 59 images under Solar Lentigo, 48 images in Melanoma, 48 images under Seborrheic Keratosis, and 31 images in BCC.
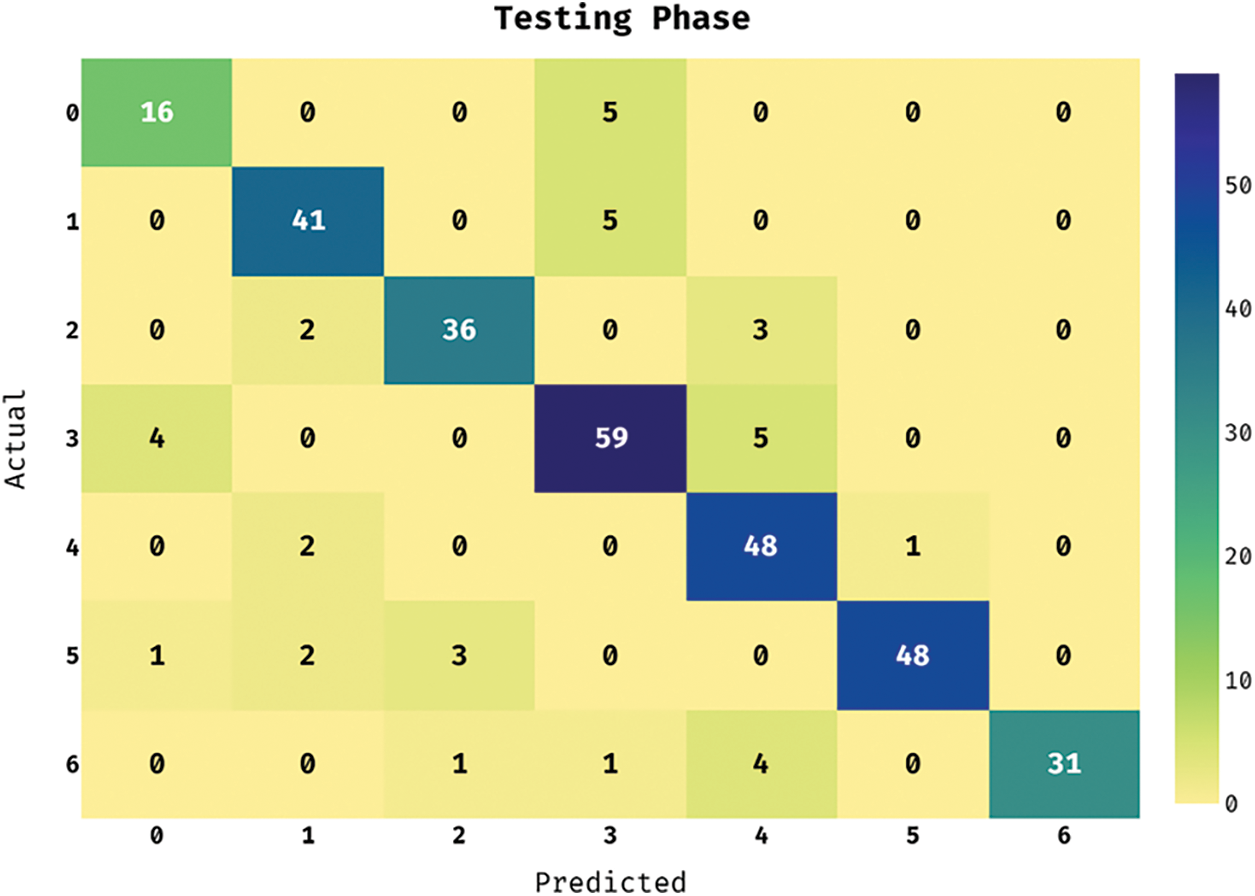
Figure 4: Confusion matrix analysis of under testing phase
Tab. 1 offers the classification results analysis of the ASRGS-OEN approach on the applied training and testing dataset. The results have shown that the ASRGS-OEN technique has accomplished effective outcomes under both cases.

Fig. 5 demonstrates the performance validation of the ASRGS-OEN technique on the training dataset. The figurer demonstrated that the ASRGS-OEN technique has resulted in increased performance. For instance, under class 0, the ASRGS-OEN technique has achieved an accy of 0.9811, seny of 0.7619, and specy of 0.9966. In line with, under class 2, the ASRGS-OEN manner has reached an accy of 0.9874, seny of 0.9756, and specy of 0.9892. Moreover, under class 4, the ASRGS-OEN system has attained an accy of 0.9654, seny of 0.9608, and specy of 0.9663. Furthermore, under class 6, the ASRGS-OEN manner has gained an accy of 0.9874, seny of 0.8919, and specy of 1.0000.
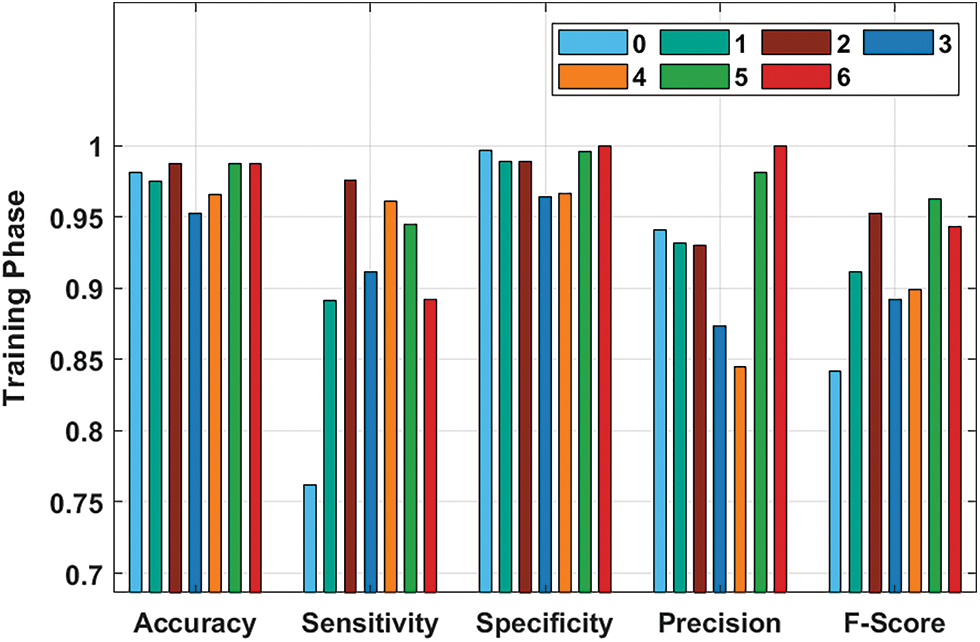
Figure 5: Result analysis of ASRGS-OEN model on training dataset
Fig. 6 depicts the performance validation of the ASRGS-OEN approach on the testing dataset. The figure outperformed that the ASRGS-OEN manner has resulted in higher performance. For instance, under class 0, the ASRGS-OEN manner has gained an accy of 0.9686, seny of 0.7619, and specyof 0.9832. Similarly, under class 2, the ASRGS-OEN approach has gained an accy of 0.9717, seny of 0.8780, and specy of 0.9856. Followed by, under class 4, the ASRGS-OEN approach has obtained an accy of 0.9528, seny of 0.9412, and specy of 0.9551. Finally, under class 6, the ASRGS-OEN methodology has gained an accy of 0.9811, seny of 0.8378, and specy of 1.0000.

Figure 6: Result analysis of ASRGS-OEN model on testing dataset
A detailed comparative outcomes analysis of the proposed ASRGS-OEN manner with existing approaches takes place in Tab. 2 and Figs. 7, 8. On examining the performance interms of training accuracy, the ASRGS-OEN technique has gained a higher value of 0.977 whereas the VGG-16, VGG-19, MN-v1, MN-v2, R.NET-50, D-NET-201, Inception-v3, and Xceptioin models have obtained lower values of 0.886, 0.902, 0.915, 0.924, 0.907, 0.911, 0.913, and 0.905 respectively. At the same time, on investigative the performance with respect to testing accuracy, the ASRGS-OEN approach has attained an increased value of 0.965 whereas the VGG-16, VGG-19, MN-v1, MN-v2, R.NET-50, D-NET-201, Inception-v3, and Xceptioin methodologies have attained minimum values of 0.849, 0.871, 0.893, 0.897, 0.879, 0.885, 0.881, and 0.875 correspondingly.

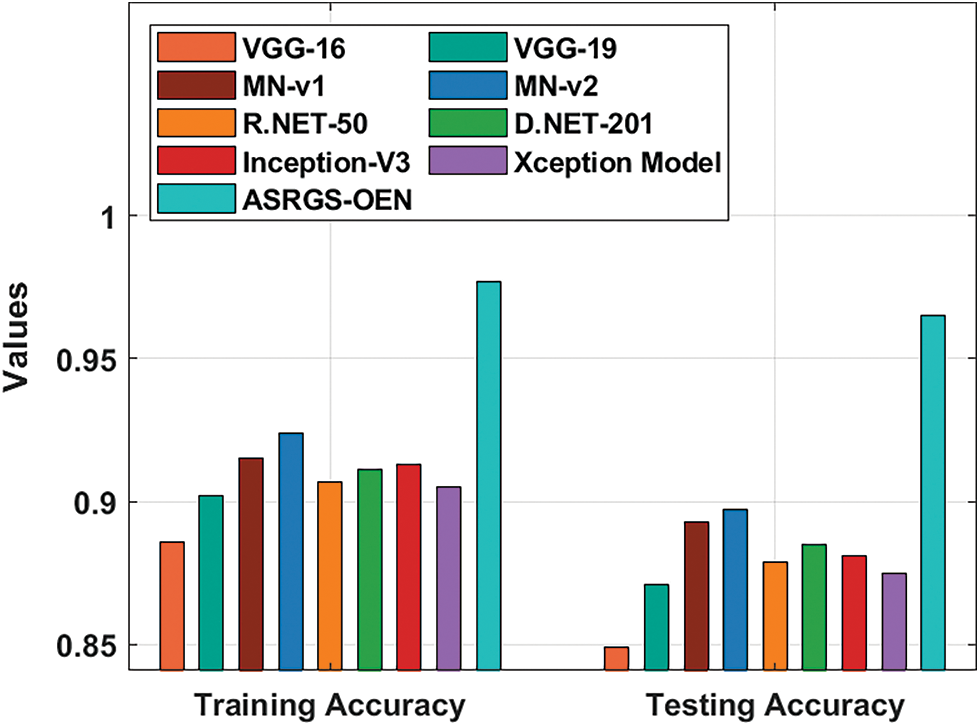
Figure 7: Training and testing accuracy analysis of ASRGS-OEN model

Figure 8: Comparative analysis of ASRGS-OEN technique with recent approaches
In addition, on scrutinizing the performance in terms of sensitivity, the ASRGS-OEN system has achieved a maximum value of 0.886 whereas the VGG-16, VGG-19, MN-v1, MN-v2, R.NET-50, D-NET-201, Inception-v3, and Xceptioin algorithms have obtained decreased values of 0.792, 0.825, 0.840, 0.864, 0.812, 0.833, 0.849, and 0.832 correspondingly. Followed by, on inspecting the performance to specificity, the ASRGS-OEN algorithm has obtained an increased value of 0.983 whereas the VGG-16, VGG-19, MN-v1, MN-v2, R.NET-50, D-NET-201, Inception-v3, and Xceptioin algorithms have reached minimum values of 0.850, 0.870, 0.890, 0.900, 0.880, 0.880, 0.880, and 0.870 correspondingly. Concurrently, on investigative the performance in terms of precision, the ASRGS-OEN technique has gained a superior value of 0.904 whereas the VGG-16, VGG-19, MN-v1, MN-v2, R.NET-50, D-NET-201, Inception-v3, and Xceptioin methods have obtained lower values of 0.887, 0.904, 0.935, 0.921, 0.931, 0.926, 0.906, and 0.906 respectively.
Lastly, on exploratory performance in terms of F-score, the ASRGS-OEN manner has gained a maximum value of 0.893 whereas the VGG-16, VGG-19, MN-v1, MN-v2, R.NET-50, D-NET-201, Inception-v3, and Xceptioin approaches have reached reduced values of 0.837, 0.863, 0.885, 0.892, 0.868, 0.877, 0.874, and 0.867 correspondingly. By looking into the aforementioned tables and figures, it can be stated that the ASRGS-OEN approach has accomplished maximal outcomes over the other techniques under different aspects.
In this study, a novel ASRGS-OEN technique is developed to diagnose and classify the different stages of skin diseases. The proposed ASRGS-OEN technique incorporates different sub-processes namely preprocessing, SRG based segmentation, EfficientNet based feature extraction, FPA based hyper-parameter optimization, and MWAMNE based classification. Moreover, the utilization of FPA based tuning of the hyper-parameters helps to accomplish improved diagnostic outcomes. A wide-ranging simulation analysis of the ASRGS-OEN technique takes place and the results are reviewed under numerous dimensions. The training accuracy of the proposed research work is 0.977 and testing accuracy is 0.965, moreover we achieved a precision of 0.904. The simulation results highlighted the supremacy of the ASRGS-OEN technique on the applied dermoscopic images. Therefore, the ASRGS-OEN technique can be applied as a proficient tool in real-time diagnosis. In future, the ASRGS-OEN technique can be deployed in the Internet of Things (IoT) and cloud environment to assist patients from remote areas.
Funding Statement: The authors received no specific funding for this study.
Conflicts of Interest: The authors declare that they have no conflicts of interest to report regarding the present study.
1. M. Goyal, T. Knackstedt, S. Yan and S. Hassanpour, “Artificial intelligence-based image classification for diagnosis of skin cancer: Challenges and opportunities,” Computers in Biology and Medicine, pp. 104065, 2020. [Google Scholar]
2. H. W. Rogers, M. A. Weinstock, S. R. Feldman and B. M. Coldiron, “Incidence estimate of non-melanoma skin cancer (keratinocyte carcinomas) in the us population, 2012,” JAMA Dermatology, vol. 151, no. 10, pp. 1081–1086, 2015. [Google Scholar]
3. F. Bray, J. Ferlay, I. Soerjomataram, R. L. Siegel, L. A. Torreet et al., “Global cancer statistics 2018: GLOBOCAN estimates of incidence and mortality worldwide for 36 cancers in 185 countries,” CA: A Cancer Journal for Clinicians, vol. 68, no. 6, pp. 394–424, 2018. [Google Scholar]
4. A. Hosny, C. Parmar, J. Quackenbush, L. H. Schwartz and H. J. Aerts, “Artificial intelligence in radiology,” Nature Reviews Cancer, vol. 18, no. 8, pp. 500–510, 2018. [Google Scholar]
5. X. Liu, L. Faes, A. U. Kale, S. K. Wagner, D. J. Fu et al., “A comparison of deep learning performance against health-care professionals in detecting diseases from medical imaging: A systematic review and meta-analysis,” The Lancet Digital Health, vol. 1, no. 6, pp. e271–97, 2019. [Google Scholar]
6. M. Havaei, A. Davy, D. W. Farley, A. Biard, A. Courville et al., “Brain tumor segmentation with deep neural networks,” Medical Image Analysis, vol. 35, pp. 18–31, 2017. [Google Scholar]
7. M. Goyal, N. Reeves, S. Rajbhandari and M. H. Yap, “Robust methods for real-time diabetic foot ulcer detection and localization on mobile devices,” IEEE Journal of Biomedical and Health Informatics, vol. 23, no. 4, pp. 1730–1741, 2018. [Google Scholar]
8. N. Tomita, B. Abdollahi, J. Wei, B. Ren, A. Suriawinata et al., “Attention based deep neural networks for detection of cancerous and precancerous esophagus tissue on histopathological slides,” JAMA Network Open, vol. 2, no. 11, pp. 1914645–1914645, 2019. [Google Scholar]
9. S. Wang, Z. Su, L. Ying, X. Peng, S. Zhu et al., “Accelerating magnetic resonance imaging via deep learning,” in Proc. 13th Int. Symp. on Biomedical Imaging (ISBI), IEEE, Prague, Czech Republic, pp. 514–517, 2016. [Google Scholar]
10. S. Banerjee, S. K. Singh, A. Chakraborty, A. Das and R. Bag, “Melanoma diagnosis using deep learning and fuzzy logic,” Diagnostics, vol. 10, no. 8, pp. 577–586, 2020. [Google Scholar]
11. M. A. Khan, M. Sharif, T. Akram, R. Damasevicius and R. Maskeliunas, “Skin lesion segmentation and multiclass classification using deep learning features and improved moth flame optimization,” Diagnostics, vol. 11, no. 5, pp. 811, 2021. [Google Scholar]
12. M. Y. Sikkandar, B. A. Alrasheadi, N. B. Prakash, G. R. Hemalakshmi, A. Mohanarathinam et al., “Deep learning based an automated skin lesion segmentation and intelligent classification model,” Journal of Ambient Intelligence and Humanized Computing, vol. 12, no. 3, pp. 3245–3255, 2021. [Google Scholar]
13. P. N. Srinivasu, J. G. SivaSai, M. F. Ijaz, A. K. Bhoi, W. Kim et al., “Classification of skin disease using deep learning neural networks with MobileNet V2 and LSTM,” Sensors, vol. 21, no. 8, pp. 2852–2906, 2021. [Google Scholar]
14. T. Lee, V. Ng, R. Gallagher, A. Coldman and D. McLean, “Dullrazor: A software approach to hair removal from images,” Computers in Biology and Medicine, vol. 27, no. 6, pp. 533–543, 1997. [Google Scholar]
15. N. Shrivastava and J. Bharti, “Automatic seeded region growing image segmentation for medical image segmentation: A brief review,” International Journal of Image and Graphics, vol. 20, no. 3, pp. 2050018–2050034, 2020. [Google Scholar]
16. P. Zhang, L. Yang and D. Li, “EfficientNet-B4-ranger: A novel method for greenhouse cucumber disease recognition under natural complex environment,” Computers and Electronics in Agriculture, vol. 176, pp. 105652–105674, 2020. [Google Scholar]
17. M. Azad, O. B. Haddad and X. Chu, “Flower pollination algorithm (FPA),” in Proc. of Advanced Optimization by Nature-Inspired Algorithms, Springer, Singapore, pp. 59–67, 2018. [Google Scholar]
18. F. An, X. Li and X. Ma, “Medical image classification algorithm based on visual attention mechanism-MCNN,” Oxidative Medicine and Cellular Longevity, vol. 2021, no. 6280690, pp. 1–12, 2021. [Google Scholar]
19. C. F. Codella, D. Gutman, M. C. Emre, H. Brian, A. Michael et al., “Skin lesion analysis toward melanoma detection: A challenge at the 2017 international symposium on biomedical imaging (isbihosted by the international skin imaging collaboration (isic),” in The Proc. IEEE 15th Int. Symp. on Biomedical Imaging (ISBI 2018), DC, USA, pp. 168–172, 2018. [Google Scholar]
 | This work is licensed under a Creative Commons Attribution 4.0 International License, which permits unrestricted use, distribution, and reproduction in any medium, provided the original work is properly cited. |