DOI:10.32604/iasc.2023.025069
| Intelligent Automation & Soft Computing DOI:10.32604/iasc.2023.025069 | |
| Article |
Monitoring and Prediction of Indoor Air Quality for Enhanced Occupational Health
Technical University of Cluj Napoca, Cluj Napoca, Romania
*Corresponding Author: Alexandra Fanca. Email: Alexandra.Fanca@aut.utcluj.ro
Received: 10 November 2021; Accepted: 07 January 2022
Abstract: The amount of moisture in the air is represented by relative humidity (RH); an ideal level of humidity in the interior environment is between 40% and 60% at temperatures between 18° and 20° Celsius. When the RH falls below this level, the environment becomes dry, which can cause skin dryness, irritation, and discomfort at low temperatures. When the humidity level rises above 60%, a wet atmosphere develops, which encourages the growth of mold and mites. Asthma and allergy symptoms may occur as a result. Human health is harmed by excessive humidity or a lack thereof. Dehumidifiers can be used to provide an optimal level of humidity and a stable and pleasant atmosphere; certain models disinfect and purify the water, reducing the spread of bacteria. The design and implementation of a client-server indoor and outdoor air quality monitoring application are presented in this paper. The Netatmo station was used to acquire the data needed in the application. The client is an Android application that allows the user to monitor air quality over a period of their choosing. For a good monitoring process, the Netatmo modules were used to collect data from both environments (indoor: temperature (T), RH, carbon dioxide (CO2), atmospheric pressure (Pa), noise and outdoor: T and RH). The data is stored in a database, using MySQL. The Android application allows the user to view the evolution of the measured parameters in the form of graphs. Also, the paper presents a prediction model of RH using Azure Machine Learning Studio (Azure ML Studio). The model is evaluated using metrics: Mean Absolute Error (MAE), Root Mean Squared Error (RMSE), Relative Absolute Error (RAE), Relative Squared Error (RSE) and Coefficient of Determination (CoD).
Keywords: Machine learning; indoor air quality; humidity; carbon dioxide; relative humidity
Air quality monitoring entails a set of procedures for detecting and evaluating certain component concentrations in the atmosphere. An air quality monitoring system provides essential data for making strategic decisions about pollution control and prevention, as well as identifying contaminated locations.
Because we spend more than 80% of our time inside structures, such as the office, school, home, etc., indoor, or outdoor air quality plays a vital part in our lives [1]. As result, we need to be aware that we breathe approximately 12,000 liters of air daily, and our lungs often struggle with smoke, dust, viruses, pollen, bacteria, and other compounds that are present in the air. It is very important to pay attention to the place and time we spend, especially in the rooms where symptoms appear [2].
Monitoring air quality, particularly indoor air quality, is critical because poor indoor air quality can cause damage to human health [3]. The heating system, clothes dryer, humidifier, fireplace, and ventilation system are the most common sources of RH and T changes. An integrated air management system based on real-time monitoring would lead to environmental and economic sustainability optimization and enhancement [4]. High T values may raise Volatile Organic Compound (VOC) levels, whereas high RH encourages mildew and respiratory illnesses [5]. High levels of T and RH may also increase the concentrations of certain pollutants [6]. High humidity accelerates the release of hazardous or dangerous substances into the atmosphere. It also breeds dust mites in our houses, lowering air quality. Bacterial and viral species that cause respiratory infections flourish in both high and low humidity conditions. Airborne microorganisms are also caused by low humidity. We can use a controller to adjust T and RH to avoid these consequences [7–9]. Apart from RH, Particulate Matter (PM), a complex mixture of microscopic particles and liquid drops that might cause cancer and asthma [10], should be monitored. The paper [11] presents a method for detecting formaldehyde, which is another key indication of indoor air quality and a marker for lung cancer detection. Buildings are now heated by fossil fuels such as methane gas, diesel, and wood, and significant amounts of CO2, Sulphur dioxide (SO2), nitrogen oxides (NOX), and other harmful compounds are released into the atmosphere during the chemical process of combustion. Acid rain, forest death, and deterioration of human health are the effects. Heat recovery ventilation, heat pumps, and solar panels are all examples of environmentally friendly heating technologies that can dramatically cut CO2 emissions. Article [12] presents a study that addresses the absence of short-term monitoring bias as well as the challenges of the indoor air quality data monitoring method. Several such systems are described in the specialized literature, allowing decisions to be made to improve air quality.
Unfortunately, there are currently few systems available that monitor air quality and environmental factors in customers’ homes. Therefore, monitoring the environment inside the house is the key to preventing a significant number of diseases [13].
The paper [14] presents a system of air quality monitoring based on Internet of Things (IOT) and proposes a complete method of indicating the level of indoor air quality in real-time, which effectively addresses dynamic changes and is efficient from the point of view of processing and memory.
An IoT indoor air quality system incorporating an ESP8266 (used to transmit detection data to the terminal), Arduino and XBee technologies for processing, data transmission and micro-sensors for procurement data is presented in [15,16]. This system allows the user to know in real-time, a variety of environmental parameters, such as air T, RH, carbon monoxide (CO), CO2 and light intensity.
Also, the studies on indoor air quality show a model for improving the quality of air that can be easily applied to the market by acquiring initial analytical data and the natural cubic spline method is presented in [17].
In [18] is presented a monitoring system for T, RH, PM1, PM2.5, PM10, CO, CO2, VOC, used to create an optimal working environment. In addition to air quality sensors, the system is equipped with wireless communication modules, display, and smartphone applications. Data from the developed system is transmitted to the smartphone application, then to the cloud server using wireless communications such as Bluetooth and Wi-Fi for short-distance communication and Lora for long-distance communication. The mobile application provides information on indoor and outdoor air qualities, appropriate actions, pollution warnings and weather conditions.
Due to the scientific progress achieved in recent years, the application of metal oxide gas sensors on IoT devices and mobile platforms offers new opportunities for detection applications [19].
In [20], an indoor environment monitoring system is presented. The system consists of a remote terminal that uses a smartphone with an Android operating system, an application to generate data display and control decisions, a control node, a ZigBee wireless network that includes a node, main sub nodes, and sensors. Through the Zigbee network, each node plays the role of coordinator. The collection of various parameters of the room environment, such as T, RH, PM2.5, and light intensity are collected by the sensors distributed in the room. The collected data is sent to the control node through the ZigBee network, and then the data is transmitted to the remote terminal. Paper [21] emphasizes the role of the gateway in processing collected air quality data and its reliable dissemination to end-users through a webserver. Also, presents a mechanism for the backup and the restoration of the collected data in the case of an Internet outage.
A study that built an indoor environment containing a multi-agent community with “sensor-calculation-communication-action” capability, was used to verify the feasibility of applying multi-agent theory to air quality control systems. Individual intelligent agents can resolve their own conflicts, having one or more criteria for detection [22].
The thermal comfort of the people from an indoor environment monitored using a wireless detection network is presented in [23]. To design the graphical user interface (GUI) of the application the Visual Studio development environment is used. Also, in GUI the parameters such as T, RH and wind speed can be selected. The proposed system emphasizes wireless transmission and rapid analysis of environmental parameters.
Paper [24] presents the issues, infrastructure, and challenges in designing and implementing an integrated system for detecting air quality monitoring in real-time. The main purpose is to detect the level of seven gases: ozone (O3), PM, CO, NOX, SO2, VOC, and CO2. The system also offers air quality alerts when exceeding predefined levels.
Studies on the practicalities of using data streams from sensor nodes for air quality measurement and required methods to tune the results to different stakeholders and applications are presented in [25].
By recording and analyzing the air quality measurements, it is possible to predict the air quality in the near future. In [26] designed a microchip made from sensors that is capable of periodically recording measurements, and a model that estimated atmospheric changes using deep learning is proposed. Also, an efficient algorithm to determine the optimal observation period for accurate air quality prediction is developed.
In [27] a statistical machine learning (ML) based predictive model is integrated into a Semantic Sensor Web using stream reasoning. The approach is evaluated in an indoor air quality monitoring case study, that employs the Multilayer Perceptron model to predict short term PM2.5 pollution situation.
ML addresses the issue of how to build decision devices that automatically improve through experience. This field is a technical one that develops very quickly, combining computer science, statistics, artificial intelligence, and data science. The rapid progress in ML is determined both by the development of new learning algorithms and theory, as well as by the continuous explosion of online data availability and low-cost computation [28].
In the last few years, ML are increasingly used in various domains [29]. These can also be used to predict environmental conditions. Algorithms from ML can be used for four types of problems like regression, classification, clustering, and association [30]. Classification and regression algorithms can be used also for RH prediction.
It is important that the notification of the user regarding the quality of the air is carried out automatically, using dedicated applications and ML, to avoid unpleasant situations, like the damage of the health.
The proposed system has three main components: Netatmo station, an android application that is used to collect data from the Netatmo station and get statistics and a model for RH evaluation and prediction. Fig. 1 shows the components of the system and how they interact with each other.
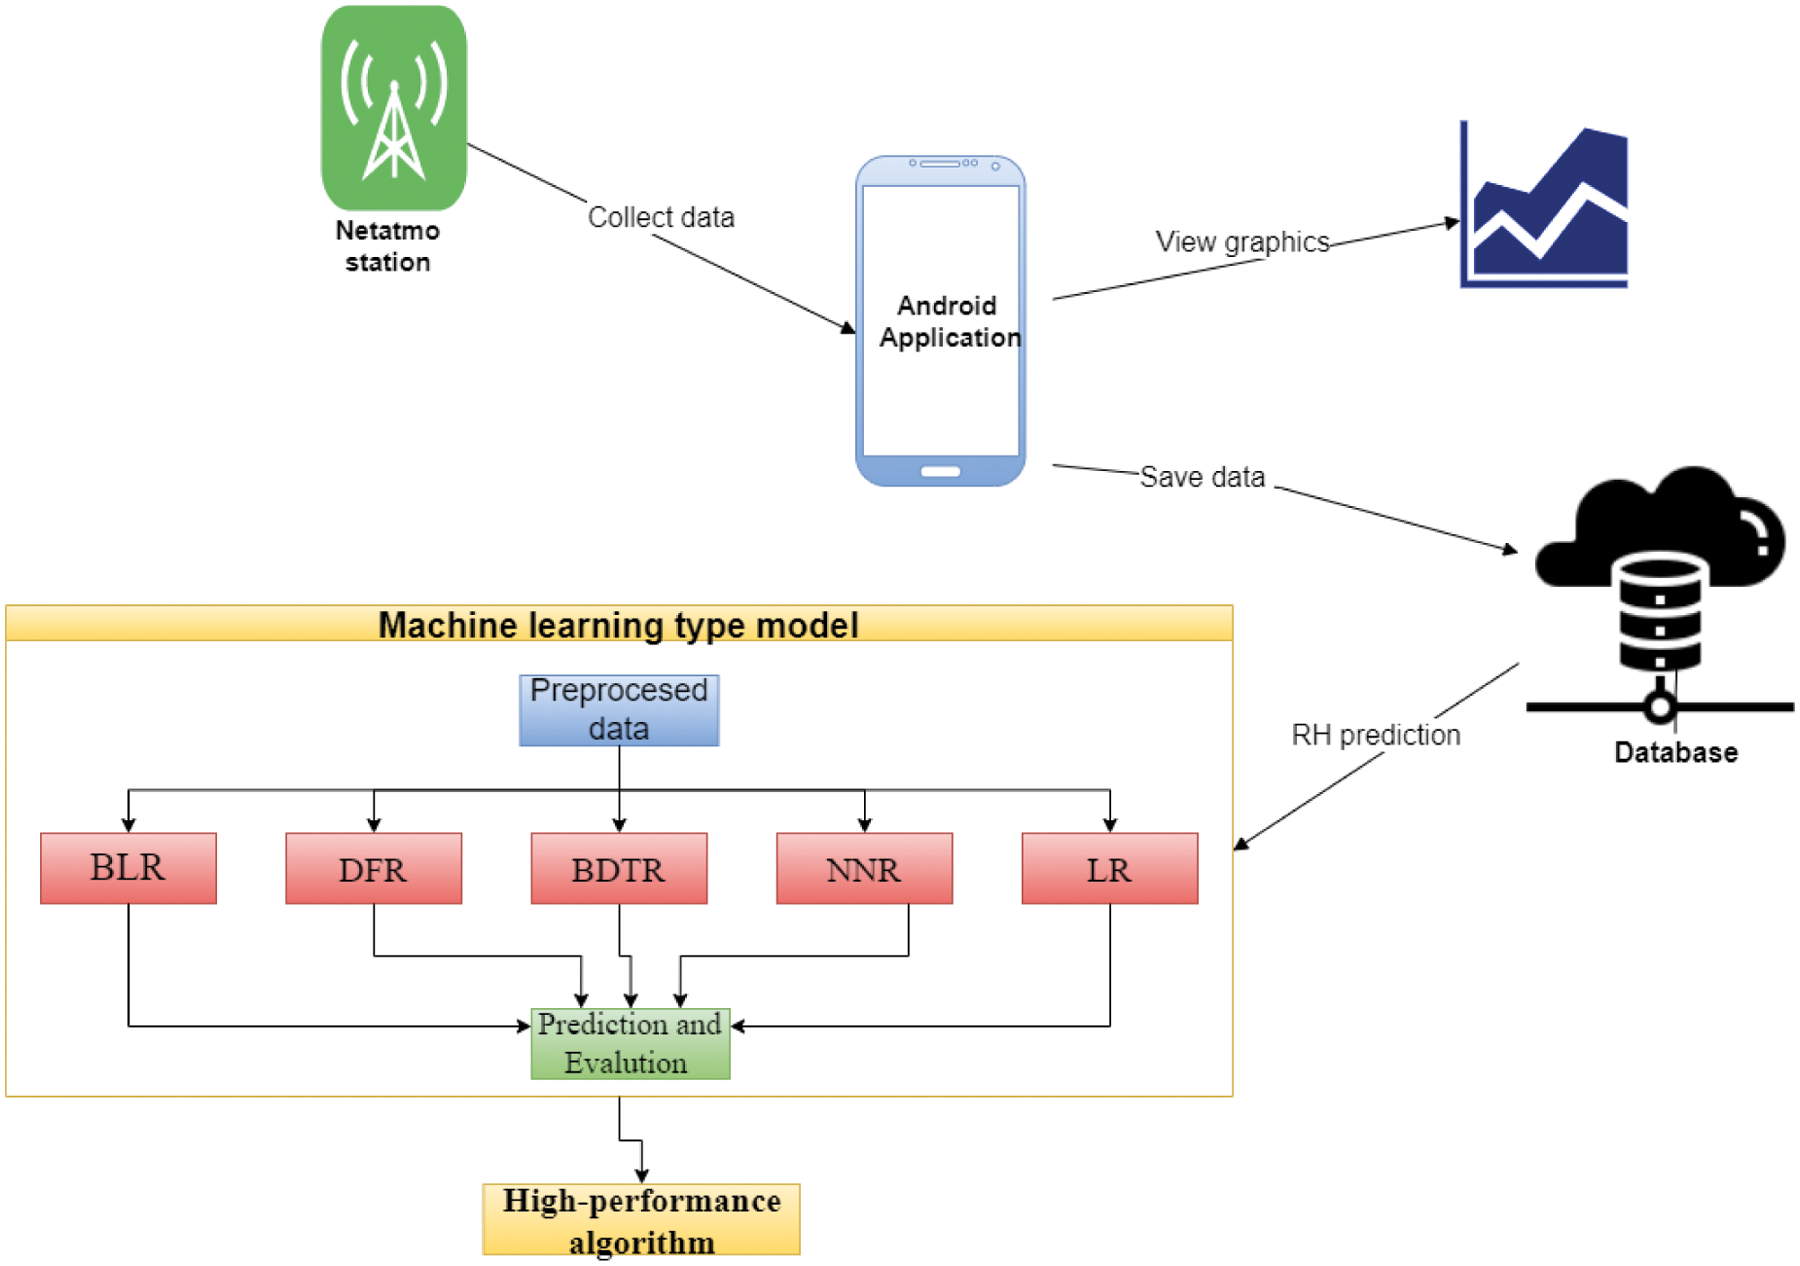
Figure 1: Components of the system
The developed intelligent systems are limited to monitoring or at most can report events. Therefore, this paper introduces a model for RH evaluation and prediction features. Based on the data received from the Netatmo station, the proposed model evaluates the air quality inside a sleeping room. Regression algorithms like Bayesian Linear Regression (BLR), Decision Forest Regression (DFR), Boosted Decision Tree Regression (BDTR), Linear Regression (LR) and Neural Network Regression (NNR) were introduced in the model developed in Azure ML Studio, for evaluating the performance of the model based on RH.
The following subchapters present the android app and the model for HR prediction and evaluation.
The suggested system’s goal is to monitor air quality both outside and inside the environment (sleeping room). It is implemented as a client-server application, with the client as an Android app. A database that holds values was constructed based on the measurements provided by intelligent sensors. A server, often known as the backend, establishes a connection between the database and the application, as well as playing a vital role in data security. The project’s client-side is an Android application with a variety of features that will satisfy the user’s curiosity and desires. The application’s goals are to provide a user-friendly interface, the ability to create a secure account, visualization of the values measured by the sensors, a search filter for selecting a specific period and index, and a database for storing measured values. As shown in Fig. 2, the system is made up of three parts: the database, the client, and the server.
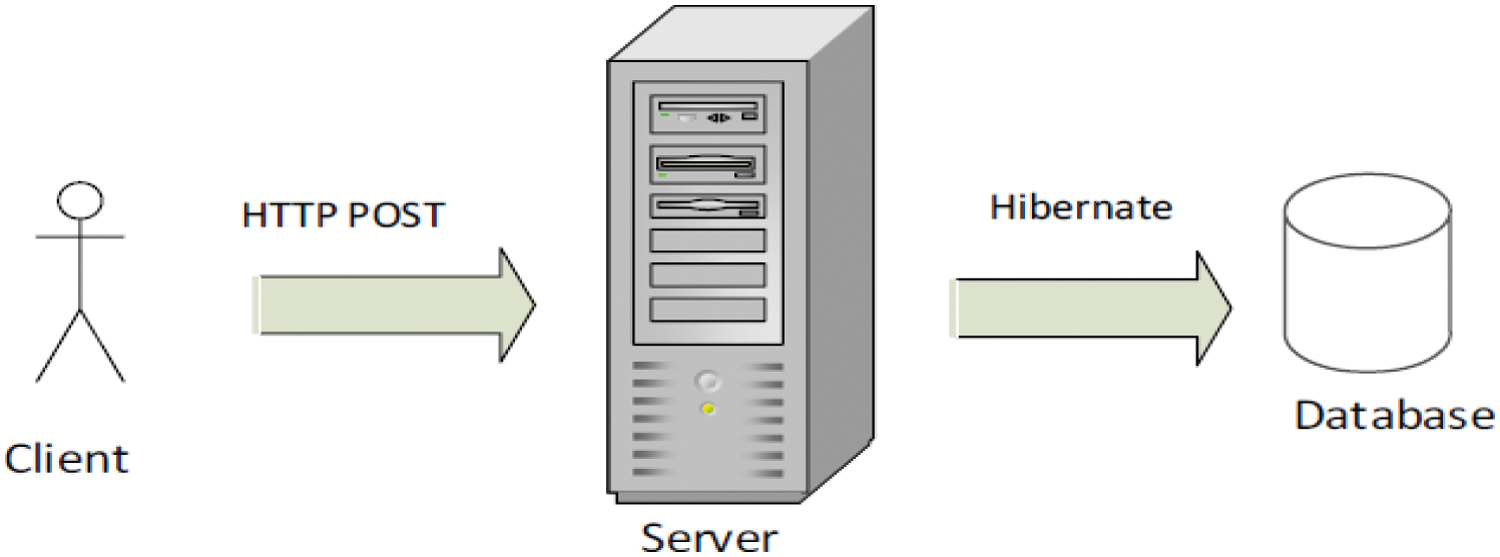
Figure 2: Client–server architecture
The system’s development began with data gathering, which was accomplished using Netatmo modules, and the parameters were collected over a period of nearly four months, beginning on January 23, 2019, and ending on May 6, 2019.The connection between the two modules was made as follows:
❖ Outdoor module: powering the sensor with batteries, positioning the sensor in a place corresponding to the manufacturer’s specifications for optimum operation, functional verification, and reliability of measured data.
❖ Indoor module: connecting the sensor to the voltage source through a charger available in the package offered by Netatmo, connecting the sensor to the manufacturer’s application, available free of charge, used for reading data, verifying the correct and precise operation of the sensor.
The Netatmo platform offers users the possibility to purchase the history of the data collected by the Netatmo modules, in the form of a .csv (Comma Separated Values) document, within a certain time limit.
The database contains three tables, the values collected by the Netatmo module, and the information required for user registration/logging. Indoor Table-It is the table that contains the data measured by the internal module. It stores the following parameters: id, date, T, RH, CO2, noise, and Pa, as in the Fig. 3a. Outdoor Table-The data collected from the external environment can be viewed in Fig. 3b and contains the values measured by the external sensor: id, date, T, and RH. The users table contains information regarding user registration/authentication. All fields filled by the user in the register section are mapped in this table.
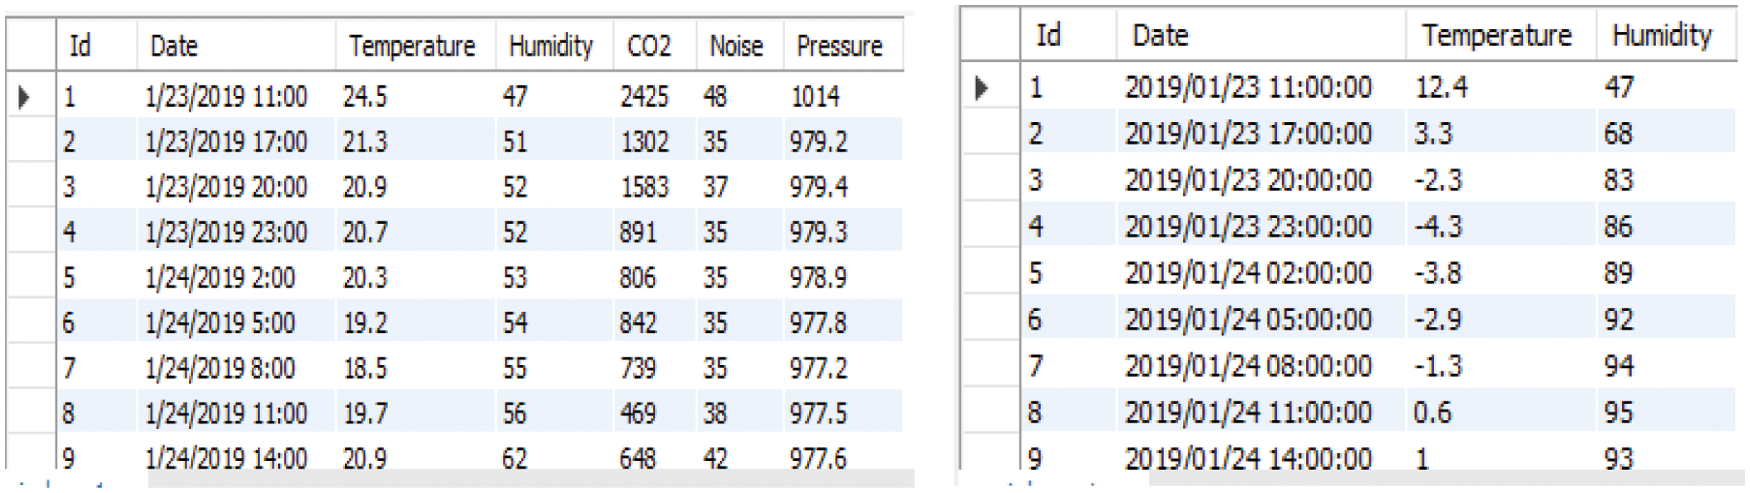
Figure 3: Data collected from the internal environment
The server is responsible for the connection between the database and the client interface. It receives the request’s client and will try to give correct answers by accessing the information in the database. The server component packages are indoor (contains the classes related to the indoor table. These classes expose methods which allows the apps to manipulate and facilitate the access and the use in best conditions of the data from the indoor table), outdoor (helps to manage and manipulate the data found in the outdoor table), user (besides the classes and interfaces offering access to the table with the same name, manage the users), configuration (contains the “cases” of error for the login sequence, the cases in which the data entered are not correct or other errors that may still occur when logging in), roles (used to select users after logging in), pom.xml (has a defining role in the implementation of the project and in structuring it as easy as possible for the user. It also contains the dependencies of the Maven type project, download, and import all the libraries that are used within the project) and resource (a directory that contains the application properties file where you can find details about connecting to the database).
Most of the project components contain the Model, Service, Controller, and Repository levels. Models are simple Java objects. Most of the time, the models become tables in the database and by transforming the tables into java objects it is much easier to access them. Fig. 4 contains the class diagram for server models:
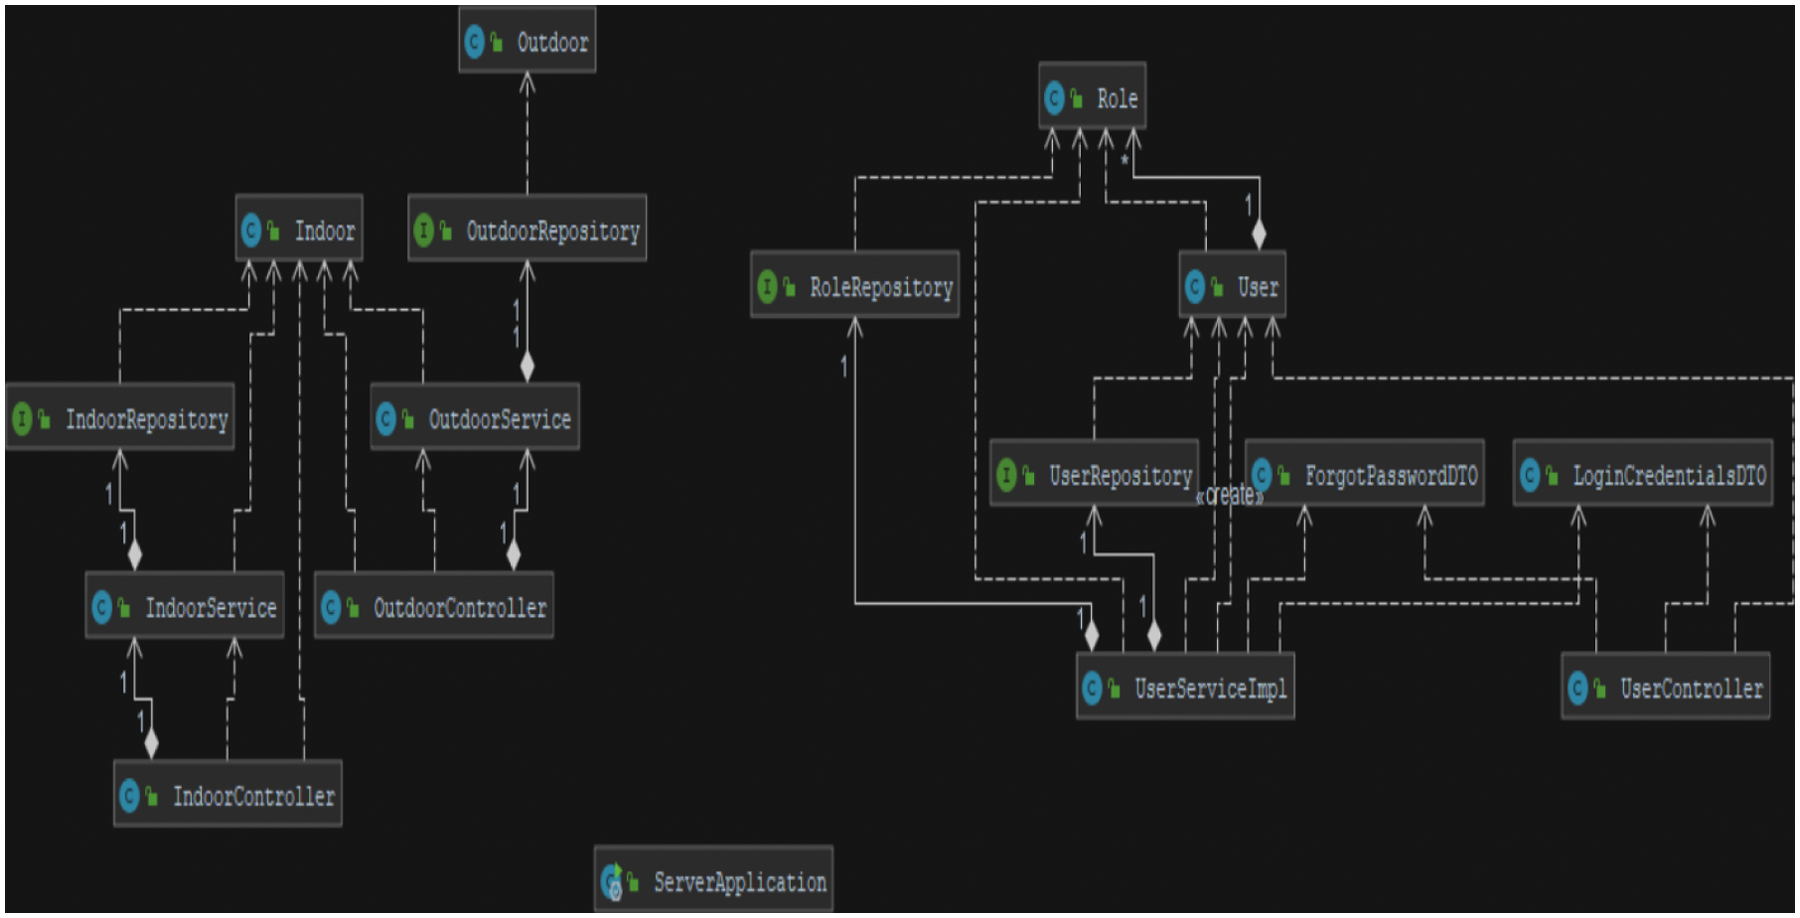
Figure 4: Class diagram for server application
Below are presented the activities within the client application.
❖ Login Activity
The Login part is the one that offers the first connection of the user with the created application. The user finds in this part of the application all the possibilities related to logging in the application, creating a user account or recovering the login data. For this purpose, the “Keep me signed in” switch is also used, by accessing the user-completed data stored in the corresponding fields.
Here are the possibilities of continuation from this interface:
• The user is at the first authentication or does not have a user account-it will be opted to press the register button that will open the activity with the same name. Without the creation of a user account, it will be impossible to authenticate and at the same time to go into the main activity. If the fields for the email and password have not been filled in, or the data entered does not correspond to those in the database, the user will be notified;
• The user already has an account-the fields will be filled in with the correct data, after which the Login button will be accessed. A request will be sent to the server, it will compare the data entered with the data saved in the database and will act accordingly. It would open the main interface if the data entered correspond to the data in the database, or, otherwise, a message with the type of problem will appear;
• The user forgot the authentication data-For this purpose the activity of the “Forgot Password” was created.
❖ Register Activity
It is an activity that opens after accessing the register button in the Login interface. Inside the EditTexts you find an additional text. This text is set to appear only when the field is not clicked. By simply clicking on the field, the text becomes invisible, and the user can fill in the fields with his credentials.
After the fields are completed, the “Register” button can be accessed, and if the data meet the criteria for completion, a request will be sent to the server. The server will receive the request with a value of PostMapping so the data is saved in the database.
❖ Forgot Password Activity
As a functionality, this interface can enter a correct email address to send the user an email message with a new random password.
❖ Main Activity
The user can select the period but also the parameter for which he wants to obtain information.
Fig. 5 presents the values of the temperature. Red line depicts the values of the indoor temperature, and the blue line depicts the values of the outdoor temperature. Because the temperatures are measured on a winter day, the graph shows an average of the outdoor values of −5 to +5, and indoor temperature values are between 18–22.
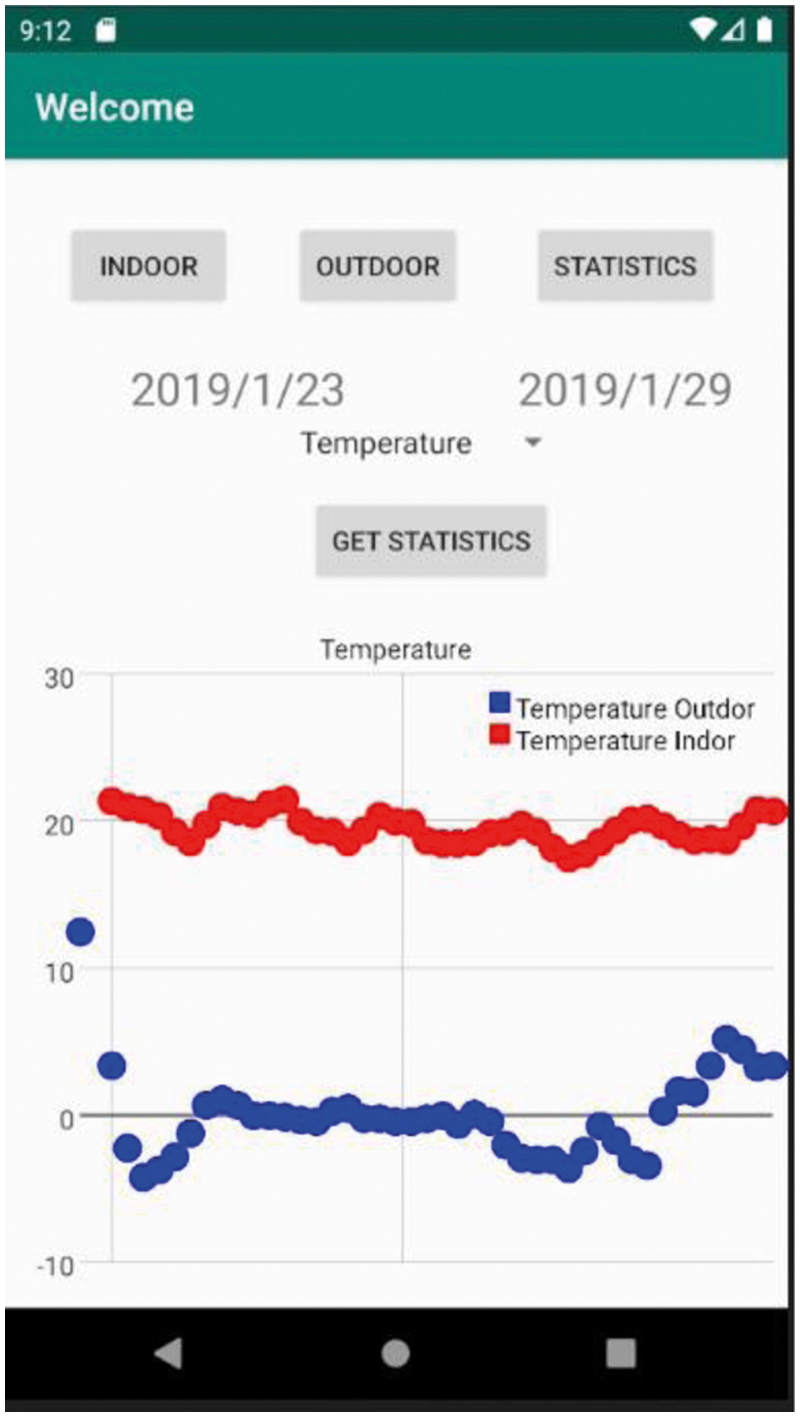
Figure 5: Temperature
Another functionality of the application is that when accessing a point on the graph, a message of type Toast is automatically displayed, with information on the value, date, and time at which that measurement was made, according to Fig. 6.
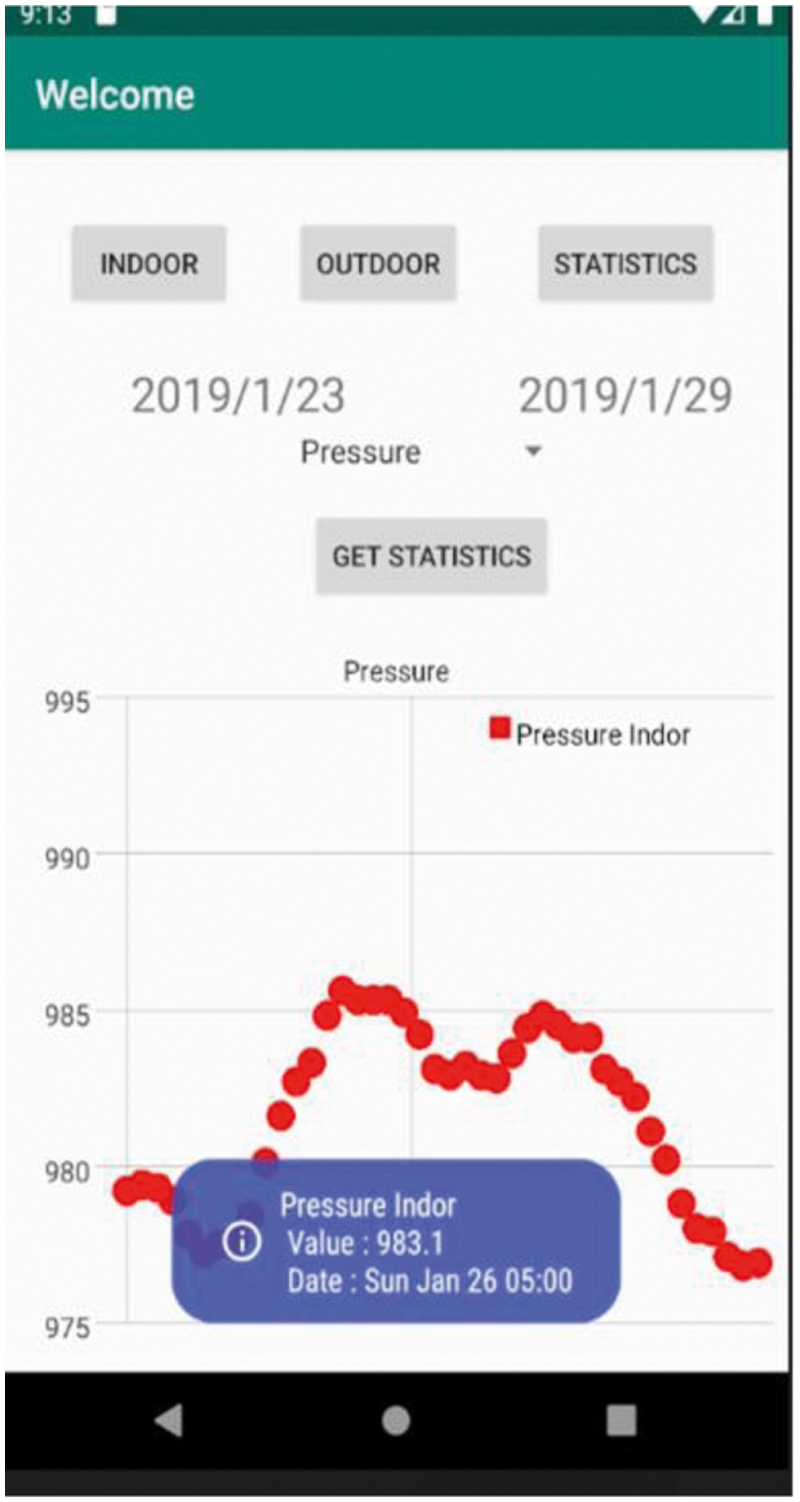
Figure 6: Pressure
Also, the graph depicting the CO2 parameter uses specific colors on the background in order graphically highlight whether the measured values fall within the normal range or have values above the normal limit. For a better understanding of the representation from Fig. 7, we will define the CO2 limit values and the pollution level:
• 250–350 ppm-the concentration level is normal;
• 350–1000 ppm-specific level for the indoor environment;
• 1000–2000 ppm-poor air quality, produces drowsiness;
• 2000–5000 ppm-stagnant, obsolete air;
• 5000 ppm-8 h exposure limit;
• >40,000 ppm-a major risk for those who inspire this air;
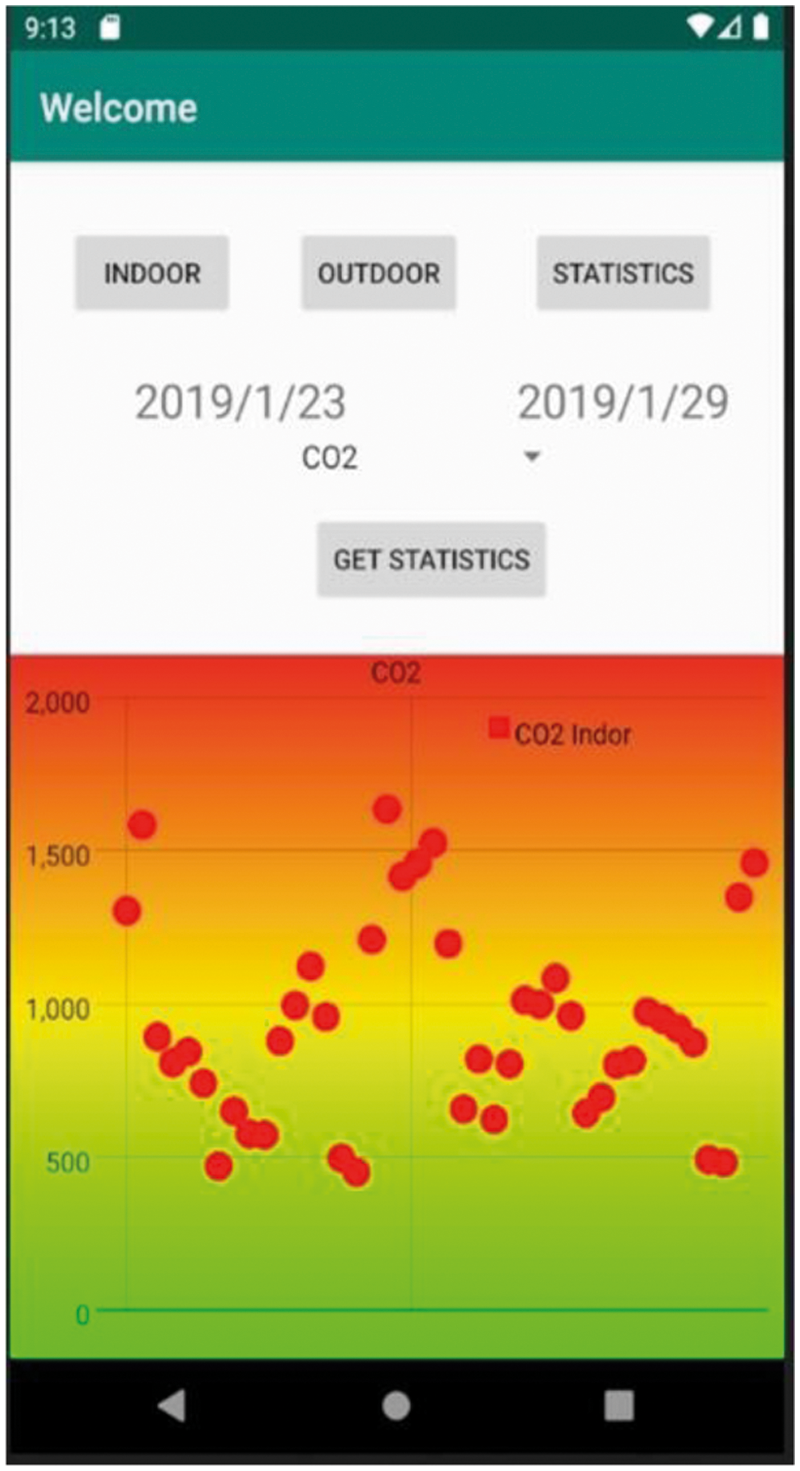
Figure 7: CO2
The values of the noise measured from the indoor environment during a day can be seen in Fig. 8.
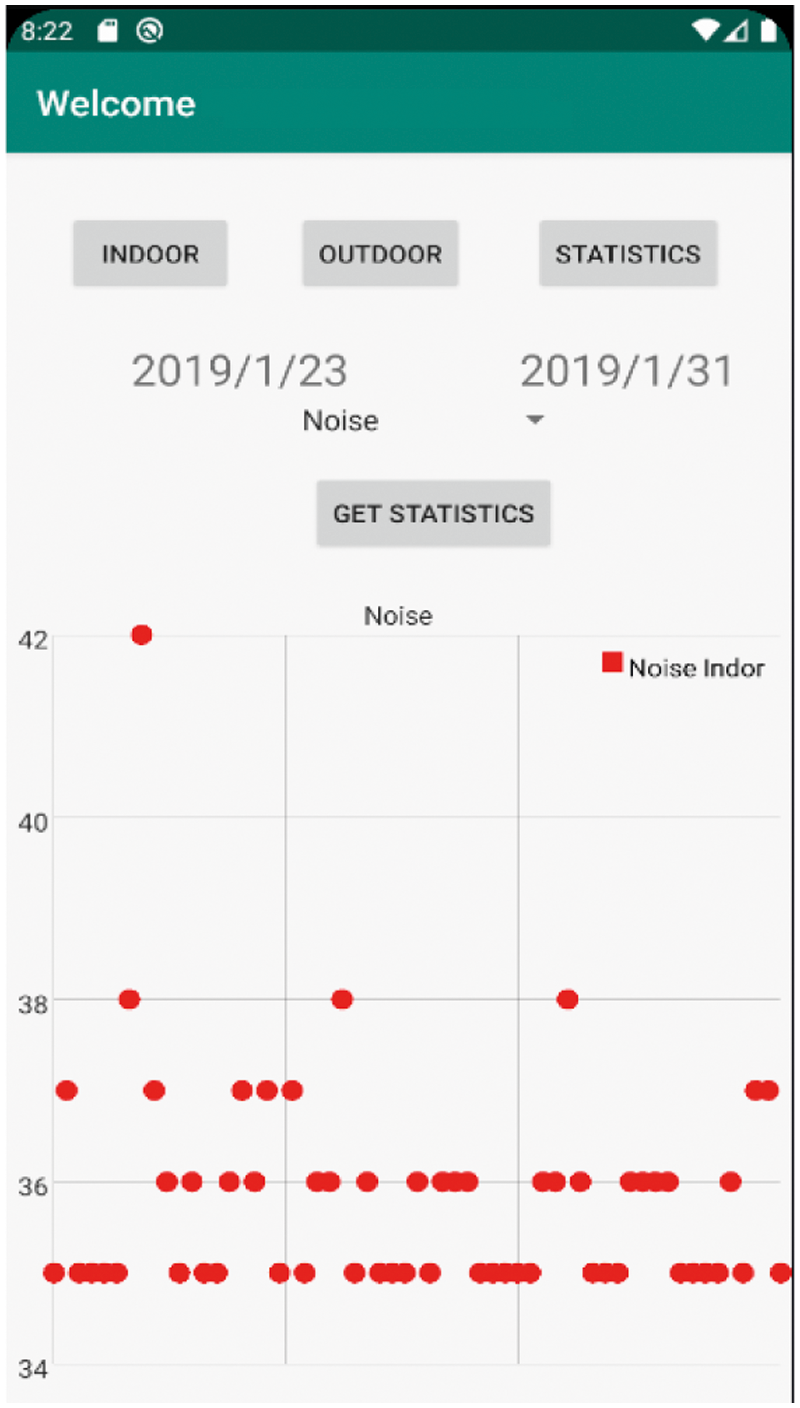
Figure 8: Noise
Fig. 9 shows the measured values of RH over a day. Like the temperature graph, the blue dots represent the measured values from the external environment, and with red, the values recorded in the internal environment. RH from the external environment has much higher values than RH from the internal environment.
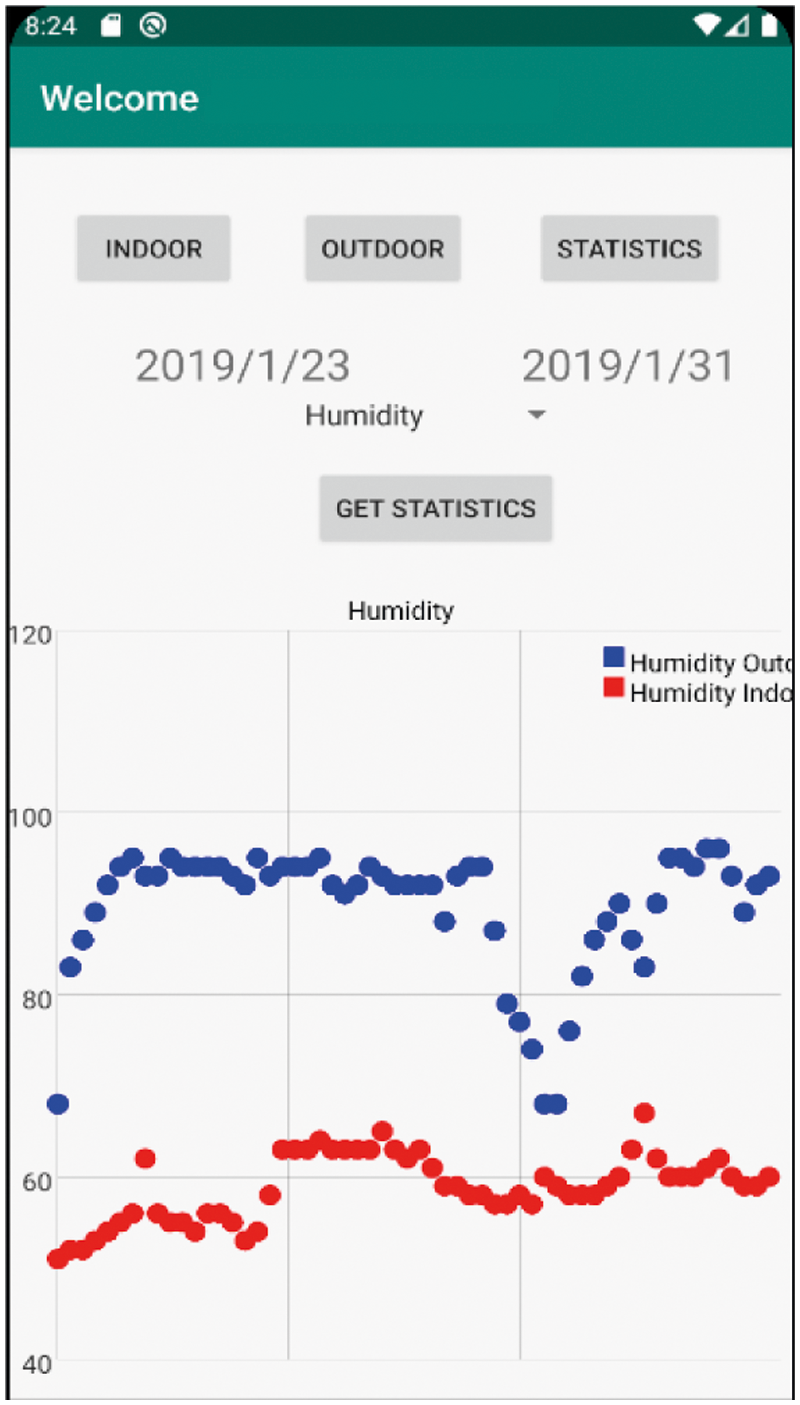
Figure 9: Humidity
As a conclusion, a client-server application for air quality monitoring has been developed. The Netatmo module was used to collect the data, subsequently, the data was stored in a database using MySQL.
A server has been implemented that allows the management of the user’s requests and offers the best options for satisfying his wishes.
The android application is protected by login form (username and password) and represents the client-side, which allows the user to see the evolutions of the monitored parameters in the form of graphs.
At the level of the Android application can be made improvements such as the implementation of a forecast section, able to predict further evolutions based on already existing data. Machine Learning can be used to achieve this component.
2.2 RH Prediction Using Machine Learning
This subchapter presents an ML-type model which can be used to predict environmental conditions.
This model trains and compares multiple regression algorithms in Azure ML Studio. The prediction of the RH inside a bedroom is presented, applying 5 automatic learning algorithms. This model presents the training and comparison of the regression models: BLR, DFR, BDTR, LR and NNR. The data used for training the model were collected by the Netatmo weather station.
Several algorithms of machine learning were used in the model. Evaluating and comparing these algorithms was done to find an optimal high-performance algorithm.
The dataset used in the model were collected during the period 26.05.2019–26.08.2019, with a sampling frequency of 30 min.
2.2.1 Combining Multiple Regression Performance Values
All regression performance values are combined and compared using the Execute R Script and Add Rows modules. The Evaluation module produces a single row table that contains different values. In the Execute R Script module, we extract the regression performance values and add the corresponding model name.
All Execute R Script modules in this model produce a single row table that contains the model’s name and different values. Finally, we use multiple Add Rows of modules to combine all regression performance values in one place.
Azure ML Studio was used to obtain the model. The model obtained can be seen in Fig. 10.
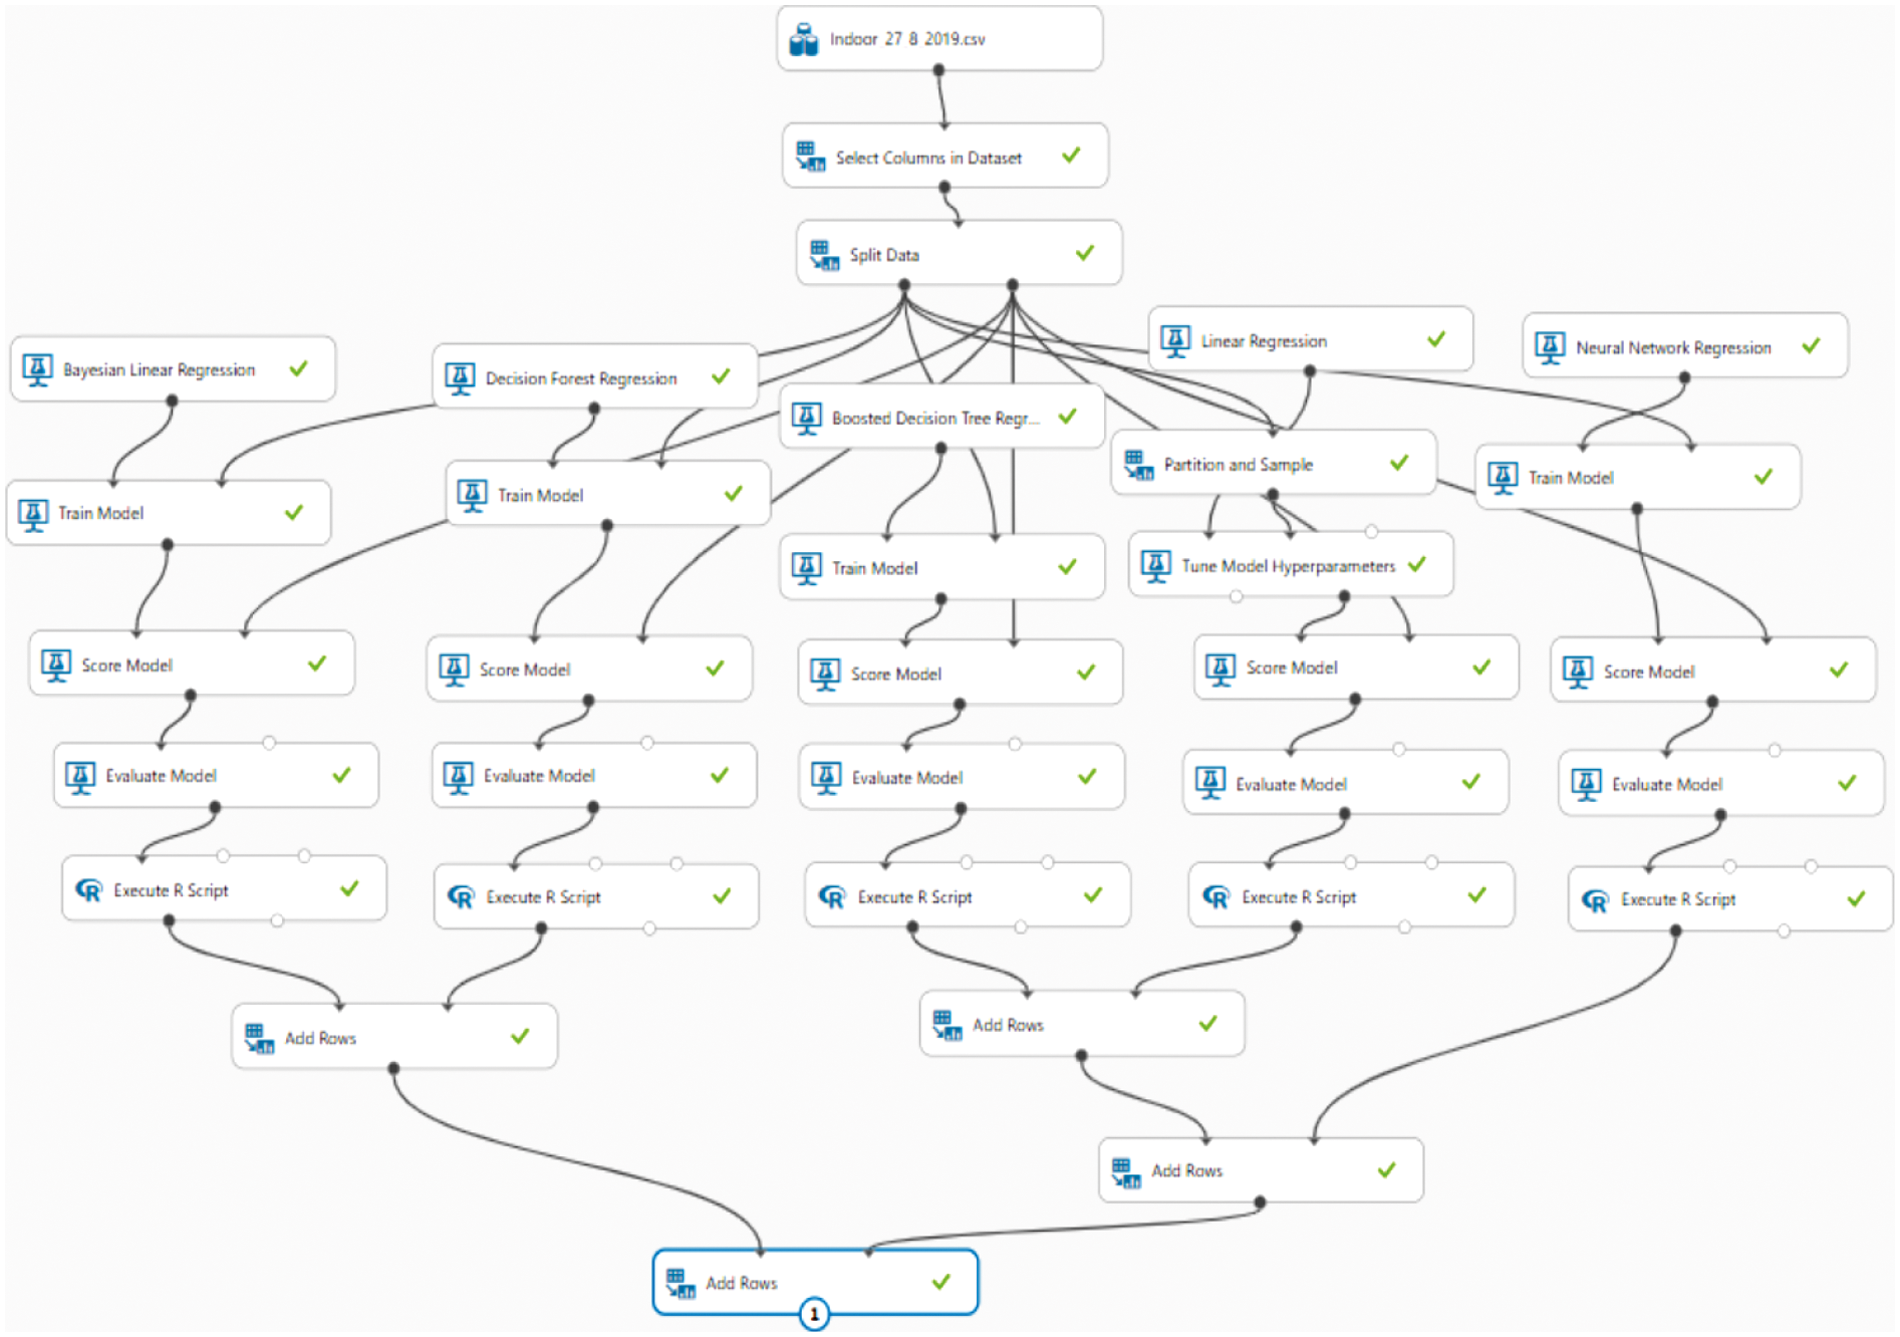
Figure 10: Comparison model of regression methods
The Train Model was used to train each algorithm; then the Score Model was used to make the prediction on the test data set; based on the prediction from the test data set, the Evaluation module is applied to calculate the regression performance for different algorithms.
For the Bayesian linear regression and the decision-making forest regression, the result of the Evaluation Model consists of the following 5 metrics: MAE, RMSE, RAE, RSE, CoD.
Witten et al. highlighted relevant regression metrics [31]. The most used parameter for the evaluation of the model is RMSE [32]. The root mean squared error is a useful formula for calculating the error rate of a regression model. If more of the values of this parameter tends to zero, the prediction provided by the model is more. Another important parameter in the regression problems is the coefficient of determination, with which we determine how well the data are generalized by the realized model. In the case of this parameter, values close to value 1 represent better data matching [33].
The results are presented in Tab. 1. The data set was divided into 70% for the training phase and 30% for the test phase.
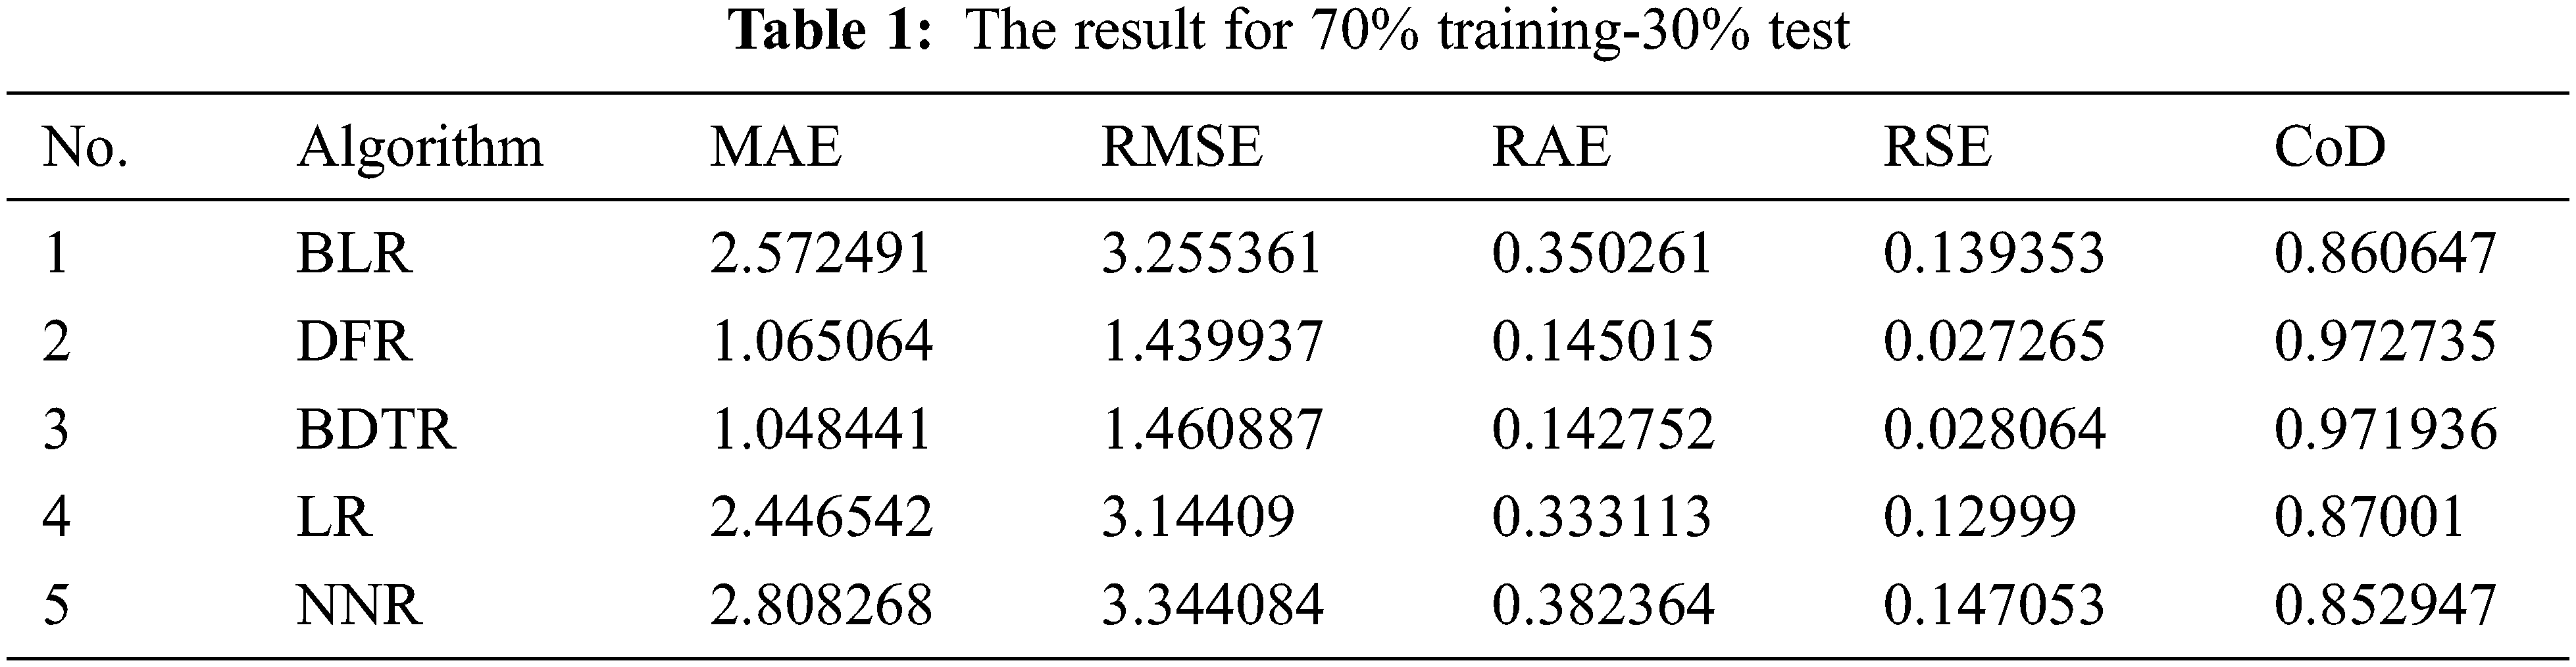
In the first test, the algorithm that has obtained the best performances is the DFR algorithm, followed by the BDTR algorithm with RMSE values of 1,439 and 1,460 respectively. The worst performances were obtained by the NNR and BLR algorithm with RMSE values of 3.344 and 3.255 respectively.
In the second test, the data set is divided into 60% for the training phase and 40% for the test phase, the results are presented in Tab. 2.
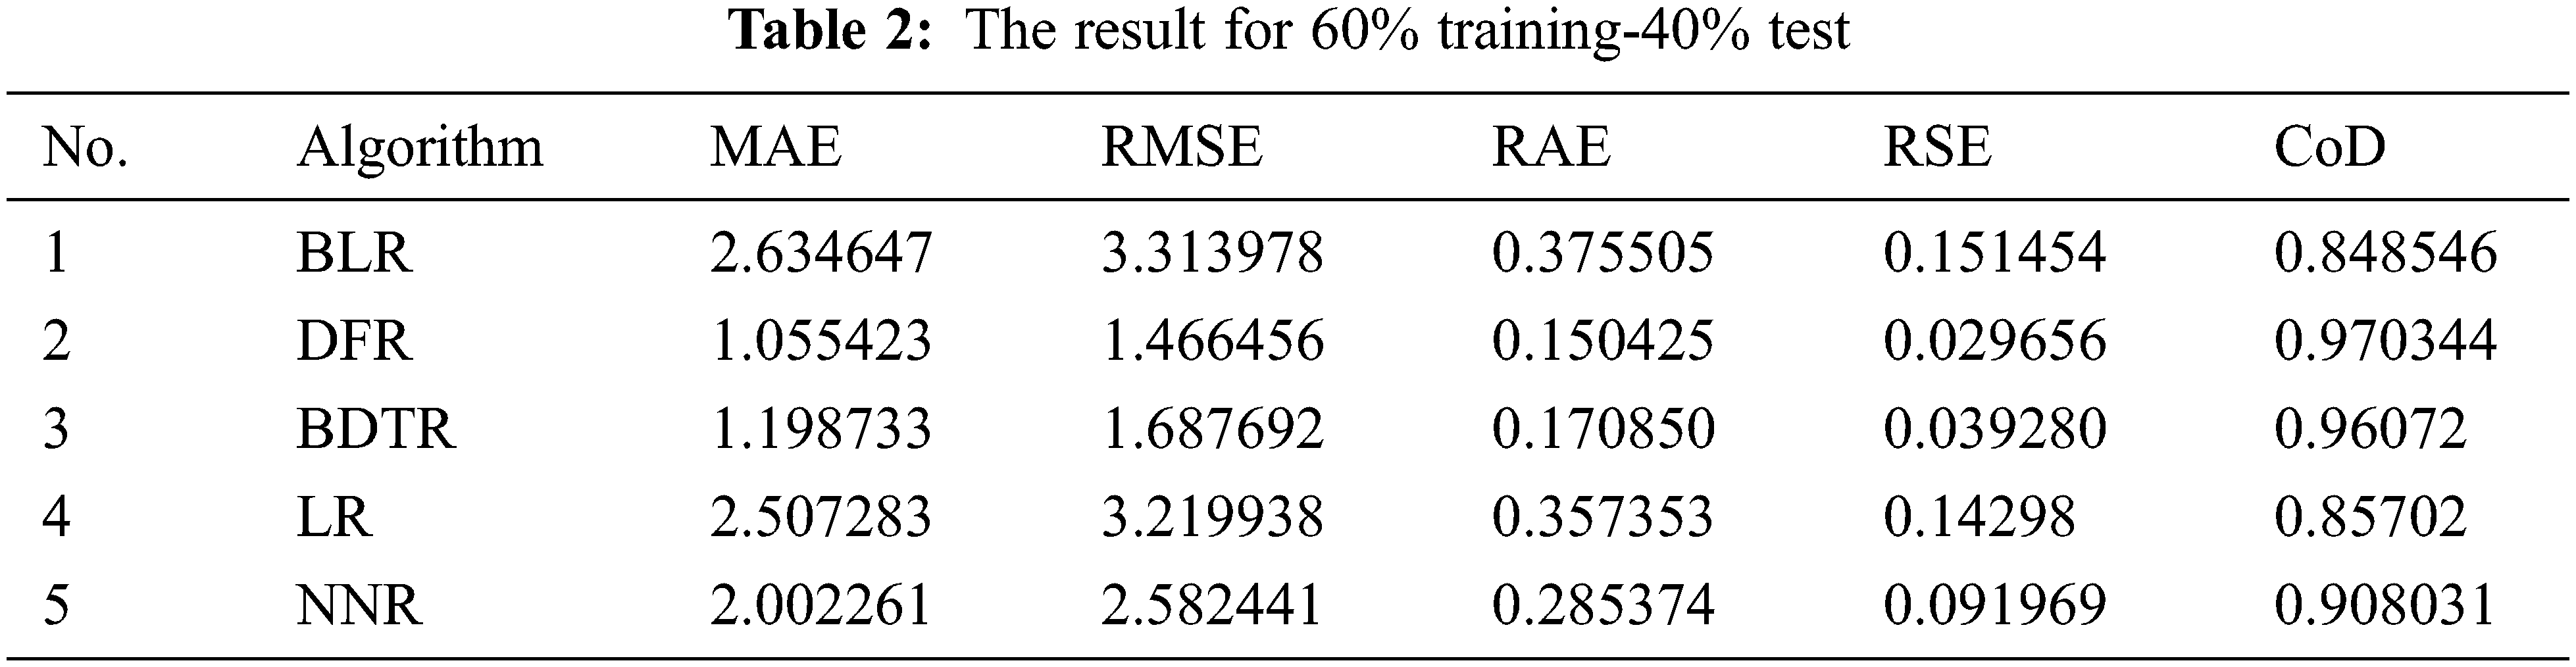
In the second test, the algorithm that has obtained the best performances is the DFR algorithm, followed by the BDTR algorithm with RMSE values of 1,466 and 1,687 respectively. The worst performances were obtained by the BLR and LR algorithm with RMSE values of 3,313 and 3.219 respectively.
If the data set is divided into 80% for the training phase and 20% for the test phase, the results are presented in Tab. 3.
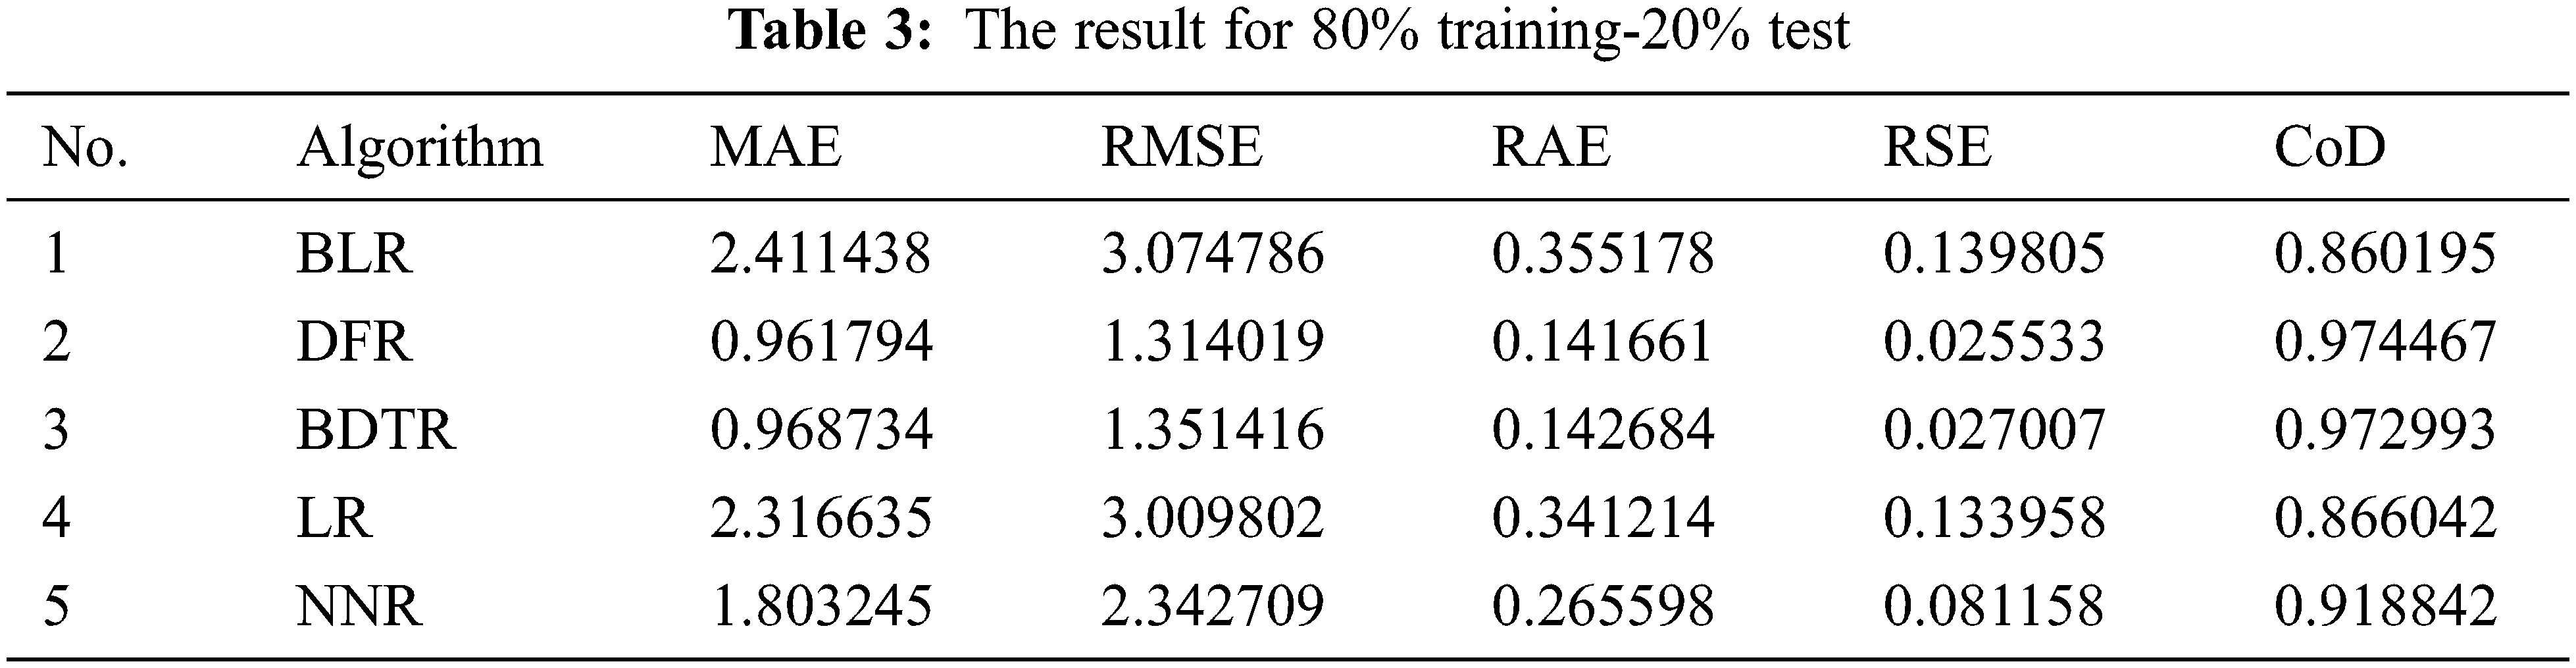
In the third test, the algorithm that has obtained the best performances is the DFR algorithm, followed by the BDTR algorithm with RMSE values of 1,314 and 1,351 respectively. The worst performances were obtained by the BLR and LR algorithm with RMSE values of 3,313 and 3.219 respectively.
The first column represents the name of the automatic learning algorithm used to generate a model, and the rest of the columns represent calculated regression values. In this model, in each of the three tests, Decision Forest Regression is the algorithm that achieves the best performance, followed by BDTR.
3 Conclusion and Future Research
The design and implementation of a client-server indoor and outdoor air quality monitoring application were presented in this paper. Also, another goal was to introduce a model for predicting the relative humidity related to the air quality monitoring system. For that, a working client-server program was developed. Through the server, the client is connected to a database, where the data is being stored and used for prediction. The Android client application is using the data obtained by the Netatmo module’s built-in sensors. In the form of graphs, the program attempts to present the user the quality of air both indoors and outdoors. Additionally, for the prediction model, many regression techniques are incorporated in Azure ML Studio to obtain a suitable model. The model forecasts the relative humidity in an enclosed location. Using Azure ML Studio, five automated learning models were trained and compared. They were: BLR, DFR, BDTR, LR, and NNR.
The goal was to compare evaluation metrics (MAE, RMSE, RAE, RSE, and CoD) for each trained algorithm in order to select the best regression method. DFR is the algorithm that performed the best when using the RH model. When compared to the other algorithms, DFR has a reduced RMSE and a coefficient of determination that is near to 1.
The results showed a better DFR performance for the RH prediction, with RMSE values of 1.439, 1.466 respectively 1.314 for the 3 types of tests performed. Therefore, the presented system improves the safety of the environment by rapidly assessing and predicting indoor air quality.
As future research, the DFR algorithm can be implemented in the mobile application and the Android application will show the RH prediction. It is also very important to consider other parameters, such as T, CO2, VOC, AQI (Air Quality Index) for analyzing the performance of ML algorithms.
Another possible improvement of the application is that it runs in the background, and when certain values exceed the normal limits, the user is notified by SMS or audio alarm.
Thus, we can configure in each area of interest, a Netatmo station, and from the mobile application we can select a specific area, and we can return the data/results from that area.
Acknowledgement: This paper was financially supported by the Project “Entrepreneurial competences and excellence research in doctoral and postdoctoral programs-ANTREDOC”, project cofounded by the European Social Fund financing agreement No. 56437/24.07.2019.
Funding Statement: The authors received no specific funding for this study.
Conflicts of Interest: The authors declare that they have no conflicts of interest to report regarding the present study.
1. R. A. Godson, M. M. Oyewale and G. A. Fakunle, “Indoor air quality and risk factors associated with respiratory conditions in Nigeria,” in Current Air Quality Issues, Farhad Nejadkoorki: IntechOpen, 2015. https://doi.org/10.5772/59864. [Online]. Available: https://www.intechopen.com/chapters/48283. [Google Scholar]
2. Y. Al Horr, M. Arif, M. Katafygiotou, A. Mazroei, A. Kaushik et al., “Impact of indoor environmental quality on occupant well-being and comfort: A review of the literature,” International Journal of Sustainable Built Environment, vol. 5, no. 1, pp. 1–11, 2016. [Google Scholar]
3. J. Saini., M. Dutta and G. Marques, “A comprehensive review on indoor air quality monitoring systems for enhanced public health,” Sustainable Environment Research, vol. 30, no. 6, pp. 1–12, 2020. [Online]. Available: https://doi.org/10.1186/s42834-020-0047-y. [Google Scholar]
4. S. Zanni, F. Lalli, E. Foschi, A. Bonoli and L. Mantecchini, “Indoor air quality real-time monitoring in airport terminal areas: An opportunity for sustainable management of micro-climatic parameters,” Sensors, vol. 18, no. 11, pp. 3798–3812, 2018. [Online]. Available: https://doi.org/10.3390/s18113798. [Google Scholar]
5. L. Mečiarová, S. Vilčeková, E. K. Burdová and J. Kiselák, “Factors effecting the total volatile organic compound (TVOC) concentrations in Slovak households,” International Journal of Environmental Research and Public Health, vol. 14, no. 12, pp. 1443–1468, 2017. [Online]. Available: https://doi.org/10.3390/ijerph14121443. [Google Scholar]
6. United States Environmental Protection Agency, “Introduction to indoor air quality,” 2017. [Online]. Available: https://www.epa.gov/indoor-air-quality-iaq/introduction-indoor-air-quality. [Google Scholar]
7. Conserve Energy Future, 2021, How Does Humidity Affect Air Pollution?. [Online]. Available: https://www.conserve-energy-future.com/how-humidity-affect-air-pollution.php. [Google Scholar]
8. P. Wolkoff, “Indoor air humidity, air quality, and health–An overview,” International Journal of Hygiene and Environmental Health, vol. 221, no. 3, pp. 376–390, 2018. [Google Scholar]
9. M. M. Derby, M. Hamehkasi, S. Eckels, G. M. Hwang, B. Jones et al., “Update of the scientific evidence for specifying lower limit relative humidity levels for comfort, health, and indoor environmental quality in occupied spaces (RP-1630),” Science and Technology for the Built Environment, vol. 23, no. 1, pp. 30–45, 2017. [Online]. Available: https://doi.org/10.1080/23744731.2016.1206430. [Google Scholar]
10. F. Schulze, X. Gao, D. Virzonis, S. Damiati, M. R. Schneider et al., “Air quality effects on human health and approaches for its assessment through microfluidic chips,” Genes (Basel), vol. 8, no. 10, pp. 244, 2017. [Online]. Available: https://doi.org/10.3390/genes8100244. [Google Scholar]
11. A. Nasriddinov, M. Rumyantseva, A. Marikutsa, A. Gaskov, J. -H. Lee et al., “Sub-ppm formaldehyde detection by n-n tio2@sno2 nanocomposites,” Sensors, vol. 19, no. 14, pp. 3182, 2019. [Online]. Available: https://doi.org/10.3390/s19143182. [Google Scholar]
12. S. Sun, X. Zheng, J. Villalba-Diez and J. Ordieres-Mere, “Indoor air-quality data-monitoring system: Long-term monitoring benefits,” Sensors, vol. 19, no. 19, pp. 4157–4174, 2019. [Online]. Available: https://doi.org/10.3390/s19194157. [Google Scholar]
13. D. H. De La Iglesia, J. F. De Paz, G. V. González, A. L. Barriuso and J. Bajo, “A context-aware indoor air quality system for sudden infant death syndrome prevention,” Sensors, vol. 18, no. 3, pp. 757, 2018. [Online]. Available: https://doi.org/10.3390/s18030757. [Google Scholar]
14. J. Kang and K.-Il Hwang, “A comprehensive real-time indoor air-quality level indicator,” Sustainability, vol. 8, no. 9, pp. 881, 2016. [Online]. Available: https://doi.org/10.3390/su8090881. [Google Scholar]
15. G. Marques and R. Pitarma, “An indoor monitoring systems for ambient assisted living based on internet of things architecture,” International Journal of Environment Research and Public Health, vol. 13, no. 11, pp. 1152, 2016. [Google Scholar]
16. S. Abraham and X. Li, “A Cost-effective wireless sensor network system for indoor air quality monitoring applications,” in Proc. the 9th Int. Conf. on Future Networks and Communications (FNC-2014Procedia Computer Science, 34, pp. 165–171, Canada, 2014. [Google Scholar]
17. J. Kim and H. Hwangbo, “Sensor-based optimization model for air quality improvement in home IoT,” Sensors, vol. 18, no. 4, pp. 959, 2018. [Online]. Available: https://doi.org/10.3390/s18040959. [Google Scholar]
18. Y. Sung, S. Lee, Y. Kim and H. Park, “Development of a smart air quality monitoring system and its operation,” Asian Journal of Atmospheric Environment, vol. 13, no. 1, pp. 30–38, 2019. [Google Scholar]
19. D. Rüffer, F. Hoehne and J. Bühler, “New digital metal-oxide (mox) sensor platform,” Sensors, vol. 18, no. 4, pp. 1052–1063, 2018. [Online]. Available: https://doi.org/10.3390/s18041052. [Google Scholar]
20. H. Ji, H. Zhang, K. Zhou and P. Liu, “Design of indoor environment monitoring system based on internet of things,” in Proc. IOP Conf. Series Earth and Environmental Science, vol. 252, pp. 42012, Xi’an, China, 2019. [Google Scholar]
21. M. Benammar, A. Abdaoui, S. H. M. Ahmad, F. Touati and A. Kadri, “A modular IoT platform for real-time indoor air quality monitoring,” Sensors, vol. 18, no. 2, pp. 581–598, 2018. [Online]. Available: https://doi.org/10.3390/s18020581. [Google Scholar]
22. S. -Y. Chen and C. -Y. Chen, “Use of multi-agent theory to resolve complex indoor air quality control problems,” Sensors, vol. 19, no. 5, pp. 1206–1221, 2019. [Online]. Available: https://doi.org/10.3390/s19051206. [Google Scholar]
23. W. -T. Sung, S. -J. Hsiao and J. -A. Shih, “Construction of indoor thermal comfort environmental monitoring system based on the IoT architecture,” Journal of Sensors, vol. 2019, pp. 1–16, 2019. [Google Scholar]
24. J. Kim, C. Chu and S. Shin, “ISSAQ: An integrated sensing systems for real-time indoor air quality monitoring,” Sensors Journal, IEEE, vol. 14, no. 12, pp. 4230–4244, 2014. [Online]. Available: https://doi.org/10.1109/JSEN.2014.2359832. [Google Scholar]
25. D. M. Broday, “Wireless distributed environmental sensor networks for air pollution 426 measurement—the promise and the current reality,” Sensors, vol. 17, no. 10, pp. 2263–2279, 2017. [Online]. Available: https://doi.org/42710.3390/s17102263. [Google Scholar]
26. J. Ahn, D. Shin, K. Kim and J. Yang, “Indoor air quality analysis using deep learning with sensor data,” Sensors, vol. 17, no. 11, pp. 1–13, 2017. [Online]. Available: https://doi.org/10.3390/s17112476. [Google Scholar]
27. J. A. Adeleke, D. Moodley, G. Rens and A. O. Adewumi, “Integrating statistical machine learning in a semantic sensor web for proactive monitoring and control,” Sensors, vol. 17, no. 4, pp. 1–23, 2017. [Online]. Available: https://doi.org/10.3390/s17040807. [Google Scholar]
28. A. Holzinger, “Interactive machine learning for health informatics: When do we need the human-in-the-loop?,” Brain Informatics, vol. 3, pp. 119–131, 2016. [Online]. Available: https://doi.org/10.1007/s40708-016-0042-6. [Google Scholar]
29. P. Mahta, M. Bukov, C. -H. Wang, A. G. R. Day, C. Richardson et al., “A High-bias, low-variance introduction to machine learning for physicists,” Physics Reports, vol. 810, pp. 1–124, 2019. [Online]. Available: https://doi.org/10.1016/j.physrep.2019.03.001. [Google Scholar]
30. D. Fumo, “Types of machine learning algorithms you should know,” Towards Data Sciente, Jun 2017. [Online]. Available: https://towardsdatascience.com/types-of-machine-learning-algorithms-you-should-know-953a08248861. [Google Scholar]
31. I. H. Witten, E. Frank, M. A. Hall and C. J. Pal, Data Mining: Practical Machine Learning Tools and Techniques, 4th ed., Morgan Kaufmann, United States, October 1, 2016. [Online]. Available: https://www.sciencedirect.com/book/9780128042915/data-mining#book-info. [Google Scholar]
32. Blanca Li, “How to evaluate model performance in Azure Machine Learning Studio, 2021”. [Online]. Available: https://docs.microsoft.com/en-us/azure/machine-learning/classic/evaluate-model-performance. [Google Scholar]
33. D. Chicco, M. J. Warrens and G. Jurman, “The coefficient of determination R-squared is more informative than SMAPE, MAE, MAPE, MSE and RMSE in regression analysis evaluation,” PeerJ Computer Science, vol. 7, pp. e623, 2021. [Google Scholar]
 | This work is licensed under a Creative Commons Attribution 4.0 International License, which permits unrestricted use, distribution, and reproduction in any medium, provided the original work is properly cited. |