DOI:10.32604/iasc.2023.024469
| Intelligent Automation & Soft Computing DOI:10.32604/iasc.2023.024469 | |
| Article |
Optimal Unification of Static and Dynamic Features for Smartphone Security Analysis
1Scientific Analysis Group, DRDO, Delhi, 110054, India
2Delhi Technological University, Delhi, 110042, India
*Corresponding Author: Sumit Kumar. Email: sumitkr@hotmail.com
Received: 18 October 2021; Accepted: 14 December 2021
Abstract: Android Smartphones are proliferating extensively in the digital world due to their widespread applications in a myriad of fields. The increased popularity of the android platform entices malware developers to design malicious apps to achieve their malevolent intents. Also, static analysis approaches fail to detect run-time behaviors of malicious apps. To address these issues, an optimal unification of static and dynamic features for smartphone security analysis is proposed. The proposed solution exploits both static and dynamic features for generating a highly distinct unified feature vector using graph based cross-diffusion strategy. Further, a unified feature is subjected to the fuzzy-based classification model to distinguish benign and malicious applications. The suggested framework is extensively experimentally validated through both qualitative and quantitative analysis and results are compared with the existing solutions. Performance evaluation over benchmarked datasets from Google Play Store, Drebin, Androzoo, AMD, and CICMalDroid2020 revealed that the suggested solution outperforms state-of-the-art methods. We achieve average detection accuracy of 98.62% and F1 Score of 0.9916.
Keywords: Fusion; smartphone; android; security analysis; malware detection
Smartphones are deeply rooted in the digital market due to their potential applications in 4G and 5G-based wireless networks. Android upheld its status as a leading smartphone OS universally in September 2020, with 85% of the total market share [1]. The profound growth of mobile technology brings significant measures to be incorporated in the mobile security landscape. Also, sum of existing apps in the Google Play repository has been increased to 3.047 million [2]. However, this deluge of mobile apps attracted the malice writers to infuse malwares in these apps for nefarious deeds and the number of new android malwares are also growing as 482579 [3] malware samples per month. Android malicious applications (malapps) proliferate due to the easiness of installing fresh apps from third-party [4] sources. Amongst different mobile OS, Android is the most widespread platform because of its open architecture. Unluckily, android based smartphones have progressively turned into the key target of the attackers, thereby enforcing urgency for mobile app security. On the other hand, Linux based OS like SailfishOS, PostmarketOS, Ubuntu Touch, Mobian, LuneOS etc. are also vulnerable to malwares. But due to their limited presence, the attacks are also limited.
Abundant literature is available on static and dynamic analysis to detect malapps and other unintended functionalities in Android apps. Generally, malign (M) apps are camouflaged as benign (B) apps causing system impairment, financial damage, and information seepage. Malign apps can also form mobile botnets. Numerous investigation mechanism has been suggested to identify malapps. The detection mechanism can be broadly characterized into static and dynamic analysis. Static analysis analyzes code and the manifest.xml file of the app without executing them [5]. However, in dynamic analysis, apps are executed and the run-time activities of the apps are analyzed for building solutions. Mostly, static-analysis is thwarted by code-obfuscation and code-polymorphism resulting in variations of malware to escape detections. Whereas, dynamic analysis is favorable for analyzing these types of obfuscated apps.
To build a solution to address these issues, static and dynamic features are exploited by the various machine learning(ML) algo to detect the android malwares [6]. The static features mostly used are permissions, app components, intents, API, network address, opcode, hardware component, call flow graph, static taint analysis, dataflow, file property, system command, and native code [7]. On the other hand, the dynamic features frequently used are system calls, API calls, network traffic characteristics, and battery features [8]. In hybrid analysis, both static and dynamic features are exploited for malicious app detection [9]. We propose a hybrid solution that combines both static and dynamic analysis to overcome the limitations of static and dynamic analysis.
In brief, the key contributions of our paper are described as below:
1. First, we put forward a unique approach for optimal unification of static and dynamic features resulting in Unified feature (UF) for smartphone security analysis by cross diffusion technique.
2. Second, UF is fed to two ML classifiers to detect the android malapps. Results of these classifier’s scores were combined by fuzzy based fusion approach for improving the performance.
3. Lastly, we provided a comprehensive study founded on benchmarked databases and compare the results with contemporary techniques to validate the efficacy of the suggested framework.
The rest of this manuscript is organized as follows. Section 2 covers the android malapp detection-related work. Section 3 explicates core design of our suggested unified framework for malapp detection. Section 4 covers details of the datasets and experimental scheme. Section 5 covers the experimental results of suggested model by qualitative and quantitative methods. In Section 6, we discuss about the suggested framework and its comparison with other state-of-the-arts methods. Section 7 covers some limitations of the proposed methodology. Finally, under Section 8, concluding comments together with future directions for the suggested work are emphasized.
Smartphone security analysis has been extensively studied in the literature wherein ML based approaches have been surveyed in reported work [10–12]. Also, hybrid techniques exploiting both static and dynamic features for malicious app detection can address the major limitations of static and dynamic analysis. Surveys [13–15] available on static and dynamic analysis techniques also conclude that hybrid technique comprising both static and dynamic features is the better alternative to static and dynamic analysis methods.
In this section, to measure the research gap in the latest work, we have reviewed the work in the research papers based on the hybrid security analysis techniques with ML algorithms and without ML algorithms.
2.1 Hybrid Security Analysis Techniques without ML Algorithms
The authors in [16] presented a hybrid model DAMBA based on client/server architecture. It can detect the android malapps by constructing the directed graphs depicting the object reference information with 96.9% detection accuracy and a detection time of approximately 5 seconds. Hybrid analysis approach “mad4a” offered by the authors [17] for android malapp detection leveraging advantages of both the dynamic and static analysis methods. In this, authors pointed out some undervalued characteristics of android malapp that can further help the investigators to augment their knowledge for detecting android malapps. In this, API calls and network logs were used as static and dynamic features respectively.
Manzanares et al. offered a novel hybrid analysis method “KronoDroid” [18] that addresses the time and data platform source. Here, 489 static and dynamic features were used for generating hybrid dataset with labelled timestamps on each sample to detect the malapps with high accuracy. A hybrid method [19] “DirectDroid”, that merges fuzzing and a novel app analysis procedure “on-demand forced execution” to activate concealed malicious behaviour. It can effectively detect malapps by the “augmenting fuzzing” technique. This method could not cater to obfuscated codes in the malapps. In sum, hybrid security analysis techniques without ML are limitedly applied for malapp detection.
2.2 Hybrid Security Analysis Techniques with ML Algorithms
In [20], a multi-level hybrid model SAMADroid for effective android based malapp detection was proposed. Static analysis results were determined on the remote host. Smartphone was used for the dynamic analysis. Machine learning algorithms Support Vector Machine (SVM), Random Forest (RF), Naïve Bayes(NB), and Decision Trees (DT) were used to train the model to detect malapps with 98.5% of TPR. In [21], a hybrid model using API calls and permissions was suggested. SVM and RF classifiers were further leveraged to achieve a true positive rate of up to 89%. Authors in [22] presented a model for android malapp detection with intents, permission, and API calls as features and compare the results with four ML classifiers viz. RF, NB, Gradient Boosting(GB), and DT. Accuracy of 96% and TP rate (TPR) of 0.85 were achieved with GB classifier. In [23], authors exploited static and dynamic feature vectors to detect malapps with 89.7% accuracy with a voting classifier-based fusion approach.
A hybrid model [24] implements dynamic analysis on the outcomes of static investigations. API calls and permissions were used as static features, while system calls were used as dynamic features to identify the malapps with an accuracy of 94.6%. Improved Bayesian classifier was used in static analysis and ensemble of three classifiers viz. RF, GC Forest, and XG boost were used for dynamic analysis. A Hybrid method “MADAM” [25] was proposed to detect the malapps on a rooted device by extracting static and dynamic features. A feature vector was formed and input was given to K-NN classifier to obtain an accuracy of 96.9%. Detection accuracy of 94.7% was achieved.
Dhalaria et al. [26] proposed the hybrid framework by combining the static and dynamic features for the classification of malapp and family it belong and 90.10% to by creating the two feature oriented datasets. This method attains accuracies of 98.53% for malapp detection and 90.10% for its family classification. Kabakus et al. [27]presented a hybrid analysis method for detecting malapps with the maximum detection accuracy of 99.5% when using J48 ML algorithm.
Karim et al. [28] proposed a hybrid android smartphone botnet detection platform by exploiting the API calls, permissions as static features and network traffic-based dynamic features for detecting the botnets with high detection accuracy of 98% with RF algo. Ding et al. [29] presented a ResLSTM based hybrid model using static features and traffic based dynamic features to achieve the detection accuracy of 99%. The subsequent section elaborates on the proposed android malapp detection framework. In sum, ML based smartphone security analysis has shown promising results and were in use. But optimal combining of static and dynamic features were limitedly addressed.
3 Core Design of Proposed Framework
In this paper, a unified feature resulting from optimal combination of static and dynamic features followed by fuzzy-based score fusion model for smartphone security analysis is proposed. The outline of the suggested hybrid analysis framework is described in Fig. 1. Framework basically comprised of four building blocks namely, feature extraction (static and dynamic vector formation), feature fusion, classifier fusion, and eventually a decision block for effective malapp detection. Extracted dynamic features and static features are converted into dynamic and static feature vectors. Each dynamic and static feature vector is used for producing similarity graphs using the cosine similarity. Similarity graphs are further subjected to normalization so as to produce the normalized graphs. Using the reference curves for dynamic and static feature vectors, we obtain refined graph for dynamic and static feature vectors. The obtained dynamic and static normalized and refined graphs are further cross diffused to produce a diffused graph corresponding to the dynamic and static feature vectors. The diffused graphs of dynamic and static feature vectors are fused to generate a unified feature which is extremely discriminatory. This discriminative unified feature is given to two ML classifiers so as to classify a test app into Benign (B) or Malicious (M).
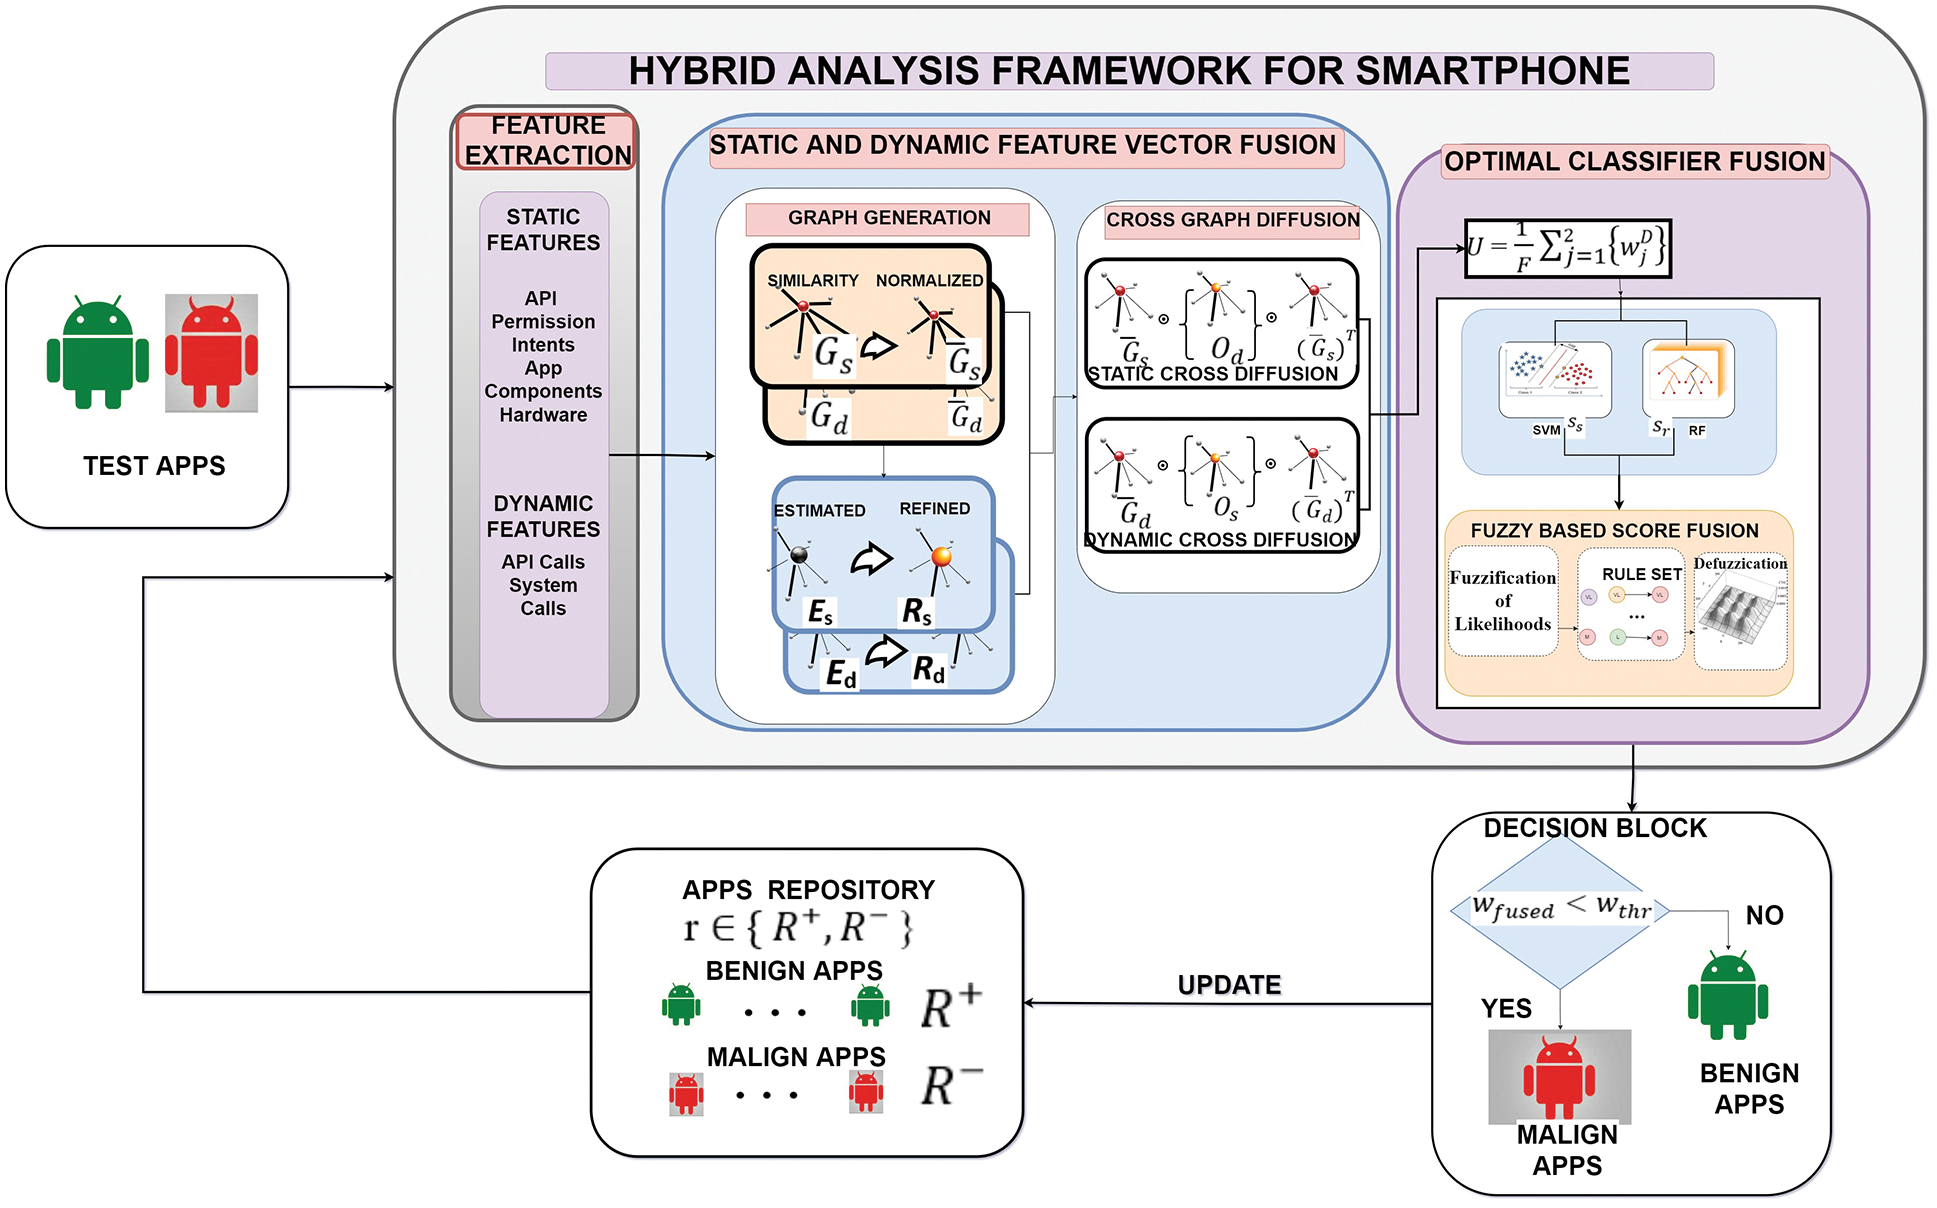
Figure 1: Proposed hybrid analysis framework for smartphone
Our methodology exploits two classifiers in parallel whose scores are fused using fuzzy-based fusion technique to enhance the overall performance. Lastly, the final score
The description of the suggested framework is as follows:
Feature fusion block comprises static and dynamic feature vector generation after extracting the five static features and two dynamic features. In the proposed model, feature fusion is basically the concatenation of diffused graphs corresponding to static and dynamic feature vectors obtained by cross-diffusion process of normalized and refined graphs.
Five static and two dynamic features were extracted for a given android test app
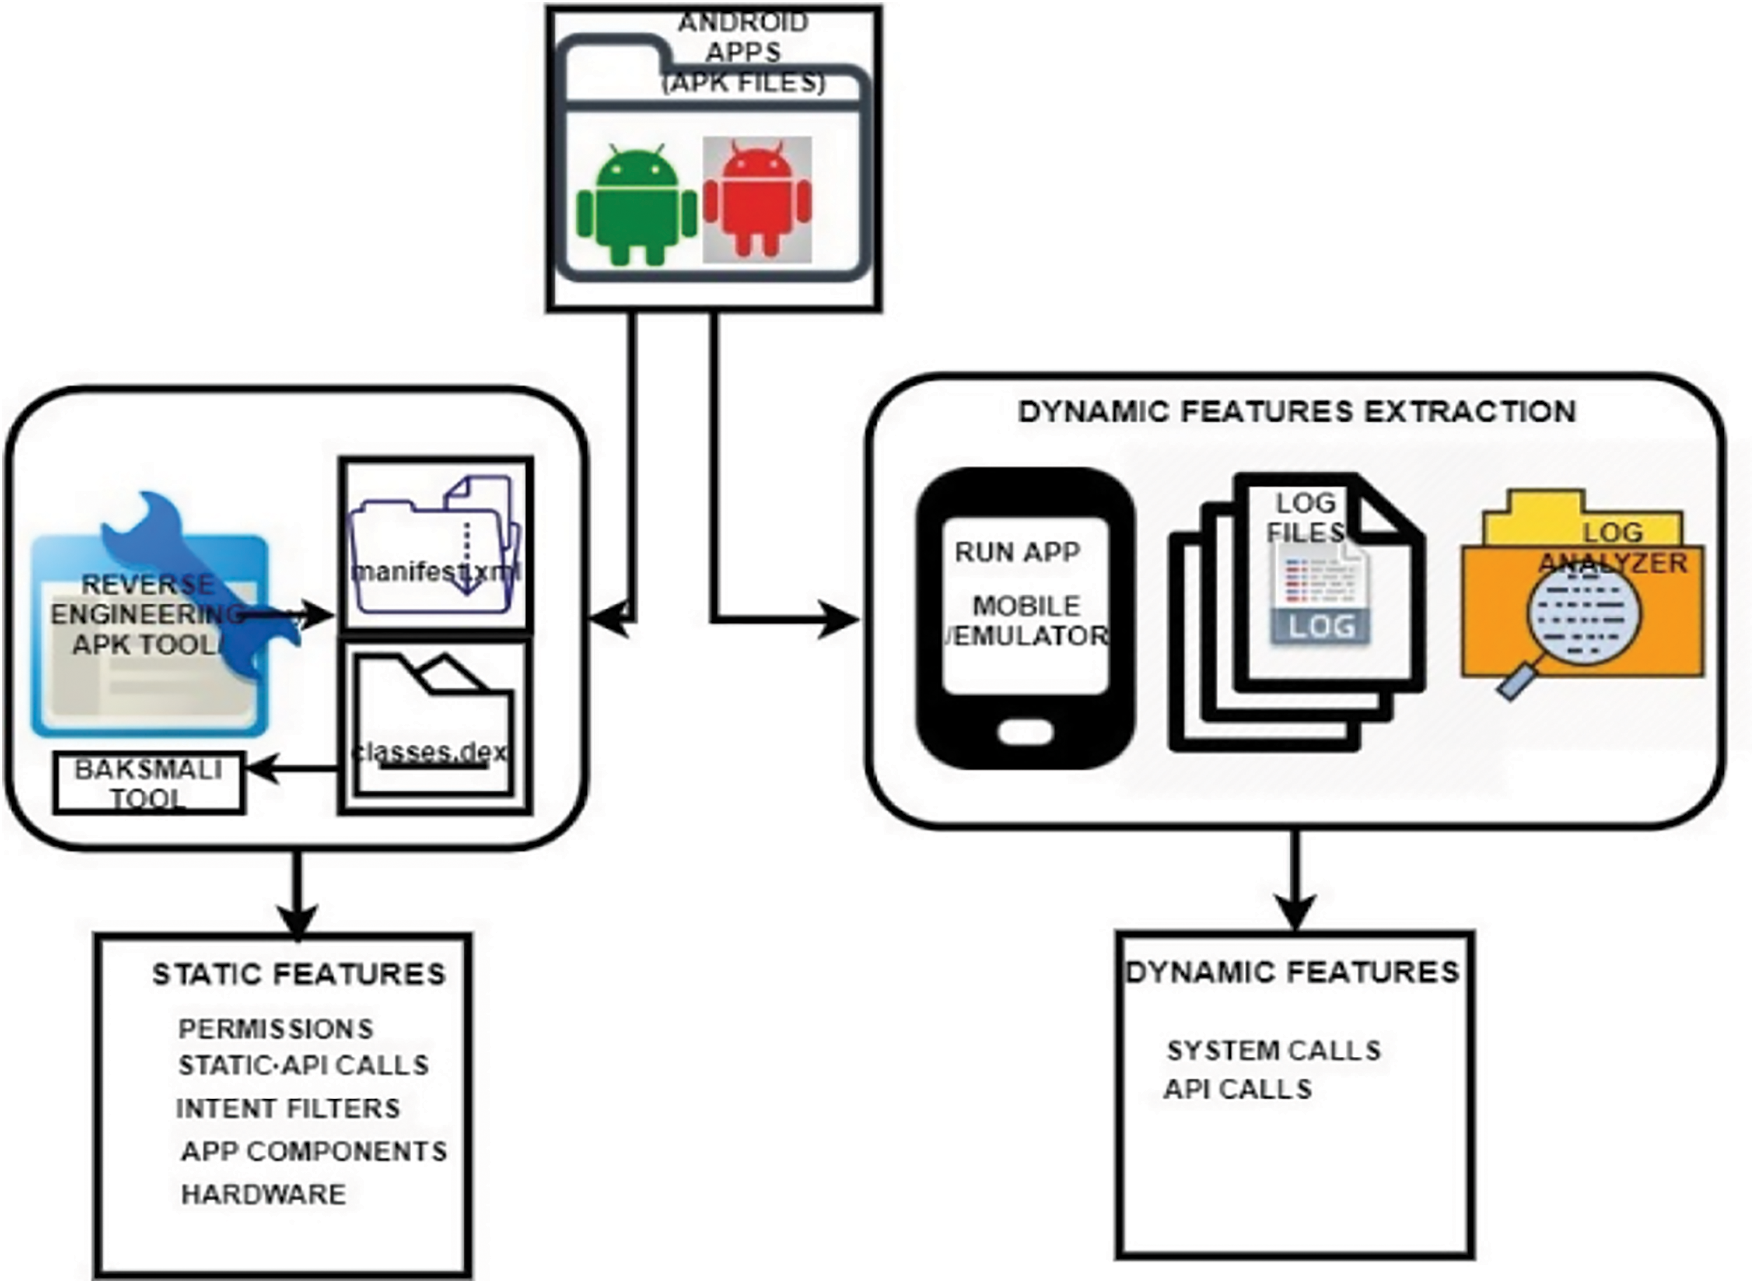
Figure 2: Static and dynamic feature extraction process
API: We have selected a1 number of API’s whose sum of frequency is the feature value. API-linked static-feature vector of test app (t) is computed as follows:
where, function
Similarly, pairs {
System calls: System call-linked dynamic feature vector of test app t is computed as follows:
where
Similarly, pair {
From the above seven feature-descriptors, we form two static and dynamic feature vectors as follows in Eqs. (1) and (2) respectively:
In short, we have built seven feature-descriptor as stated for every app. In feature fusion, features vectors corresponding to test and repository apps are used for creating non-linear graph. In the generated graph, feature-vectors corresponding to test apps and repository apps acts as nodes. Subsequently, graphs are created for each test app t corresponding to static feature vector and dynamic feature vector.
For feature vectors,
Constructed graphs are further fused to obtain unified feature. Feature unification follows in the coming subsection.
Constructed static and dynamic feature vectors are fused in a way to extract complementary information embedded in them. This is achieved by the means of the suggested optimal non-linear cross-diffusion of generated refined and normalized graphs to create a distinct borderline between the B and M apps. To unify the multiple features graph-oriented cross diffusion method was presented by [30]. The results validate that the feature fusion via non-linear graph-based technique is better than linear graph-based approaches. Graph-based unification maintains a robust depiction of the apps and discards all the feeble features that contribute to undesirable classification errors.
Similarity graph created using Eq. (3) for the static and dynamic feature vectors are again normalized by means of “min-max normalization” to obtain the normalized graphs
Normalized graphs
Static feature vectors when plotted appear as a curve, where a self-match appeared as a peak and the rest tends to the horizontal line. The more the match score tends to zero, the more dissimilar is the feature value with other apps. Capitalizing this, a curve
where
where,
where,
To generate a Refined Graph
where
Normalized and refined graphs for static features and dynamic features vectors are further exploited in the cross diffusion process.
Static features and dynamic features vectors possess distinctive and complementary information for the segregation of apps into B or M. Therefore, the cross-diffusion of static feature vector normalized graph and the dynamic feature vector refined graph and vice-versa results in boosting up of the robust connections along with filtering out the weaker connections leading to better accuracy.
In the proposed framework,
Where F is the total number of feature vectors and T above represents transposition. In our framework, F = 2 as we have taken only two feature vectors i.e. static and dynamic feature vector
The diffused edge weights
Where
Vector U is given to the two classifiers in parallel. Classification scores obtained are again fused. To achieve this, the U is inputted to two ML classifiers viz. SVM and RF. Their respective classification scores
where
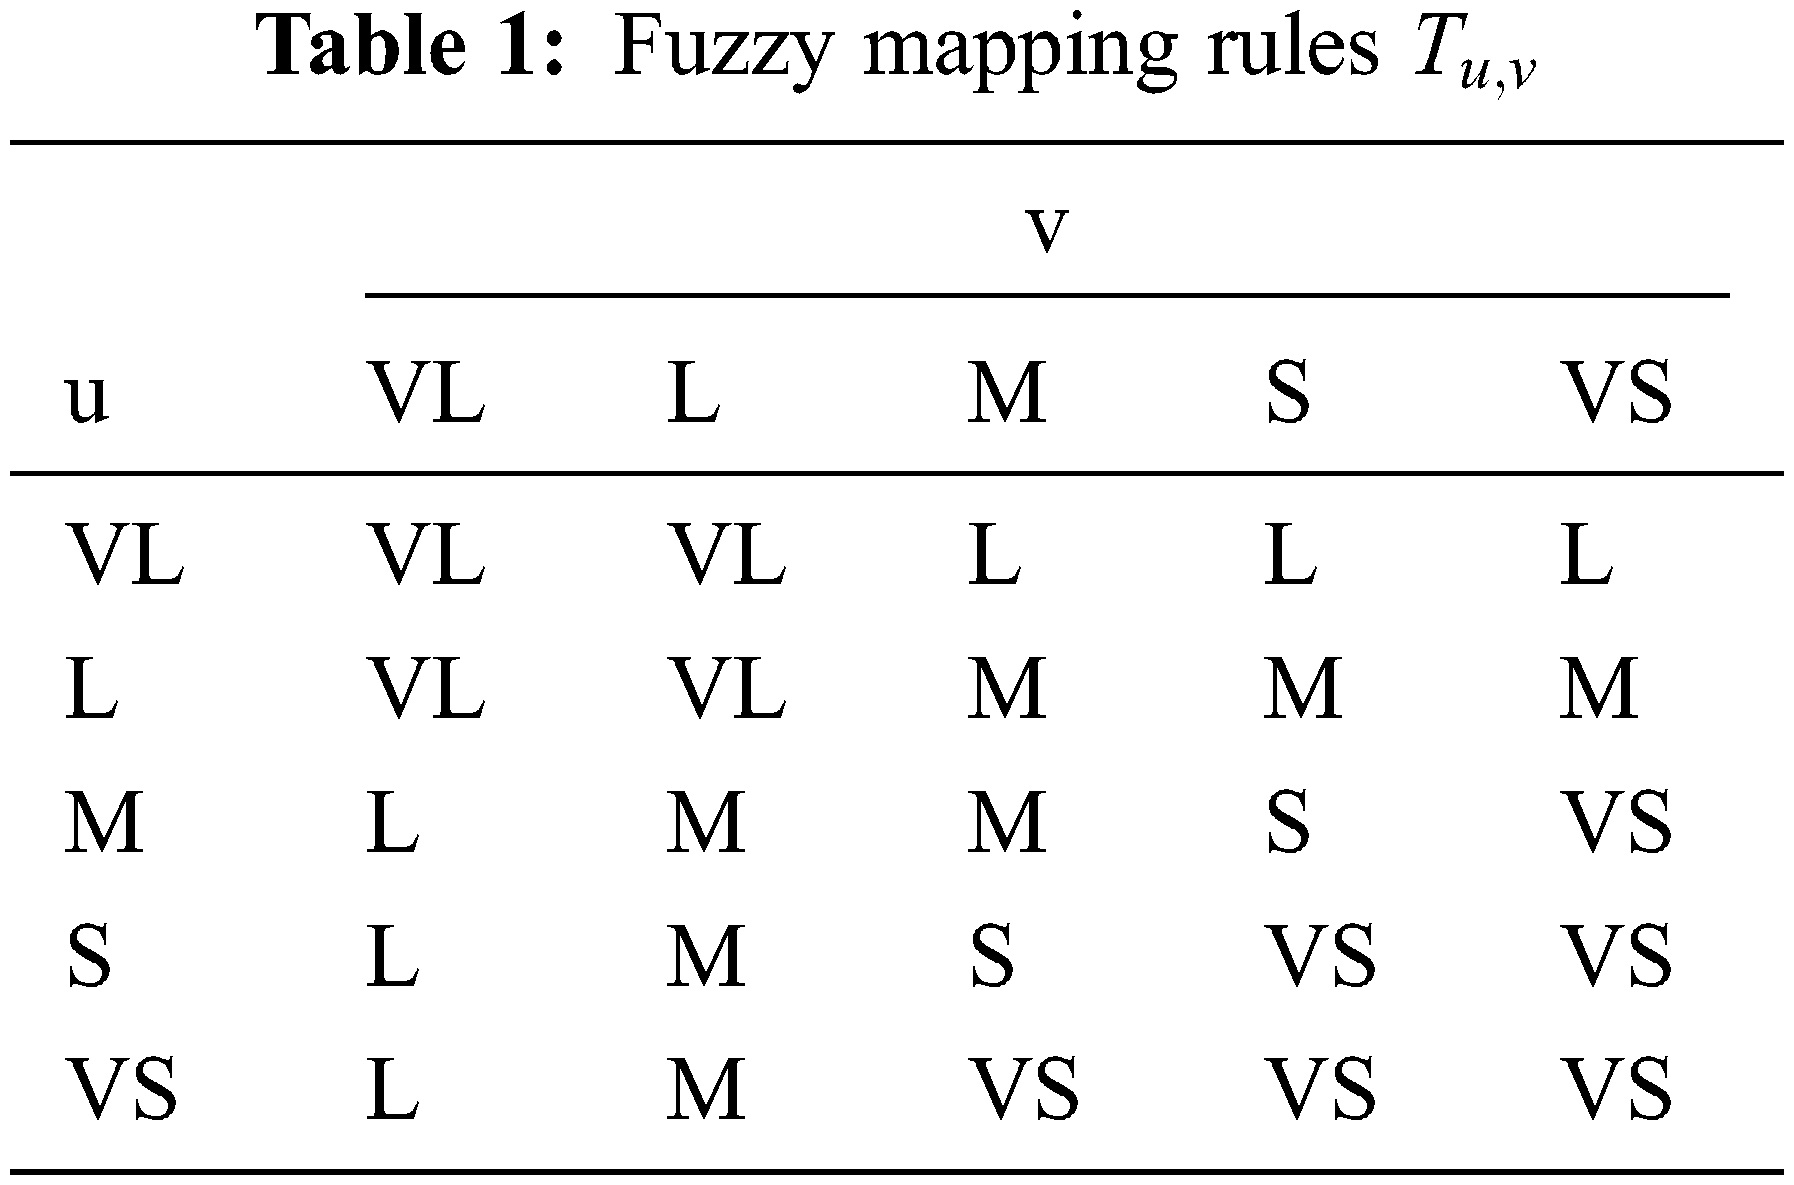
Fuzzy fused output is further converted to the optimal crisp value using the center of gravity (COG) technique for defuzzification. Crisp variable value using COG for a pair of elements
where value of
where
The
4 Datasets and Experimental Design
The balanced and unbalanced [31] datasets can be used for experimentation purpose. Here, we have used balanced datasets for experimentation. B apps are taken from CICMalDroid2020 Dataset and Google Play Store and M apps are collected from CICMalDroid2020 [32], AMD [33], Androzoo [34], and Drebin [35] covering the multitude of malwares from different families. 2000 B and 2000 M apps are selected from these datasets and rearranged in Tab. 2 as Group1, Group2, Group3, Group4, & Group5.
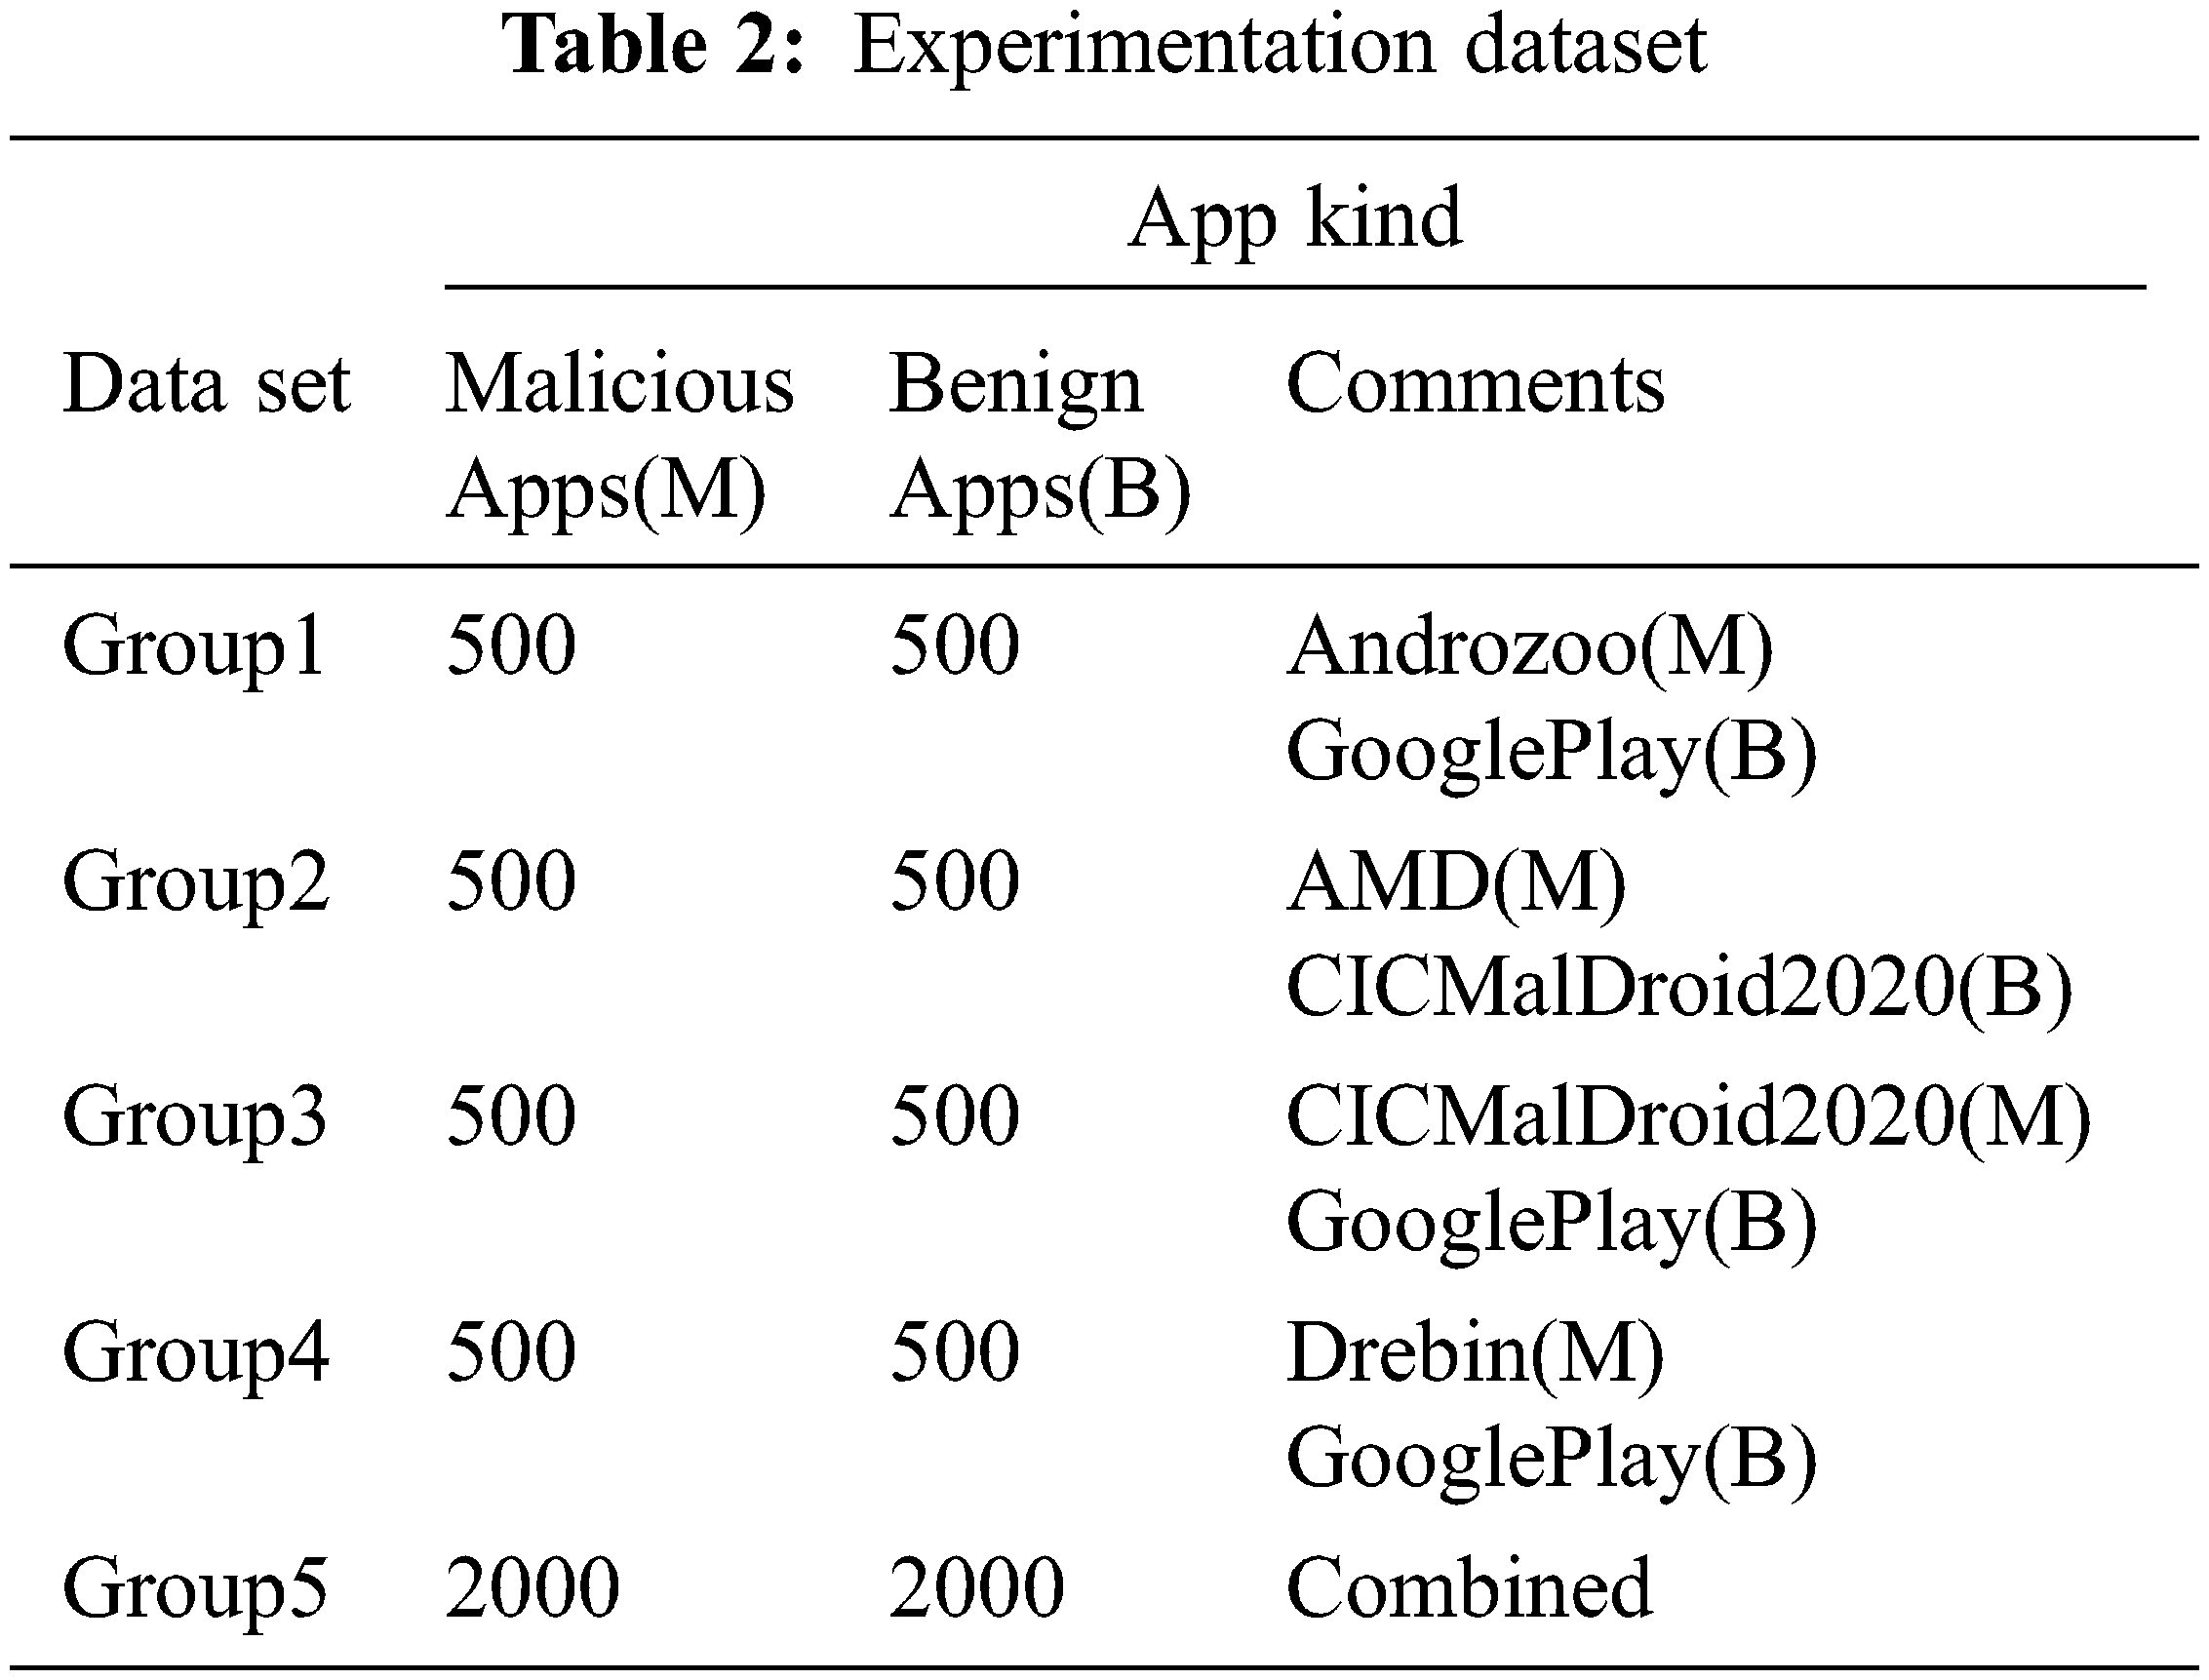
Experimental validation of the framework was accomplished by means of MATLAB 2018a installed on i7, 2.7 GHz CPU with 16 GB RAM. Ten-fold cross-validation method was employed by randomly subdividing the dataset into ten equal parts and using one for testing and the rest for training. The final result is the average of the results obtained from five Groups as in Tab. 2.
Experimental results comprise of the assessment of the suggested framework on the benchmarked datasets containing B and M apps as mentioned in Tab. 2. Also, comparisons of the results with other state-of-art methods applying static and dynamic features were also reported.
Cumulative Frequency Analysis: Qualitative assessment for the suggested framework is performed by plotting the cumulative frequencies (CF) as shown in Fig. 3 of the various static and dynamic features selected for M and B apps. The CF of the features in the M apps is directly proportional to the threat level of that particular feature for platform security.
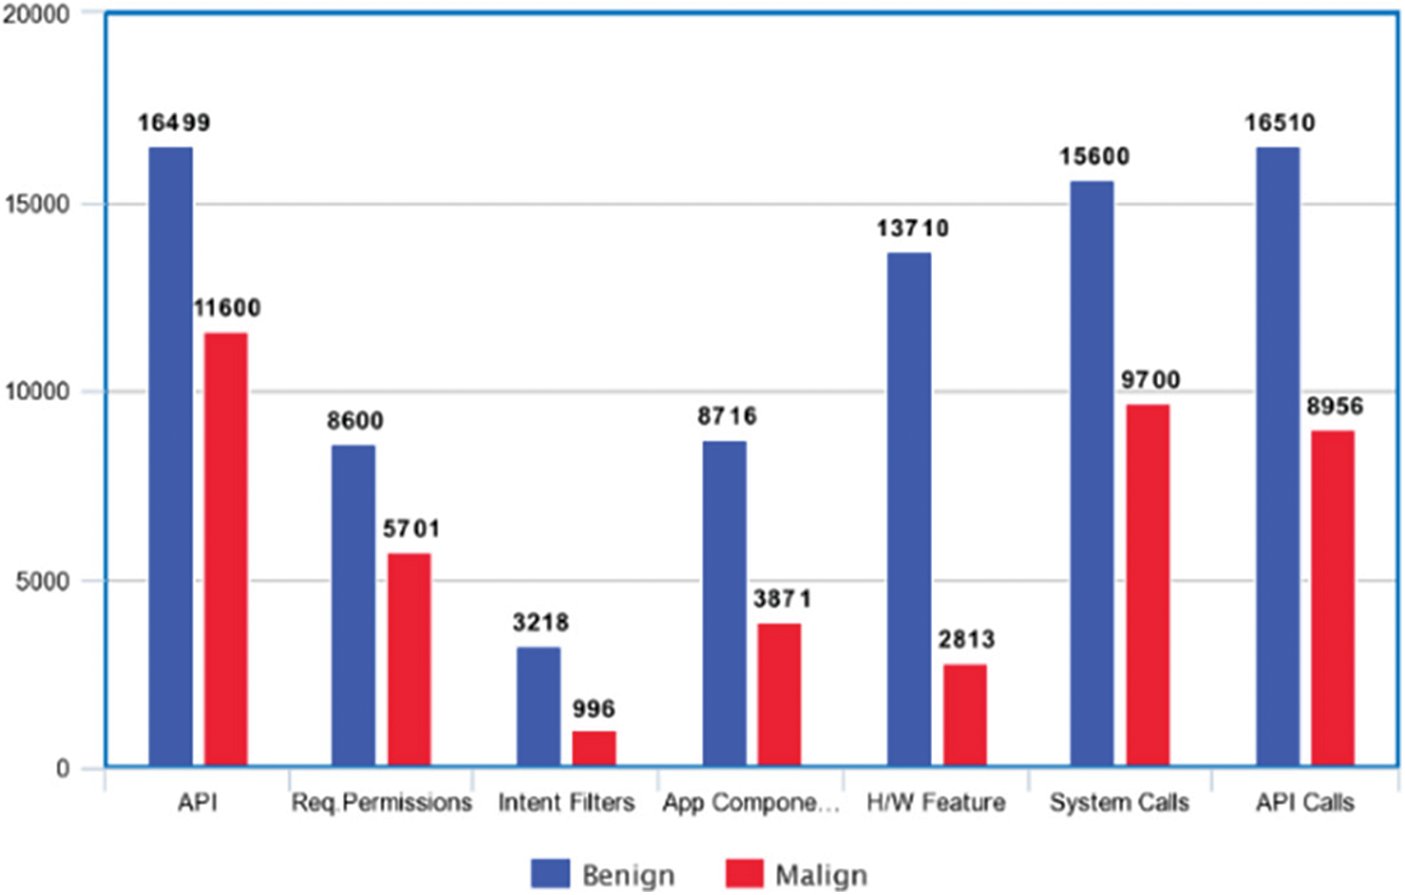
Figure 3: Cumulative frequencies for five static and two dynamic features for group 5 dataset
In addition, score distributions of the two best state-of-the-art techniques and the suggested framework is obtained and results are shown in Fig. 4. It is apparent from Fig. 4 that the suggested framework performs better than the other two methods because of the minimum overlap of the scores. Quantitative assessment of the suggested framework follows in the next sub-section.
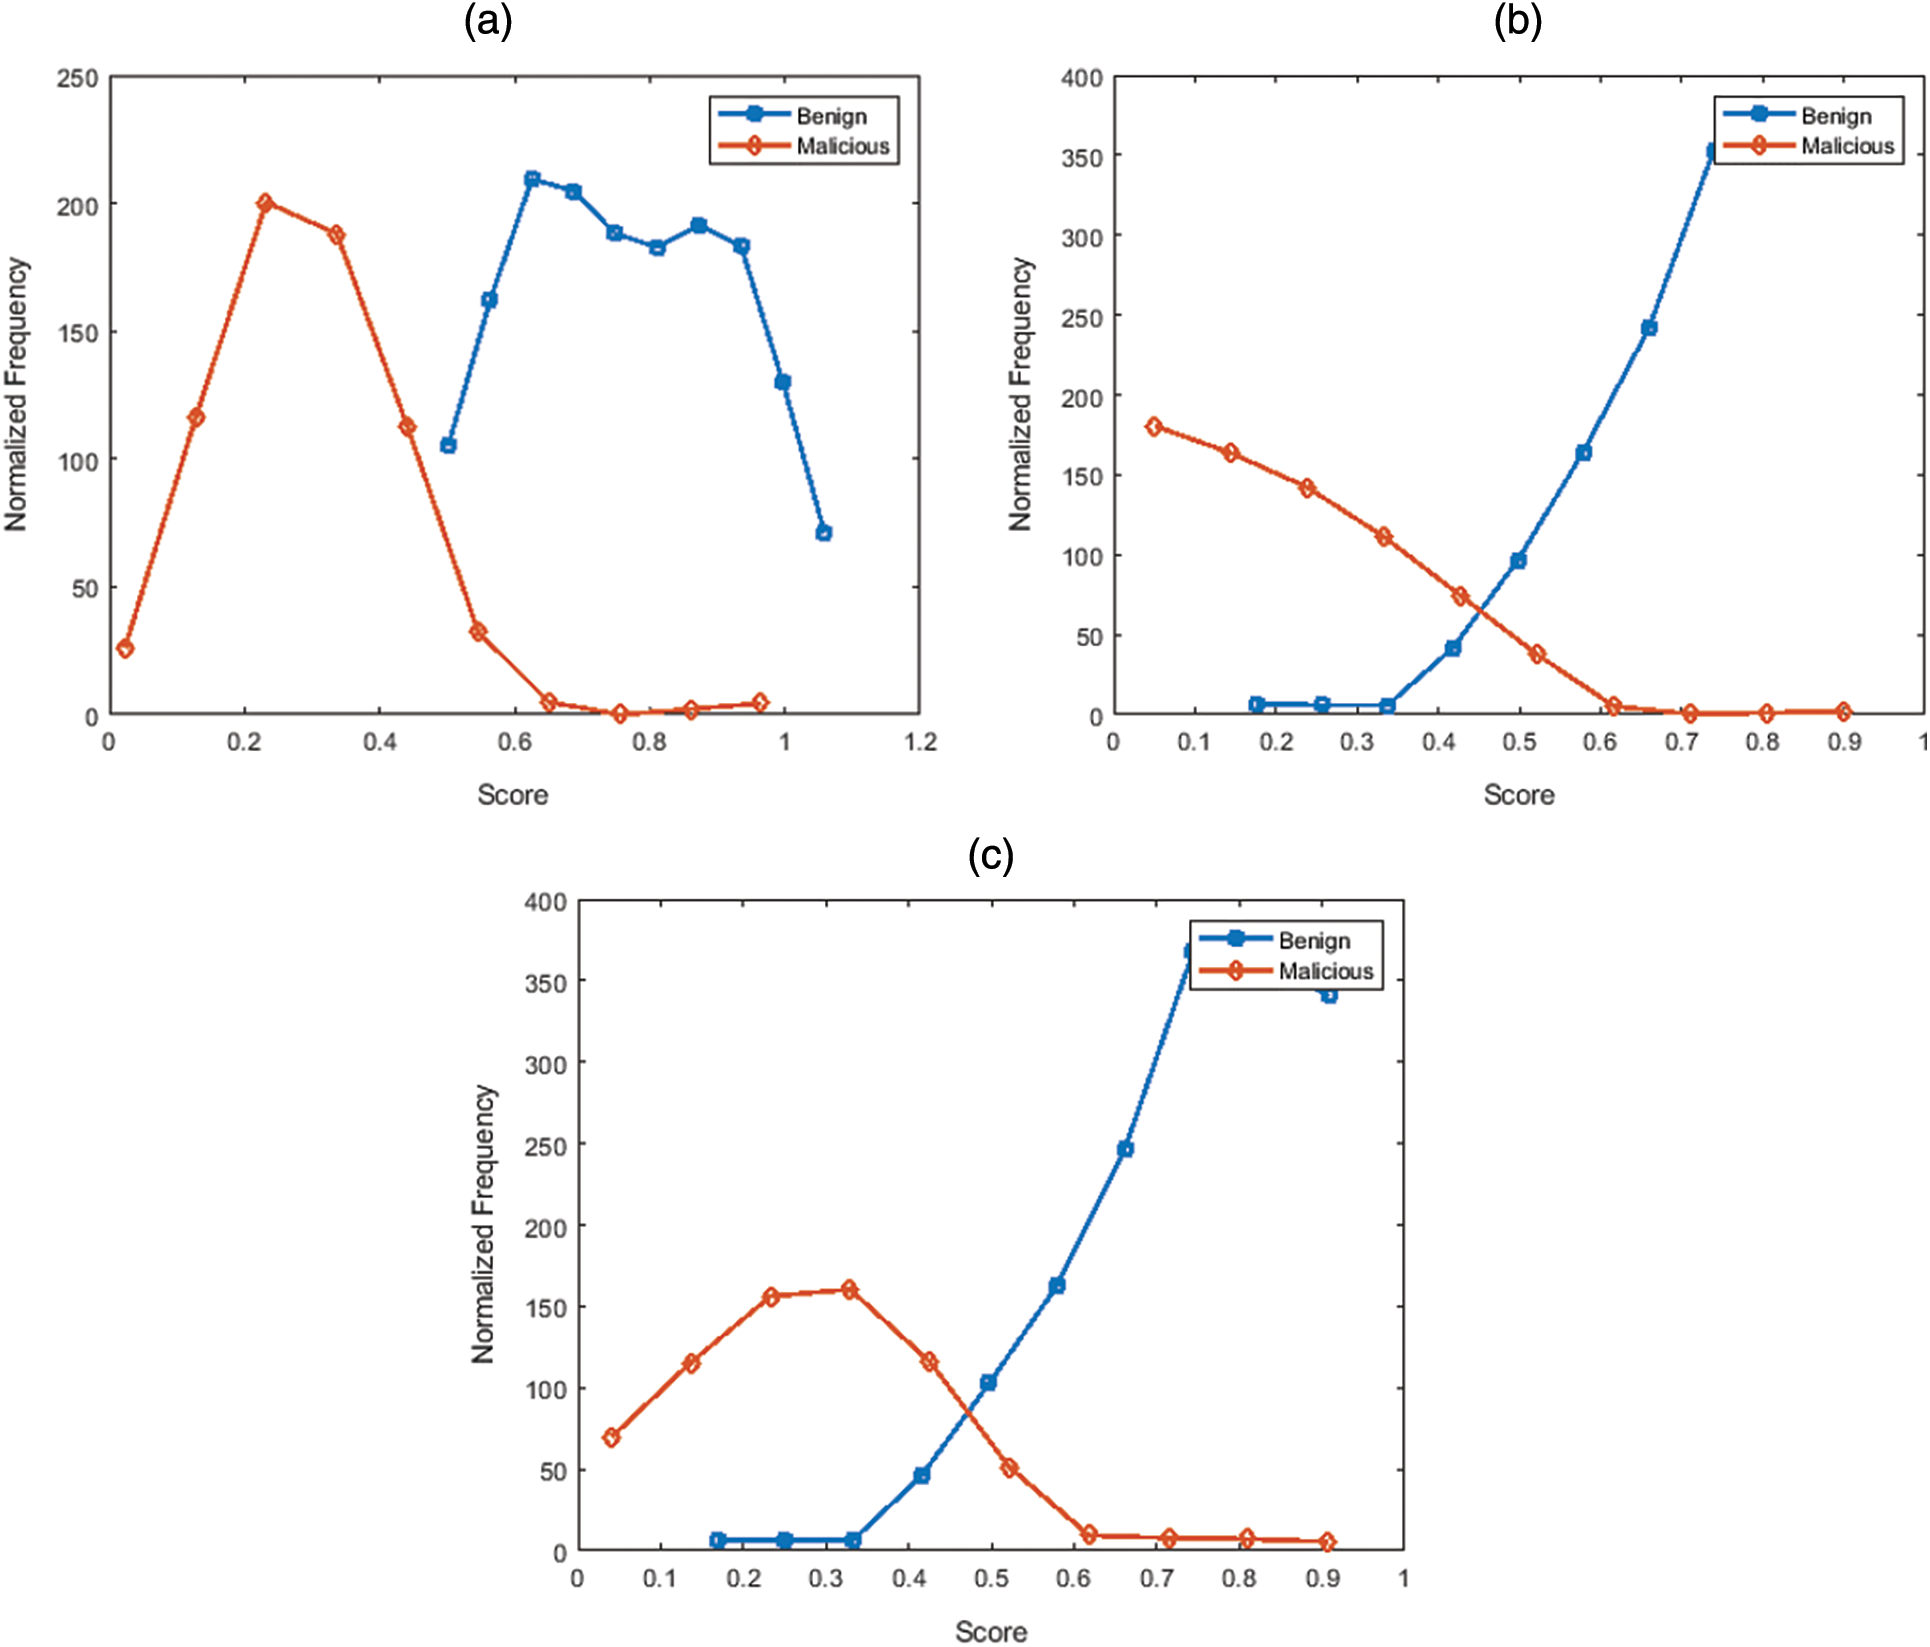
Figure 4: Score distribution for group2 dataset of (a) Proposed method (b) Arshad et al. [20] (c) Hussain et al. [22]
Quantitative assessment of the suggested method was realized using the standard evaluation benchmark viz. sensitivity, specificity, F1 Score, detection accuracy via ten-fold cross validation over datasets as mentioned in Tab. 1. The suggested method was also compared with respect to running time against different state-of-the-art methods. Evaluation metrics results are also compared with the two state-of-the-arts techniques [20,22], and two self-proposed techniques. Specificity, Sensitivity, F1 Score, and Accuracy are calculated using Eqs. (20–23).
where TP is true positive, FP is false positive, TN is true negative, FN is false negative. ROC curves depicted in Fig. 5 are drawn to assess the binary classifier. ROC is an overall index portraying sensitivity and specificity.
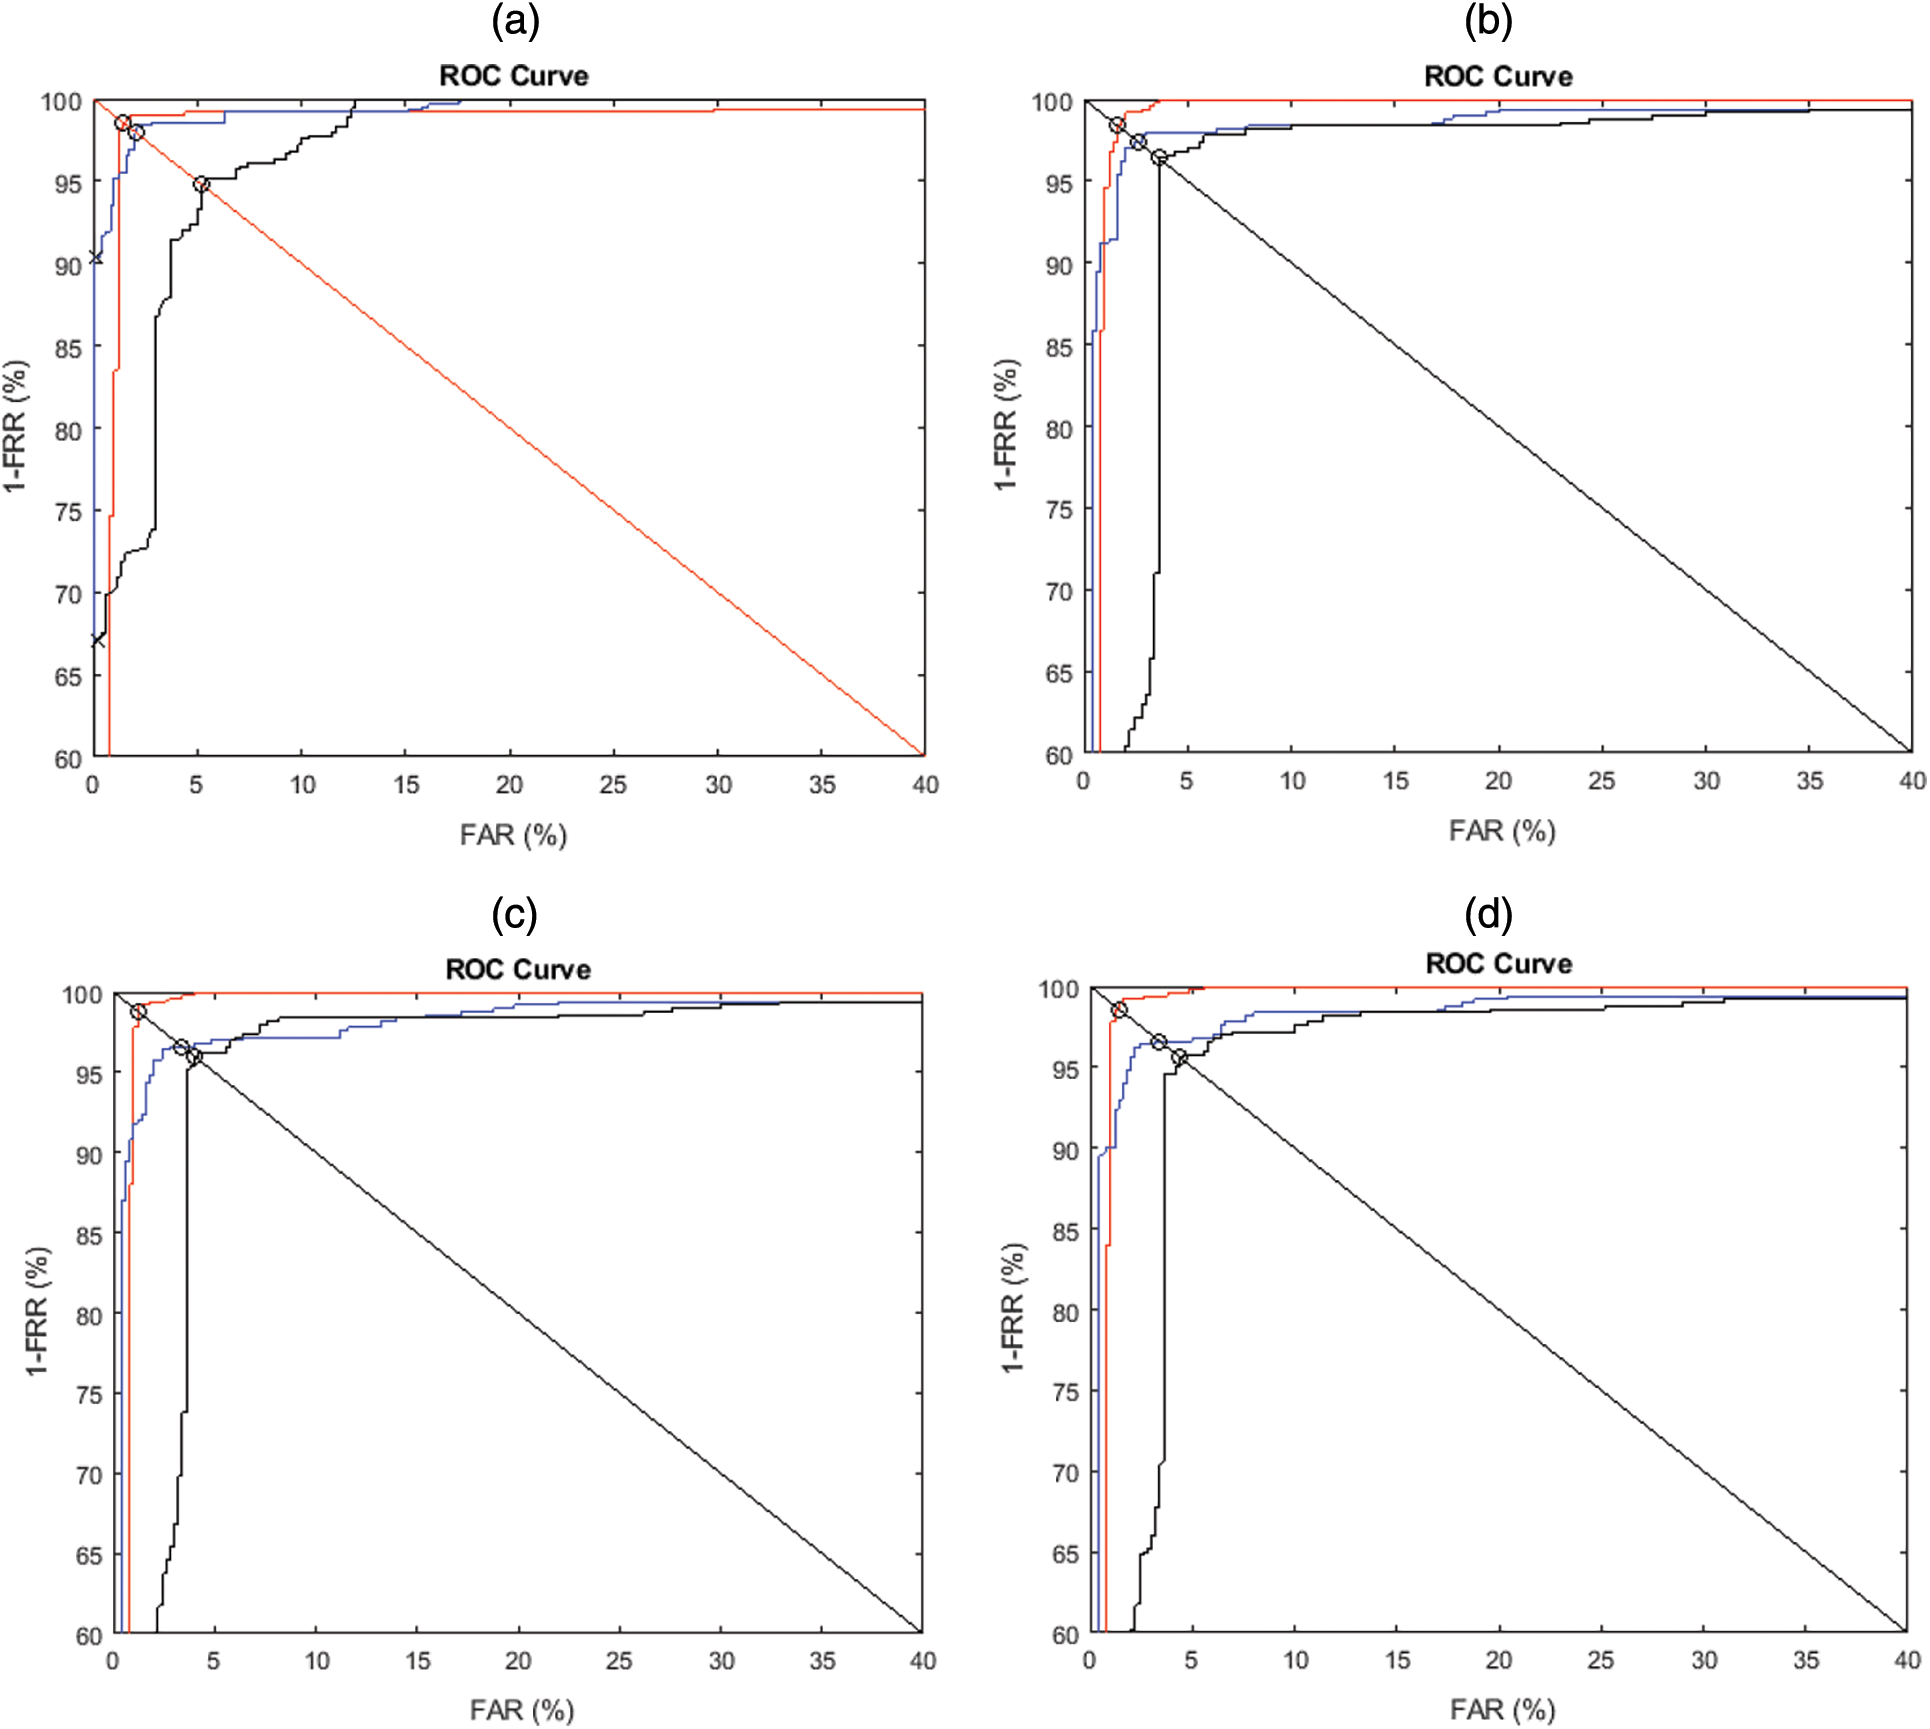
Figure 5: ROC curves for the proposed method (red) and two best state-of-the-art methods (Arshad et al. [20] (blue) and Hussain et al. [22] (black)) for (a) Group1, (b) Group 2, (c) Group 3, (d) Group 4
To test the robustness and to evade overfitting issues, 10-fold cross-validation is employed to estimate the performance of the suggested model. The investigational outcomes are displayed in Tab. 3.
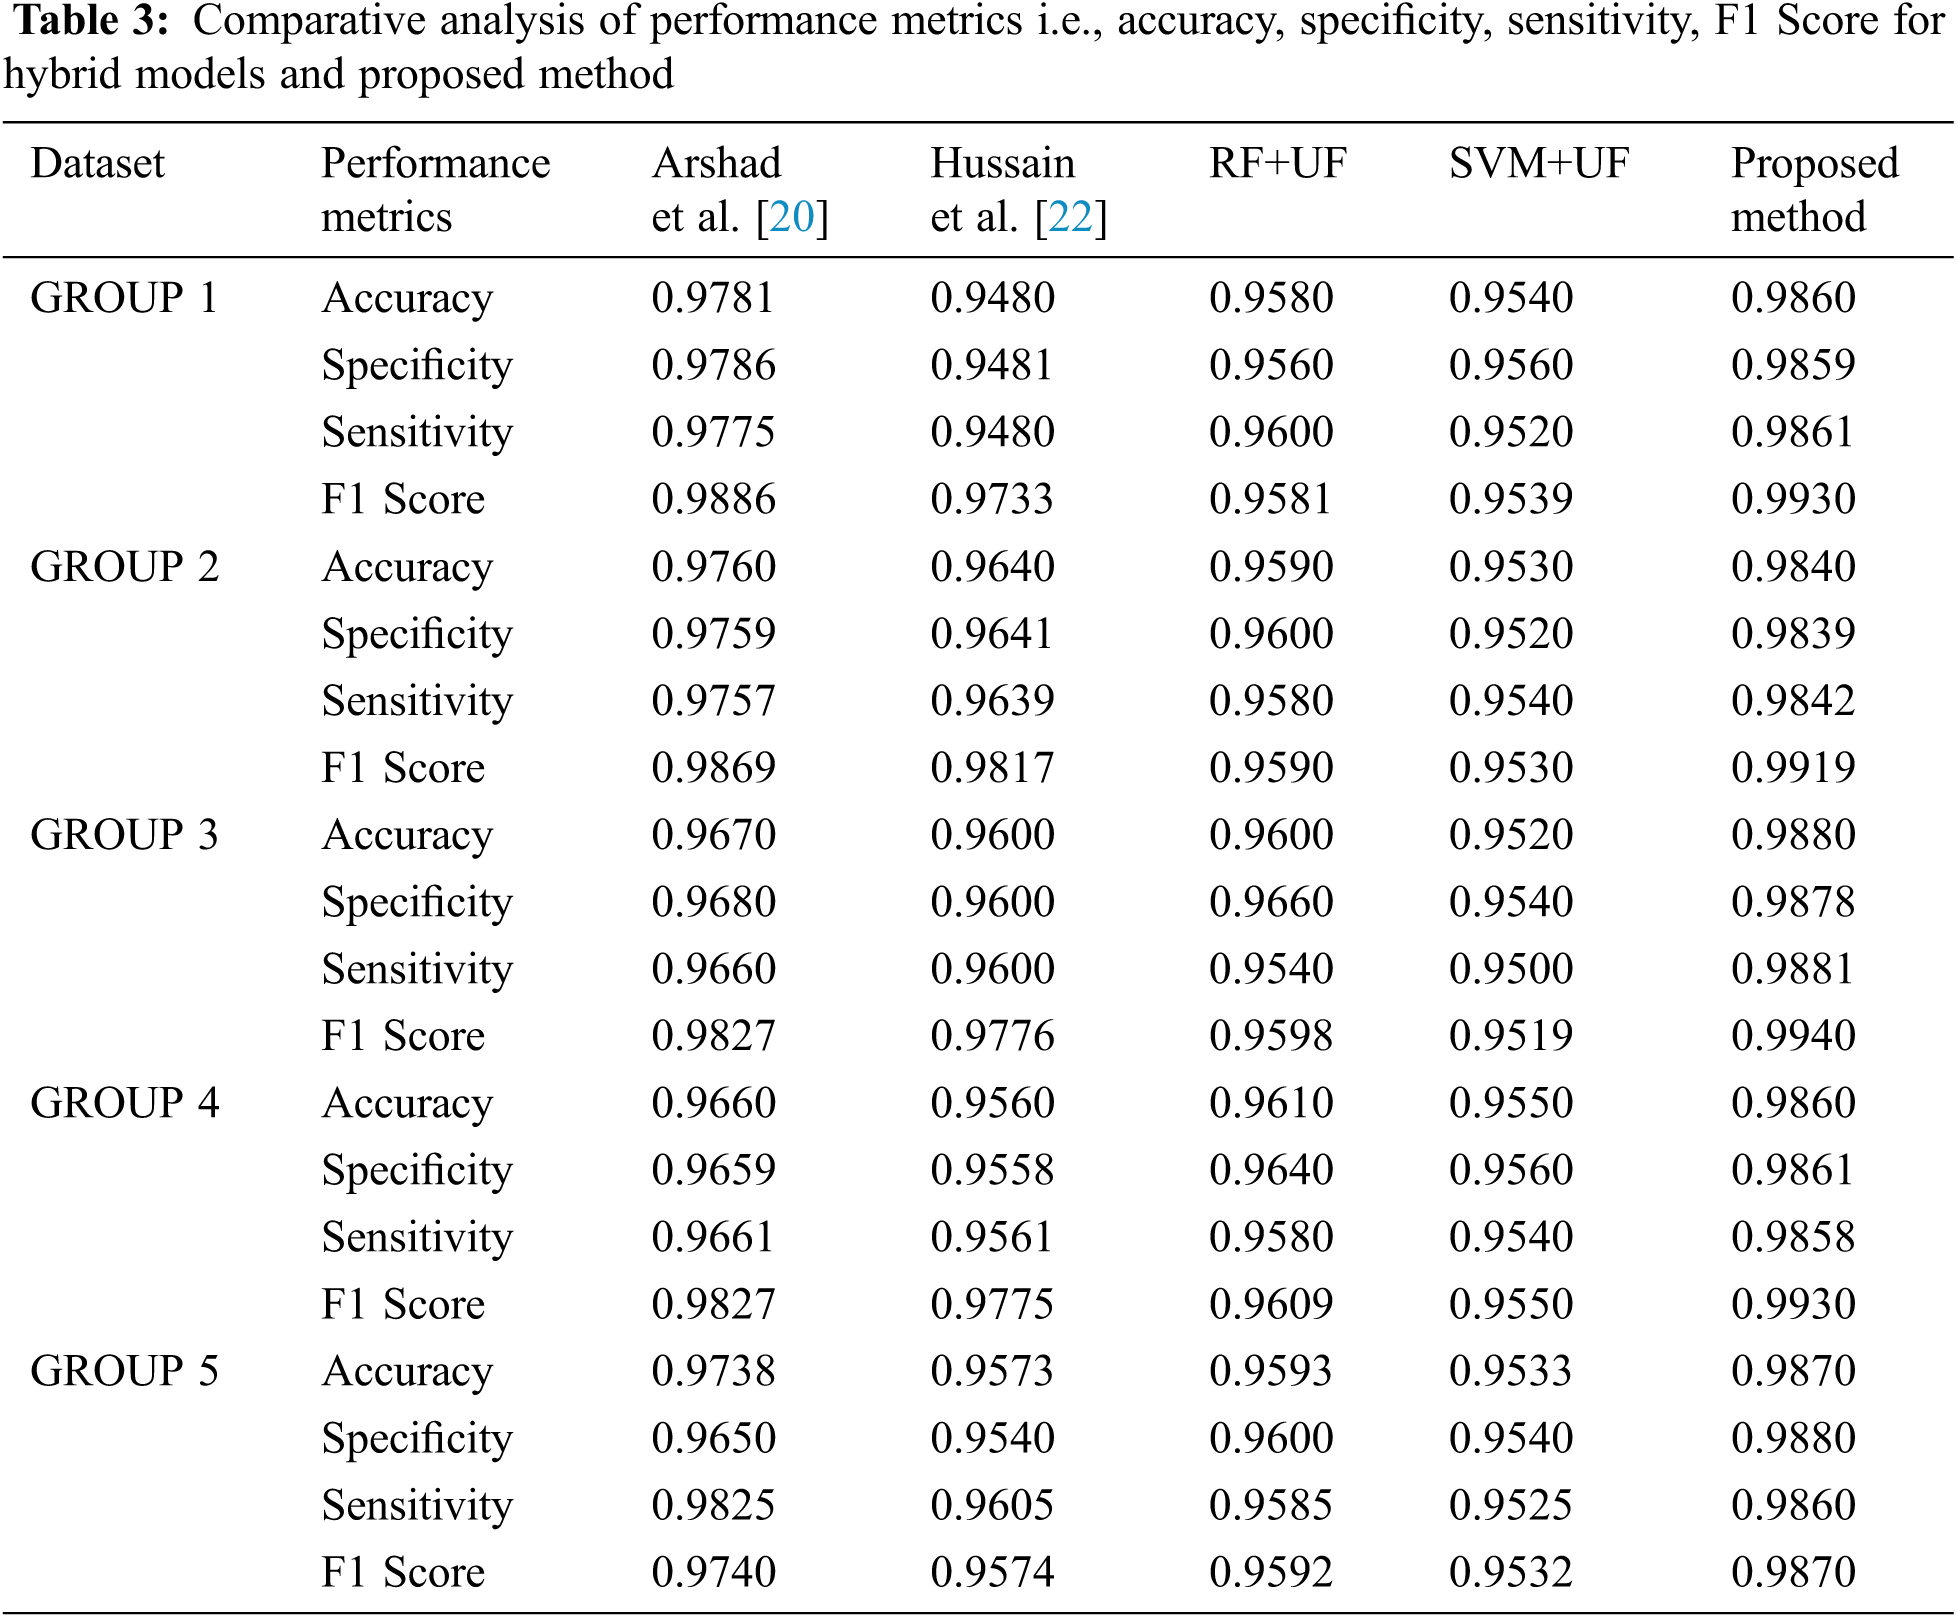
It has been observed that for the suggested framework the mean value of the result of the Accuracy, Specificity, Sensitivity, and F1 measure for the proposed framework are 98.62%, 98.634%, 99.30%, and 0.9916 respectively. Maximum value of the accuracy, specificity, sensitivity, and F1 score is 98.80%, 98.80%, 98.81%, and 0.9940 respectively.
The suggested technique outperforms the other hybrid-based state-of-the-art techniques when assessed on datasets as tabularized in Tab. 2. Enhancement for a mean value of detection accuracy of the suggested technique by 1.402% and 2.914%, over [20] and [22] respectively has been realized. Self-proposed techniques are also included to show the proper justification for the choice of ML algorithms in the optimal classifier. Enhancement of average detection accuracy of 2.674% and 3.274% have been achieved by the proposed method over two self-proposed methods RF+UF and SVM+UF.
The run time of different state-of-the-art approaches is also compared with the proposed approach. To calculate the running time of different methods, we first built and learned their corresponding detection model. These detection models were then fed with the 200 random apps for analysis. Our proposed method attains an average analysis performance of 5.6 seconds per app. Similarly, the average analysis performance of [20] and [22] comes out to be 6.1 seconds and 6.7 seconds respectively. Hence, our proposed method outclassed other methods in respect of detection time, detection accuracy, and efficacy in real-life apps scenarios.
Hybrid technique encompasses both the static and dynamic features to detect the malapps, thereby increasing the all-around complexity of the framework regarding time, effort, and cost. Also, our method is unable to distinguish the zero-day malware as malware authors are constantly updating the current malware families and frequently produce new malwares exhibiting the unfamiliar behavior close to the B apps thereby tricking even the latest detection models.
8 Conclusion and Future Direction
To tackle the challenges of effective detection of ever-evolving android malapps, we suggested a novel hybrid malapp detection scheme. Here, the optimal combination of static and dynamic features by cross-diffusion followed by fuzzy-based score level fusion was proposed. In the suggested framework, we have used five static and two dynamic features to form static and dynamic feature vectors. These feature vectors are further fused after the formation of normalized and refined graphs through the non-linear graph diffusion method. Fused feature vector is then given to an optimal classifier comprising of RF and SVM classifiers. A remarkable benefit of our method is that it can extract the static and dynamic features in each app almost in real-time.
In sum, the unification of static and dynamic features resulted in highly distinct feature. Adoption of fuzzy-based fusion of classifier scores not only create clear boundary but also achieve optimal performance. Our technique has accomplished mean value of accuracy, specificity, sensitivity, and F1 score as 98.62%, 98.634%, 98.604%, and 99.16% respectively. Experimental results reveal that our technique outstrips other state-of-the-art methods.
In the future, we will look forward to incorporate traffic-based dynamic features for smartphone security analysis as many malapps are detected solely on their traffic characteristics. Furthermore, training on more datasets comprising diverse malware families will further add robustness to the framework.
Funding Statement: The authors received no specific funding for this study.
Conflicts of Interest: The authors declare that they have no conflicts of interest to report regarding the present study.
1. https://www.idc.com/promo/smartphone-market-share/os(accessedFeb.20,2021). [Google Scholar]
2. https://www.statista.com/statistics/266210/number-of-available-applications-in-the-google-play-store. [Google Scholar]
3. https://www.statista.com/statistics/680705/global-android-malware-volume(accessedFeb.20,2021). [Google Scholar]
4. https://www.crowdstrike.com/blog/mobile-threat-report-2019-trends-and-recommendations2020. [Google Scholar]
5. S. Kumar, S. Indu and G. S. Walia, “An efficient multistage fusion approach for smartphone security analysis,” Defence Science Journal, vol. 71, no. 4, pp. 476–490, 2021. [Google Scholar]
6. W. Wang, M. Zhao, Z. Gao, G. Xu, H. Xian et al., “Constructing features for detecting android malicious applications: Issues, taxonomy and directions,” IEEE Access, vol. 7, pp. 67602–67631, 2019. [Google Scholar]
7. K. Liu, “Review of android malware detection based on machine learning,” IEEE Access, vol. 8, pp. 181102–181126, 2020. [Google Scholar]
8. S. Y. Yerima, M. K. Alzaylaee and S. Sezer, “Machine learning-based dynamic analysis of android apps with improved code coverage,” Eurasip Journal of Information Security, vol. 2019, no. 1, pp. 1–24, 2019. [Google Scholar]
9. S. Kumar, S. Indu and G. S. Walia, “Smartphone traffic analysis: A contemporary survey of the state-of-the-art,” in Int. Conf. on Mathematics and Computing, vol. 1262, Sikkim, India, pp. 325–343, 2021. [Google Scholar]
10. K. Shaukat, S. Luo, V. Varadharajan, I. A. Hameed and M. Xu, “A survey on machine learning techniques for cyber security in the last decade,” IEEE Access, vol. 8, pp. 222310–222354, 2020. [Google Scholar]
11. K. Shaukat, S. Luo, V. Varadharajan, I. A. Hameed, S. Chen et al., “Performance comparison and current challenges of using machine learning techniques in cybersecurity,” Energies, vol. 13, no. 10, pp. 1–27, 2020. [Google Scholar]
12. K. Shaukat, S. Luo, S. Chen and D. Liu, “Cyber threat detection using machine learning techniques: A performance evaluation perspective,” in Int. Conf. on Cyber Warfare and Security, Islamabad, Pakistan, pp. 1–6, 2020. [Google Scholar]
13. E. J. Alqahtani, R. Zagrouba and A. Almuhaideb, “A survey on android malware detection techniques using machine learning Algorithms,” in Proc. of 6th Int. Conf. on Software Defined System, Rome, Italy, pp. 110–117, 2019. [Google Scholar]
14. M. Fan, T. Liu, J. Liu, X. Luo, L. Yu et al., “Android malware detection: A survey,” Scientia Sinica Informationis, vol. 50, no. 8, pp. 1148–1177, 2020. [Google Scholar]
15. R. Kumar, M. Alazab and W. Wang, “A survey of intelligent techniques for android malware detection,” in Malware Analysis Using Artificial Intelligence and Deep Learning, Cham, Switzerland: Springer Nature, pp. 121–157, 2021. [Online] Available: https://link.springer.com/content/pdf/bfm%3A978-3-030-62582-5%2F1.pdf. [Google Scholar]
16. W. Zhang, H. Wang, H. He and P. Liu, “DAMBA: Detecting android malware by ORGB analysis,” IEEE Transaction on Reliability, vol. 69, no. 1, pp. 55–69, 2020. [Google Scholar]
17. A. T. Kabakus and I. A. Dogru, “An in-depth analysis of android malware using hybrid techniques,” Digital Investigation, vol. 24, no. 80, pp. 25–33, 2018. [Google Scholar]
18. A. G. Manzanares, H. Bahsi and S. Nõmm, “KronoDroid: Time-based hybrid-featured dataset for effective android malware detection and characterization,” Computer Security, vol. 110, pp. 102399, 2021. [Google Scholar]
19. X. Wang, Y. Yang and S. Zhu, “Automated hybrid analysis of android malware through augmenting fuzzing with forced execution,” IEEE Transaction on Mobile Computing, vol. 18, no. 12, pp. 2768–2782, 2019. [Google Scholar]
20. S. Arshad, M. A. Shah, A. Wahid, A. Mehmood, H. Song et al., “SAMADroid: A novel 3-level hybrid malware detection model for android operating system,” IEEE Access, vol. 6, pp. 4321–4339, 2018. [Google Scholar]
21. W. C. Kuo, T. P. Liu and C. C. Wang, “Study on android hybrid malware detection based on machine learning,” in Int. Conf. on Computing Communication System, Singapore, pp. 31–35, 2019. [Google Scholar]
22. S. J. Hussain, U. Ahmed, H. Liaquat, S. Mir, N. Z. Jhanjhi et al., “IMIAD: Intelligent malware identification for android platform,” in Int. Conf. Computer Information Science, Sakaka, Saudi Arabia, pp. 1–6, 2019. [Google Scholar]
23. D. C. A. Martín and R. L. Cabrera, “Android malware detection through hybrid features fusion and ensemble classifiers: The AndroPyTool framework and the OmniDroid dataset,” Information Fusion, vol. 52, pp. 128–142, 2019. [Google Scholar]
24. Q. Fang, X. Yang and C. Ji, “A hybrid detection method for android malware,” in 3rd Information Technology, Networking, Electronic and Automation Control Conf., Chengdu, China, pp. 2127–2132, 2019. [Google Scholar]
25. A. Saracino, D. Sgandurra, G. Dini and F. Martinelli, “MADAM: Effective and efficient behavior-based android malware detection and prevention,” IEEE Transactions on Dependable and Secure Computing, vol. 15, no. 1, pp. 83–97, 2018. [Google Scholar]
26. M. Dhalaria and E. Gandotra, “A hybrid approach for android malware detection and family classification,” International Journal of Interactive Multimedia and Artificial Intelligence, vol. 6, no. 6, pp. pp174–188, 2021. [Google Scholar]
27. A. KABAKUŞ, “Hybroid: A novel hybrid android malware detection framework,” Erzincan University Journal of Science and Technology, vol. 14, no. 1, pp. 331–356, 2021. [Google Scholar]
28. A. Karim, V. Chang and A. Firdaus, “Android botnets: A proof-of-concept using hybrid analysis approach,” Journal of Organizational and End User Computing, vol. 32, no. 3, pp. 50–67, 2020. [Google Scholar]
29. C. Ding, N. Luktarhan, B. Lu and W. Zhang, “A hybrid analysis-based approach to android malware family classification,” Entropy, vol. 23, no. 8, pp. 1009, 2021. [Google Scholar]
30. G. S. Walia, H. Ahuja, A. Kumar, N. Bansal and K. Sharma, “Unified graph-based multicue feature fusion for robust visual tracking,” IEEE Transaction on Cybernatics, vol. 50, no. 6, pp. 2357–2368, 2020. [Google Scholar]
31. T. M. Alam, K. Shaukat, I. A. Hameed, S. Luo, M. U. Sawar et al., “An investigation of credit card default prediction in the imbalanced datasets,” IEEE Access, vol. 8, pp. 201173–201198, 2020. [Google Scholar]
32. S. Mahdavifar, A. F. Abdul Kadir, R. Fatemi, D. Alhadidi and A. A. Ghorbani, “Dynamic Android Malware Category Classification using Semi-Supervised Deep Learning,” in Proc.of IEEE 18th Int. Conf. Dependable, Auton. Secur. Comput. IEEE 18th Int. Conf. Pervasive Intell. Comput. IEEE 6th Int. Conf. Cloud Big Data Comput. IEEE 5th Cybe, Calgary,AB,Canada, pp. 515–522, 2020. [Google Scholar]
33. F. Wei, Y. Li, S. Roy, X. Ou and W. Zhou, “Deep ground truth analysis of current android malware,” in Proc. of Detection of Intrusions, Malware, and Vulnerability Assessment, Bonn, Germany, pp. 252–276, 2017. [Google Scholar]
34. L. Li, J. Gao, M. Hurier, P. Kong, T. Bissyand´e et al., “AndroZoo++: Collecting millions of android apps and their metadata for the research community, arXiv,” arXiv, pp. 468–471, 2017. [Google Scholar]
35. D. Arp, M. Spreitzenbarth, M. Hübner, H. Gascon and K. Rieck, “Drebin: Effective and explainable detection of android malware in your pocket,” in Proc. of Netwok and Distributed System Security, SanDiego, California, USA, pp. 23–26, 2014. [Google Scholar]
 | This work is licensed under a Creative Commons Attribution 4.0 International License, which permits unrestricted use, distribution, and reproduction in any medium, provided the original work is properly cited. |