DOI:10.32604/iasc.2023.024291
| Intelligent Automation & Soft Computing DOI:10.32604/iasc.2023.024291 | |
| Article |
Detecting and Preventing of Attacks in Cloud Computing Using Hybrid Algorithm
1Department of Computer Science and Engineering, CSI Institute of Technology, Thovalai, India
2Department of Electronic Communications and Engineering, CSI Institute of Technology, Thovalai, India
*Corresponding Author: T. Jaya. Email: jayacsiramesh@gmail.com
Received: 12 October 2021; Accepted: 04 January 2022
Abstract: Cloud computing is the technology that is currently used to provide users with infrastructure, platform, and software services effectively. Under this system, Platform as a Service (PaaS) offers a medium headed for a web development platform that uniformly distributes the requests and resources. Hackers using Denial of service (DoS) and Distributed Denial of Service (DDoS) attacks abruptly interrupt these requests. Even though several existing methods like signature-based, statistical anomaly-based, and stateful protocol analysis are available, they are not sufficient enough to get rid of Denial of service (DoS) and Distributed Denial of Service (DDoS) attacks and hence there is a great need for a definite algorithm. Concerning this issue, we propose an improved hybrid algorithm which is a combination of Multivariate correlation analysis, Spearman coefficient, and mitigation technique. It can easily differentiate common traffic and attack traffic. Not only that, it greatly helps the network to distribute the resources only for authenticated requests. The effects of comparing with the normalized information have shown an extra encouraging detection accuracy of 99% for the numerous DoS attack as well as DDoS attacks.
Keywords: Hybrid algorithm (HA); distributed denial of service (DDoS); denial of service (DoS); platform as a service (PaaS); infrastructure as a service (IaaS); software as a service (SaaS)
Cloud computing is the conveyance of on-demand computing services from applications for storage and accessing data over the web on a pay-as-you-go basis. Rather than possessing their computing infrastructure or data servers, organizations can lease the resources in the cloud offered by the cloud service provider. One benefit of utilizing cloud-computing services is that organizations can stay away from the direct expense and complexity of buying and maintaining their own IT infrastructure, and instead effectively pay for what they use, when they use it. Hence, suppliers of cloud computing services can benefit from critical economies of scale by conveying similar services to a wide scope of customers. Cloud computing services guard an immense scope of choices now, from the essentials of storage, networking, and processing power through to natural language processing and artificial intelligence just as standard office applications.
The main work of the cloud is to store information from various sources. This whole process takes place within a fraction of a second where processing and inspection of the collected data are carried out in between. Hence, every step of the process should be refined and accurate for better performance. Cloud computing is very good in-network whereas many devices interact among themselves. Some of its advantages are
i) Shares the information saved in the Internet of Things (IoT) through wireless fidelity
ii) A clever allocation of data shared describing the type of the data and storage location and the limitation of storage time.
iii) Other aspects of information such as consistency, connection, privacy, and management.
Cloud services are available to the users as infrastructure, platforms, and software. Cloud computing is one of the emerging paradigms in Internet-based technology. Even though advancement was made in the detection and prevention of DoS and DDoS attacks in recent years, attackers and intruders continue to overpower them. The rise of DoS and DDoS attacks reached 20 billion in the year 2020. The mediocre magnitude of DoS attacks existed at the mind-blustering 26.37 Gigabyte per second in Q2 2018 endured for more than 329 h [1].
Intrusion detection is the act of observing your network, servers, workstations, and other IT resources for any dubious action, pernicious activities, or infringement of some approach [2]. Therefore, the problem in protecting data from attackers needs to be addressed properly to avoid further complications of latent delivery and privacy of data. In this paper, we are describing the pattern of DoS and DDoS strategies and their effect on resources allocation in the cloud.
Intrusion detection and prevention are two broad terms describing application security practices used to mitigate attacks and block new threats [3]. The first is a reactive measure that identifies and mitigates ongoing attacks using an intrusion detection system. It’s able to weed out existing malware (e.g., Trojans, backdoors, rootkits) and detect social engineering (e.g., a man in the middle, phishing) assaults that manipulate users into revealing sensitive information. The second is a proactive security measure that uses an intrusion prevention system to preemptively block application attacks [4]. This includes remote file inclusions that facilitate malware injections, and SQL injections used to access an enterprise’s databases. An IDS is either a hardware device or software application that uses known intrusion signatures to detect and analyze both inbound and outbound network traffic for abnormal activities. This is done through:
• System file comparisons against malware signatures.
• Scanning processes that detect signs of harmful patterns.
• Monitoring user behavior to detect malicious intent.
• Monitoring system settings and configurations.
Upon detecting a security policy violation, virus, or configuration error, an IDS can kick an offending user off the network and send an alert to security personnel. Despite its benefits, including in-depth network traffic analysis and attack detection, an IDS has inherent drawbacks. Because it uses previously known intrusion signatures to locate attacks, newly discovered (i.e., zero-day) threats can remain undetected. Furthermore, an IDS only detects ongoing attacks, not incoming assaults. To block these, an intrusion prevention system is required. The remedy for DoS and DDoS attacks is the intrusion prevention system engaging hybrid algorithm in cloud illustrated briefly in the following sections.
1.1 An Overview of the DoS and DDoS Attack
Denial of service can be classified into two types they are,
• Vulnerability for semantic attacks
• Flooding or brutal force attack
Many information of the target is exploited by transferring some precisely developed request where infection in software or problems in a mechanism is cleverly used. This is typically a DOS vulnerability attack. For instance, advised Internet Control Message Protocol (ICMP) is transferred to a system by an adversary, which is called pig-of-death to attack the operating system. Whereas a type of service is denied to a legal user by sending a large number of visually authentic service proposals and making the resource of the aimed service drained. In other words, a large amount of data is sent to the server thereby increasing its traffic to exceed its limit and disrupting the services abruptly. Whenever the denial of service occurs, there may be a single or more number of hosts used by the attackers to send the requests to the server. Sometimes a huge number of hosts are exploited by the intruder to generate multiple request messages, it is said to be a distributed denial-of-service attack whereas if the intruder was a single host to originate requests, then it is said to be a single source denial of service attack. Distributed denial of service remains anonymous while assaulting network systems with the help of defense mechanisms like the Intrusion Detection System (IDS) and a commercial firewall. Security protections are applied to cloud computing but at times, these types of attacks cannot be detected easily. This method of strike can be straight or crooked depending upon the intruder offending mechanism. When the attack is direct, the service to be attacked is allotted at the first where indirect denial-of-service would be implemented in some undeniable circumstances. Here the host machine involved may be the same for various attacks. The bulk request that is sent can be redirected to another system by some cloud algorithm and this can be mentioned by the term race in power. There are some problems in the usage of the cloud because of its flexibility, but the fact that it would divide and navigate the attack towards several hosts makes it convenient to be implemented in DOS. Denial of services may have two intentions. One is crashing the system that is aimed by the usage of the exceptional ability of the adversary where the targeted system is less capable comparatively based on aspects such as processing units and bandwidth. The Second method is injecting harmful data into the target by transferring toxics requests [5].
The intruder makes use of undefended entities in communicational devices, information systems, and the path. For example, a very large number of SYN packages are sent by the SYN acknowledgment packages for brushed off. When the reception storage of the system reaches the limit and the server generates a tracker used for acknowledgment, they need time to wait and at the point now, a new user can be connected. As the amount of TCP connections regarding the request, for the acknowledgment increases, the memory capacity of the server is decreased. This is because every single request is checked for the completion of, “three-way handshake” before getting directed to the server [6].
Draining the bandwidth is another way to overwhelm the system that is aimed to be attacked. Sharing the cloud networks indulged by adding more traffic exceeding the limit of bandwidth, so that there is no room for authorized users to make use of the system. Several numbers of packets or impost, which consists of even legal ones. It is a very important thing to get trust in the cloud system by implementing useful information first because it is somewhat more difficult to attack without attaining trust and attaining a place in the topology. The next needed amount of host in the aimed network should be processed. A large amount of UDP should be implemented ensuring the increase of traffic and all through vulnerable uplinks. The type of UDP is determined based on the need for legal TCP sessions. When the requests get extreme, CPU tends to accept and work the infectious packages than legal ones [7].
In attacks where payloads for voluminous, surmount of payloads are sent by the adversary to access resources of the casualty’s machine. Service or insisted to create several TCP connections for the sake of downloading real data. Processing the entities that are downloaded needs, many control processing unit cycles [8].
We collected and analyze the numerous methodology related to the multivariate correlation analysis. In this section, we discuss the related works and research efforts of what multivariate analysis meant for and how the existing methodologies used to detect intrusions occur in the network.
Multivariate data include numerous variables rather than one (univariate) or two (bivariate). Utilize the Multivariate stage to investigate how numerous variables identify with one another. The Multivariate stage gives numerous methods, to sum up, and test the strength of the direct connection between each pair of reaction variables. Both parametric and nonparametric connections tests are accessible in this stage. The utilization of graphical highlights, like the Scatterplot Matrix and Color Maps, to identify dependencies, outliers, and clusters among the variables [9]. There are extra multivariate investigation strategies to further look at the connection between variables, including head segments examination, anomaly examination, and thing unwavering quality [10]. These methods are accessible through the Multivariate report. The author [11] expected to use data analysis devices that show the overall places of data focus in fewer dimensions while keeping the variety of the first data set however much as could be expected, and cluster nations as indicated by their scores on the framed dimensions. The wavelet local multiple correlations (WLMC) [12] results affirm that this strategy can catch the most key data contained in multivariate environment time series and is reasonable to the examine correlation among environment time series in a multivariate context. The authors in [13] present a tripartite framework that “unloads” the idea of mitigation pathways by recognizing three factors that together decide real mitigation: technical potential, initiative feasibility, and behavioral plasticity. The framework intends to incorporate and smooth out heterogeneous disciplinary examination customs towards an extensive and straightforward methodology that will work with learning across disciplines and empower mitigation pathways to all the more completely reflect accessible information. The three thoughts for coordinating the tripartite framework into recent research on environmental change mitigation. Cherukuri et al. [14] has proposed a strategy to detect the intrusion dependent on bandwidth utilization design analysis joined with protocol headers design coordinating of the packets transfers from the framework with the internet or network. The framework involves principally three parts: a screen which faculties and concentrates the packet data from the transmitted packets, classifier orders the packets as being interfering, and non-meddling and execution analyzer to analyze the framework. Sharma et al. [15] clarified about the Intrusion Detection System (IDS) is the way toward observing the occasions happening in a PC framework or network. In addition, analyzing them for indications of potential episodes, which are infringement or impending dangers of infringement of PC security arrangements, worthy use strategies, or standard security rehearses. Occurrences have many causes, for example, malware (e.g. Worms, spyware), aggressors acquiring unapproved admittance to frameworks from the Internet, and approved clients of frameworks who abuse their advantages or endeavor to acquire additional advantages for which they are not approved. It utilizes a signature for assault detection. The framework not just detects the interlopers by the IP address; it detects the framework with its substance also. The framework checks the data set for the already enlisted interlopers. Whenever found interfering the data is sent to the firewall for impeding. Labib et al. [16] has proposed a multivariate statistical method called Principal Component Analysis to detect chosen Denial-of-Service and network test assaults. The principal segments were calculated for both assault and normal traffic, and the stacking values of the different component vector segments were analyzed regarding the Principal Segments. The change and standard deviation of the Principal Components are calculated and analyzed.
Cloud computing is used to fascinate the records from various sources through the network. At this point, there is a high probability of intruders intended to interrupt the services. Our main intention is to stop them by detecting and preventing them. Therefore, the overall work of this paper revolves around finding the best algorithm. The Mitigated multivariate correlation analysis has to comprise the perception of Multivariate correlation analysis with a strong correlation coefficient algorithm. That will resolve the problem of understanding the basic feature of every individual record and request. Hence, here we are utilizing spearman’s coefficient to find out the perfect relation between the normal as well as abnormal activity in cloud computing. Decision-making and filtering progression is intricate to filter the requested resources and allocate them required facilities.
The proposed Hybrid algorithm is capable of eliminating the denial of service or distributed denial of service attacks in the network. The Architecture of proposed Hybrid algorithm is shown in Fig. 1. Not only that, it overpowers the major security problems handled by the network traffic. The Hybrid algorithm is a combination of mitigation and correlation algorithms to clear out the traffic and bottleneck issues. Mitigation and multivariate correlation analysis are linearly implemented in the Hybrid algorithm and it is categorized into three modules.
• Generation of individual records
• Multivariate correlation analysis
• Decision making and filtering.

Figure 1: Architecture of proposed hybrid algorithm
3.1 Basic Feature Generation of Individual Records
Generation of basic feature for implementing traffic to the core of the system, which ensures the protection of server and this, is made use of to generate records about the traffic frequently. Observing and examining the target network greatly help in detection of vulnerable application. This system effectively supports in finding exact security measure intended for internal communications. Diminishing the quantity of features acquires clear advantages terms of computational resources. That means less data process quickly and data extraction is easy. Additionally, data mining and AI procedures benefit from dimensionality reduction in more complicated ways. In this part, we present feature generation methods, their advantages for classification (past asset enhancement), and their suggestions managing network peculiarity recognition databases. The basic feature generation of individual contains ‘duration’, ‘protocol_type’, ‘service’, ‘flag’, ‘src_bytes’, ‘dst_bytes’, ‘land’, ‘wrong_fragment’, ‘urgent’, ‘hot’, ‘num_failed_logins’, ‘logged_in’, ‘num_compromised’, ‘root_shell’, ‘su_attempted’, ‘num_root’, ‘num_file_creations’, ‘num_shells’, ‘num_access_files’, ‘num_outbound_cmds’, ‘is_host_login’, ‘is_guest_login’, ‘count’, ‘srv_count’, ‘serror_rate’, ‘srv_serror_rate’, ‘rerror_rate’, ‘srv_rerror_rate’, ‘same_srv_rate’, ‘diff_srv_rate’, ‘srv_diff_host_rate’, ‘dst_host_count’, ‘dst_host_srv_count’, ‘dst_host_same_srv_rate’, ‘dst_host_diff_srv_rate’, ‘dst_host_same_src_port_rate’ ‘dst_host_srv_diff_host_rate’, ‘dst_host_serror_rate’, ‘dst_host_srv_serror_rate’, ‘dst_host_rerror_rate’, and ‘dst_host_srv_rerror_rate’. The outcome of these records are evaluated by the following procedures.
3.2 Sample-by-Sample Detection
Sample by sample detection operates through a mathematical formulation listed below. It is needed to describe basic facts of each data as well as the incoming traffic samples are impartial and equally share out. There is a need for the quickest detection of abnormal behavior in the request [17–19], and validate the request from the client. The difference between a legitimate and illicit request from the client should be identified and separated. To recognize the difference, the following mathematical functions are derived. The Typical distribution functions are X1 ∼ N(
respectively, where
where
The samples are allowed to apply the distribution function which resultant in the probability distribution of a binomial random variable. It is written as
The sample-by-sample characterizing proved that it could accomplish better results than group-based characterizing.
3.3 Multivariate Correlation Analysis Using Spearman
This method based on Spearman’s Correlation Coefficient to drags out the correlative data’s in the scrutinized information attribute that is the complete record of the stakeholders. The aspects are shown in the results [20]
Take a random information set contains x1,x2,x3….xn, Let X1 = { x1,x2,x3….xn, } where xi = [f1i, f2i,………..fmi], (1
3.4 Spearman’s Correlation Coefficient
Correlation coefficients are used to calculate the relationship between two variables. There are several types of correlation coefficients. Among them, the Pearson coefficient is quite popular. The Pearson P shows the cordial relationship between two data variables. Spearman’s correlation is much better than Pearson in the fact that it is not limited to straight interrelation. Pearson coefficient cannot explain the difference between dependent and independent variables. Here Spearman’s correlation coefficient is based on the measurement of increasing or decreasing monotonic association rejecting the mixed ones and it depends on the sorted order of the variables. That is, the spearman coefficient takes account of the obtained rank value of every variable involved. Hence, this becomes suitable to use in both linear and diverse data. The formula of both Spearman’s coefficient and Pearson are almost identical except for the usage of calculator rank by the Spearman’s coefficient.
At times, where every rank is exclusive and no two ranks are same, then simple formula:
where di = rank (Xi) – rank (Yi) is the deviation of two ranks obtained and n is the number of values obtained. The formula to use when there are tied ranks is:
This example can be more relevant in explaining the variations between Spearman’s coefficient and Pearson’s correlation. Three cases with both correlations are involved shown in the following Figs. 2–4. The first one shows an increase in monotonic and indefinite interrelation. Since the sorted ranks of the parameters are clearly arranged here, the Spearman coefficient is one. Hear the unsteady one is Pearson’s correlation, but it reflects a stable fraternity because of the indefinite straightness of the interrelation.

Figure 2: Monotonic

Figure 3: Non-monotonic
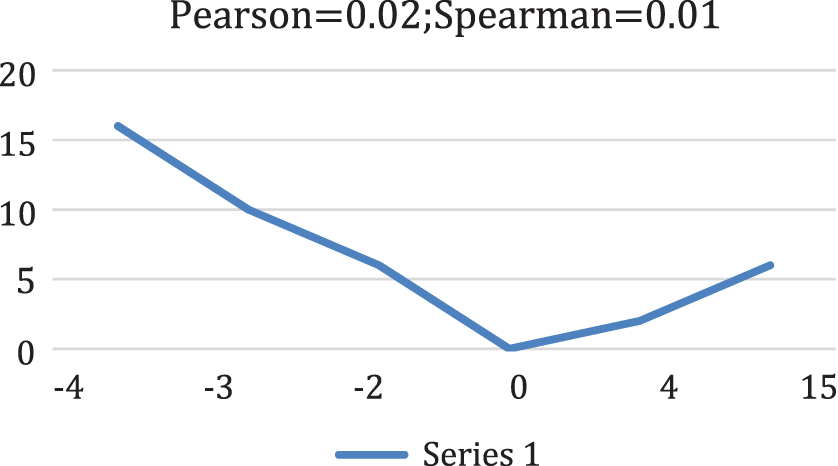
Figure 4: Quadratic relationship
Fig. 2 presents fair sets in X and an active, but the non-monotonic combination of two sets in Y. Pearson correlation becomes nearly zero yeah because of the non-linearity. There is a less strong relation of spearman correlation as the information is non-monotonic. At last, an excellent equilateral interrelation intensified to zero is reflected in Fig. 3. The non-monotonic, less straight, and balanced characteristic of the information of correlation makes it around zero. The speculative prototype exhibit that this correlation does not express an intensive conclusion of interrelation within the information. Less strong correlation need not be a reflection of the absence of relationship as shown in Fig. 3. However, a full observation of the interrelation may not happen with an efficient correlation coefficient. The better way to obtain a good visual of the relationship between variables is to use visualization methods and different statistical information. Both covariance formula and formula of correlation, where deal with information values of mean data. For instance, to find the covariance among the values of X and Y, this formula can be used [21].
The covariance formula is similar to the formula for correlation and deals with the calculation of data points from the average value in a dataset. For example, the covariance between two random variables X and Y can be calculated using the following formula (for the record):
For a sample covariance, the formula is slightly adjusted:
where:
• Xi—the values of the X-variable
• Yj—the values of the Y-variable
•
•
• n—the number of the data points
3.4.2 Defining the Mahalanobis Distance
The Mahalanobis distance (MD) is the distance between two focuses in multivariate space. In a customary Euclidean space, factors (for example x, y, z) are addressed by axes attracted with right angles to one another. The distance between any two focuses is estimated with a ruler and the Probability contours are effectively used to explain Mahalanobis distance. Some of the characteristics of Mahalanobis distance are
i) It stands to show that variance of every direction or not same
ii) It also shows the characteristic of covariance within the variables.
iii) Likely Euclidean space for uncorrelated values of unit difference is determined here.
In case, when common data is unit variant, the Z score denotes the univariate value and hence the mean value here is zero and a variable that is unit in nature. The result is an amount that has no dimension, which is the space between the inspection and the average value. When common data that are multi-variant are concerned where μ is the mean and Σ is the covariance matrix, interrelation of the variables can be reversed and standardization can be achieved with the help of Cholesky transformation z = L–1(x – μ), L denotes the Cholesky factor of Σ. The covariance matrix can be found out using Σ = LLT. Once the transformation of information is achieved, the basic Euclidean distance between Z and origin can be found out. For the sake of ignoring square root, the square of the Euclidean distance is calculated by dist2(z,0) = zTz. The length where the origin is located is found out. This is the method of how Z score is generated. Squared distance Mahal2(x, μ) is denoted by,
Squared Mahalanobis distance is defined by the above formula. Matrices such as (AB)T = BTAT, (AB)–1 = B–1A–1, and (A–1)T= (AT)–1 are used commonly. It notes the identity matrix denoted between x and μ. The difference in each value and covariance of variables are determined by Mahalanobis distance. Technically, it is achieved by the transformation of information into common and uncorrelated information and calculating the simple Euclidean length for the result. This shows that Mahalanobis distance is likely to unit variable z score that gives a path to calculated length [22].
After applying the concept of Mahalanobis distance, estimate the mean, covariance, and standard variation values of every single record. Observe the traffic, normal profile, and alpha as input to determine the attack. Generate the Spearman’s correlation for input traffic by analyzing the Mahalanobis distance (MD) between normal profile and input traffic. Threshold [23] value is considered necessary to find out the dissimilarity between the legitimate and illegitimate clients.
For a Gaussian distribution, α is generally varied between 1 to 3. If the Mahalanobis distance (MD) is less than the Threshold (Th) then recognize the activity as normal else, it is considered as attacked which results in to dropping the request.
A Turing test was performed to obtain data of defective IP addresses and isolate them in the blacklist. when an IP address struggles to clear the Turing test or if it fails to respond to the quarries of Turing test within the time which is considered as optimum answering time, then it is said to be a faulty IP address [24]. Hence when and the user sends a request through the IP address that is included in the blacklist, the system rejects the request and hinders all the resources from the user’s accessibility. If the IP address passes the first criteria, then it checks whether the amount of requests sent by the particular IP address is less than the resource available in the system. If the amount of requests is less than the number of resources in the system, then the request will be sent to the third stage or more requests will be asked for the service to be completed. In the third step, the number of requests will be compared with Th. This is the extreme value of the number of times T, the request can be done. The value
Algorithm
Step 1: Request arrived from the client side
Step 2: Insert the network traffic record
Step 3: Calculating Multivariate Correlation Analysis
• Employ the idea of Spearman correlation to find the correlation among the jth and kth feature in vector Xi
Step 4: Normal profile generation.
• Create Spearman correlation of every single record
• Make the co-variance matrix
• Estimate mahalanobis distance (MD) among legal records Spearman correlation and input.
• Mahalanobis distance (MD) is described by two parameter mean and variance.
• Calculate Mean
• Calculate standard deviance
• Return Pro
pro
Step 5: Calculate Mahalanobis distance (MD) between normal and input traffic
Step 6: If
• Recognize normal request and allocate the resources
Step 7: Else
• Drop the request
The client sends the request to the server through the browser. The connection between the client and server is the network and the number of requests at a time can create traffic. In our proposed methodology, initially obtain every individual traffic record and then subject it to apply the Spearman coefficient algorithm to know the difference between normalized and non-normalized behavior in the network. After generating the normal profile generation, that shows the intention of each user. Calculate the Mahalanobis distance between normal and traffic record. The obtained value is compared with the threshold value obtained during the mitigation process. If the MD is less than the threshold allows the resource needed for the client request else drop the request. The following Fig. 5 shows the data flow of the hybrid algorithm.
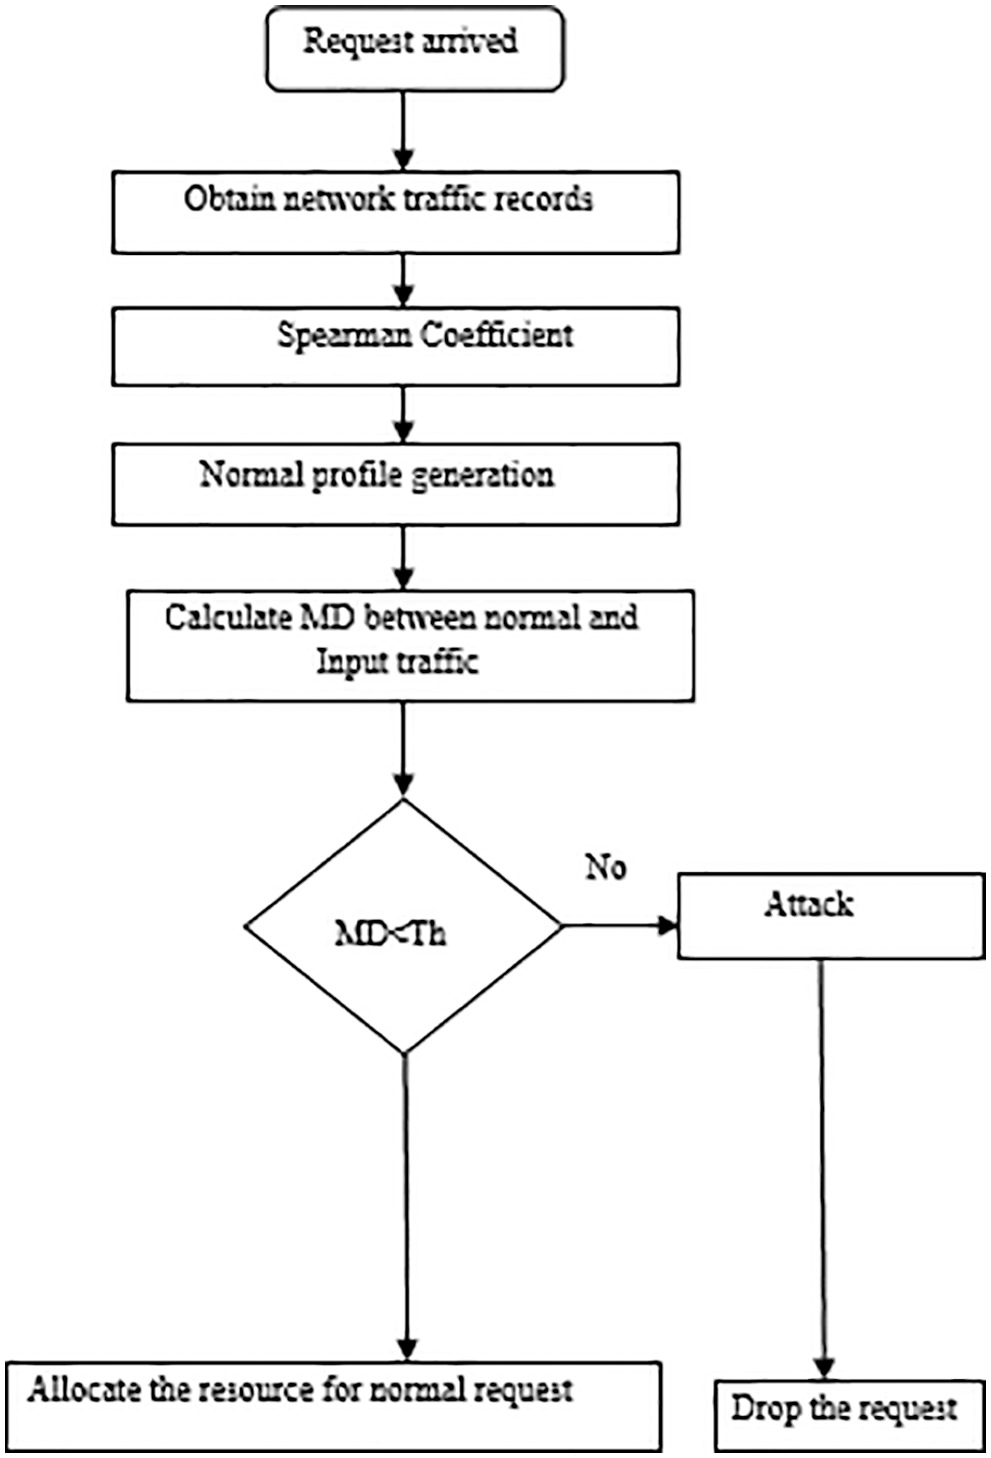
Figure 5: Dataflow of hybrid algorithm
In our method, the intended segment gives the itemized data about KDD CUP 99 informational collection utilized here for the simulation process. It additionally portrays the various kinds of assaults and shows the number of tests each assault type contains in 10% of the unique informational collection. The experimental analysis for the proposed approach uses KDD CUP 1999 dataset. It devours huge fixation in the assessment of abnormality-based interruption recognition techniques. KDD CUP 1999 contains transmission control protocol’s dump information of 7 weeks of system traffic, which can be overseen into 11777 association records. The test information for around about fourteen days has 11777 records and preparing informational collection to be made of roughly 11777 single association vectors; every one contains 41 and it is marked as either typical or an assault alongside a specific assault type. The assaults are tending to categorize as one of the accompanying four classifications. Experiments performed with KDD CUP 99 datasets and the comparisons performed with recent works in the literature indicates detection rates exhibiting the effectiveness of the proposed model.
4.1 Data Visualization of the Dataset
Data Visualization is the graphical representation of the KDD CUP 99 dataset as shown in Fig. 6. We observe that ICMP has appeared mostly in the used data, then TCP and nearly 20000 packets of UDP type.
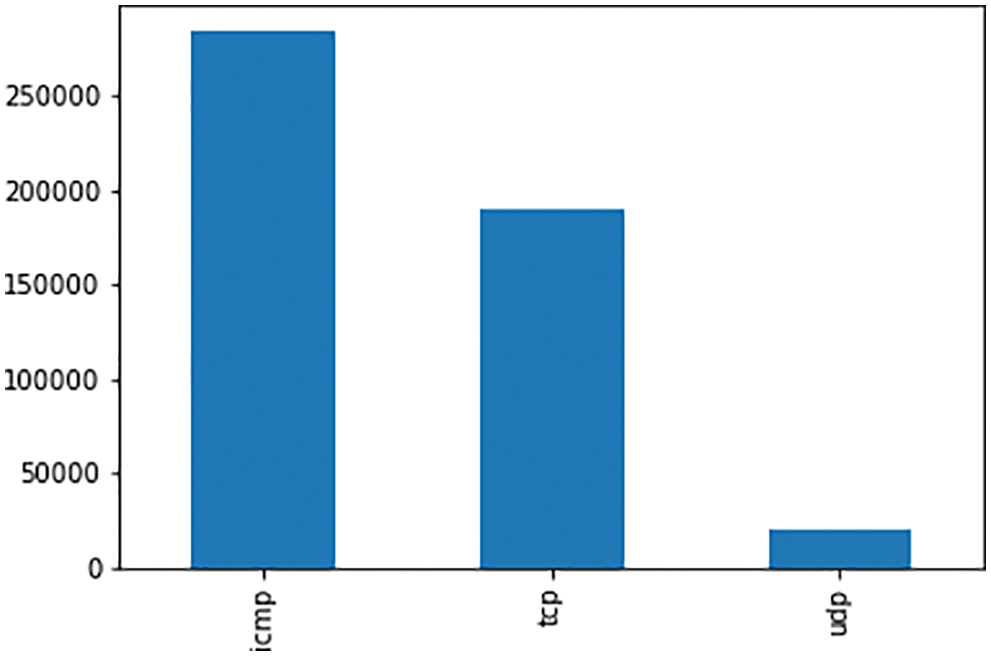
Figure 6: Data visualization of KDD CUP 99 dataset
The type of attack is categorized to apply the needed detection algorithm to prevent the server from upcoming attacks. Fig. 7 depicts the types of attacks categorized in the KDD CUP 99 dataset whereas the DoS and DDoS are separated from the dataset to show the detailed perception pattern of attackers in Fig. 8. The training and testing accuracy of the dataset shown in Figs. 9 and 10 explains the efficiency of the proposed algorithm in comparison with Naïve Bayes, Decision Tree, Random Forest, Support Vector Machine, Linear regression, and Gradient Boosting algorithms.
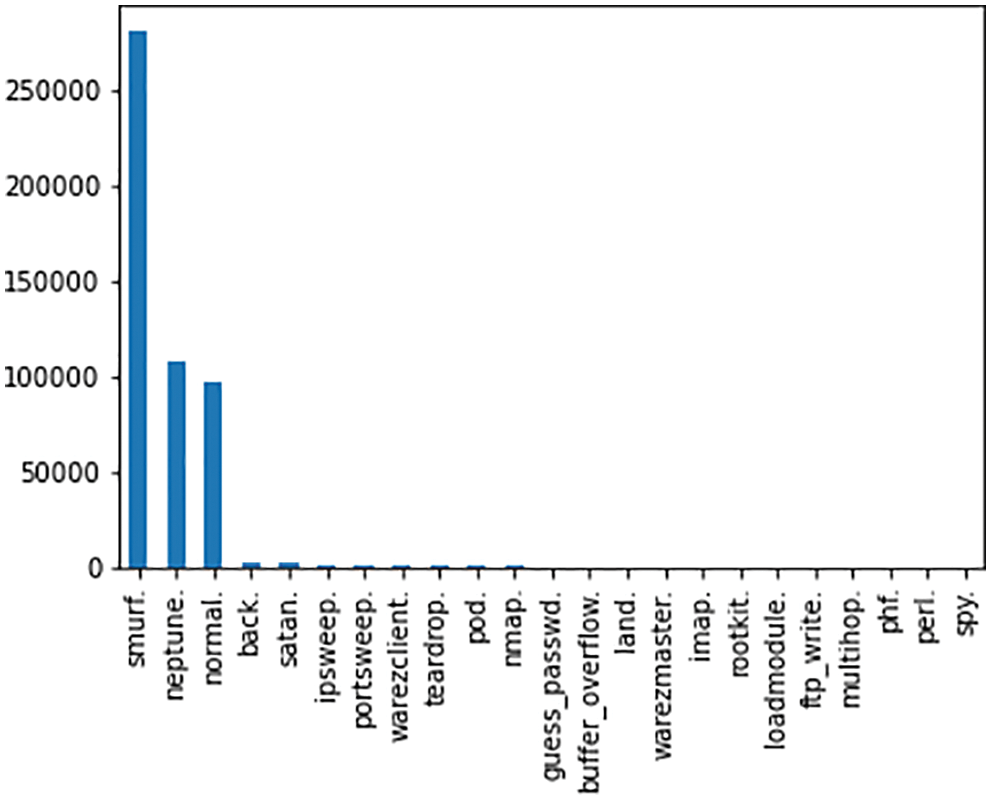
Figure 7: Types of attacks classified from dataset
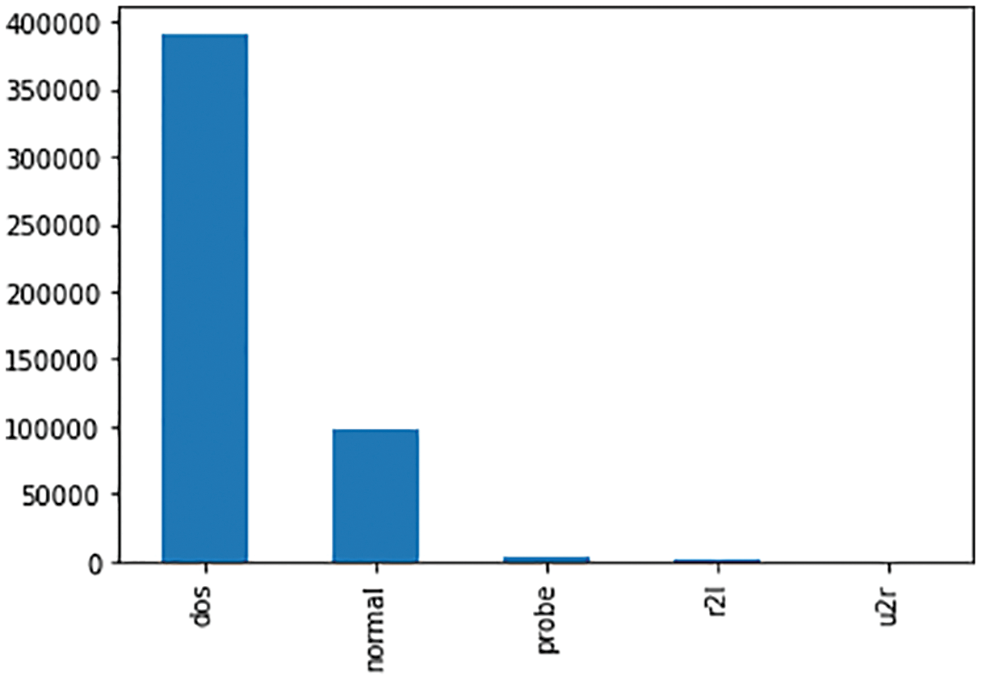
Figure 8: Separating the DoS attack from the dataset
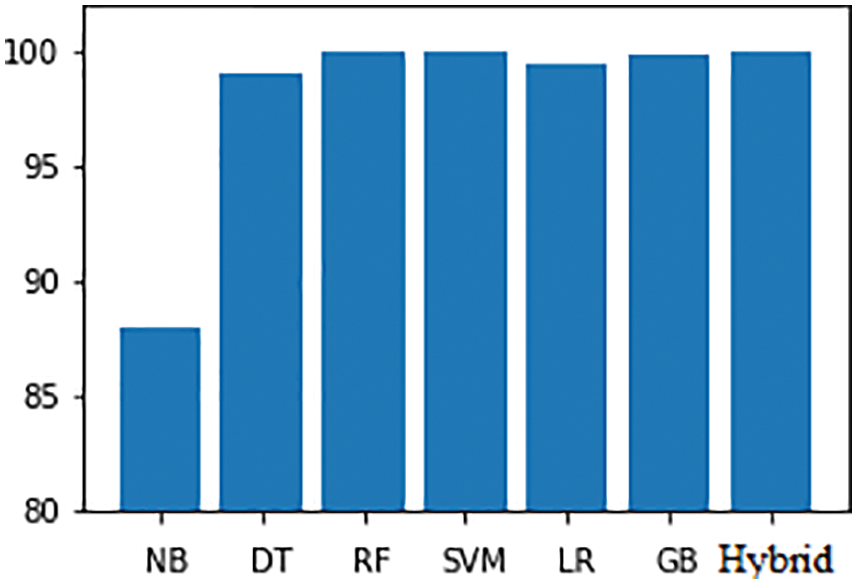
Figure 9: Training accuracy compared
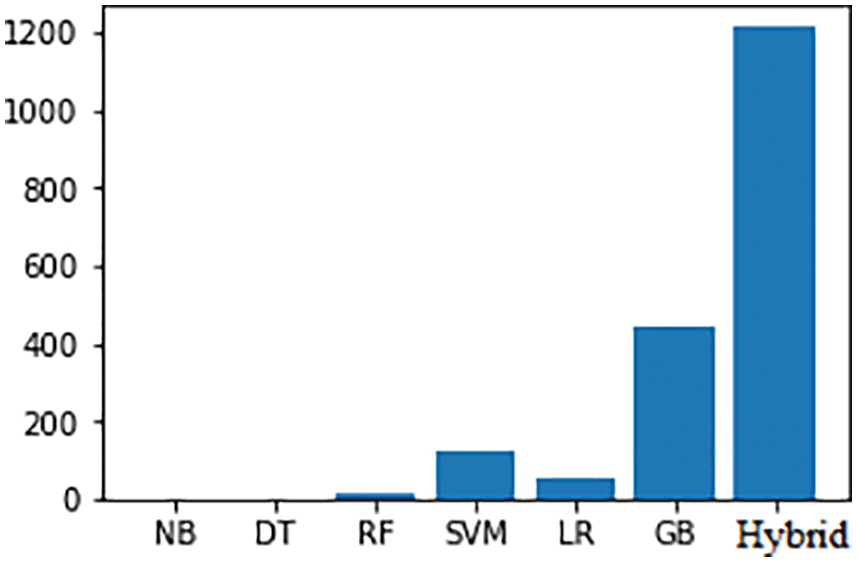
Figure 10: Testing accuracy
Accuracy: Accuracy is defined as the level of right predictions for the test data. It tends to be determined effectively by dividing the number of right predictions by the number of complete predictions.
Training Dataset: The example of information used to fit the model.
Validation Dataset: The example of information used to give a fair assessment of a model fit on the training dataset while tuning model hyperparameters. The assessment turns out to be more one-sided as expertise on the validation dataset joined into the model design.
Test Dataset: The example of information used to give a fair assessment of a last model fit on the training dataset.
Our proposed approach significantly reduces the high time complexity of the training and testing processes in Fig. 11. An average level of model complexity reduces the prediction error of the test dataset.
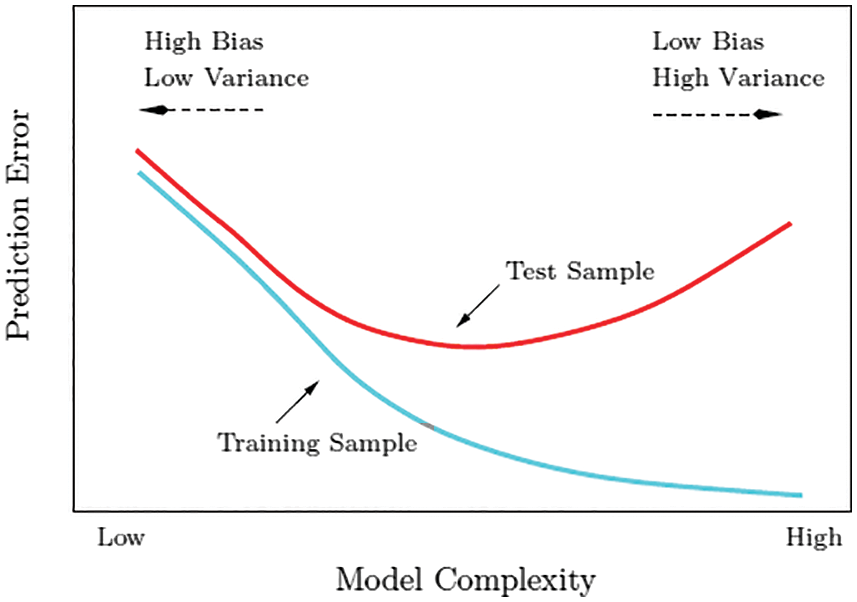
Figure 11: Model complexity vs prediction error for training and test sample
This paper has supplied a Hybrid algorithm-based DoS attack detection method that is powered via the Spearman correlation-based MCA method, anomaly-based detection, and filtering. The former approach extracts the geometrical correlations hidden in individual pairs of two distinct features inside every community traffic document. It gives accurate characterization for network traffic behaviors. The latter method facilitates our system so that you can discriminate both acknowledged and unknown DoS assaults from valid network visitors. The effect of unique non-normalized and normalized facts has been studied in the paper. The consequences have revealed that when working with non-normalized statistics, our detection system achieves most ninety-five percent detection accuracy even though it does now not work well in figuring out Land, Neptune, and Teardrop assault facts. This problem was solved by making use of the statistical normalization technique to get rid of the unfairness from the statistics by implementing the filtering technique. The effects of comparing with the normalized information have shown an extra encouraging detection accuracy of 99% for the numerous DoS attack as well as DDoS attacks. Besides, the contrast result has confirmed that our detection system outperforms two trendy procedures in terms of detection accuracy that is the combination of multivariate correlation analysis with Spearman correlation coefficient and mitigating Distribution in cloud computing environment-benefitting threshold-based Technique. Moreover, the computational complexity and the time taken to complete the detection and prevention of the attacks had been analyzed. The proposed methodology achieves equal or higher performance in assessment with the two trendy procedures. It greatly decreases the time complexity in the training and testing phase and improves the accuracy compared to other existing methodologies.
Acknowledgement: All Praise, Glory, and Honor to the Almighty, source of all knowledge for his gracious presence and guidance that enabled me to complete this project in due time. My sincere thanks and profound sense of gratitude to the Chairman, Bishop Rt. Rev. Dr. A. R. Chelliah. In addition, regards to our principal Dr. K. Dhinesh Kumar for his wishes and kind cooperation in all aspects completion of the research paper. With great interest, I express my thanks to all the members of the Computer Science Faculty and Technical Staff for providing necessary information and for the sustained interest shown for the completion of this academic exercise. My Wholehearted gratitude and thanks to my family members and friends for their perpetual support and encouragement
Funding Statement: The authors received no specific funding for this study.
Conflicts of Interest: The authors declare that they have no conflicts of interest to report regarding the present study.
1. Y. Alghofaili, A. Albattah, N. Alrajeh, M. A. Rassam and B. A. S. Al-rimy, “Secure cloud infrastructure: A survey on issues, current solutions, and open challenges,” Applied Sciences, vol. 11, no. 19, pp. 9005–9041, 2021. [Google Scholar]
2. S. M. Mehibs and S. H. Hashem, “Proposed network intrusion detection system based on fuzzy c mean algorithm in cloud computing environment,” Journal of University of Babylon for Pure and Applied Sciences, vol. 26, no. 2, pp. 27–35, 2017. [Google Scholar]
3. A. N. Jaber and S. U. Rehman, “FCM-SVM based intrusion detection system for cloud computing environment,” Cluster Computing, vol. 23, no. 9, pp. 3221–3231, 2020. [Google Scholar]
4. Z. Zhang, J. Wen, J. Zhang, X. Cai and L. Xie, “A many objective-based feature selection model for anomaly detection in cloud environment,” IEEE Access, vol. 8, pp. 60218–60231, 2020. [Google Scholar]
5. R. V. Deshmukh and K. K. Devadkar, “Understanding DDoS attack & its effect in cloud,” Elsevier Procedia Computer Science, vol. 49, pp. 202–210, 2015. [Google Scholar]
6. F. Wong and C. X. Tan, “A survey of trends in massive DDoS attacks and cloud-based mitigations,” International Journal of Network Security and its Applications (IJNSA), vol. 6, no. 3, pp. 57–71, 2014. [Google Scholar]
7. M. H. Bhuyan, D. K. Bhattacharyya and J. K. Kalita, “An empirical evaluation of information metrics for low-rate and high-rate DDoS attack detection,” Elsevier Pattern Recognition Letters, vol. 51, pp. 1–7, 2015. [Google Scholar]
8. B. Cha and J. Kim, “Study of multistage anomaly detection for secured cloud computing resources in future internet,” in Proc. of the IEEE Ninth Int. Conf. on Dependable, Autonomic and Secure Computing, Sydney, Australia, pp. 1046–1050, 2011. [Google Scholar]
9. E. O. Moschidis, “A different approach to multiple correspondence analysis (MCA) than that of specific MCA,” Mathématiques et Sciences Humaines, vol. 186, pp. 77–88, 2006. [Google Scholar]
10. A. Ramadan, A. Kamel, A. Taha, A. El-Shabrawy and N. A. Abdel-Fatah, “A multivariate data analysis approach for investigating daily statistics of countries affected with COVID-19 pandemic,” Heliyon, vol. 6, no. 11, pp. e05575, 2020. [Google Scholar]
11. J. M. P. Martínez, J. F. Macho and M. M. Elizalde, “Dynamic wavelet correlation analysis for multivariate climate time series,” Scientific Reports, vol. 10, pp. 21277, 2020. [Google Scholar]
12. K. S. Nielsen, P. C. Stern, T. Dietz, J. M. Gilligan, D. P. V. Vuuren et al., “Improving climate change mitigation analysis: A framework for examining feasibility,” One Earth, vol. 3, no. 3, pp. 325–336, 2020. [Google Scholar]
13. S. Jin, D. S. Yeung and X. Wang, “Network intrusion detection in covariance feature space,” Elsevier Pattern Recognition, vol. 40, no. 8, pp. 2185–2197, 2007. [Google Scholar]
14. R. Cherukuri, T. S. Rani, C. Madhavi and M. Gadiparthi, “A real time dos attack detection in IP networks based on bandwidth utilization pattern and rule based pattern matching,” International Journal of Computer Science and Technology( IJCST), vol. 2, no. 3, pp. 413–417, 2011. [Google Scholar]
15. M. Sharma and Anuradha, “Network intrusion detection system for denial of service attack based on misuse detection,” International Journal of Computational Engineering & Management (IJCEM), vol. 12, pp. 19–23, 2011. [Google Scholar]
16. K. Labib and R. V. Vemuri, Detecting and visualizing denial-of service and network probe attacks using principal component analysis. Davis, CA, USA: Department of Applied Science University of California, 2005. [Google Scholar]
17. G. V. Moustakides, “Quickest detection of abrupt changes for a class of random processes,” IEEE Transactions on Information Theory, vol. 44, no. 5, pp. 1965–1968, 1998. [Google Scholar]
18. A. A. Cardenas, J. S. Baras and V. Ramezani, “Distributed change detection for worms, DDoS and other network attacks,” in Proc. of the American Control Conf., Boston, Massachusetts, vol. 2, pp. 1008–1013, 2004. [Google Scholar]
19. Z. Tan, A. Jamdagni, X. He, P. Nanda and R. P. Liu, “A system for denial-of-service attack detection based on multivariate correlation analysis,” IEEE Transactions on Parallel and Distributed Systems, vol. 25, no. 2, pp. 447–456, 2014. [Google Scholar]
20. L. Y. Beng, S. Ramadass, S. Manickam and T. S. Fun, “A survey of intrusion alert correlation and its design considerations,” IETE Technical Review, vol. 31, no. 3, pp. 233–240, 2014. [Google Scholar]
21. C. Thirumalai, S. A. Chandhini and M. Vaishnavi, “Analysing the concrete compressive strength using Pearson and spearman,” in Proc. of the Int. Conf. of Electronics, Communication and Aerospace Technology (ICECA), Coimbatore, India, pp. 215–218, 2017. [Google Scholar]
22. N. Bharot, V. Suraparaju, S. Gupta and P. Verma, “Mitigating distributed denial of service attack in cloud computing environment using threshold based technique,” Indian Journal of Science and Technology, vol. 9, no. 38, pp. 1–7, 2016. [Google Scholar]
23. L. Feinstein, D. Schnackenberg, R. Balupari and D. Kindred, “Statistical approaches to DDoS attack detection and response,” in Proc. of the Defense Advanced Research Projects Agency (DARPA) Information Survivability Conf. and Exposition, vol. 1, pp. 303–314, 2003. [Google Scholar]
24. R. C. Baishya and D. K. Bhattacharyya, “A complete detection and mitigation framework to protect a network from DDoS attacks,” IETE Journal of Research, vol. 1, no. 40, pp. 1–18, 2019. [Google Scholar]
25. Z. Tan, A. Jamdagni, X. He, P. Nanda and R. P. Liu, “Triangle-area-based multivariate correlation analysis for effective denial of-service attack detection,” in Proc. of the IEEE 11th Int. Conf. on Trust, Security and Privacy in Computing and Communications, Liverpool, United Kingdom, pp. 33–40, 2012. [Google Scholar]
 | This work is licensed under a Creative Commons Attribution 4.0 International License, which permits unrestricted use, distribution, and reproduction in any medium, provided the original work is properly cited. |