DOI:10.32604/iasc.2023.023817
| Intelligent Automation & Soft Computing DOI:10.32604/iasc.2023.023817 | |
| Article |
A Novel Radial Basis Function Neural Network Approach for ECG Signal Classification
1Department of Information Technology, Adhiyamaan College of Engineering, Hosur, 621004, India
2Department of Information Technology, Kongu Engineering College, Erode, 638060, India
*Corresponding Author: S. Sathishkumar. Email: sathismecse@gmail.com
Received: 22 September 2021; Accepted: 29 January 2022
Abstract: Electrocardiogram (ECG) is a diagnostic method that helps to assess and record the electrical impulses of heart. The traditional methods in the extraction of ECG features is inneffective for avoiding the computational abstractions in the ECG signal. The cardiologist and medical specialist find numerous difficulties in the process of traditional approaches. The specified restrictions are eliminated in the proposed classifier. The fundamental aim of this work is to find the R-R interval. To analyze the blockage, different approaches are implemented, which make the computation as facile with high accuracy. The information are recovered from the MIT-BIH dataset. The retrieved data contain normal and pathological ECG signals. To obtain a noiseless signal, Gabor filter is employed and to compute the amplitude of the signal, DCT-DOST (Discrete cosine based Discrete orthogonal stock well transform) is implemented. The amplitude is computed to detect the cardiac abnormality. The R peak of the underlying ECG signal is noted and the segment length of the ECG cycle is identified. The Genetic algorithm (GA) retrieves the primary highlights and the classifier integrates the data with the chosen attributes to optimize the identification. In addition, the GA helps in performing hereditary calculations to reduce the problem of multi-target enhancement. Finally, the RBFNN (Radial basis function neural network) is applied, which diminishes the local minima present in the signal. It shows enhancement in characterizing the ordinary and anomalous ECG signals.
Keywords: Electrocardiogram signal; gabor filter; discrete cosine based discrete orthogonal stock well transform; genetic algorithm; radial basis function neural network
Automatic electrocardiogram analysis is the best practice for recording the functions of the heart by positioning the electrodes at the external area of the skin. The research on ECG device is focused by various researchers in recent years [1,2]. The advance techniques in ECG provide enhancement in visualizing the heart abnormalities at regular interval. It is most helpful in diagnosing the cardiac disorders like myocardial infarction. In India, 5.5% of sudden cardiac death is recorded for every year [3,4]. A myocardial dead tissue is produced by incorporating the historical backdrop of ailment and physical investigation with electrocardiogram discoveries. Among various heart diseases, the wall rupture is a complicated one. In [5], it occurs in 1% of patients of acute myocardial infarction and it accounts for up to 7% of all infarct related death. Automatic ECG analysis has worked well in the identification of cardiac related problems to provide better treatment. The measure of heart tissue harmis decided by the multi goal examination of electrocardiogram signals [6]. The most crucial component of the ECG signal is QRS complex and its pinnacle is indicated as R-peaks [7]. The R-R intermission is the time space among two successive R tops. It is utilized to find the abnormalities in the heart operation called arrhythmia. In this diagnosis, the size of infarct is estimated to identify the acute complications [8]. In ECG, Q and T waves play a major role. If any problem occurs in the P wave, it causes no complications. Thus, the QRS detection is necessary to achieve the target. T wave change is occurred in larger area, which denotes ischemia whereas the ST segment change is occurred in lesser area, which indicates the myocardial injury and Q wave overlie [9,10]. Many researchers have worked in the area of medical field under cancer detection, electrocardiogram analysis etc. Fig. 1 highlights the structure of ECG signal.
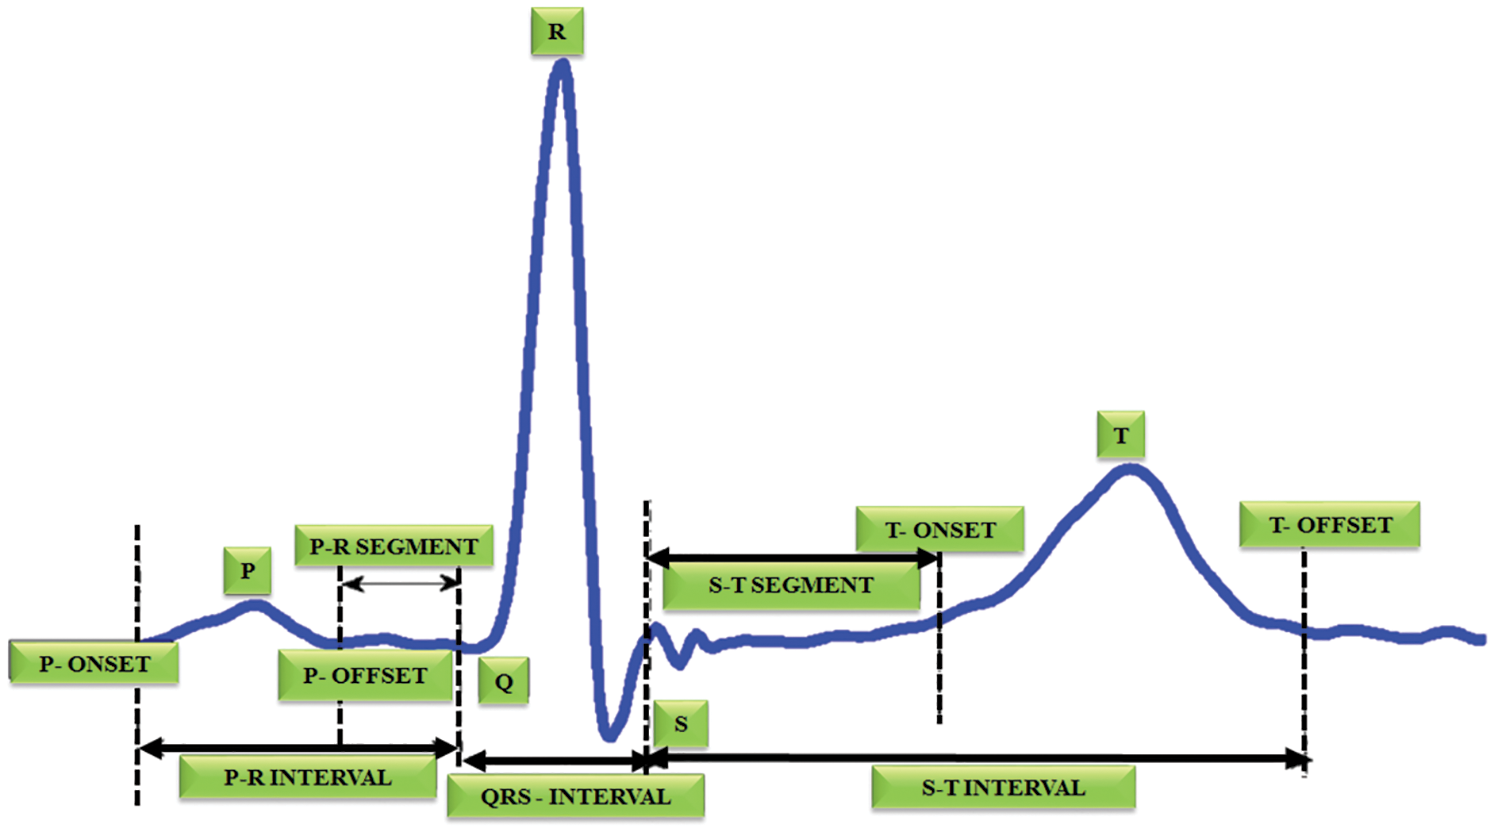
Figure 1: Structure of ECG signal
In [11], the blockage and R-R interval are determined to achieve good accuracy. The systematic finding of QRS complex is essential to extract the R-R interval from the electrocardiogram recordings. To accurately analyze the cardiac rate variation, the RR series plays a significant role, which provides a quantitative evaluation of heart autonomic capacity in both normal and sickness states [12,13]. In the past decades, wide collections of algorithm and techniques are used in understanding the automatic regulation of heart beat. However, the ECG recording contains fictitious occurrences of multiple disruptions like commotion interference in the signal, unexpected change in amplitude of QRS etc [14–16]. The noise interference in the electrocardiogram is removed with the assistance of preprocessing. By using the DCT algorithm based DOST, the signals are extracted [17] and the amplitude is computed in each interval. If there is any complication in computing the amplitude, it detects a block in that area. Initially, it is set as 100 hertz. It is split up into 5 intervals like PQRST and the amplitude is set as 1 millivolt. The frequency is computed by f = 1/T and then the features are extracted [18–20]. It helps to compute the mean and average of each interval. Finally, the RBFNN is used to analogize the trained and test data. The data is collected from the MIT-BIH dataset. The collected information have normal dataset and abnormal dataset [21–23]. The trained and test dataset is analogized with the ratio of 1:6 and the expected accuracy is met. This approach is used to decide the perfect calculation for analogizing various classes of ECG oddities by quantitatively looking at the different QRS identification method. It aids in detecting the blockage and R-R interval [24–27]. Though, many algorithms and approaches are used for QRS detection, the proposed work is used in real time analysis and it works well in performing large datasets as it requires no extensive computations for processing. It maximizes the detection accuracy to 98.5% accuracy.
The proposed system focuses on the blockage area to detect the R-R interval in ECG signal as represented in Fig. 2. This DCT-DOST segmentation with adaptive threshold is used in this paper to determine the QRS complex and R peak from the recorded signals of the MIH-BIH database. The distortion in the ECG is filtered by a Gabor filter and therefore the QRS complex information is preserved. After denoising, the signal gets segmented into 256 constituent parts and the magnitude is analogized with the trained data. It is performed for diagnosing the cardiac abnormality. The difference in the amplitude and time period of the ECG sample helps to analysis the abnormality. Nearly 50,000 samples of ECG signals are considered for this analysis. The sampling frequency is split into 5 intervals to detect the RR interval. The mean, variance, entropy are evaluated to extract the features. The GA is used to select significant features. The R peak, segment length and mean are identified for the underlying ECG signal. Finally, the test data is analogized with the trained ECG signal. By using the RBFNN classifier.
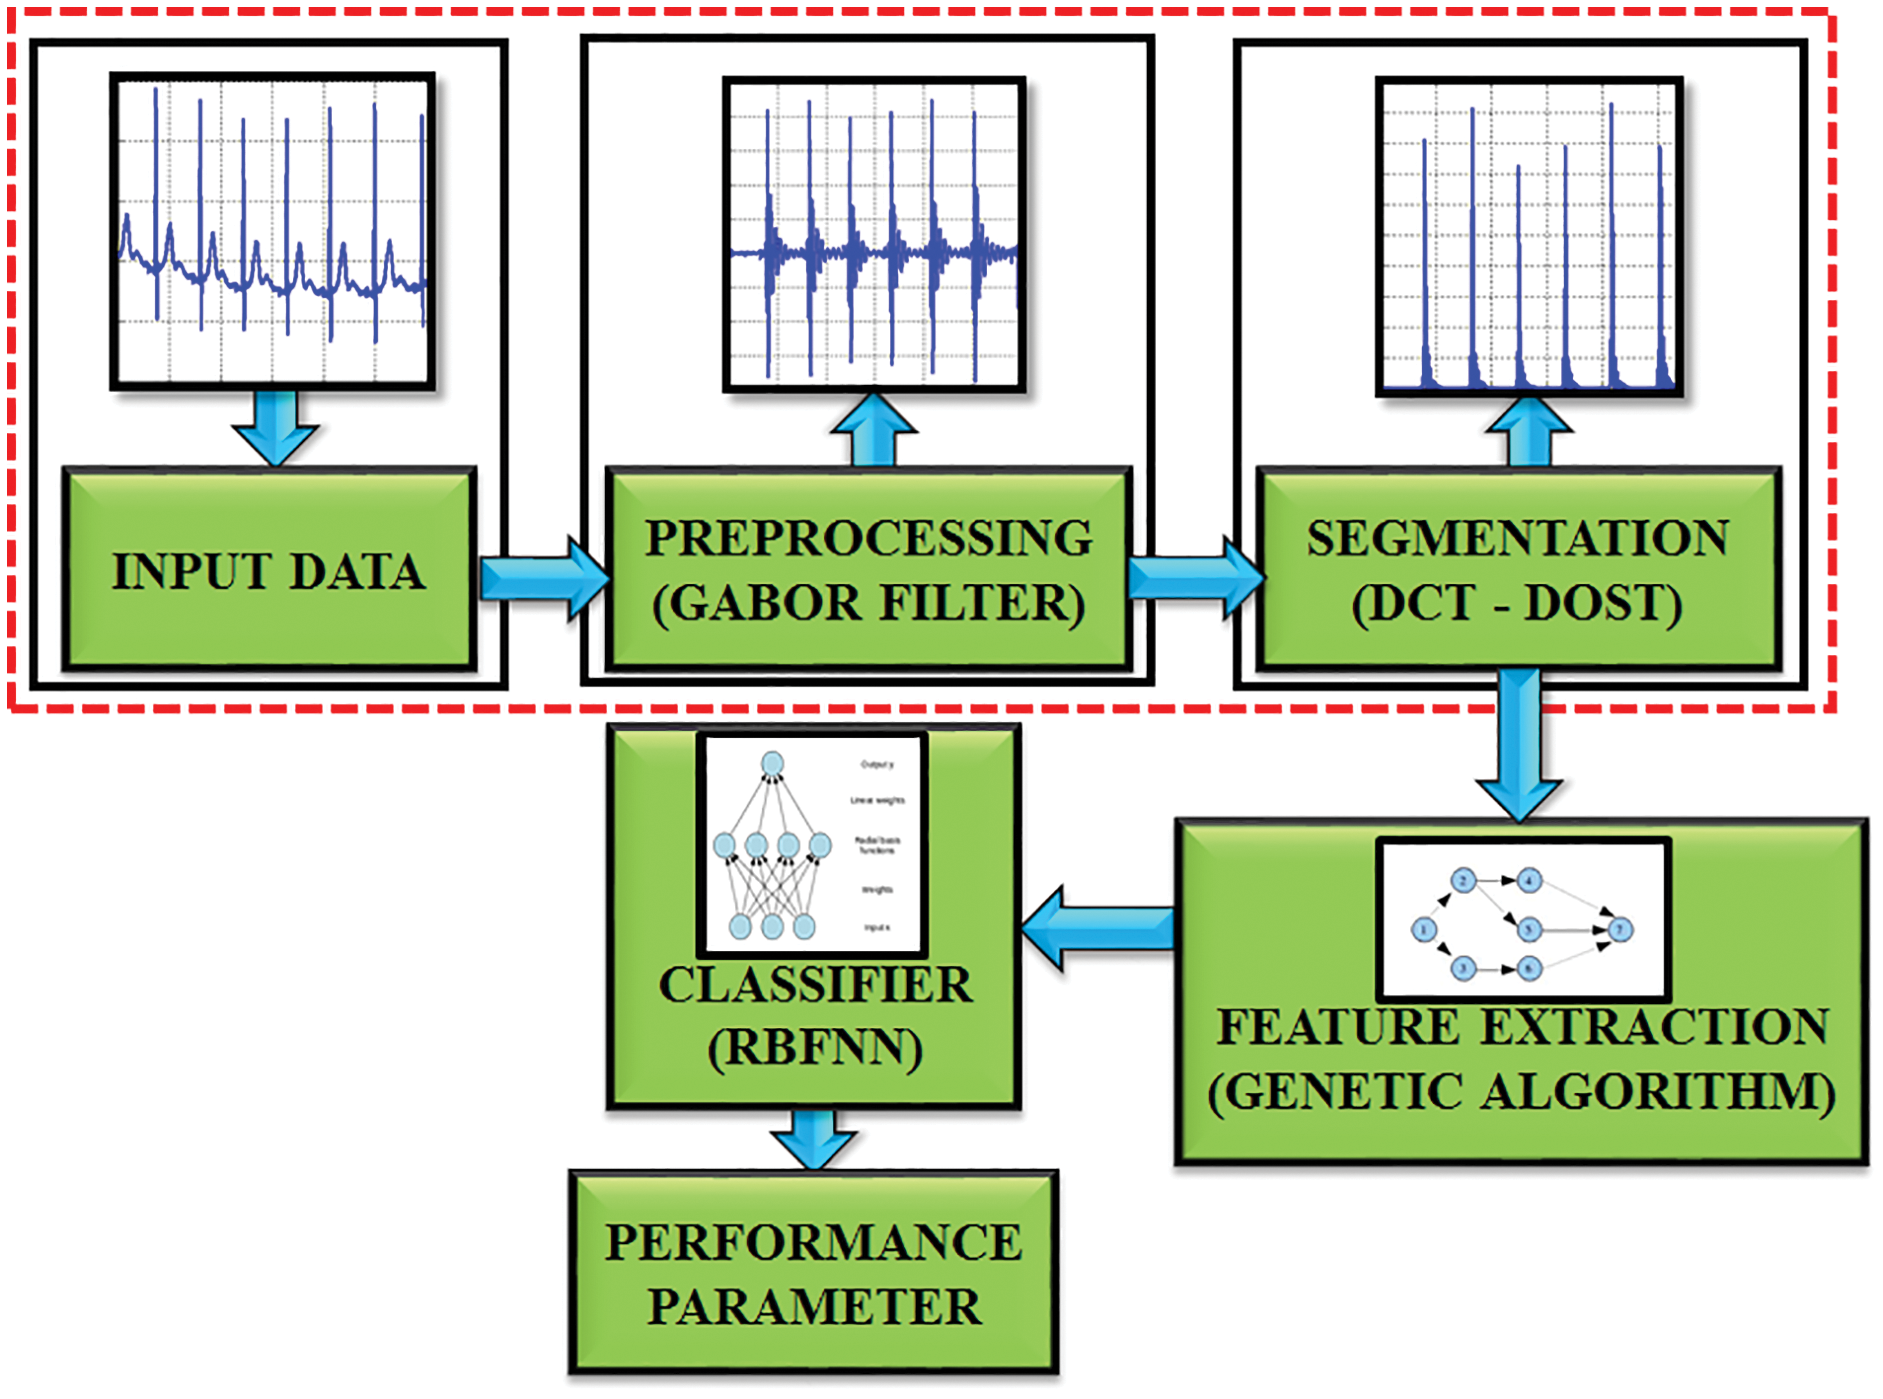
Figure 2: Block diagram of proposed work
Gabor filter is a type of linear filters and its response for impulse signal is characterized as a Gaussian function [28–30]. The requirement of minimal space bandwidth product makes this filter highly suitable for the proposed work.
To define the result of signal propagation in frequency domain, the unpredictable theory has to equal the constant value.
where, c is a constant, Δt, Δf is the time and frequency space measurement.
In 2D type, the time variable t is supplanted by spatial coordinates (x, y), and the frequency f is superseded by space variables (u, v). In most cases, the 2D Gabor function is evaluated as follows:
In the frequency domain,
where
The standard deviation of the elliptical Gaussian is represented as σx and σy in the x and y axis. For exact amplitude esteems, the DC values of a 2D Gabor filter are used to minimize the higher order harmonics, which is significantly depicted in Fig. 3. The formula for calculating the filter parameter is denoted as,
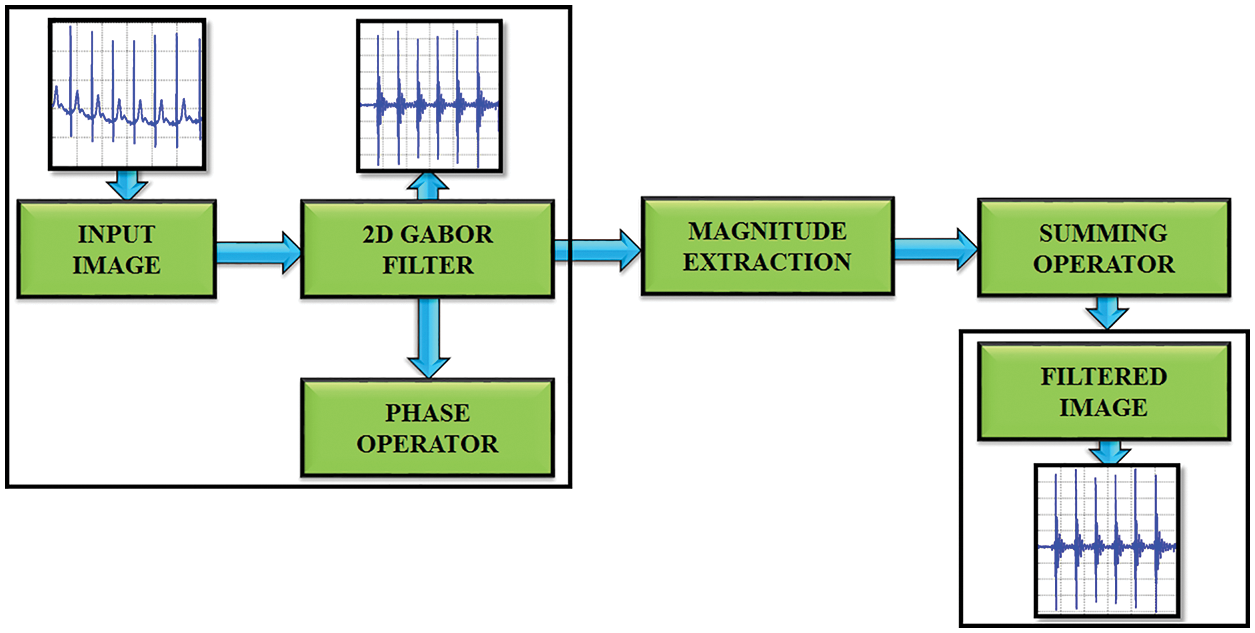
Figure 3: Gabor filter functionality
σu is computed by using the equation,
σv is evaluated by using,
2.2 DCT-DOST Based Segmentation
This method uses the DCT-DOST scheme to examine the time domain representation of the ECG signal and to naturally distinguish the R-peak. In the case of DOST, the signal loses its structure during the coefficient truncation. However, it withstands against the coefficient truncations with DCT. The DCT includes all the frequencies to reduce the unpredictability. The DCT-DOST shows essential coefficients at lower frequencies.
The linear S transform fill the gap among fourier and wavelet transforms. The S transfer of a signal h(t) is,
Window’s width is expressed as,
δ(τ, f0) is a 1D time function that demonstrates the magnitude change with time for a fixed frequency. The DOST of h (KT) is,
where,
where n extends from 1, 2,…N-1.
The proposed work’s main goal is to automatically find the peak value of R. To detect the R peak, every heartbeat segment consists 105 patterns as per the R top identification and 151 patterns are generated after the retrieval of R-peak. A sum of 256 patterns is taken to find the extension of cardiac pulse. The advantage of determining the length of every cardiac pulse is to accurately detect the R top. The entire process is depicted in Fig. 4.
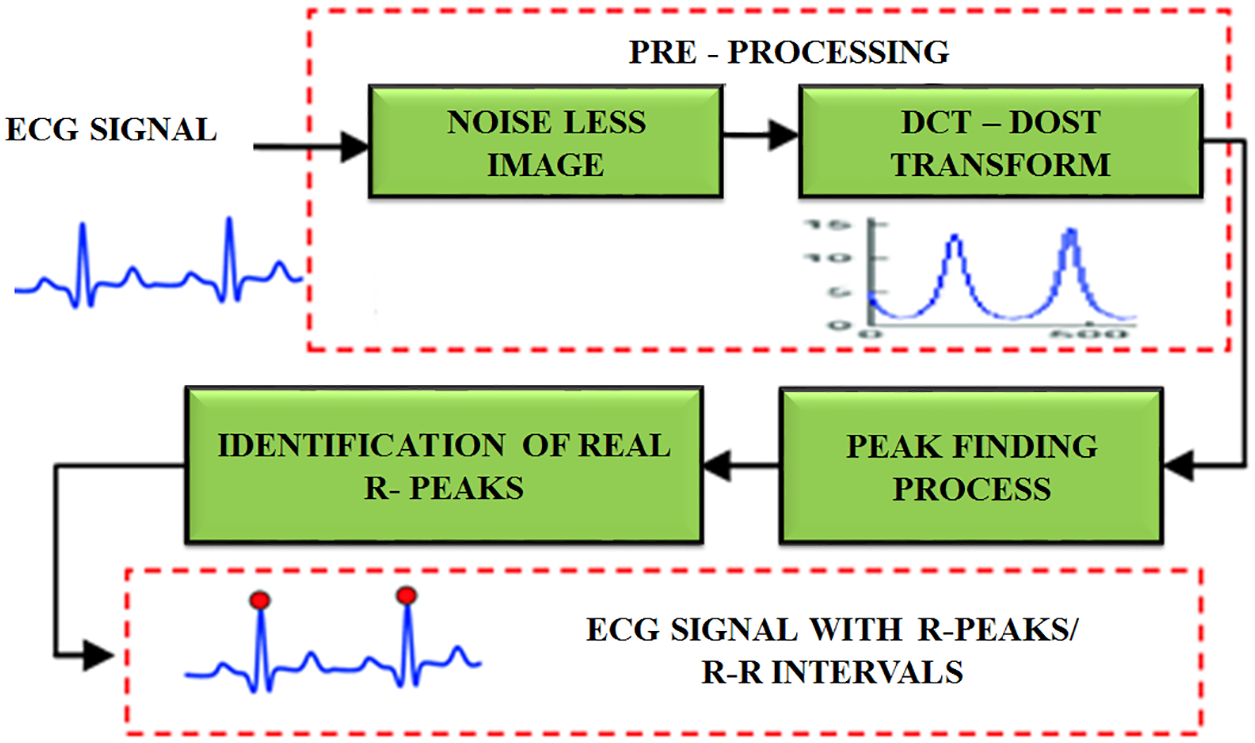
Figure 4: R peak detection using DCT-DOST
After the retrieval of noiseless image, the DCT-DOST approach is applied for performing peak identification. Initially, the sample frequency is 100 hertz. It is split into five intervals to accurately locate the R-R interval. It is real value transformation and it is positioned in space to minimize the time. It includes no negative frequency. Only positive frequencies are used and there is no symmetry coefficient. Hence, the higher frequencies have to be converted as frequency space during segmentation. Since the DCT-DOST contains no negative frequencies, the frequency width for any signal of length 2 N is,
N1 = 1 and
Ni = 2i−2 for 2 ≤ i ≤ N − 1
The DCT-DOST method is,
Y = dct (y);
z = 0
For cy in [1, 2, 3, …];
Y[z;z + (z − 1)]; idct (y[z;z + cz − 1]);
end
return y
The info ECG signal is propagated via N point DCT. This level produces the coefficients A1, A2, …, An. The acquired coefficients are split into sub bands [20, 21, 22, ……2n−1. For each sub band, β point inverse DCT operation is performed to ensure the β bandwidth.
In ECG signal, the feature extraction helps to figure out the amplitude and interval values of P-QRS-T segment in ECG. This work aims to determine the R-R interval and to extract the morphological highlights. By utilizing highlight extraction, 19 transient highlights including PQ, RR and PT interim and 3 morphological highlights are extricated from the ECG signal as portrayed in Fig. 5.
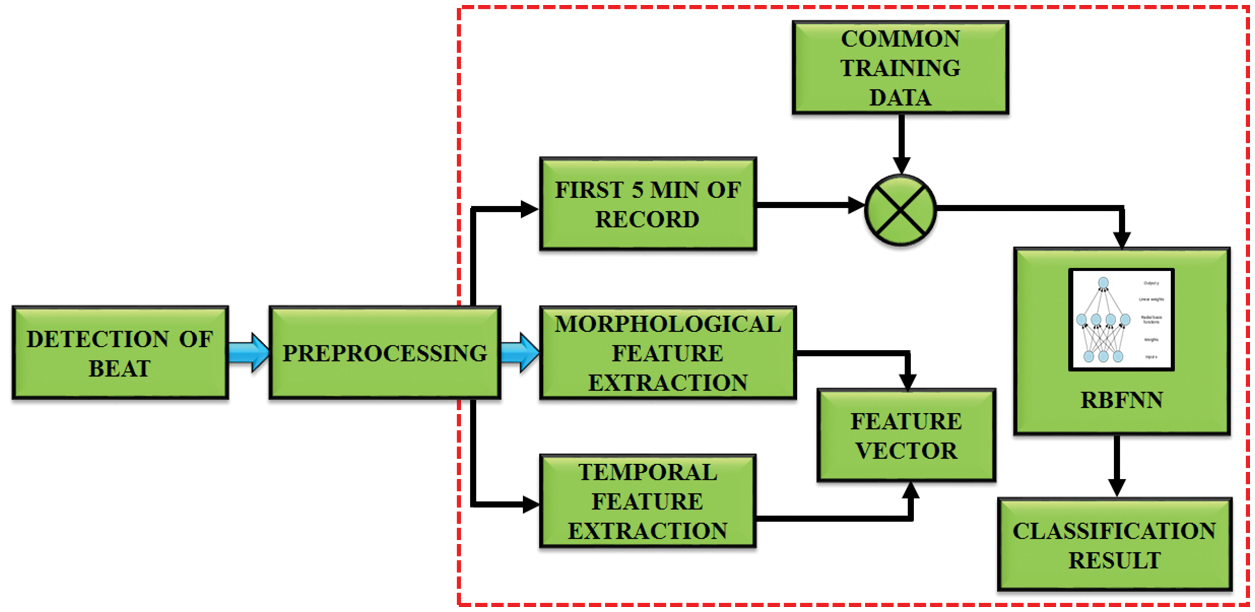
Figure 5: Working of feature extraction
The maximal and minimal points for each beat of the ECG signal are captured by using morphological highlights. The equation is,
The least value and most value point are figured out in the first and next R peaks. Then it is normalized by taking the esteems between 0 and 1.
Features, which describe the position of P, Q, R, S, T peak and QRS duration are computed by using the initial position of the Q-wave in the end of the S-wave. The QRS complex is computed, which is highly significant in the detection of abnormality.
2.4 Algorithm Used to Compute Duration of QRS Complex
Step 1: Read the signal
Step 2: Identify the duration of QRS complex waveform.
Step 3: Execute the wavelet analysis
Step 4: Calculate the coefficients by using wavelet decomposition.
Step 5: Identify R peak location in the signal by taking 60% of its value as threshold.
Step 6: Identify Q point by finding the smallest value ranging from Rloc-50 to Rloc-10.
Step 7: Identify S point by finding the smallest value ranging from Rloc+5 to Rloc+50.
Step 8: Identify T point by finding the highest value ranging from Rloc+25 to Rloc+100.
Step 9: Compute the duration of QRS complex by using the equation,
Step 10: Find X=QRS.
False negative Detection of QRS complex by using,
a) Premature ventricular complexes
b) Low amplitude.
False positive Detection by using,
a) Negative QRS complexes
b) Low SNR
This QRS algorithm is helpful to extract the R-R interval. It is performed by using the heart rate variability (HRV). It is an interval among two sequential R peaks and it is measured by,
where r(i) is the peak time of ith wave.
The next step is to reduce the number of features. It’s done with the aid of a genetic algorithm. It is utilized to improve the features for identifying ECG signals. The structure of this algorithm is signified in Fig. 6. The next generation chooses the best conditions and ignores the remaining. It starts creating a new population at each stage using Selection, Crossover and Mutation.
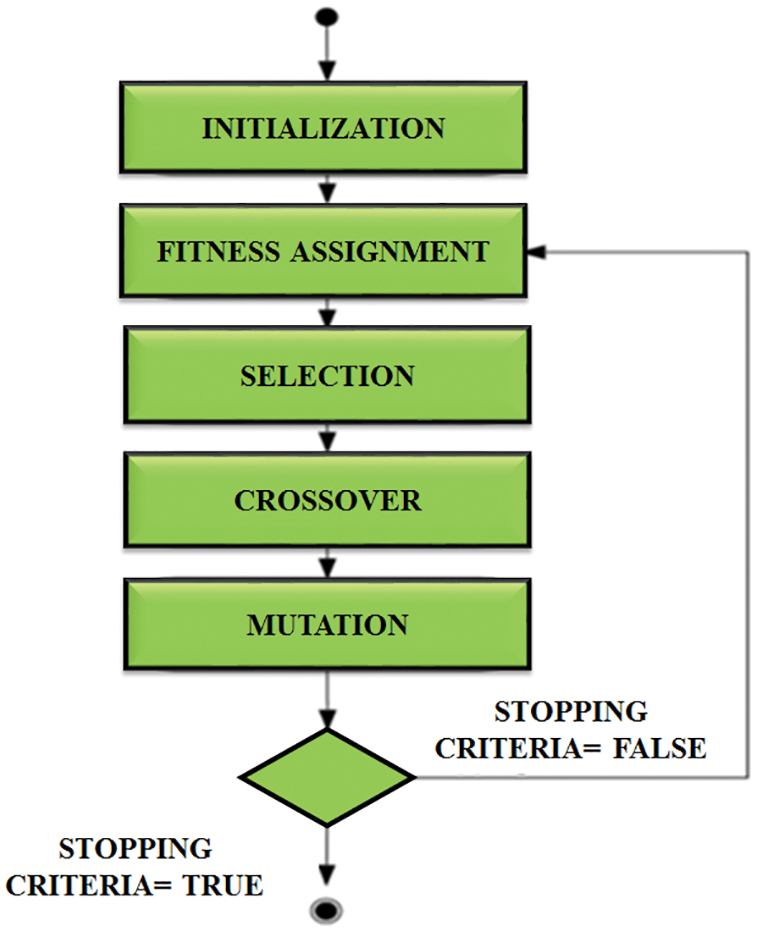
Figure 6: Structure of genetic algorithm
And finally it applies a fitness function, which is computed by,
N stands for the number of outputs, t stands for the goal output, and out stands for the actual output. Positive and negative values may be present in the fitness function. As a result, we can’t use fitness benefit directly. The selection operator is used to identify the best features associated with the highest fitness value and passes them over to the next generation. The crossover operator swaps the selected individuals chromosomes to produce offspring chromosomes.
The final operator is then used to notify the bits in the chromosome. The probability that the chromosome in the nth position will be estimated is calculated using,
The GA algorithm aids in the optimization of neural network results, and it works well to achieve high precision, sensitivity, and specificity, as well as providing output with better classification. The classification is performed by RBFNN.
2.5 Radial Basis Function Neural Network
Fig. 7 represents the RBFNN function, which is used in time series prediction, classification and approximation of function. It can be used for any type of model, including linear and nonlinear, as well as any network. It includes three layers like input, hidden and output layers. The input to the hidden layer is converted nonlinearly by the hidden layer. The hidden layer’s activation is combined in a linear way by the output layer. The input layer is represented as an x ∈ Rn vector of real numbers. The network’s result is Rn → R, which is given by
where the neurons present in the hidden layer is represented as N, Ci is the centre vector and ai is the neuron’s weight. The parameters ai, ci and βi aid to optimize the fitness between φ and the signal.
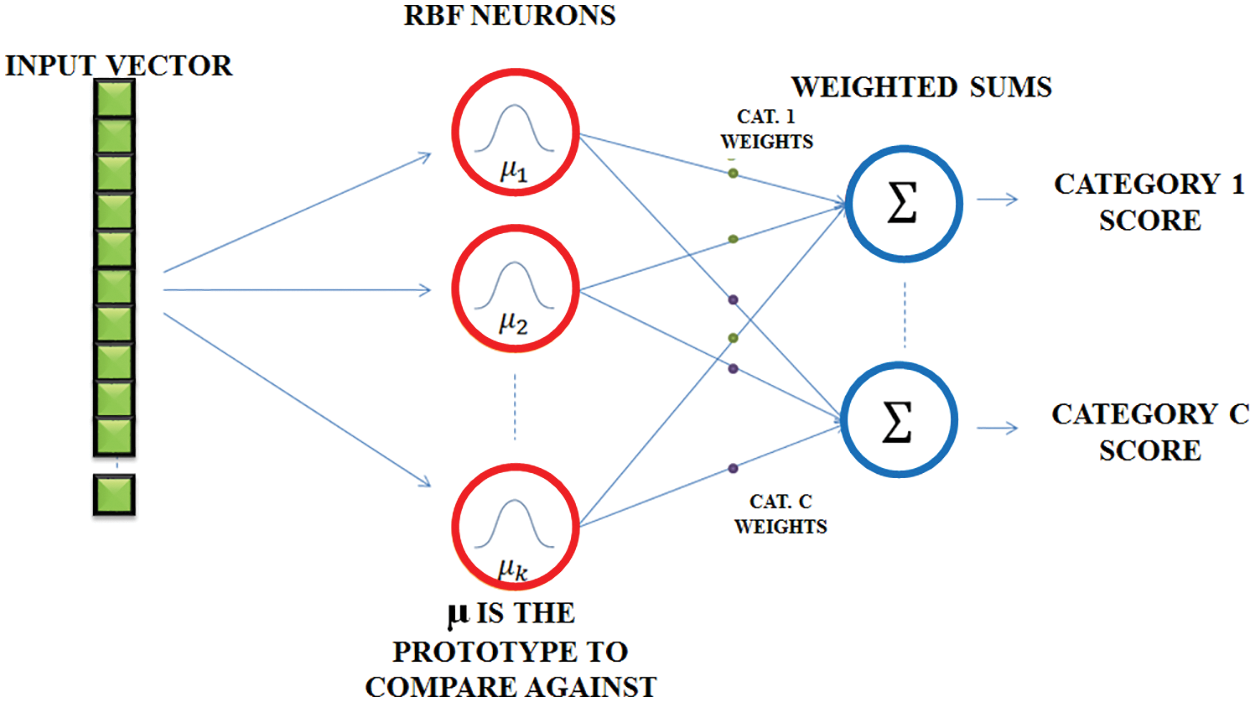
Figure 7: RBFNN network
A typical RBF of the scalar input vector which is a first layer is,
Normalized and de-normalized forms of the generated input are also possible. It is discovered to be in non-normalized state. The equation is,
where,
This input layer expression is expressed as,
where,
In the de-normalized form
In the normalized form
The probability density function among the input and the output layer is estimated,
The output y given an input x as
where, the conditional prospect of y specified x is signified as P (y|x).
For performing classification, the trained and test datasets are obtained from MIT-BIH database. Nearly 80% of data are chosen for training and 20% is considered for testing. The training dataset is represented as
The output of the training dataset is Yi and time prediction is done by predicting the successive value and features of a sequence,
The entire work is implemented in MATLAB to analyze the ECG signals. The MIT-BIH dataset is used to validate. The RBFNN classifier is trained by using the aforementioned dataset and the performance is examined for the sample ECG signal. The expected outcome for the ECG signals at each stages of the proposed method is exhibited for detailed analysis. The ECG specimen image taken is elaborated for 50,000 samples. A sample ECG signal is shown in Fig. 8.
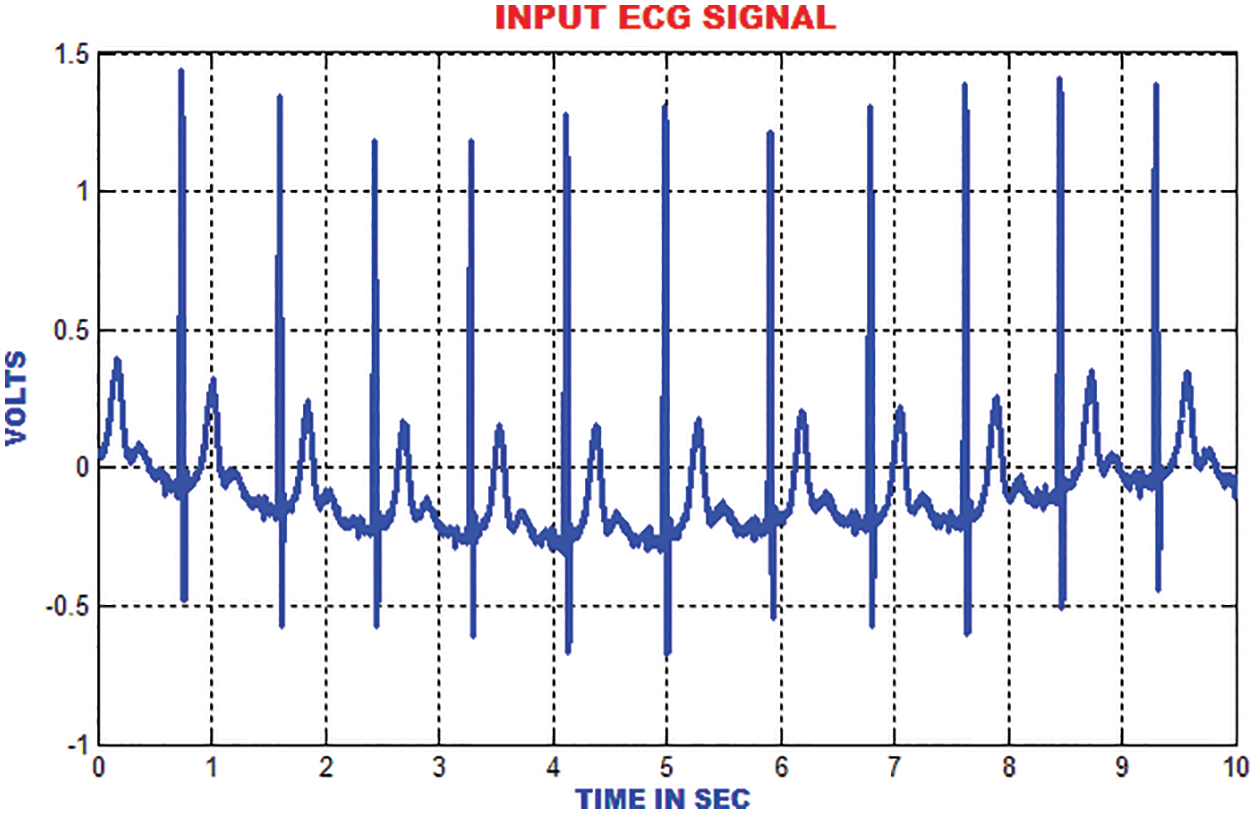
Figure 8: Input ECG signal
The electromyogram noise, Gaussian noise and low frequency noises are excluded by the Gabor filter. In addition, the texture features of ECG signal are analysed. In comparison with the input signal, the output of Gabor is more precise and accurate as depicted in Fig. 9.
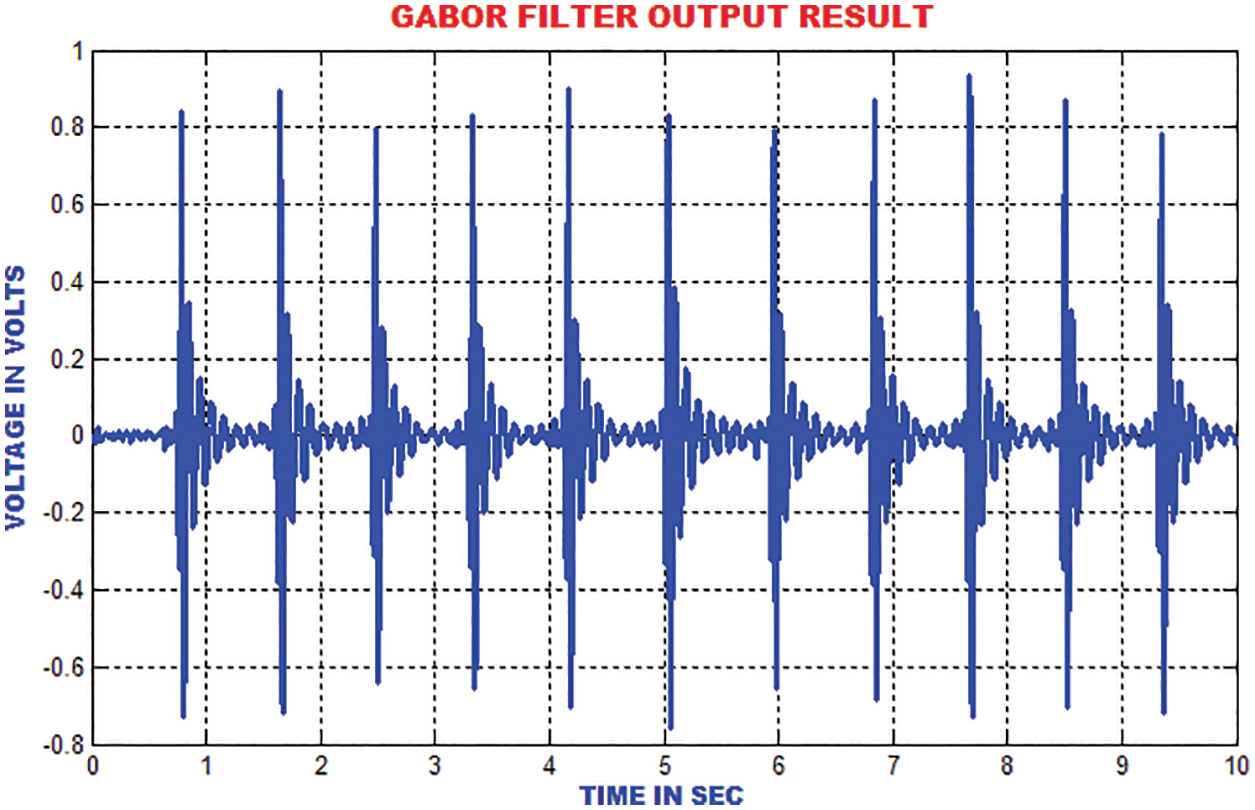
Figure 9: Gabor filter output
The distance between the R-peak values is estimated by finding the absolute values. When the heart’s electrical function is assumed as a vector, it is easy to analyze the trajectory of the vectors peak. The signal ECG is considered as projection of the heart’s electrical vector as depicted in Fig. 10.
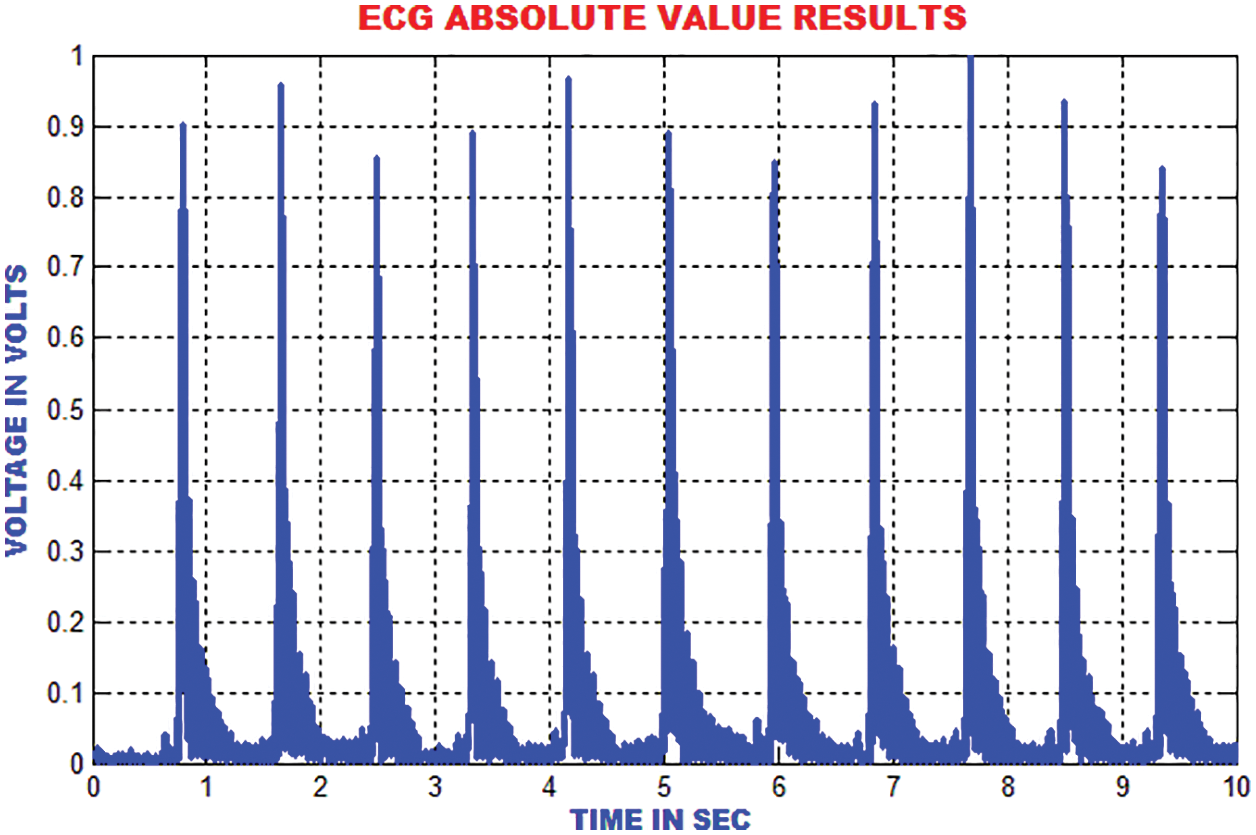
Figure 10: Estimation of absolute value in ECG signal
The energies in the ECG signal is gathered by using DCT-DOST to represent the most important coefficient at low frequency. The features that are extracted using the DCT-DOST approach indicate the time-recurrence attributes of ECG signal. From Fig. 11, it is noted that the peak values in QRS polarity and the unexpected variations in QRS amplitude are detected.
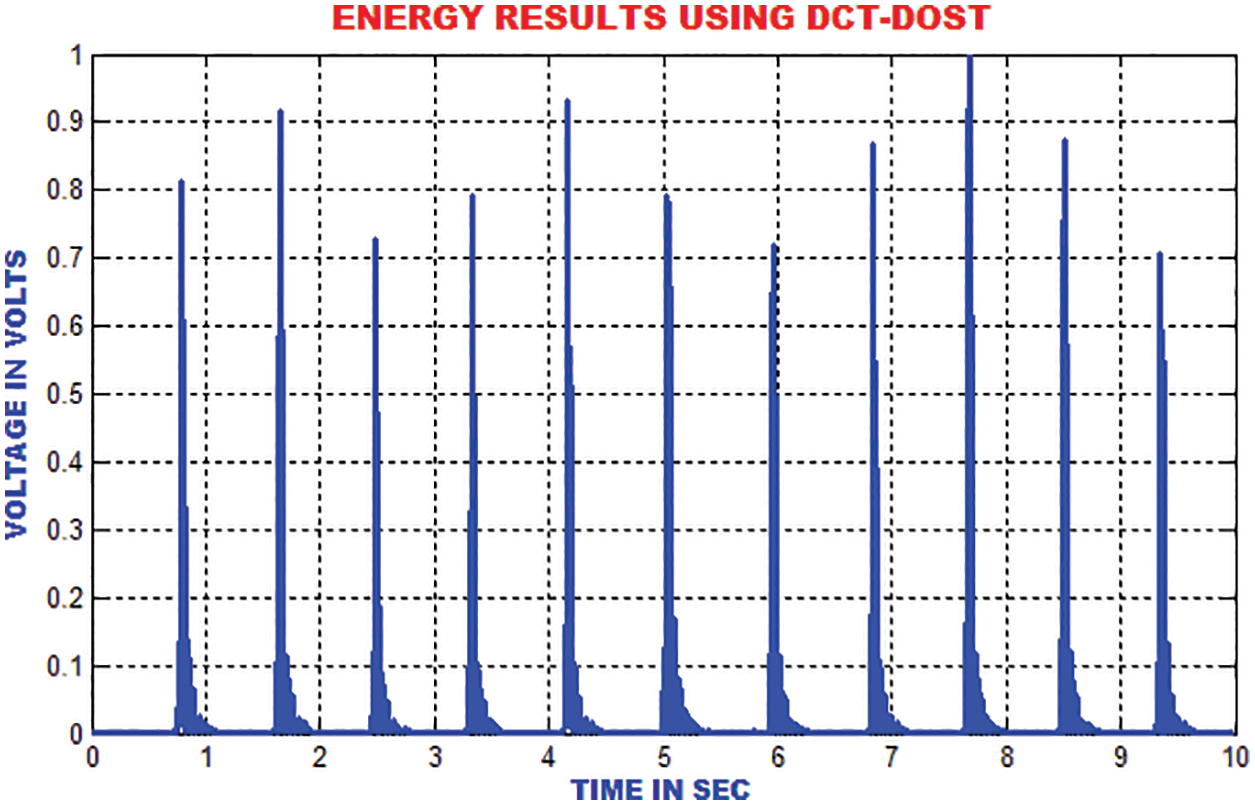
Figure 11: Output of DCT-DOST approach
The traditional filtering minimizes the signal noise by delaying the QRS components. The zero phase filtering minimizes phase distortion and provides a compromise among filtering and data retention. The output of the zero phase filter is depicted in Fig. 12.
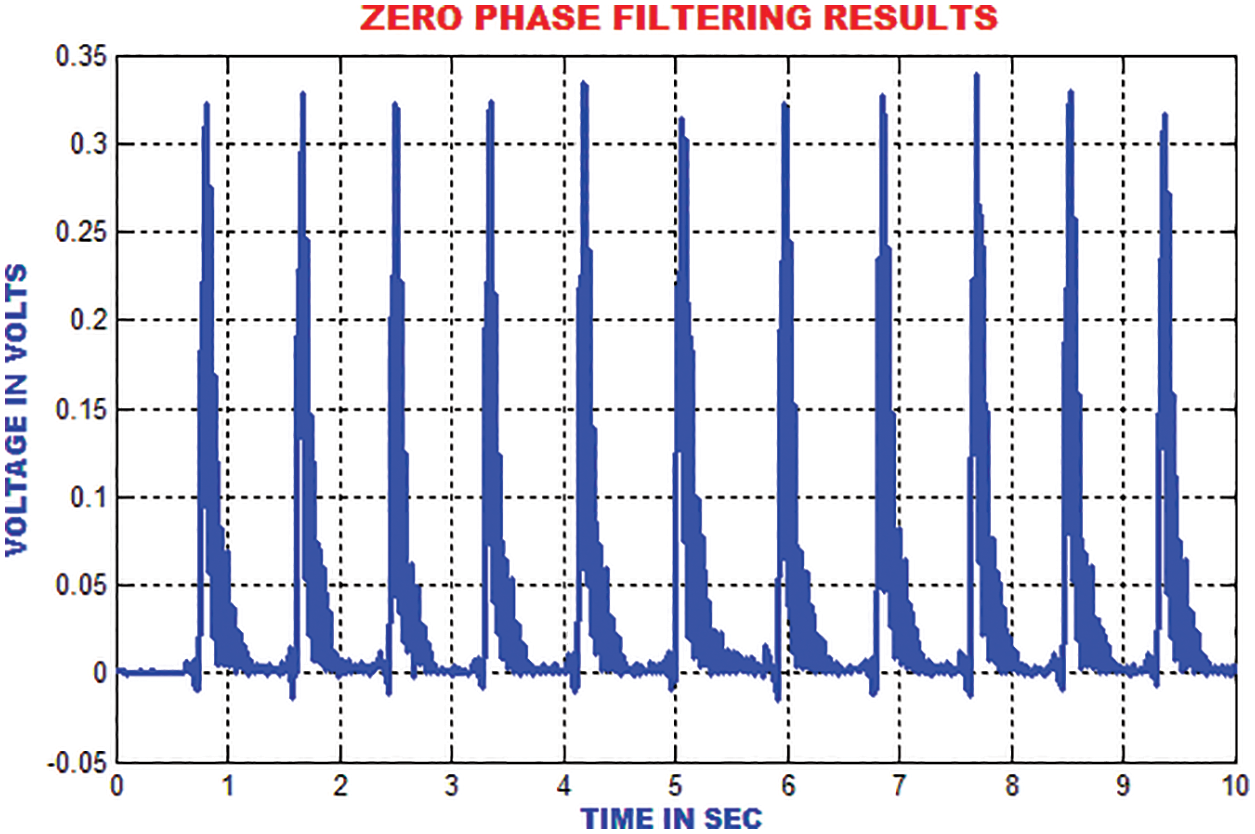
Figure 12: Output of zero phase filter
The ECG portion is composed of 112 patterns before the occurrence of R top and 144 patterns after the occurrence of R top. An aggregate of 256 patterns is chosen to find the length of every occasion relating to window size. To consolidate the majority of data with respect to each heart occasion, the length of each event is chosen. These unbalanced time–recurrence coefficients have to be processed for the ECG signal to represent the morphological qualities. The segmentation result of DCT-DOST is shown in Fig. 13.
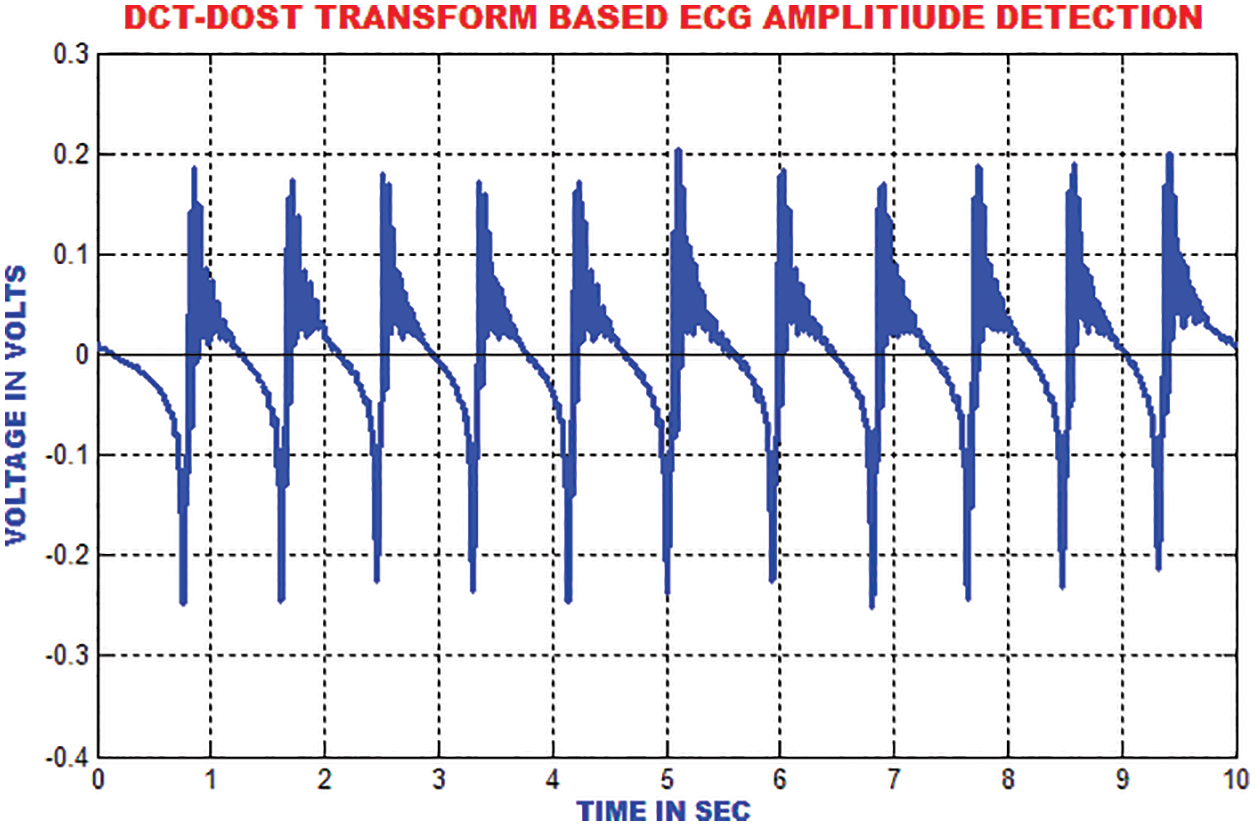
Figure 13: Segmented output of sample ECG signal
The moving average filter is utilized to remove high frequency noises from the ECG signal by computing the running mean on the predetermined window length. The R-top in the ECG signal is smoothed around 33% of its unique height. The output of this filter is represented in Fig. 14.
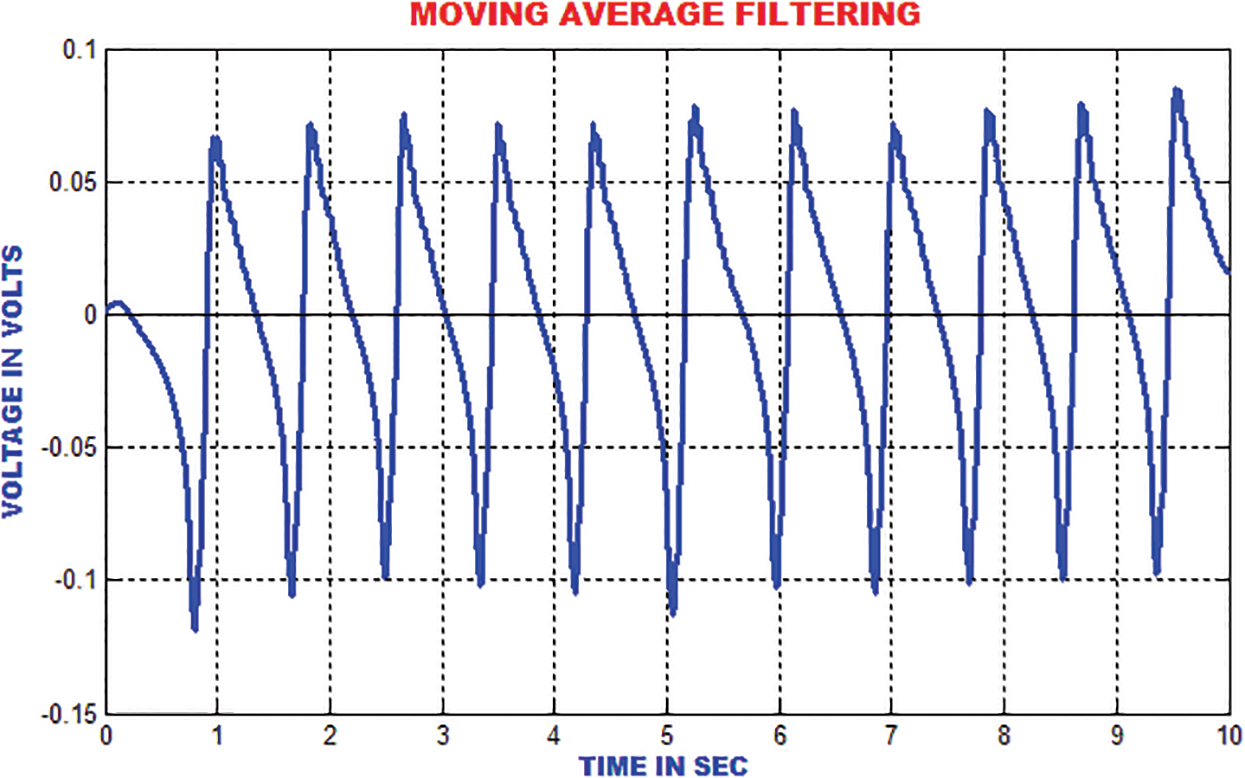
Figure 14: Output of moving average filter
The QRS wave of the ECG is detected by using zero crossing point detection approach. The dominant and low frequency contents in the ECG are roughly estimated as represented in Fig. 15.
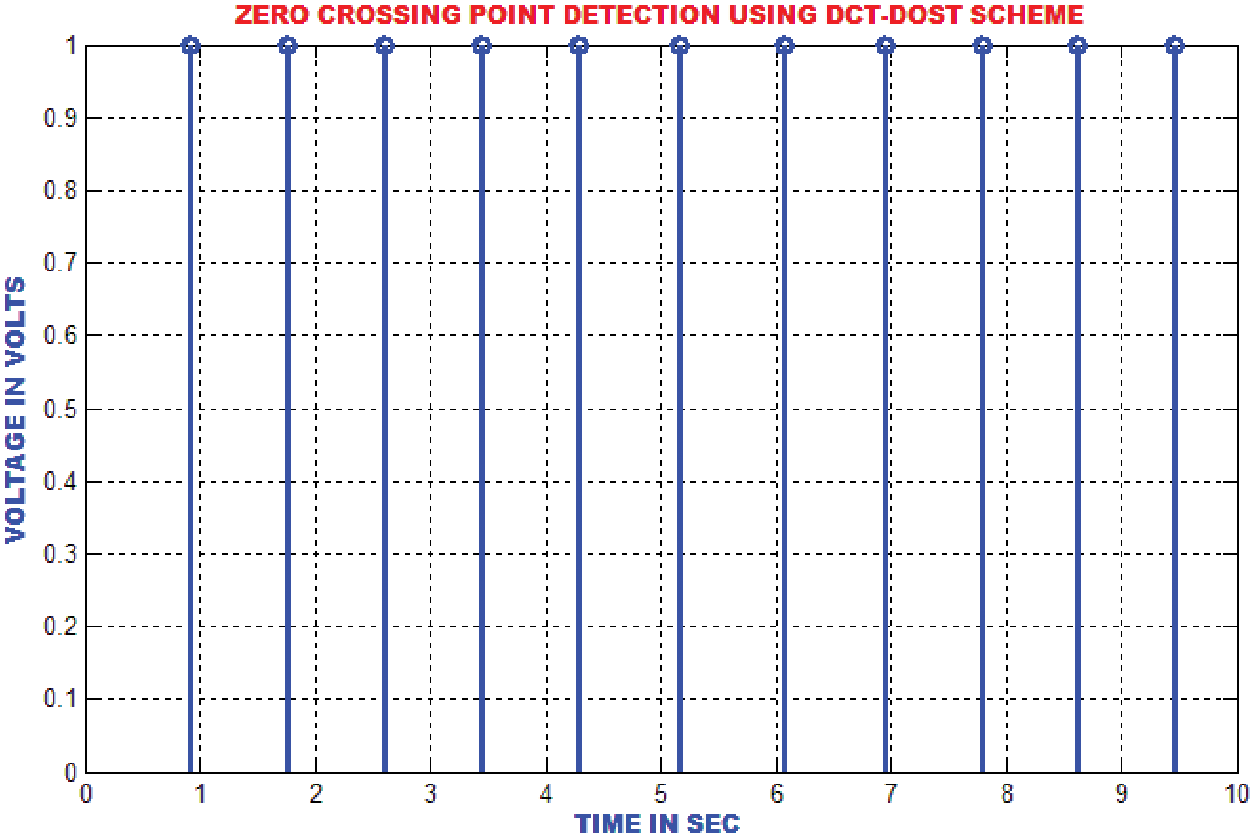
Figure 15: Zero crossing detector output
The R top discovery in ECG is used to analyze heart anomalies and pulse fluctuation. The primary request separation of the sign is utilized to store the incline data of the genuine pinnacles. Fig. 16 portrays that the proposed strategy proficiently recognizes the R tops under different conditions like pattern float, uproarious sign, tall T waves or a delayed waves.
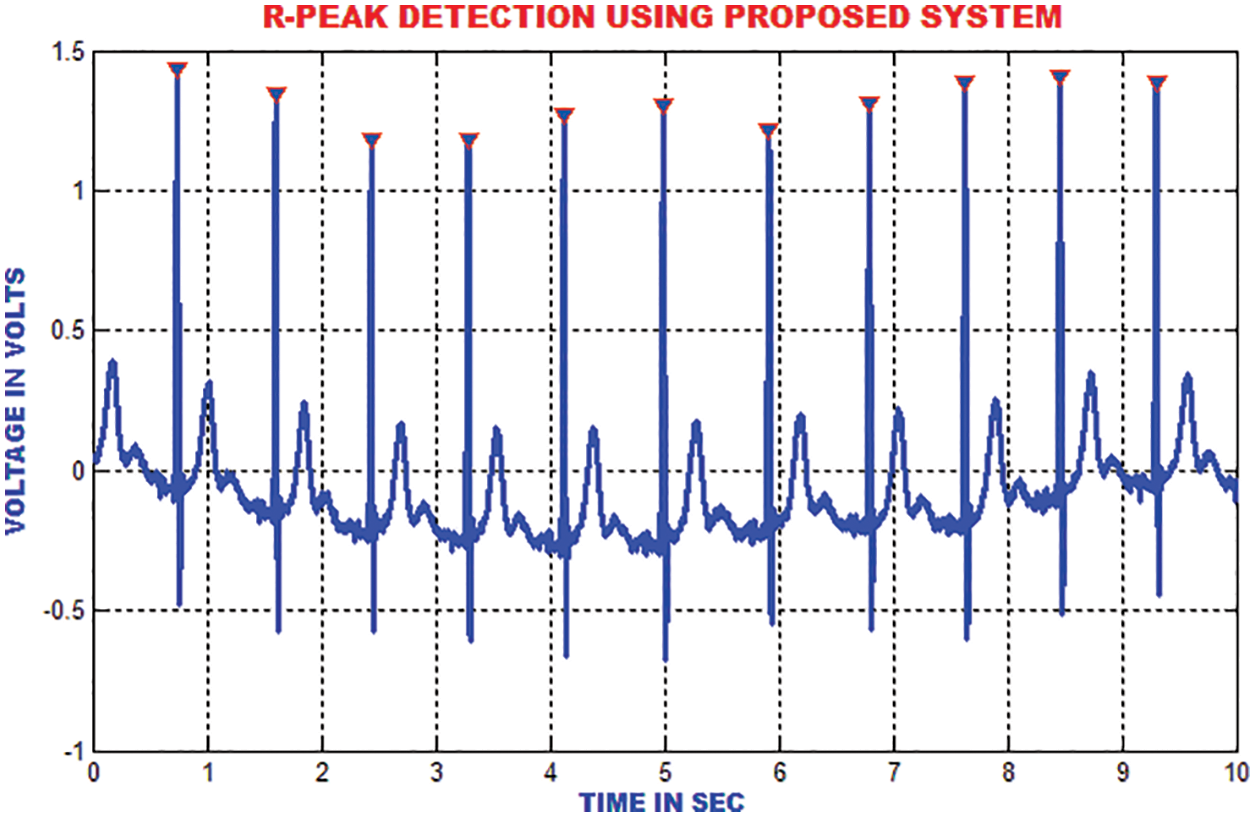
Figure 16: R-peak detection
The enhanced performances is achieved with the slope index than the high recurrence index, which is depicted in Fig. 17.
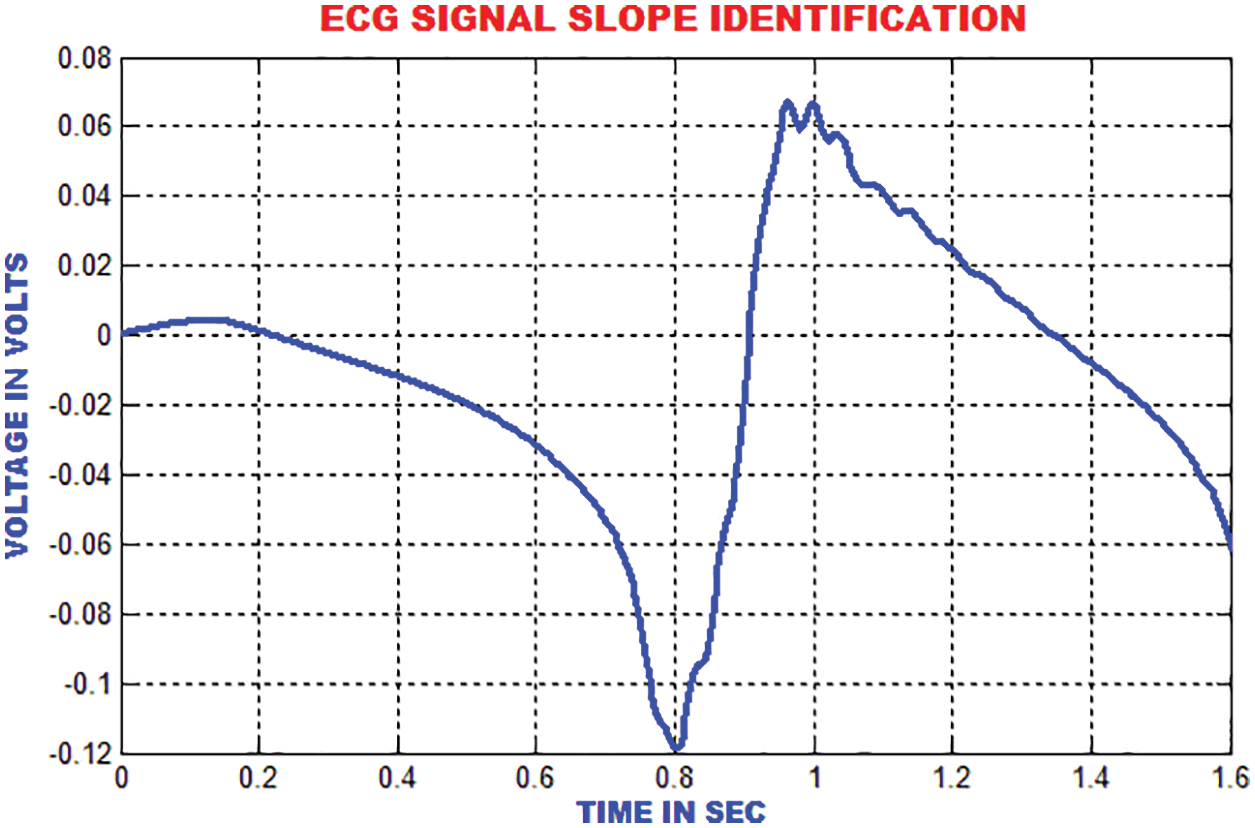
Figure 17: Slope identification of ECG
The QRS detection ensures the efficient extraction of beat interval and the abnormalities in the heart function. The improvement in the QRS sections are executed by the proposed technique to eliminate the pattern meandering. In this paper, the QRS fiducial focuses are detected to perceive the R point using by QRS complex. Fig. 18 clarifies that the heart function classification is accomplished.
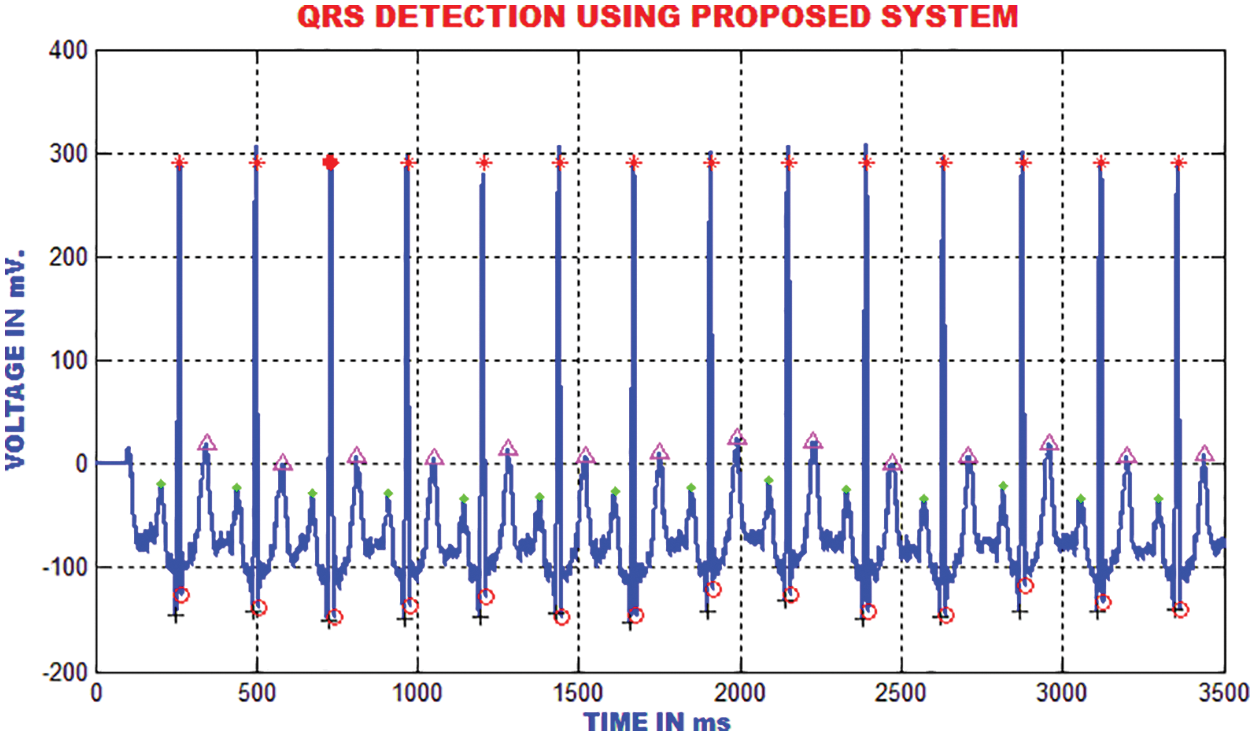
Figure 18: Detection of QRS using the proposed method
The RR-interim is resolved to obtain the dynamic qualities of the ECG signal. The mean RR interim features are determined by averaging the RR interims of the previous 3-minimum RR interval in a specific occasion, which is highlighted in Fig. 19.
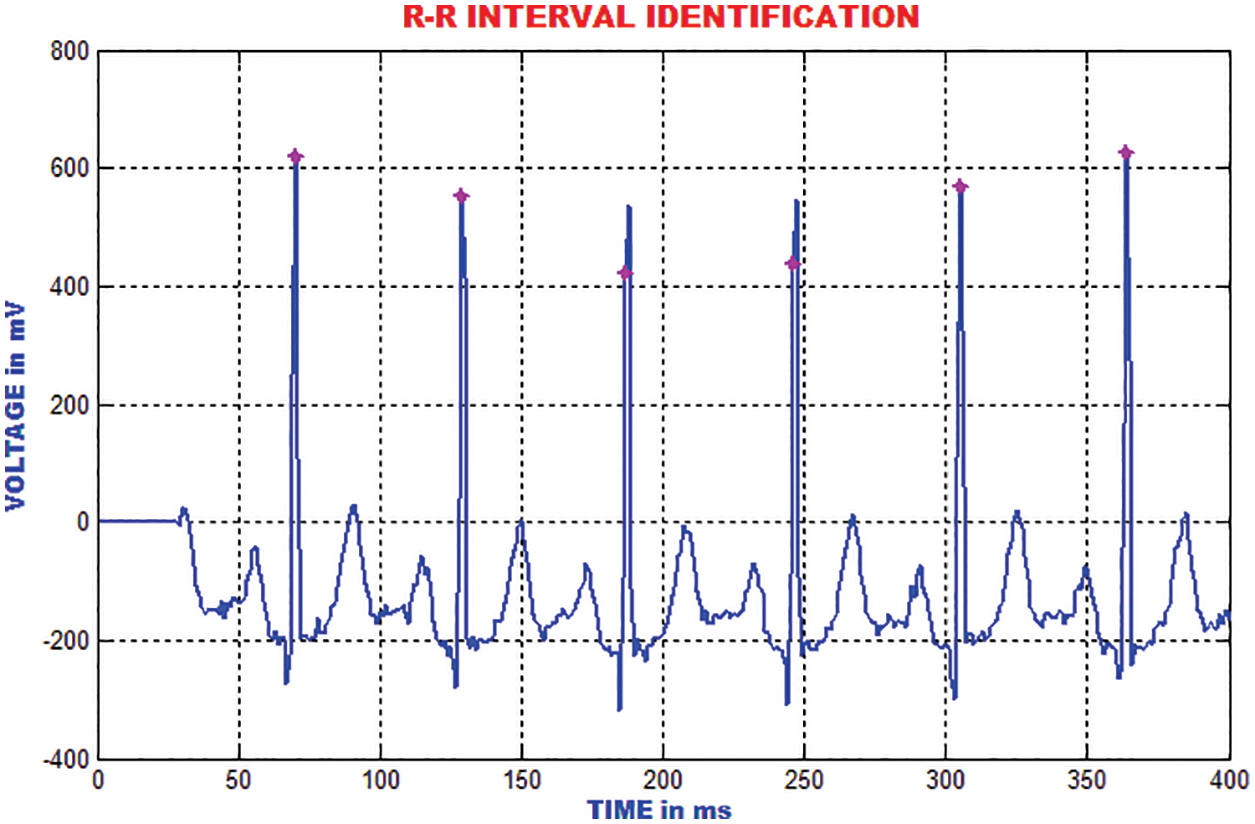
Figure 19: Identification of RR interval
Similarly, the neighborhood RR features are inferred by averaging all the RR-interims of the previous episodes of a specific occasion. The neighborhood and mean highlights indicate the mean qualities. These 4 highlights are connected to the morphological list of ECG signal.
The performance of this methodology is analogized with the traditional methods like CNN(Convolutional Neural Network) and SVM (Support Vector Machine). With a maximum accuracy of 98.5%, the accuracy of this system outperforms other approaches, which is portrayed in Fig. 20.
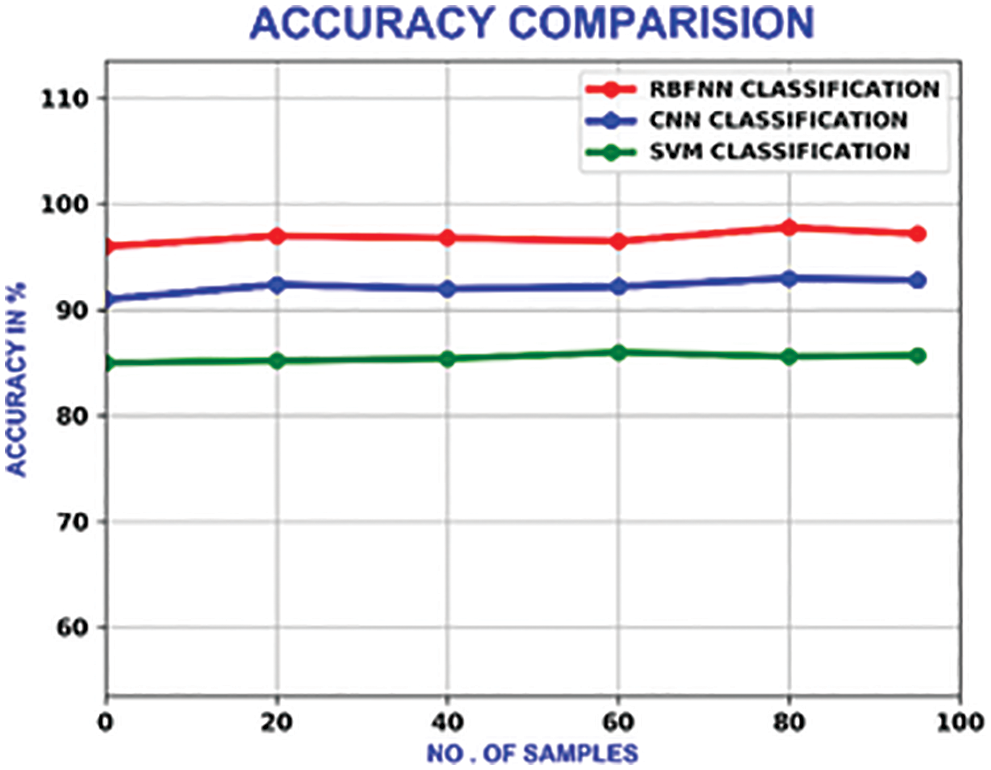
Figure 20: Accuracy comparison of different methods
The sensitivity shows the true positive value of the classification. It’s calculated as the percentage of positives, which are correctly categorised. With a maximum sensitivity of 98.3%, it outperforms the CNN and SVM, which own the maximum sensitivity of 92% and 86% respectively. Fig. 21 illustrates the sensitivity relation.
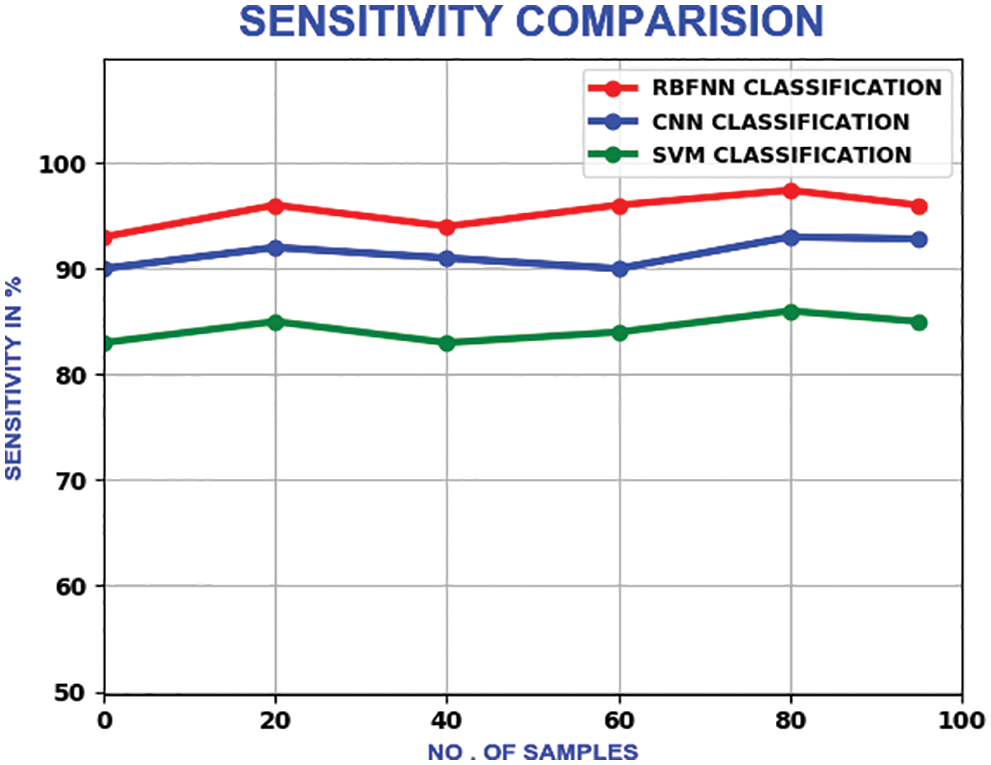
Figure 21: Sensitivity comparison
The proposed method’s specificity values change in a zig-zag pattern as the number of samples is increased. With a maximum specificity of 99%, the proposed method delivers better performance than CNN and SVM, which have the maximum of 93% and 95.6% respectively. The compariron outcome is represented in Fig. 22.
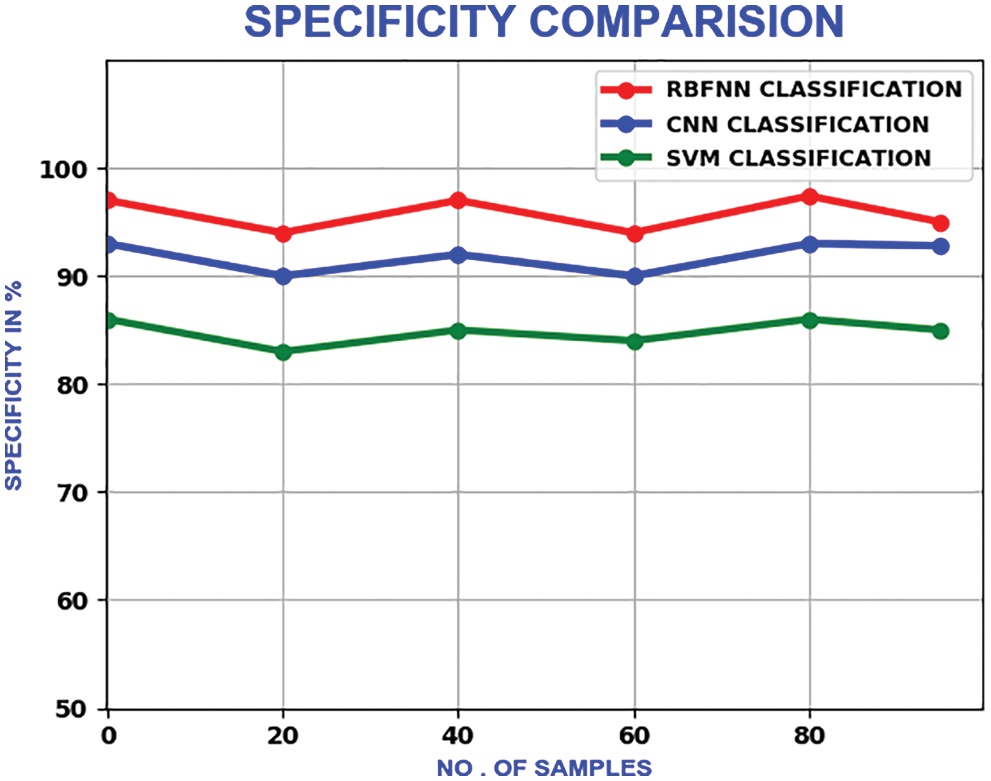
Figure 22: Comparison of specificity
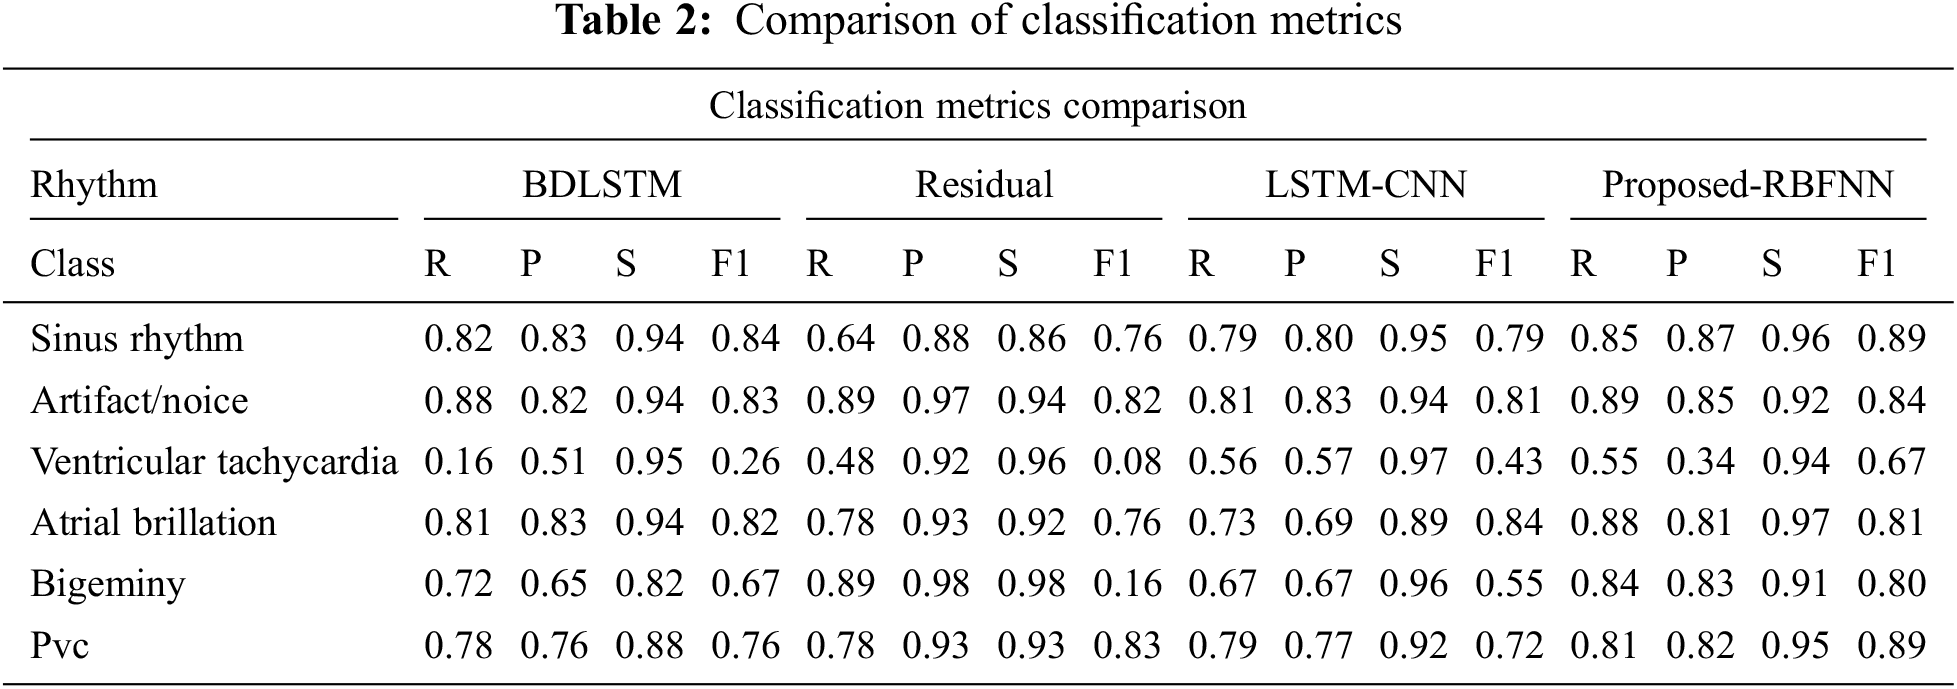
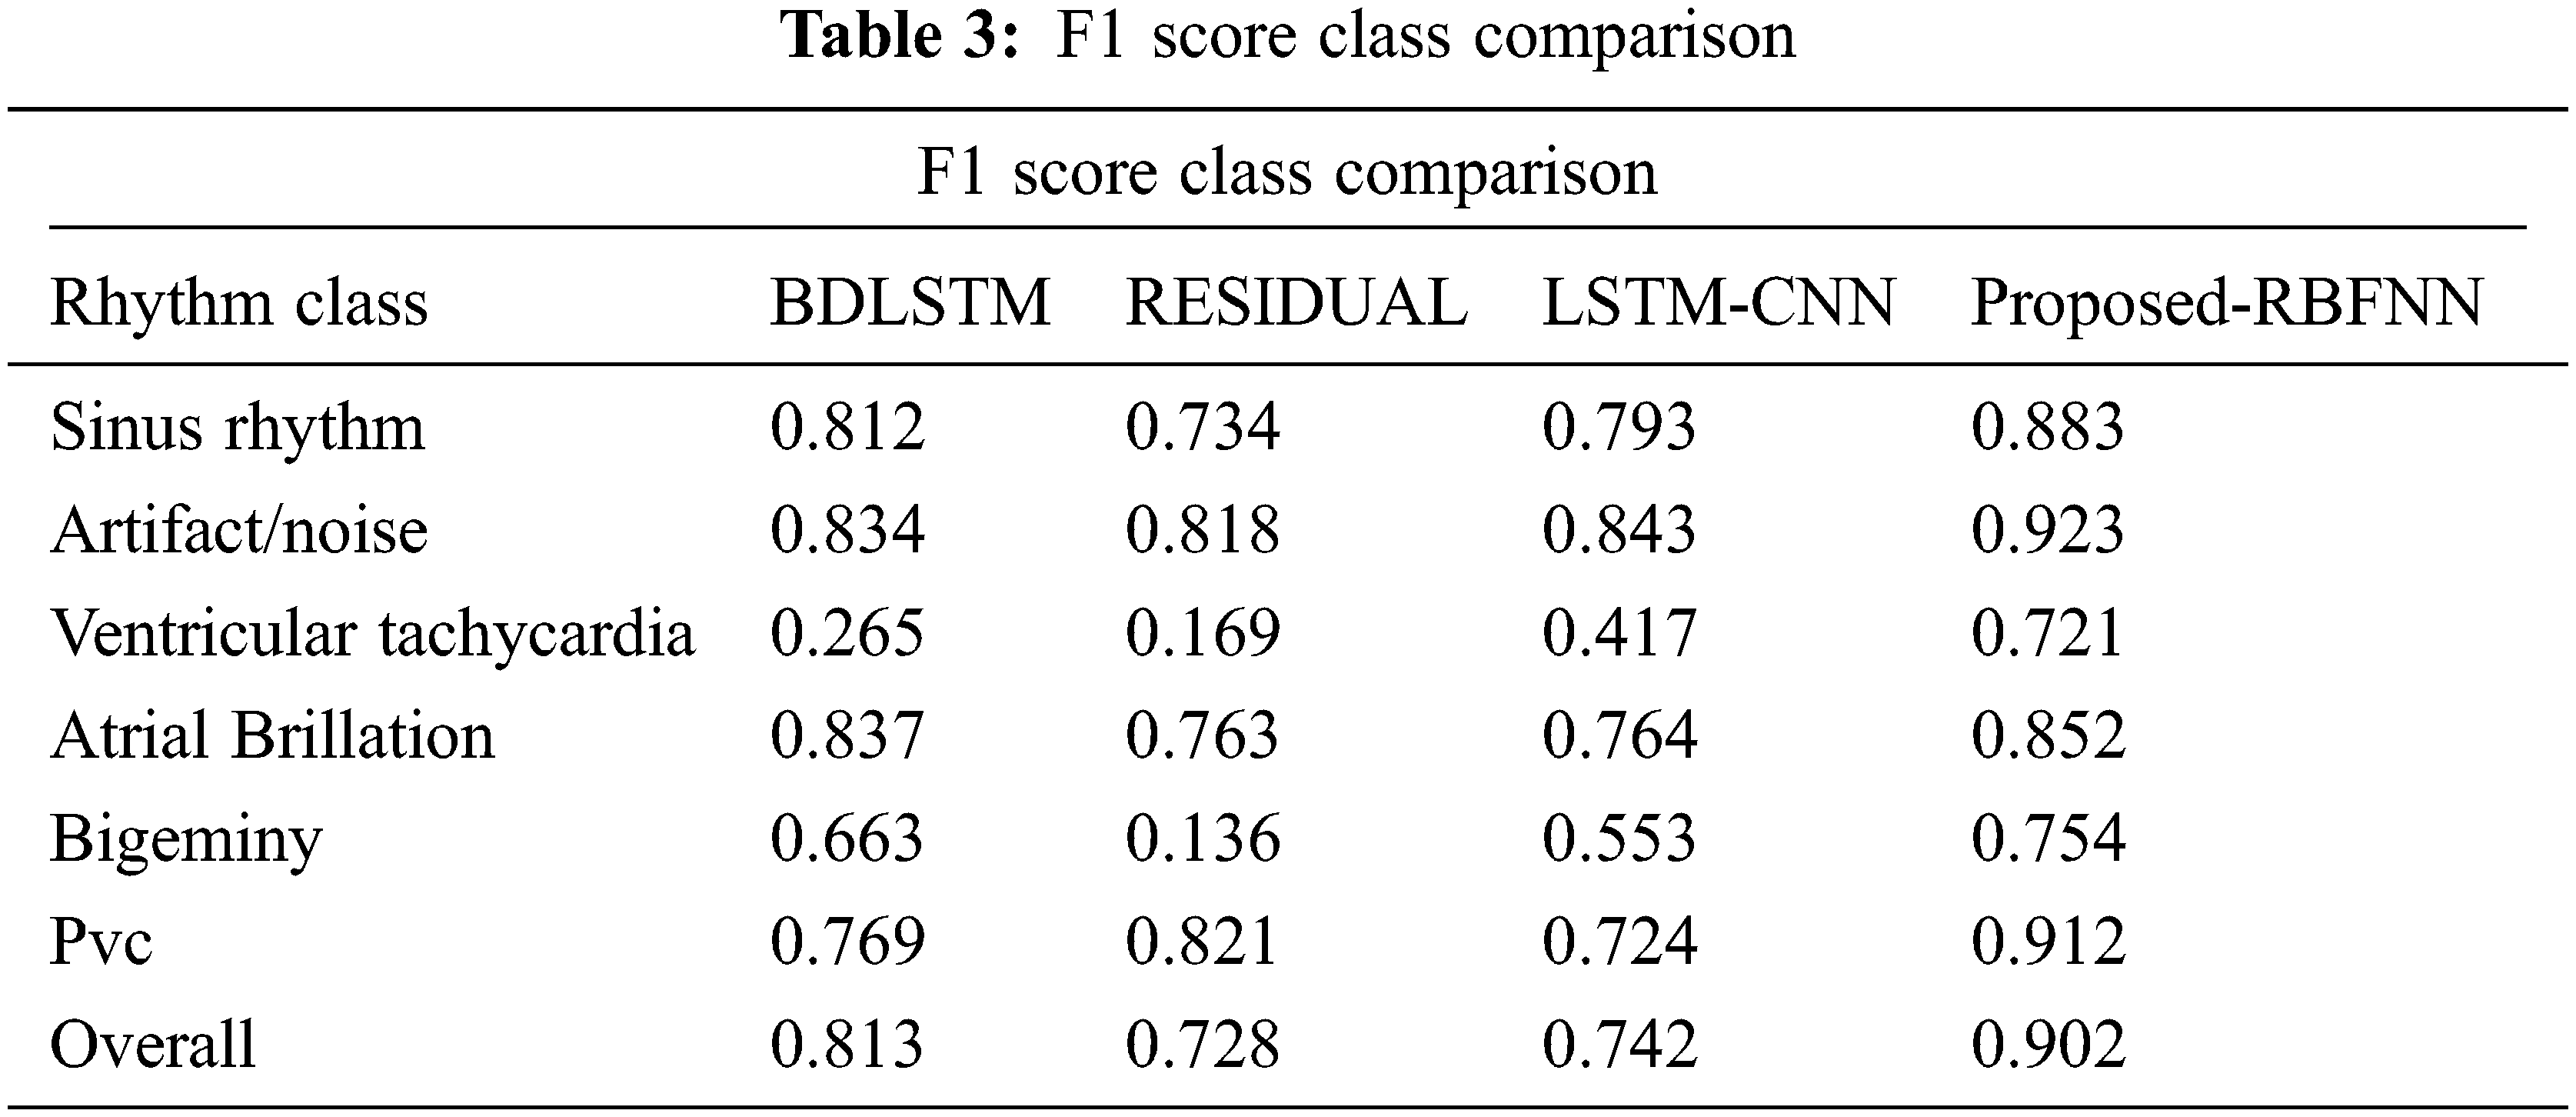
The measure of various contents in the ECG signal like class, sinus rhythm, artifact, ventricular tachycardia, atrial brillation, bigeminy and PVC (Premature Ventricular Contractions) are computed in terms of R, P, S and F1. From Tabs. 1 and 2, it is clear that the estimation of the proposed RBFNN is higher than the conventional methods.
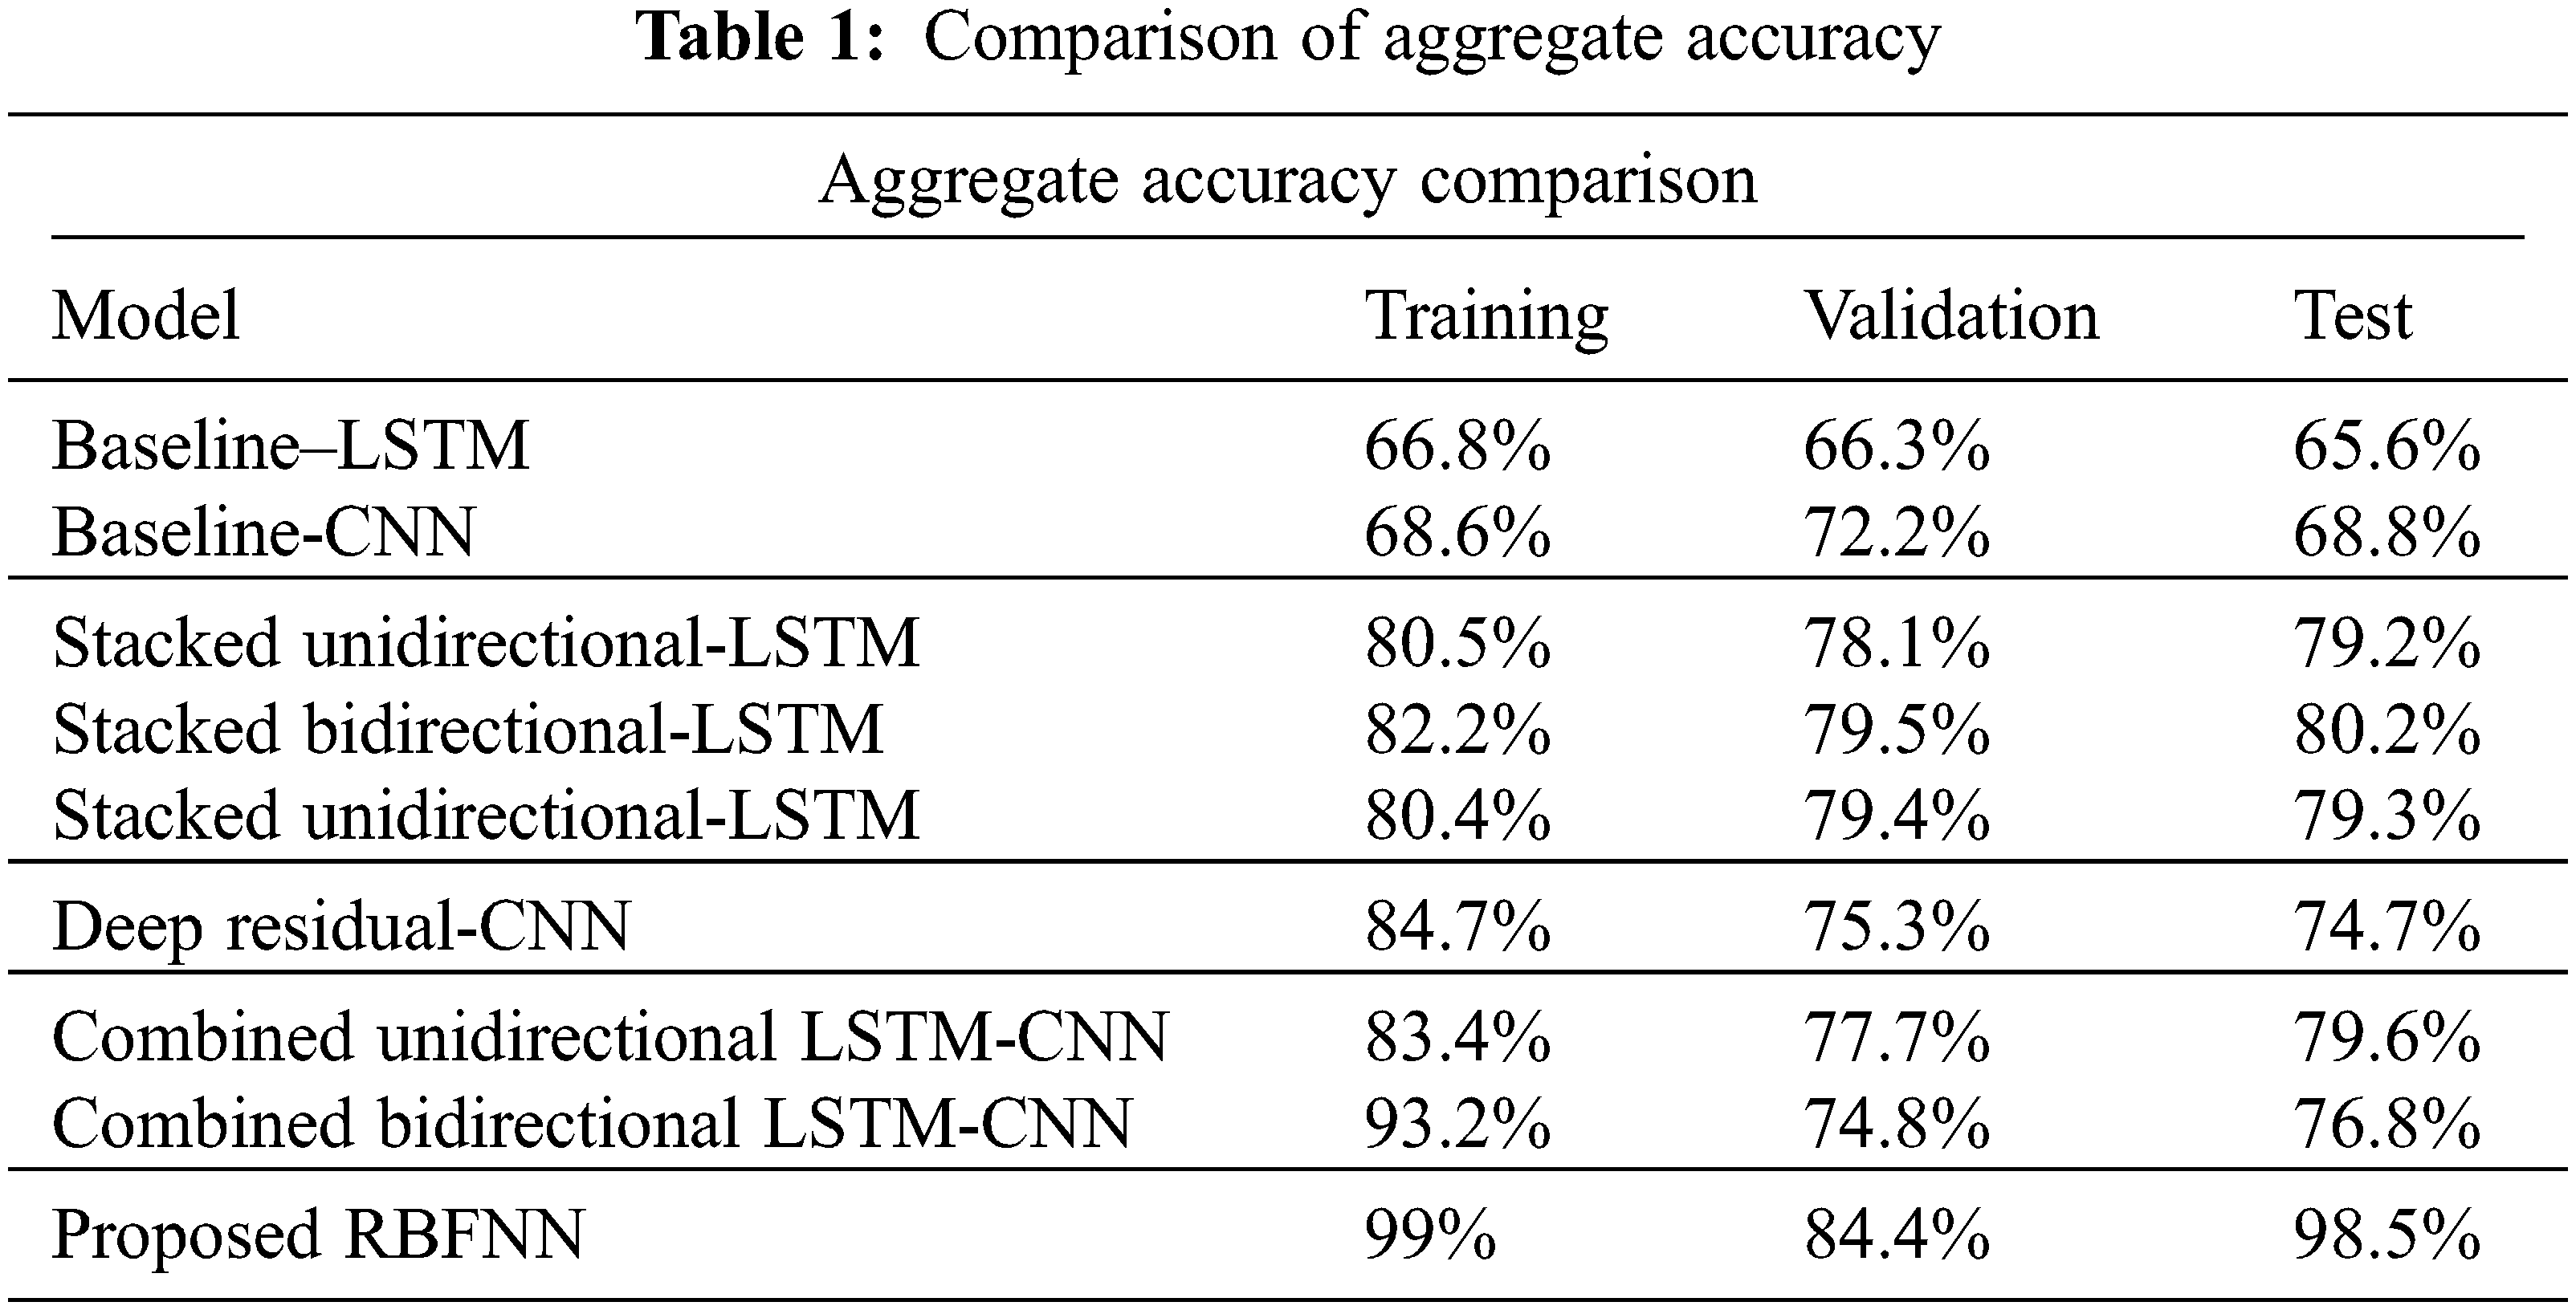
The training, validation and testing efficiencies of the proposed approach are compared with the conventional methods. The training efficiency of this present method is higher than the other methods.
From Tab. 3, the overall f1 score of the proposed method is 90.2%, which is higher than the existing methods.
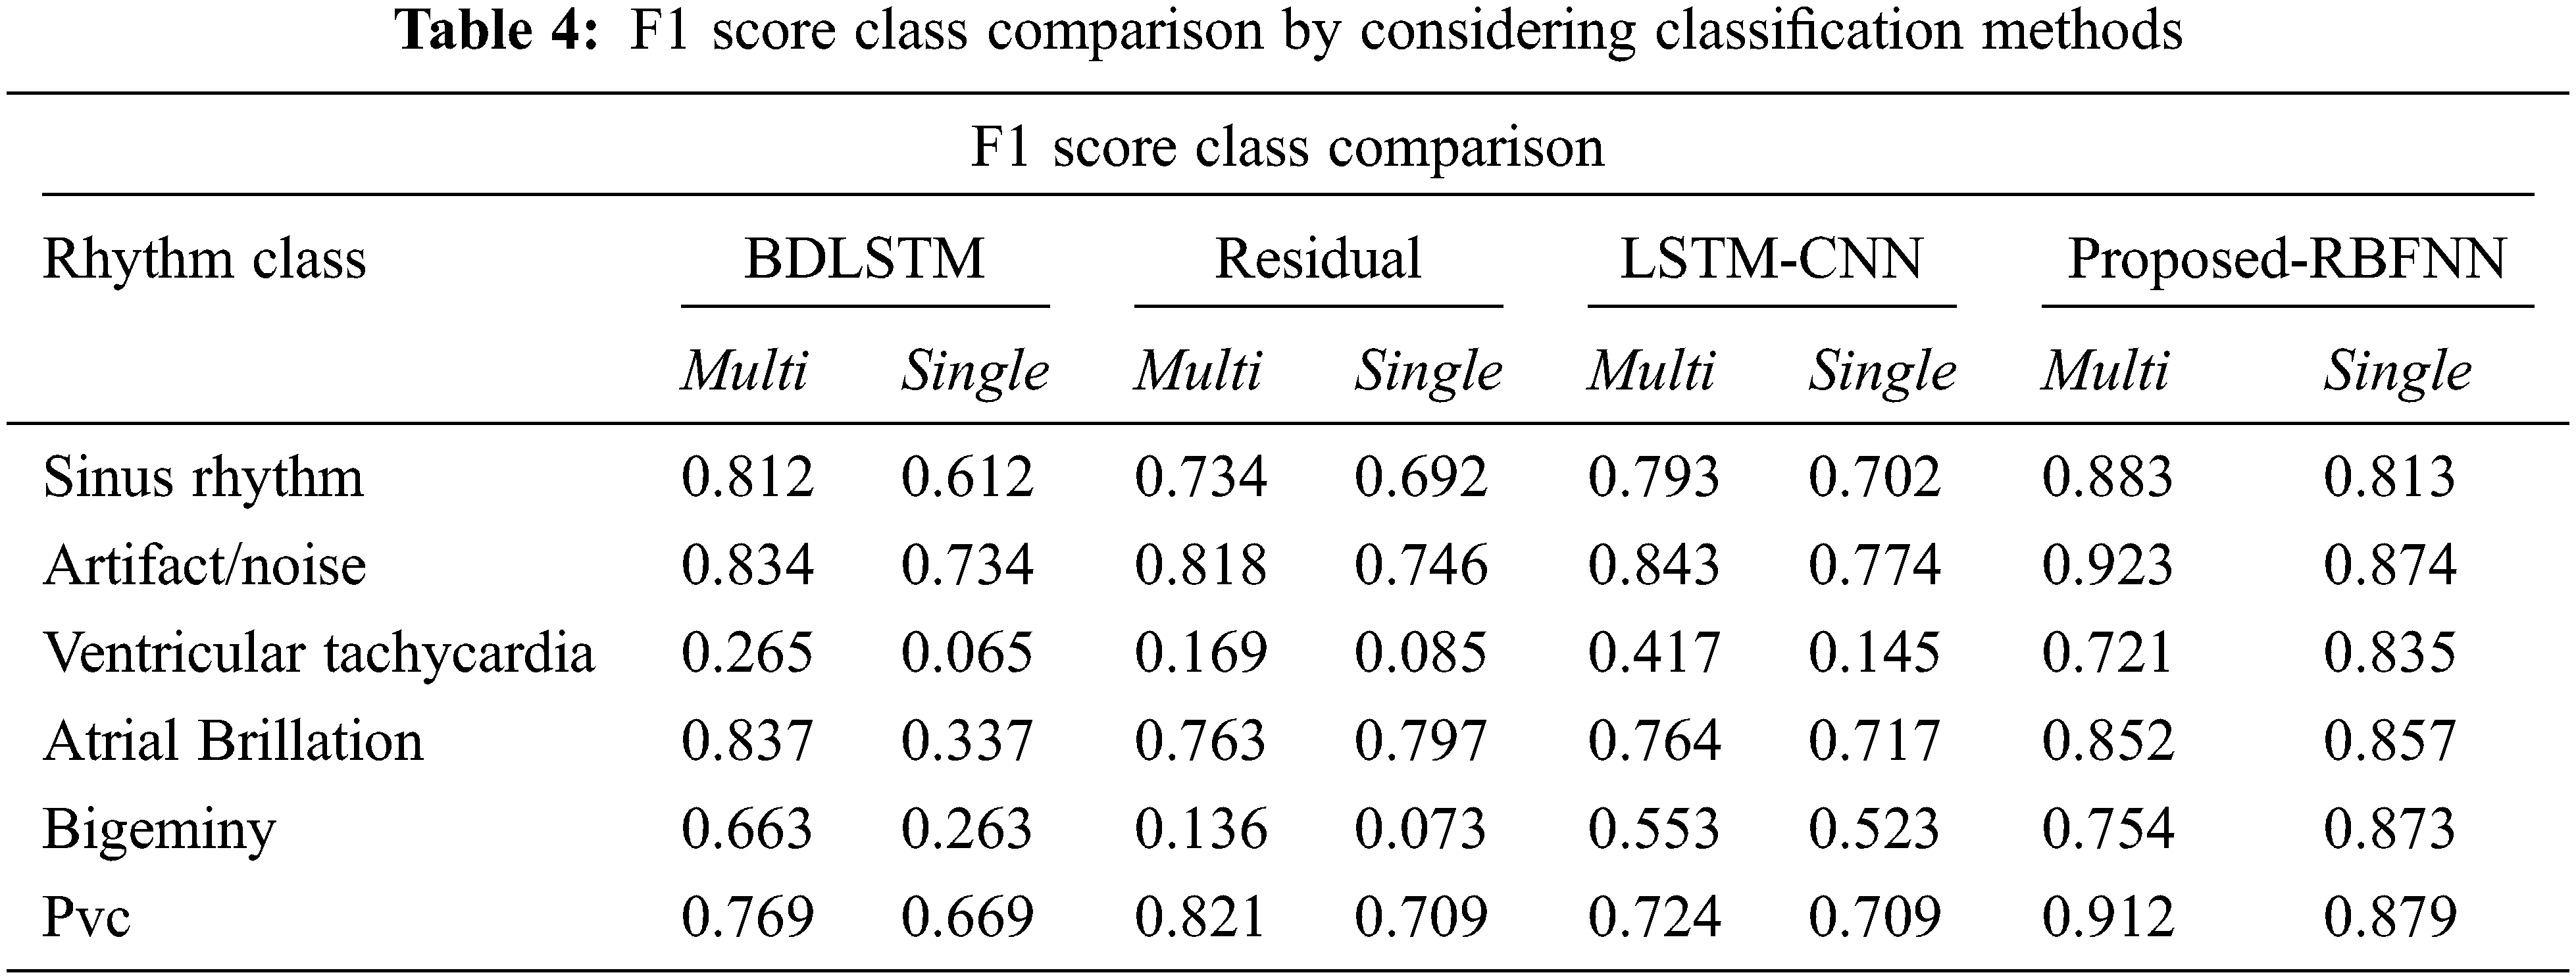
By considering the classification methods, the performance is improved as shown in Tab. 4.
The proposed work enhances the diagnosis accuracy by eliminating the redundant and noise highlights. The specified algorithm provides sensitivity and accuracy above 98.5%. These algorithms are computationally facile and aids in the processing of massive set of database. By this work, the artifacts are detected with extreme accuracy. It gives better acknowledgement performance than the other existing frameworks.
Funding Statement: The authors received no specific funding for this study.
Conflicts of Interest: The authors declare that they have no conflicts of interest to report regarding the present study.
1. Y. Miao, Y. Tian, L. Peng, M. S. Hossain and G. Muhammad, “Research and implementation of ECG-based biological recognition parallelization,” IEEE Access, vol. 18, no. 3, pp. 161–164, 2018. [Google Scholar]
2. L. Sun, Y. Lu, K. Yang and S. Li, “ECG analysis using multiple instance learning for myocardial infarction detection,” IEEE Transactions on Biomedical Engineering, vol. 59, no. 12, pp. 3348–3356, 2012. [Google Scholar]
3. G. D. Poian, R. Bernardini and R. Rinaldo, “Separation and analysis of fetal-ECG signals from compressed sensed abdominal ECG recordings,” IEEE Transactions on Biomedical Engineering, vol. 63, no. 6, pp. 1269–1279, 2016. [Google Scholar]
4. N. Bayasi, T. Tekeste, H. Saleh, B. Mohammad, A. Khandoker et al., “Low-power ECG-based processor for predicting ventricular arrhythmia,” IEEE Transactions on Very Large Scale Integration (VLSI) Systems, vol. 24, no. 5, pp. 1962–1974, 2016. [Google Scholar]
5. X. Zhai and C. Tin, “Automated ECG classification using dual heartbeat coupling based on convolutional neural network,” IEEE Access, vol. 6, no. 5, pp. 27466–27472, 2018. [Google Scholar]
6. M. J. Mollakazemi, F. Asadi, H. E. Orimi, S. A. Atyabi, I. Uzelac et al., “Estimation of extent damage tissue by multi resolution analysis of the electrocardiogram and arterial blood pressure,” Computing in Cardiology Conf. (CinC), Nice, France, vol. 42, no. 9, pp. 1113–1116, 2015. [Google Scholar]
7. Y. Xia et al., “An Automatic Cardiac Arrhythmia Classification System with Wearable Electrocardiogram,” IEEE Access, vol. 6, pp. 16529–16538, 2018. [Google Scholar]
8. S. K. Yadav, R. Sinha and P. K. Bora, “Electrocardiogram signal denoising using non-local wavelet transform domain filtering,” IET Signal Processing, vol. 9, no. 2, pp. 88–96, 2015. [Google Scholar]
9. H. D. Hesar and M. Mohebbi, “A multi rate marginalized particle extended kalman filter for P and T wave segmentation in ECG signals,” IEEE Journal of Biomedical and Health Informatics, vol. 23, no. 1, pp. 112–122, 2019. [Google Scholar]
10. H. M. Lynn, S. B. Pan and P. Kim, “A deep bidirectional GRU network model for biometric electrocardiogram classification based on recurrent neural networks,” IEEE Access, vol. 7, pp. 145395–145405, 2019. [Google Scholar]
11. S. K. Bashar, E. Ding, A. J. Walkey, D. D. McManus and K. H. Chon, “Noise detection in electrocardiogram signals for intensive care unit patients,” IEEE Access, vol. 7, no. 7, pp. 88357–88368, 2019. [Google Scholar]
12. H. Liu, D. Chen and G. Sun, “Detection of fetal ECG R wave from single-lead abdominal ECG using a combination of RR time-series smoothing and template-matching approach,” IEEE Access, vol. 7, no. 5, pp. 66633–66643, 2019. [Google Scholar]
13. S. Jain, V. Bajaj and A. Kumar, “Riemann liouvelle fractional integral based empirical mode decomposition for ECG denoising,” IEEE Journal of Biomedical and Health Informatics, vol. 22, no. 7, pp. 1133–1139, 2018. [Google Scholar]
14. J. Wang, M. She, S. Nahavandi and A. Kouzani, “Human identification from ECG signals via sparse representation of local segments,” IEEE Signal Processing Letters, vol. 20, no. 10, pp. 937–940, 2013. [Google Scholar]
15. F. K. Khavar, K. Tavakolian, A. Blaber and C. Menon, “Automatic and robust delineation of the fiducial points of the seismocardiogram signal for noninvasive estimation of cardiac time intervals,” IEEE Transactions on Biomedical Engineering, vol. 64, no. 8, pp. 1701–1710, 2017. [Google Scholar]
16. F. A. Atienza, E. Morgado, L. F. Martínez, A. G. Alberola and J. L. R. Álvarez, “Detection of life-threatening arrhythmias using feature selection and support vector machines,” IEEE Transactions on Biomedical Engineering, vol. 61, no. 3, pp. 832–840, 2014. [Google Scholar]
17. S. Raj and K. C. A. Ray, “ECG signal analysis using DCT-based DOST and PSO optimized SVM,” IEEE Transactions on Instrumentation and Measurement, vol. 66, no. 3, pp. 470–478, 2017. [Google Scholar]
18. S. R. Moosavi, E. Nigussie, M. Levorato, S. Virtanen and J. Isoaho, “Low-latency approach for secure ECG feature based cryptographic key generation,” IEEE Access, vol. 6, no. 2, pp. 428–442, 2018. [Google Scholar]
19. A. O. Bicen, N. Z. Gurel, A. Dorier and O. T. Inan, “Improved pre-ejection period estimation from ballistocardiogram and electrocardiogram signals by fusing multiple timing interval features,” IEEE Sensors Journal, vol. 17, no. 7, pp. 4172–4180, 2017. [Google Scholar]
20. U. Satija, B. Ramkumar and M. S. Manikandan, “A new automated signal quality-aware ECG beat classification method for unsupervised ECG diagnosis environments,” IEEE Sensors Journal, vol. 19, no. 1, pp. 277–286, 2019. [Google Scholar]
21. W. Zhu, X. Chen, Y. Wang and L. Wang, “Arrhythmia recognition and classification using ECG morphology and segment feature analysis,” IEEE/ACM Transactions on Computational Biology and Bioinformatics, vol. 16, no. 2, pp. 131–138, 2019. [Google Scholar]
22. Q. A. Rahman, L. G. Tereshchenko, M. Kongkatong, T. Abraham, M. R. Abraham et al., “Utilizing ECG-based heartbeat classification for hypertrophic cardiomyopathy identification,” IEEE Transactions on Nano Bioscience, vol. 14, no. 7, pp. 505–512, 2015. [Google Scholar]
23. S. Xu, J. Li, K. Liu and L. Wu, “A parallel GRU recurrent network model and its application to multi-channel time-varying signal classification,” IEEE Access, vol. 7, no. 8, pp. 118739–118748, 2019. [Google Scholar]
24. S. Kiranyaz, T. Ince and M. Gabbouj, “Real-time patient-specific ECG classification by 1-d convolutional neural networks,” IEEE Transactions on Biomedical Engineering, vol. 63, no. 3, pp. 664–675, 2016. [Google Scholar]
25. R. He, Y. Liu, K. Wang, N. Zhao, Y. Yuan et al., “Automatic cardiac arrhythmia classification using combination of deep residual network and bidirectional LSTM,” IEEE Access, vol. 7, no. 7, pp. 102119–102135, 2019. [Google Scholar]
26. X. Zhai and C. Tin, “Automated ECG classification using dual heartbeat coupling based on convolutional neural network,” IEEE Access, vol. 6, no. 5, pp. 27466–27472, 2018. [Google Scholar]
27. L. Han, X. Pu and X. Chen, “Method of fetal electrocardiogram extraction based on ν-support vector regression,” IET Signal Processing, vol. 9, no. 7, pp. 430–439, 2015. [Google Scholar]
28. R. G. Sutar and A. G. Kothari, “Intelligent electrocardiogram pattern classification and recognition using low-cost cardio-care system,” IET Science, Measurement & Technology, vol. 9, no. 5, pp. 134–143, 2015. [Google Scholar]
29. H. E. Saadawy, M. Tantawi, H. A. Shedeed and M. F. Tolba, “Hybrid hierarchical method for electrocardiogram heartbeat classification,” IET Signal Processing, vol. 12, no. 5, pp. 506–513, 2018. [Google Scholar]
30. A. Smruthy and M. Suchetha, “Real-time classification of healthy and apnea subjects using ECG signals with variational mode decomposition,” IEEE Sensors Journal, vol. 17, no. 5, pp. 3092–3099, 2017. [Google Scholar]
 | This work is licensed under a Creative Commons Attribution 4.0 International License, which permits unrestricted use, distribution, and reproduction in any medium, provided the original work is properly cited. |