DOI:10.32604/iasc.2022.026628
| Intelligent Automation & Soft Computing DOI:10.32604/iasc.2022.026628 | |
| Article |
A Novel Anomaly Detection Method in Sensor Based Cyber-Physical Systems
1Department of Electronics and Communication Engineering, Dr. NGP Institute of Technology, Coimbatore, 641048, Tamilnadu, India
2Department of Networking and Communications, School of Computing, SRM Institute of Science and Technology, Kattankulathur, 603203, Tamilnadu, India
3Department of Electrical and Electronics Engineering, Vignan’s Institute of Information Technology, Visakhapatnam, 530049, India
4Department of Electronics and Communication Engineering, K. RamaKrishnan College of Engineering, Tiruchirapalli, 621112, Tamilnadu, India
5Department of Information Technology, M. Kumarasamy College of Engineering, Karur, 639113, Tamilnadu, India
6Department of Electronics and Communication Engineering, K. RamaKrishnan College of Technology, Tiruchirapalli, 621112, Tamilnadu, India
*Corresponding Author: K. Muthulakshmi. Email: promuthungp@gmail.com
Received: 31 December 2021; Accepted: 15 February 2022
Abstract: In recent times, Cyber-physical system (CPS) integrates the cyber systems and physical world for performing critical processes that are started from the development in digital electronics. The sensors deployed in CPS are commonly employed for monitoring and controlling processes that are susceptible to anomalies. For identifying and detecting anomalies, an effective anomaly detection system (ADS) is developed. But ADS faces high false alarms and miss detection rate, which led to the degraded performance in CPS applications. This study develops a novel deep learning (DL) approach for anomaly detection in sensor-based CPS using Bidirectional Long Short Term Memory with Red Deer Algorithm (BiLSTM-RDA). The presented BiLSTM-RDA model comprises preprocessing classification, and parameter tuning. Initially, the sensor data undergoes preprocessing to remove the noise present in it. Afterward, the BiLSTM based classification process takes to detect the existence of anomalies in CPS. At last, parameter tuning of the Bi-LSTM model is carried out by the use of RDA for tuning the parameters such as the number of hidden layers, batch size, epoch count, and learning rate. For assessing the experimental outcome of the BiLSTM-RDA technique, a comprehensive experimentation is performed using the data from sensor-based CPS. A detailed comparative analysis takes place to ensure the effective detection performance of the BiLSTM-RDA model and The obtained experimental results verified the superior performance on the applied data over the compared methods with the maximum an average precision of 0.989, recall of 0.984, F-score of 0.985, and accuracy of 0.983.
Keywords: Cyber physical system; deep learning; anomaly detection; BiLSTM; red deer algorithm
In recent times, Cyber-Physical Systems (CPS) have been applied extensively in a massive number of real-time applications, especially, in complicated sectors. In every year, the market rate of CPS would be extended to a greater extent and it is expected to reach a remarkable value within a short time interval [1]. Some of the eminent application of CPS are smart grids, transports, aerial system, and so forth. In general, CPS developed would be tedious, assorted, and unified to offer effective benefits. Unfortunately, these properties result in an extensive crisis. As depicted in Fig. 1, CPS is composed of 5 units, they are Physical space with physical elements of CPS, such as engine, tank, and wheel. The actuators get the controlling command (implied as A2) from the controlling machines and modify the implemented parameters of physical devices (A1). Sensors determine the current state of a machine (S1) and send it to the controlling device (S2). Followed by, the control systems receive the sensor value (S2) and forward it to control commands and actuators (A2), which applies the above-mentioned control logic. Here, the data transmission among sensing devices and control system are mentioned as stage 0 communication (indicated as C0). The C0 communication traffic is considered as a sensor measurement (S2) and control commands (A2). In line with this, communication among control system and Supervisory control and Data Acquisition (SCADA) is meant to be stage 1 data transmission which is represented as C1. Then, information on C1 is D1. In particular, the newly presented work concentrates on 4 CPS classes namely, Industrial Control Systems (ICS), smart grid, Intrusion Technology System (ITS) as well as aerial systems. The original devices might be heterogeneous in 4 CPS; however, the infrastructure is identical.
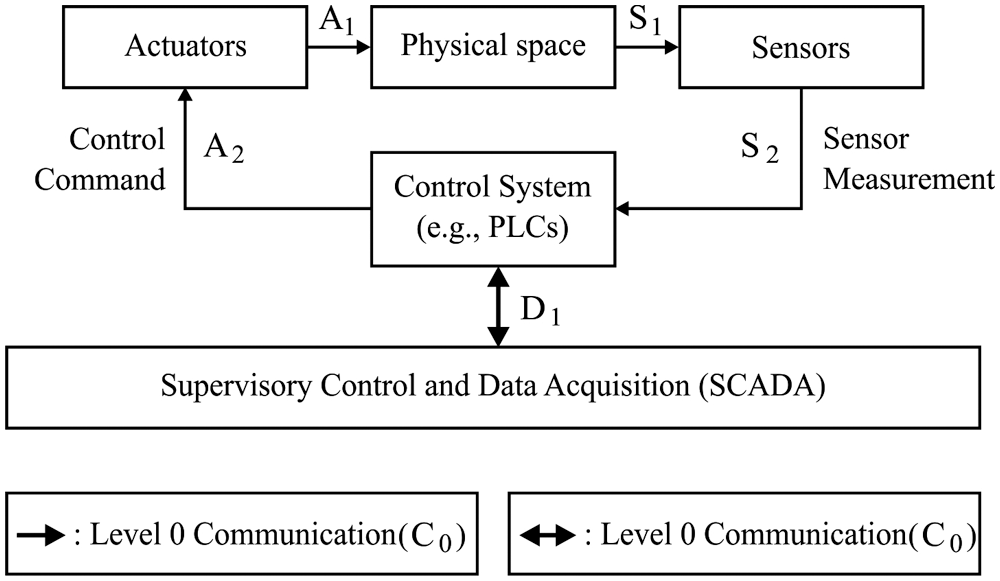
Figure 1: Architecture of CPS
In order to predict and eliminate the intrusions and unwanted errors in the CPS system, a significant and effective anomaly prediction model has to be projected with the ability of reducing the crisis to a greater extent. Some of them are, state estimation, statistical models were applied for observing the CPS condition. But, these models demand professional experience; else, the knowledge about the basic distribution of normal data has to be known. In addition, Machine Learning (ML) techniques are independent of domain-based knowledge. However, it needs a massive amount of labeled data such as classification-related models. Moreover, it is not able to confine the exclusive features of CPS like spatial-temporal associations. Intrusion detection models have been applied to ensure the integrity of network communication. Physical parameters (noise of engines) were confined to demonstrate the immutable behavior of CPS. Then, program execution semantics are simplified for protecting the control systems. But, as mentioned before, CPS is highly complex and it is prone to attacks like APT attacks and it is impossible to monitor the complete state of CPS (secured multivariate physical value) and it requires professional domain knowledge.
The behavioral-related method is a crucial framework in Intrusion Detection Systems (IDS). These models are categorized as Supervised and Unsupervised techniques. Initially, supervised training labelled data with normal and anomalous behaviors are induced to the model for better learning. Therefore, labelled data of CPS is hard to retrieve and the attained data might not be an actual one. In this point, unsupervised learning is applied as it does not require anomalous data in the training phase. Even though it is better in predicting the abnormalities, massive works that apply unsupervised learning results in high false positives. Here, the Bi-directional Long Short Term Memory (Bi-LSTM) has been proposed for predicting the data sequence and perform the abnormality detection. Mostly, cyber-attacks exist in a time of correlating time-series data which offers the data over time is applied to predict the abnormality. Bi-LSTM is highly beneficial to learn sequences with pattern of unknown length. Also, the stacked recurrent hidden layers in the neural network (NN) is to confine the structure of a time series. Thus, an alternative is to apply Recurrent Neural Networks (RNN) as developed. In [2], researchers have utilized RNN to develop various realistic data sequence. Anomalies were predicted on the basis of the probability error of the previous threshold which results in higher false positives. Followed by, Deep Learning-relied anomaly detection (DLAD) models were presented for anomalous prediction in CPS. The recent works have found various Neural Network structures (ConvLSTM) for limiting the errors in diverse CPS systems.
This paper introduces an effective DL model for anomaly detection in sensor-based CPS using Bidirectional Long Short Term Memory with Red Deer Algorithm (BiLSTM-RDA). The presented BiLSTM-RDA model operates on three major stages, namely preprocessing, classification, and parameter tuning. At the initial stage, the sensor’s data is preprocessed to discard the noise that exists in it. Afterward, the BiLSTM based classification process takes to detect the existence of anomalies in CPS. Finally, parameter tuning of the Bi-LSTM model is carried out by the use of RDA for tuning the parameters such as number of hidden layers, batch size, epoch count, and learning rate. The application of RDA helps to effectively choose the hyper-parameters of Bi-LSTM, and thereby improves the classification results. For assessing the experimental outcome of the BiLSTM-RDA model, a comprehensive set of simulations takes place using the data from sensor-based CPS.
The rest of the sections in the paper are organized as follows. Section 2 briefs the related works and section 3 introduces the presented model. Followed by, Section 4 performs the experimentation and Section 5 concludes the paper.
Anomaly detection in the CPS model results in various challenging issues. Consequently, different methods have been introduced on anomaly prediction. The formerly attained outcomes have concentrated on detectors rather than the optimal configuration of the previous detector. Followed by, numerous detectors were proposed on ML such as the NN approach. Goh et al. [3] established the unsupervised framework for anomalous detection in CPS relied on RNN as well as the cumulative sum approach. Krishnamurthy et al. [4] exploited another technique named as Bayesian networks. It is mainly applied for learning causal relations as well as temporal correlations in the CPS model for unlabeled data with the help of Bayesian networks. Then, it is applied for predicting the abnormalities and specify the major reasons. Jones et al. [5] presented a formal method relied on anomaly detection in CPS. Here, a model-free, unsupervised learning strategy which develops a signal temporal logic (STL) from the data collected in general applications. Next, anomalies are predicted using the flagging system trajectories which do not meet the applied equation. Chibani et al. [6] examined the issue of developing fault identification filtering technique in fuzzy system, s in fuzzy systems that considers the errors and interruptions in discrete-time polynomial fuzzy system. Additionally, a diagnostic observer relied system for fault prediction of fuzzy system that optimize the ineffective scenario and fault sensitivity [7]. Identification of anomalies is assumed in the content of security attacks where it predicts the CPS attack. For instance, Urbina et al. [8] investigate the physics based prediction of stealthy attacks over ICS. Followed by, a novel metric has been predicted to measure the effect and show that attacks are predicted with an appropriate configuration. Unlike the other model, Kleinmann et al. [9] considered the attacks over ICS relied on cyber anomalies. On the other hand, anomaly detection also predicts the faults and disturbances in traffic networks. Lu et al. [10] examined the previous issues of anomaly prediction in traffic sensors. According to the data level applied, the prediction is classified into 3 phases namely, Macroscopic, Mesoscopic, and Microscopic. Moreover, it reviews data correction models and offers real-time assistance for anomalous prediction in traffic systems.
Zygouras et al. [11] projected 3 approaches that depend upon Pearson correlation, cross-correlation, as well as multivariate Autoregressive Integrated Moving Average models (ARIMA) for predicting the faulty traffic measurement. The function of 3 modules was defined and depicted that, they are complementary to one another. Furthermore, crowd-sourcing has been applied to overcome the unwanted measurements which occur because of defective sensing devices and abnormal traffic. Lastly, Robinson [12] provided an association among adjacent sensors which predicts the faulty loop detectors. Regardless, no works have considered the performance of the controller while developing the anomaly detection techniques, and it does not carry out the application ware optimization technique for the enhancement of the prediction process. Though several works have been available in the literature, only few works have concentrated on CPS environment. In addition, most of the works have not focused on parameter tuning process, which plays an important role in improved detection results.
3 The Proposed Bi-LSTM-RDA Model
The working process of the Bi-LSTM-RDA model is exhibited in Fig. 2. As depicted, it involves initial preprocessing in two stages namely format conversion and normalization. Next to that, the classification process takes place by the Bi-LSTM model, where the parameters are tuned by the RDA. These processes are neatly discussed in the subsequent sections.
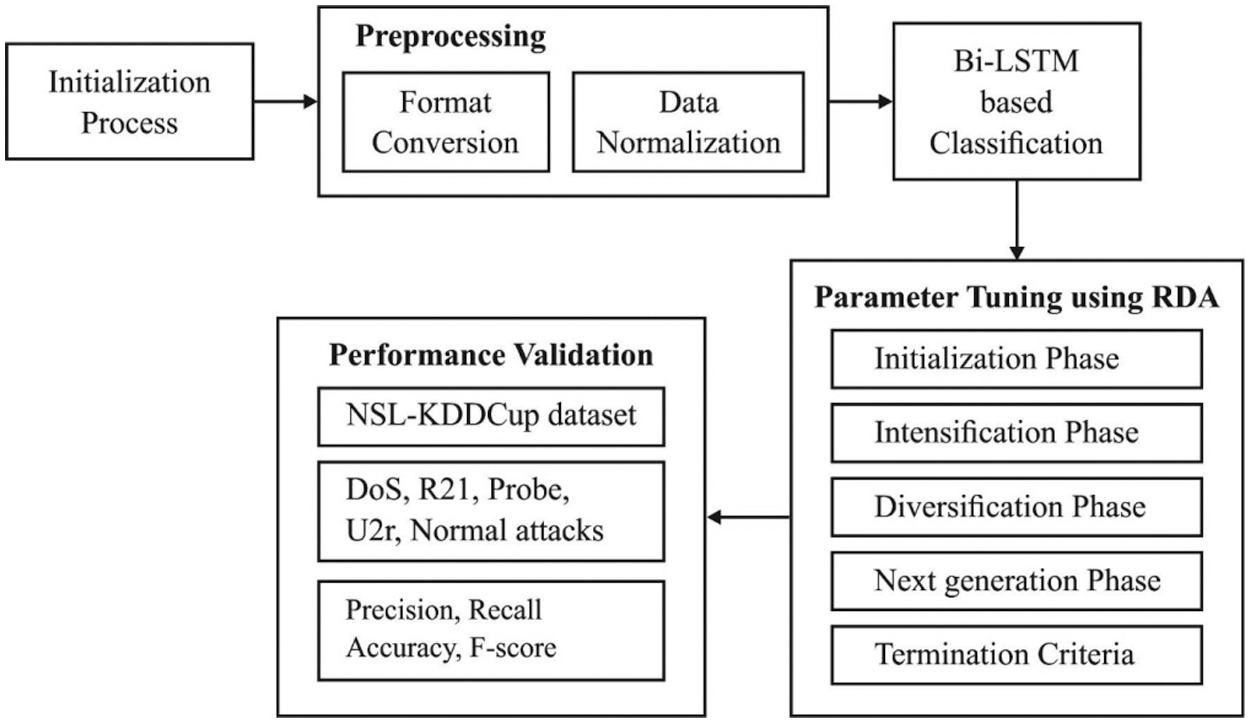
Figure 2: Block diagram of Bi-LSTM-RDA model
Generally, the selection of appropriate data preprocessing technique is important for improving the accuracy of the detection process. Certainly, as the data created in real time might contain problems like variations in format or order of magnitudes, they need to be preprocessed prior to perform detection operation [13]. In this study, data preprocessing of sensor based CPS data takes place in two ways namely format conversion and data normalization.
Since the data for anomaly recognition is commonly gathered from the network, every network link record comprises many attribute characteristics. Along with the fundamental numeral data type, the features include data in a nominal type. But several classification models can handle only numeric data, it is needed to transform the nominal type data. Here, the probabilistic mass function (PMF) process is employed for the conversion of nominal to numerical data, as the numeric data lies in the interval of [0, 1].
Data normalization of the numerical kind is important in any dataset. At the same time, for every individual record in the data, the range of values may vary as the values of the features are distinct under every aspect. The normalization tasks make the saved feature attributes into related values, thereby enhances the convergence rate and classification accuracy. Two commonly available normalization approaches are the Min-Max and Z-score normalization methods. The min-max model is employed in this study, which brings the actual data comes into the range of [0, 1], using Eq. (1):
where x denotes a recent value, xmin and xmax are the minimal and maximum value of the attributes and xscale represents the measure next to the attribute matching process.
The central premises of LSTM is to handle the elongated term dependency which is not capable to develop a diminishing gradient problem as the LSTM makes use of a memory cell state for data transmission. A cell state is suitable for computing the data which is not used for a longer duration. Hence, an LSTM is comprised of 3 gates such as, Forget, Update as well as Reset gates. Additionally, some of the major units of LSTM are given below.
• Constant error carousel (CEC): A crucial element with repeated connections along with unit weight. Then, recurrent links indicate a feedback loop and a time step 1. The CEC’s activation is an inner state that is operated as a memory for example data.
• Input Gate: A multiplicative unit that defends a data saved in CEC from an irregular input.
• Output Gate: A multiplicative unit that defends an alternative unit from interruption by the content saved in CEC.
Here, the input and output gate handles the access to CEC control. In the training phase, the input gate is recognized and enables new data inside the CEC. If the input gate is 0, then the data is not connected. Likewise, the output gate is examined and allows the data to be received from CEC. Additionally, if the gates are closed, then the data is stuck into the memory cell. It then enables the error signals to flow numerous times without the consideration of diminishing gradients. The LSTM surpasses the RNN while learning prolonged dependency. It is an insignificant data sequence. The LSTM state is unorganized if the input stream is detached physically and modified into appropriate sequences. Especially, LSTM learns to reset the memory cell as the sequence is completed and gets a new sequence. These problems are resolved by applying LSTM with forget gates. The structure of the LSTM unit with forget gates is described in the following:
• Input: The LSTM unit applies the current input vector implied as xt and indicates the time step as ht−1. Therefore, weighted inputs are consolidated and induced by tanh activation that is represented as zt.
• Input gate: It learns the xt and ht−1, computes the weighted sum, and uses sigmoid activation. Finally, the result is improved with zt, to offer the input flow of a memory cell.
• Forget gate: It is operated by an LSTM unit which resets memory data only when it is irregular and noisy. This happens when the system invokes to compute a new data series. A forget gate reads xt and ht−1 and uses a sigmoid activation for weighted inputs. Finally, the results ft are improved under the application of a cell state previously st−1 which activates the gate to forget the memory data that is unnecessary.
• Memory cell: It is limited to CEC as well as recurrent edge and unit weight. A recent cell state st is determined to forget the unwanted data from the former time step and confirm the related data from recent input.
• Output gate: It utilizes a weighted sum of xt and ht−1 and applies a sigmoid activation and handles the data flow from the LSTM unit.
• Output: The simulation outcome of LSTM unit ht, is estimated by changing a cell state st by a tanh and maximize the output gate, ot. The performance of the LSTM unit is depicted as provided below:
Besides, the Bi-LSTM is an improved model of LSTM in which 2 LSTM methodologies were applied for the input data. Previously, an LSTM is used for the input sequence. Then, the inverse form of the forward layer has been provided to the LSTM approach. Under the application of LSTM, the maximized learning of long term dependency enhances the model’s performance [14]. The variations among LSTM and Bi-LSTM methods are depicted in Fig. 3.
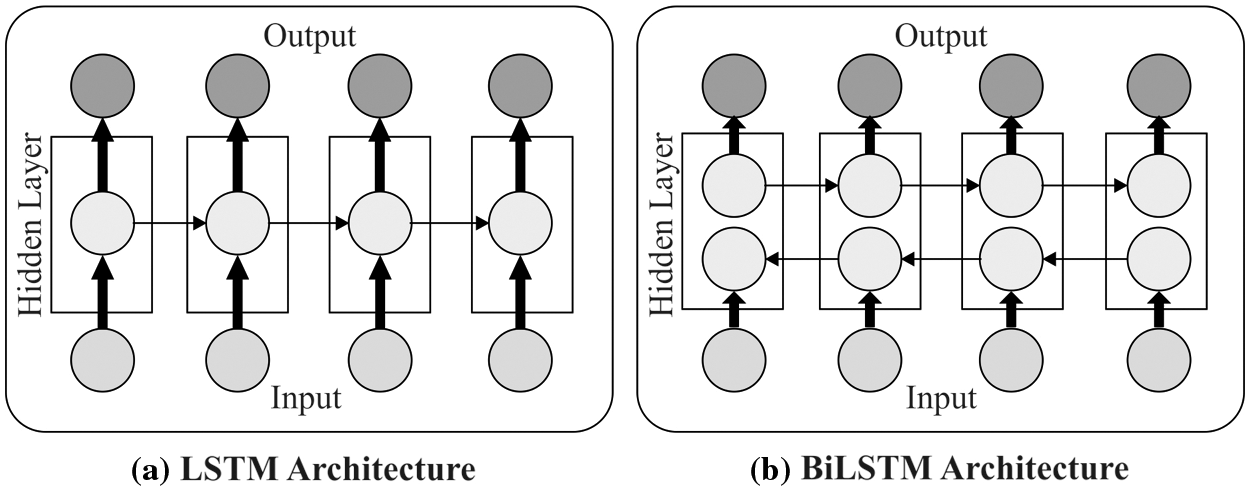
Figure 3: Difference between LSTM and Bi-LSTM models
3.5 Parameter Tuning of Bi-LSTM Model
Hyperparameter tuning of the Bi-LSTM model plays a vital part and greatly influences the anomaly detection performance. Therefore, the hyperparameters of Bi-LSTM are tuned by RDA for raising the effective performance. RDA depends upon the mating nature of Scottish red deer during the time of breading. Alike to several metaheuristic algorithms, the RDA begins with an arbitrary popular and some of the optimal RDs are chosen as male RDs (MRD) whereas the remaining RDs are termed as hinds [15]. Basically, all of the MRDs will roar and they are split into two groups (commander and stage) based on the roaring strength. Then, the commander and stage of every harem fought with one another to get a harem. In addition, the harem is generally organized by commanders. The hind count in the harem is proportional to the roaring capability and fighting nature of commanders. As a result, the commander undergoes mating with several hinds in a harem. It is noted that the stage undergoes mating with the closer hind with no consideration of the boundary of the harem.
The general intention of the optimization process is the identification of near-optimum or globalized solution with respect to the parameters of the issue. Here, RD represents a possible solution X in the search area. The dimensions of the solution X are represented as Nvar. For a “Nvar dimension optimization issue, an RD is a 1 × Nvar array, which can be represented as follows.
Besides, the function value can be determined for every RD, as given below.
At the beginning point, a set of initial population Npop is generated. Then, the optimal RD is chosen as Nmale and the remaining are Nhind (Nhind = Npop −Nmale). It is given that the Nmale count represents the elitist criteria of the RDA. Alternatively, the Nmale count controls the intensification features whereas the Nhind assumes the diversification stage of RDA. Next, the MRD will try to raise the grace through roaring. At the same time, this process might be success or failure. It should be noted that MRDs are the optimal solution. The nearby RDs of the MRD is determined and when the objective function of nearby RD is better than the MRD, it gets replaced. The RDA allows each MRD to update its location using the following Eq. (3):
For generating the possible nearby solution of males, the upper and lower bounds restricts the searching area. Naturally, the MRDs may vary in nature where some RDs are strong, fascinating, and effectively expand the territory compared to other RDs. The commander male count is defined as follows.
where NCom denotes the male count and γ is defined as the initial value of RDA, which lies in the interval of [10, 1]. Besides, the stage count Nstag is determined as:
Then, every commander fight with the stags in a random way. With respect to the solution space, the commander and stage approach to one another. Also, two novel solutions are obtained and replaced with the commander with the better one. The fighting process can be formulated as follows.
where New1 and New2 are newly created solutions in the fight task.
Afterward, the harems are formed, which is a swarm of hinds under the control of the male commander. The harem size is solely based on the strength of the male commander. For forming a harem, the hinds are divided between the commanders, as given below.
where vn denotes the strength of the nth commander and yn is its normalized value. For determining the normalization strength of the commander, the following equation is used.
Alternatively, the normalized strength of the male commander is part of the hind, which needs to be carried out by the male. Next, the hind count of the harem is defined below.
where N.haremn indicates the hind count in nth harem and Nhind is the hind count. Alike to other species, RDs are mates with one another. This operation is carried out using a commander, and α percent of hinds in the harem are the parents.
where
where
where di is the distance among the i-th hind and a stag. Therefore, the least value in the matrix defines the chosen hind. The process next to hind selection is mating. For selecting the subsequent generation, two mechanisms are followed. Initially, every MRD is ket. Next is considering the rest of the population in the subsequent generation. The hinds are chosen and offspring is produced through the mating process with respect to the fitness value. When a sufficient number of iterations are reached, the termination criteria gets satisfied.
This section examines the performance of the Bi-LSTM-RDA model on the applied NSL-KDDCup dataset [16] and the experimental outcome is investigated with respect to distinct evaluation parameters such as precision, recall, accuracy, and F-score. For experimental validation, 10 fold cross validation process is employed.
For experimentation, the most popular KDD CUP99 dataset is employed for anomaly detection. The dataset finds useful for good and real time validation of the performance of the presented method. The dataset includes the instances from 4 class labels such as 45927 instances under Denial of service (Dos) attack, 995 instances under Root to local (R2l) attack, 11656 instances under Probe attacks, 52 instances under User to root (U2r) attacks, and finally 67343 instances under Normal class label. These details are shown in Fig. 4.
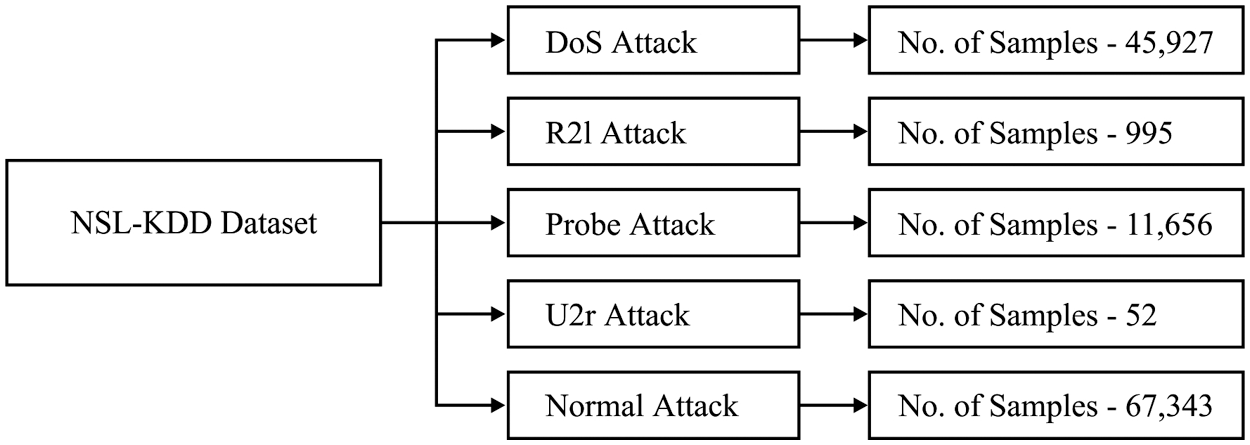
Figure 4: Different kinds of attacks in NSL-KDD dataset
Tab. 1 and Fig. 5 illustrate the anomaly detection performance of the Bi-LSTM-RDA model in terms of distinct measures with compared methods [17–22]. While classifying the DoS attack in the network data, the Bi-LSTM-RDA model has detected it effectively with the recall of 0.985, precision of 0.993, F-score of 0.991 and accuracy of 0.984.
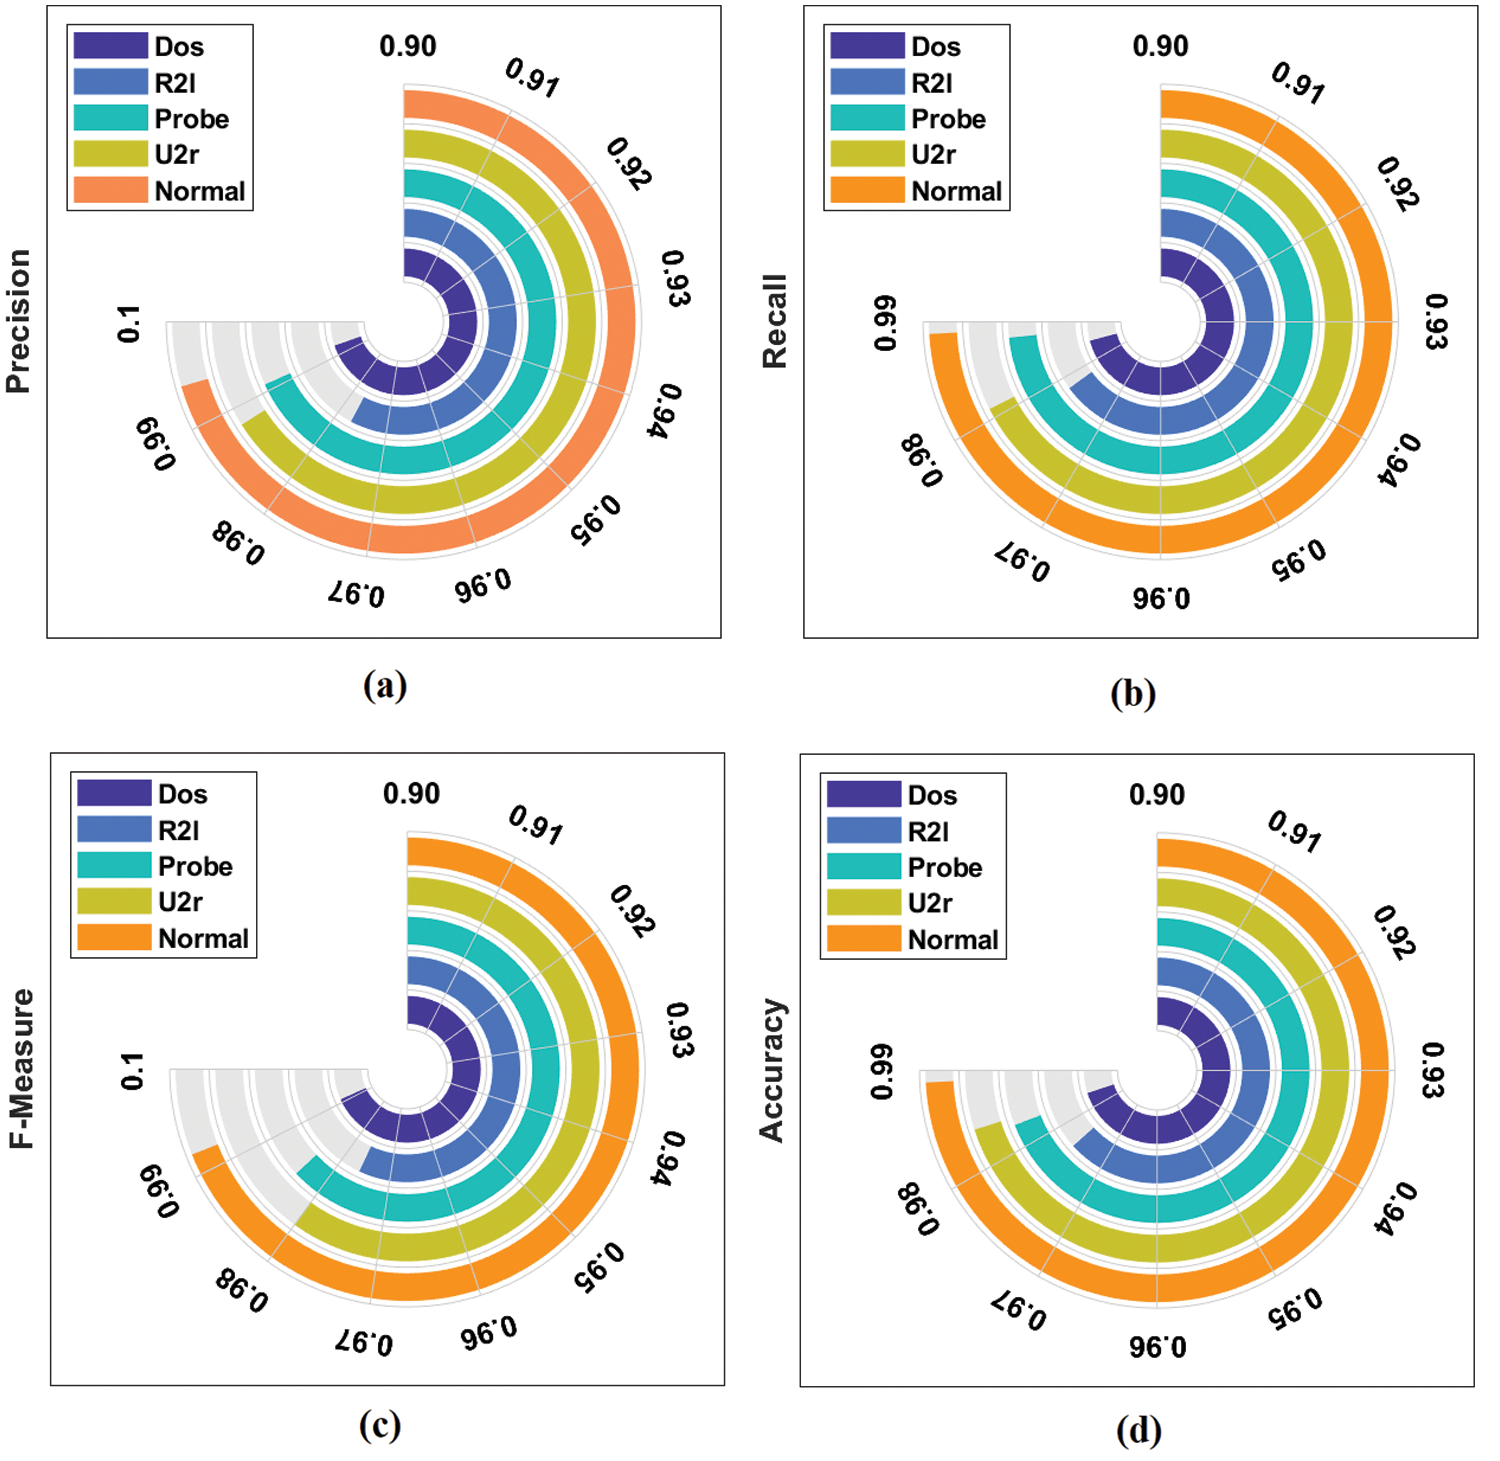
Figure 5: Result analysis of BiLSTM-RDA method with different measures
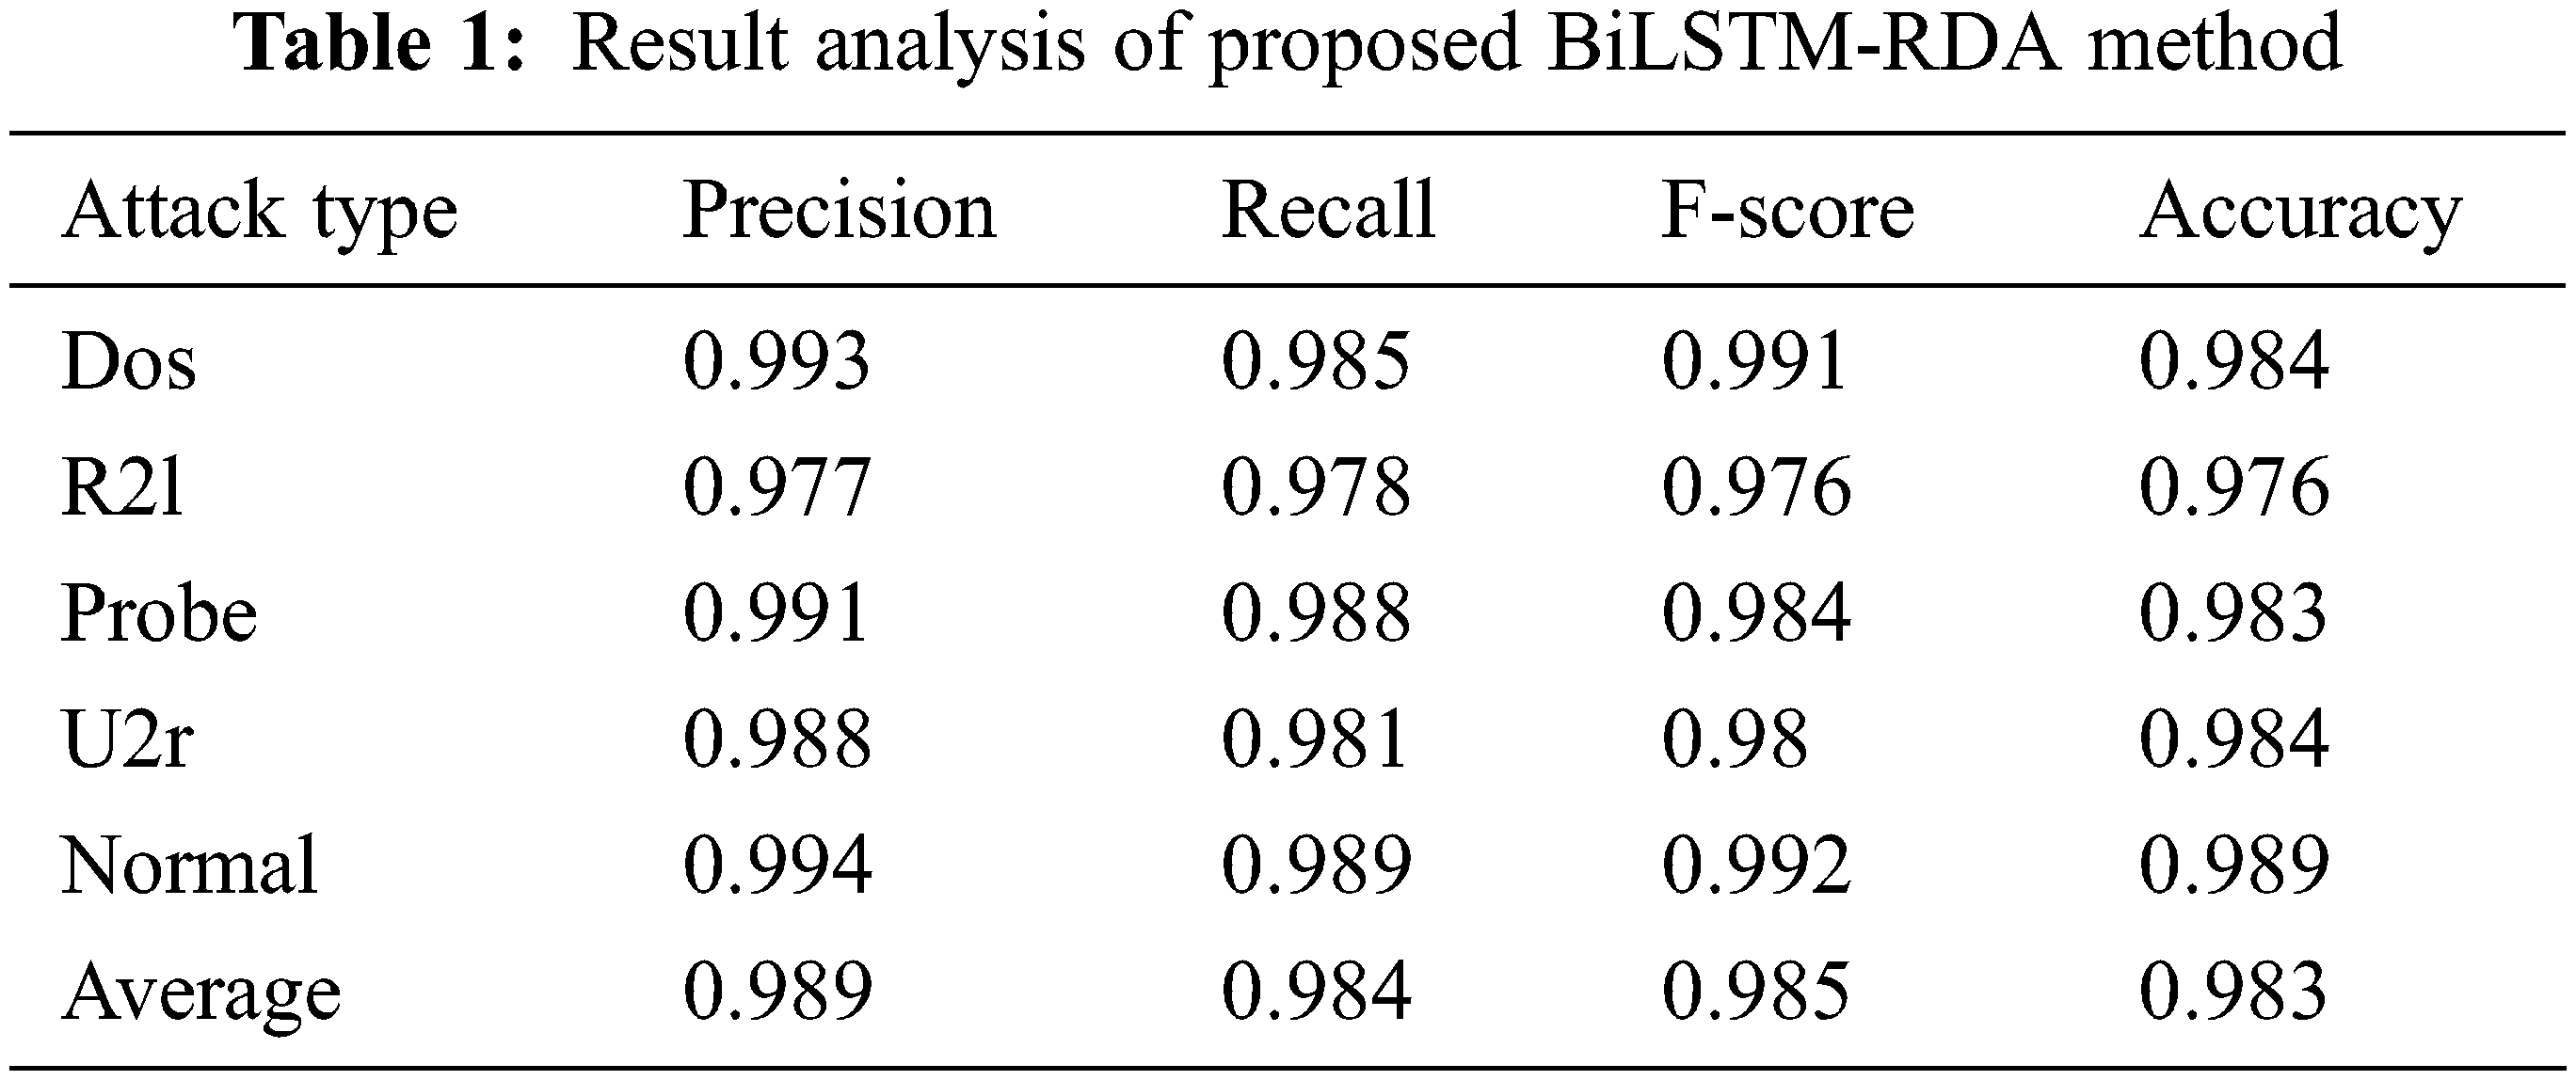
Fig. 6 shows the average analysis of BiLSTM-RDA Method with different measures. The figure exhibited that BiLSTM-RDA model has outperformed better results with an average precision of 0.989, recall of 0.984, F-score of 0.985 and accuracy of 0.983.
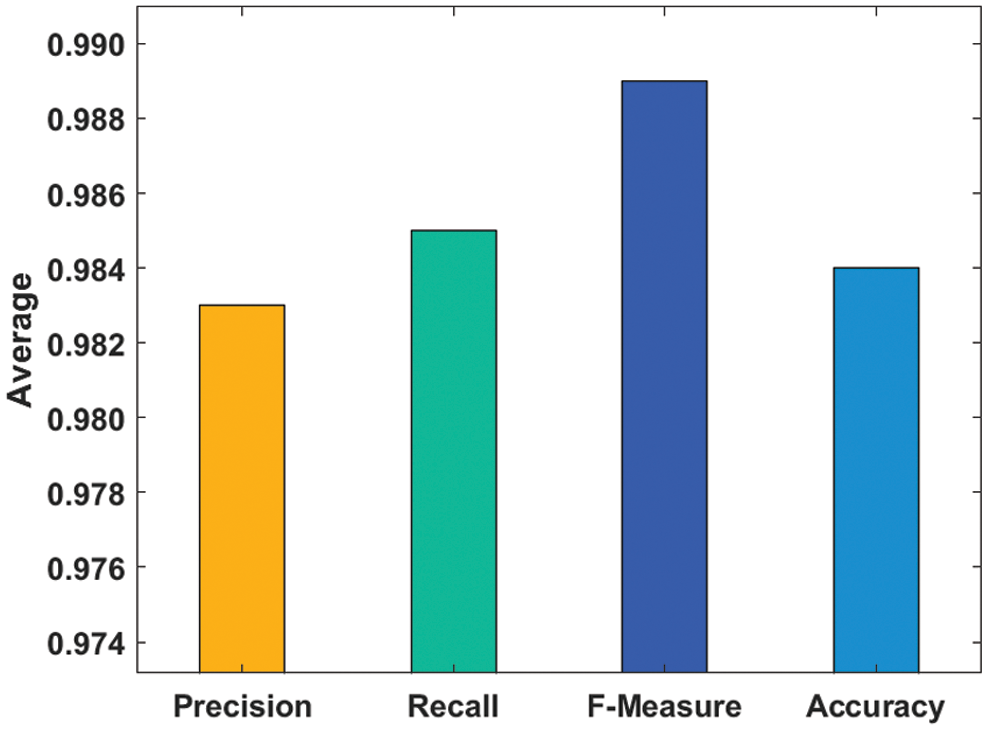
Figure 6: Average analysis of BiLSTM-RDA method
Tab. 2 and Fig. 7 investigate the outcome of the Bi-LSTM-RDA model with the set of different optimization algorithms interms of accuracy. The resultant values indicated that the Bi-LSTM-PSO (Particle Swarm Optimization) and Bi-LSTM-ACO (Ant Colony Optimization) algorithms have obtained worse results with the accuracy of 0.967 and 0.969 respectively. Along with that, the BiLSTM-FF (Firefly Algorithm), BiLSTM-CS (Crow Search) and BiLSTM-GWO (Greedy Wolf Algorithm) algorithms have showcased moderate and closer results with the accuracy of 0.97, 0.972, and 0.979. However, the Bi-LSTM-RDA model has outperformed the earlier models with the maximum accuracy of 0.983.
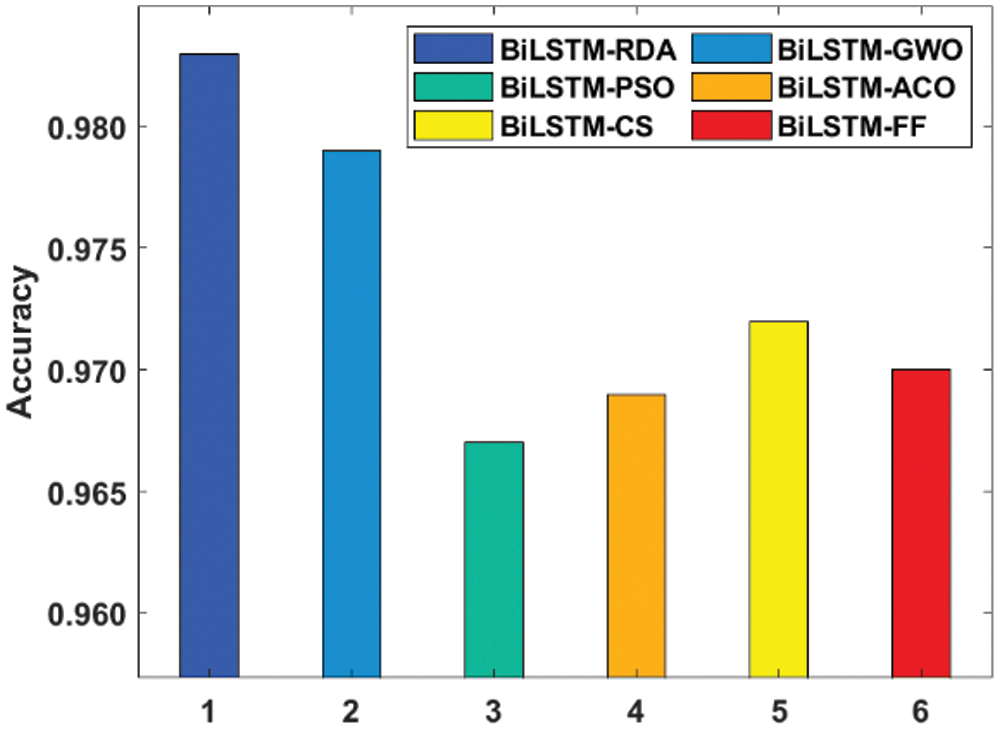
Figure 7: Accuracy analysis of BiLSTM-RDA method
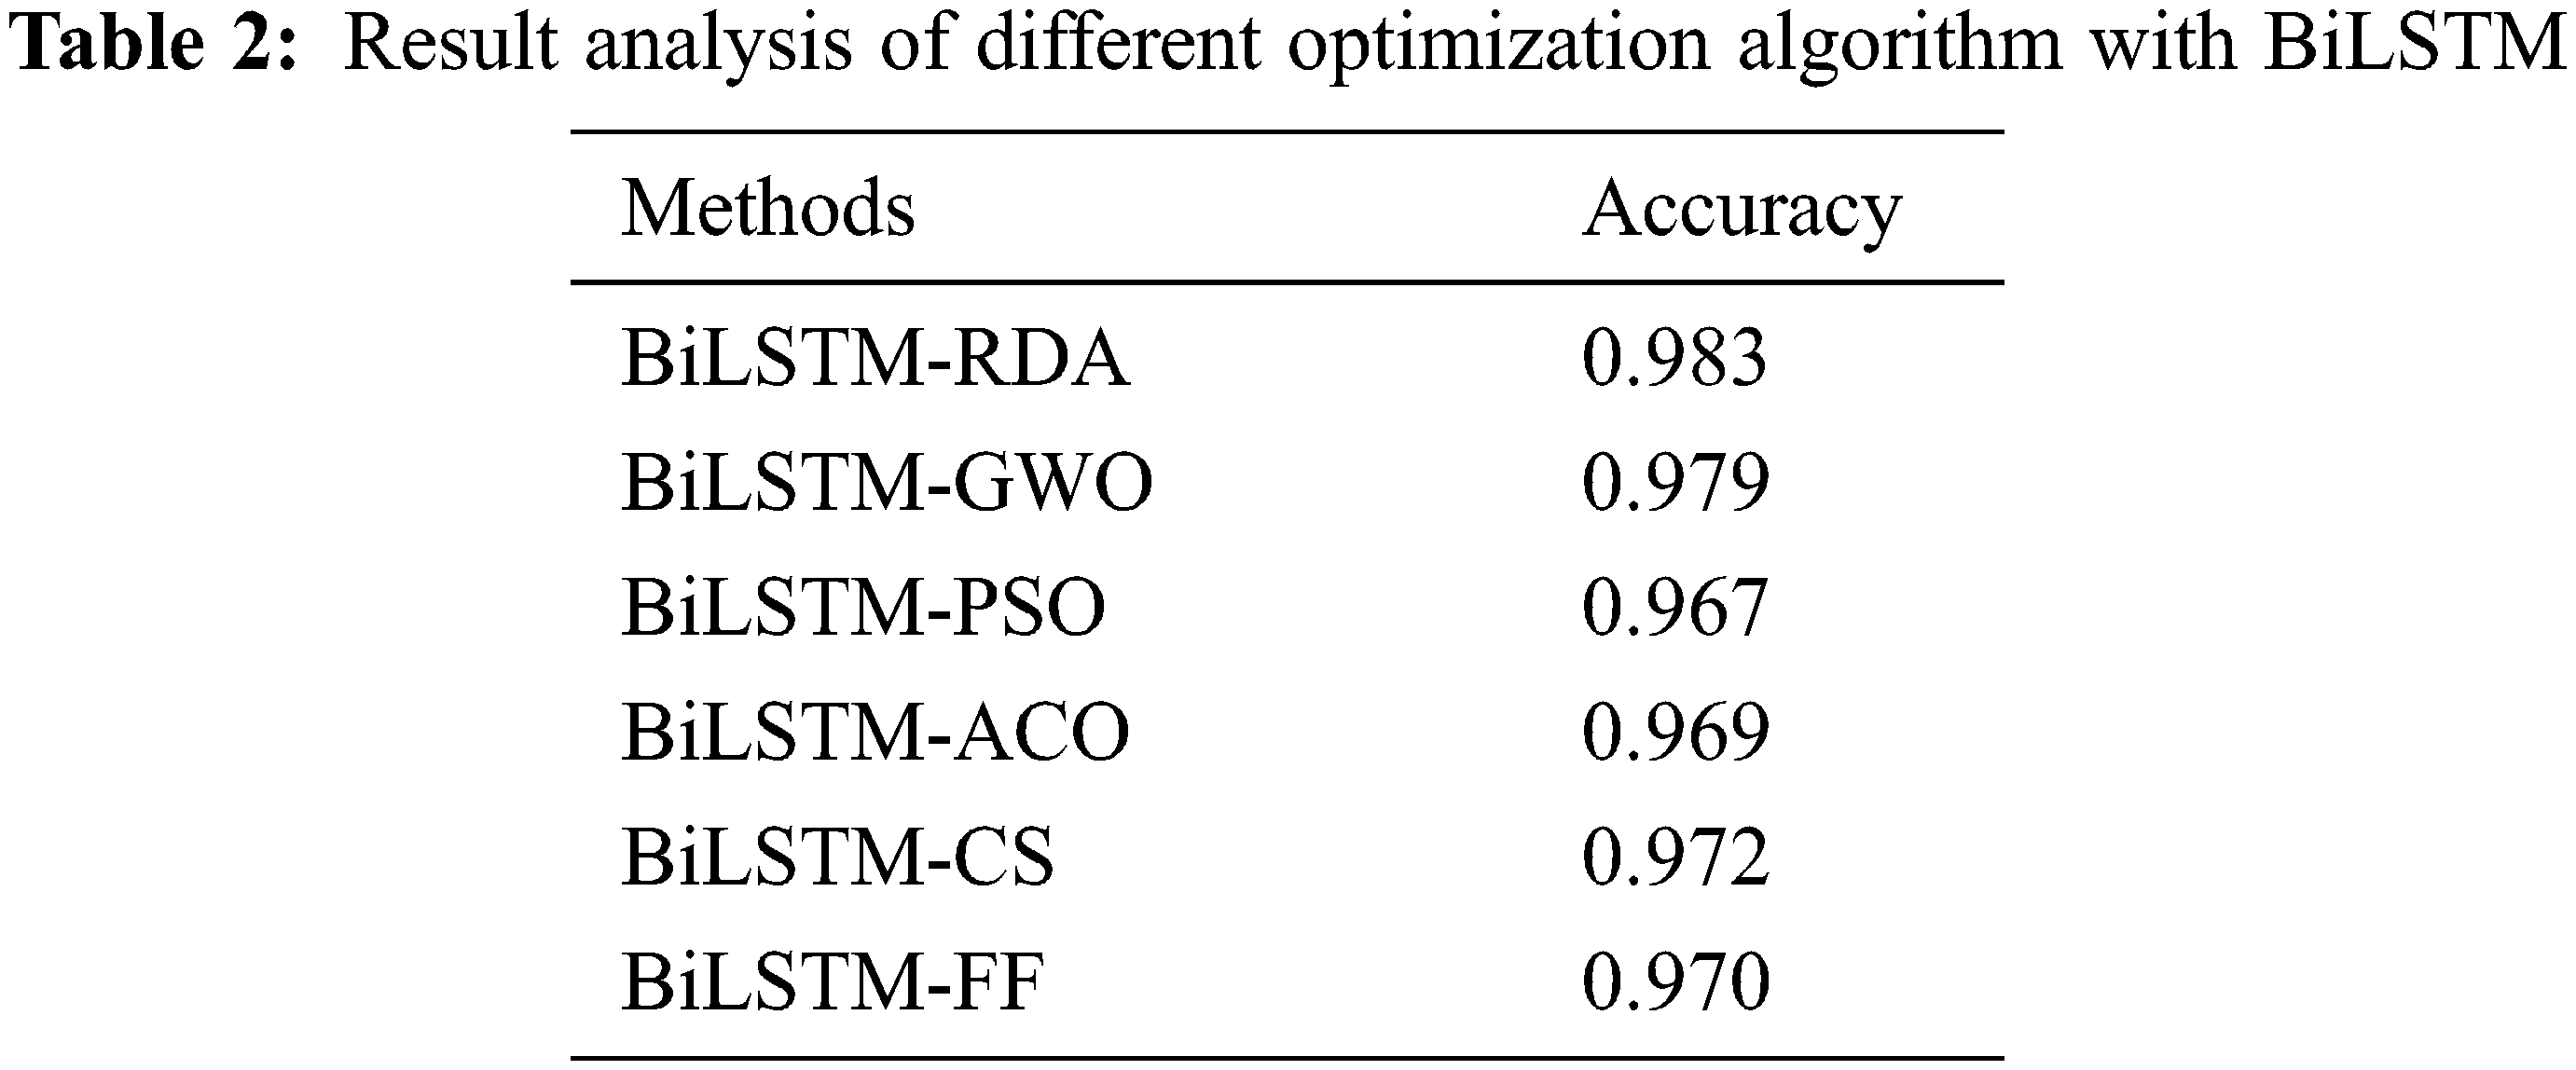
Fig. 8 examines the comparative analysis of the BiLSTM-RDA method with respect to precision and recall. The presented Bi-LSTM-RDA method has attained a maximum precision of 0.989 and recall of 0.984.
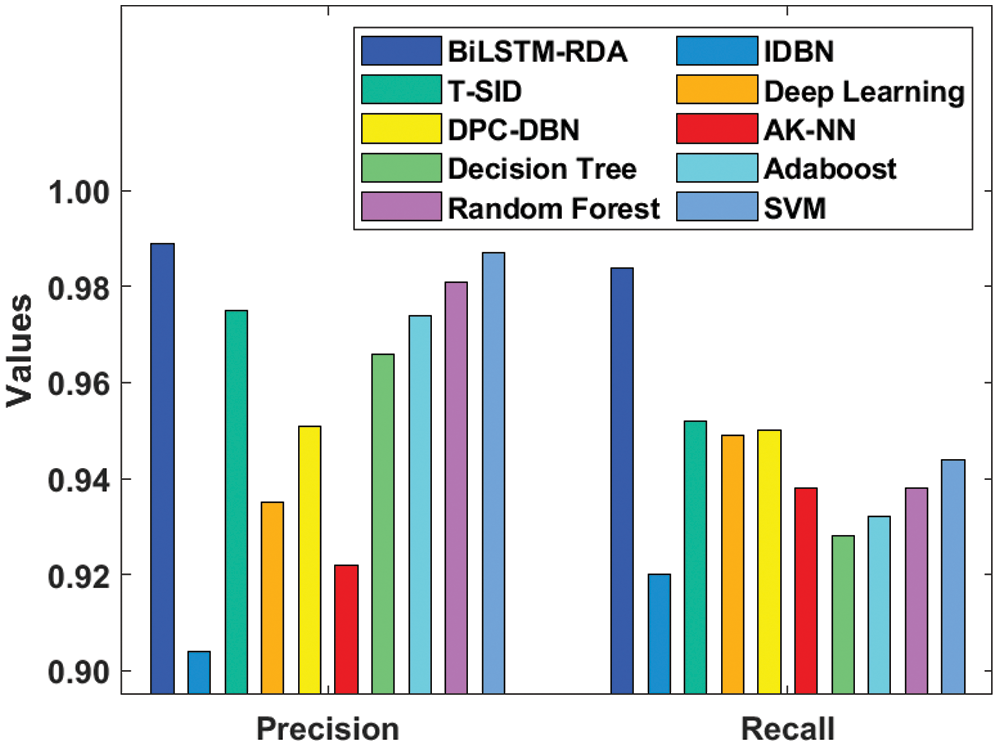
Figure 8: Precision and recall analysis of BiLSTM-RDA model
Fig. 9 investigates the comparative analysis of the BiLSTM-RDA model interms of accuracy and F-score. The proposed Bi-LSTM-RDA model has reached a maximum accuracy of 0.983 and F-score of 0.985.
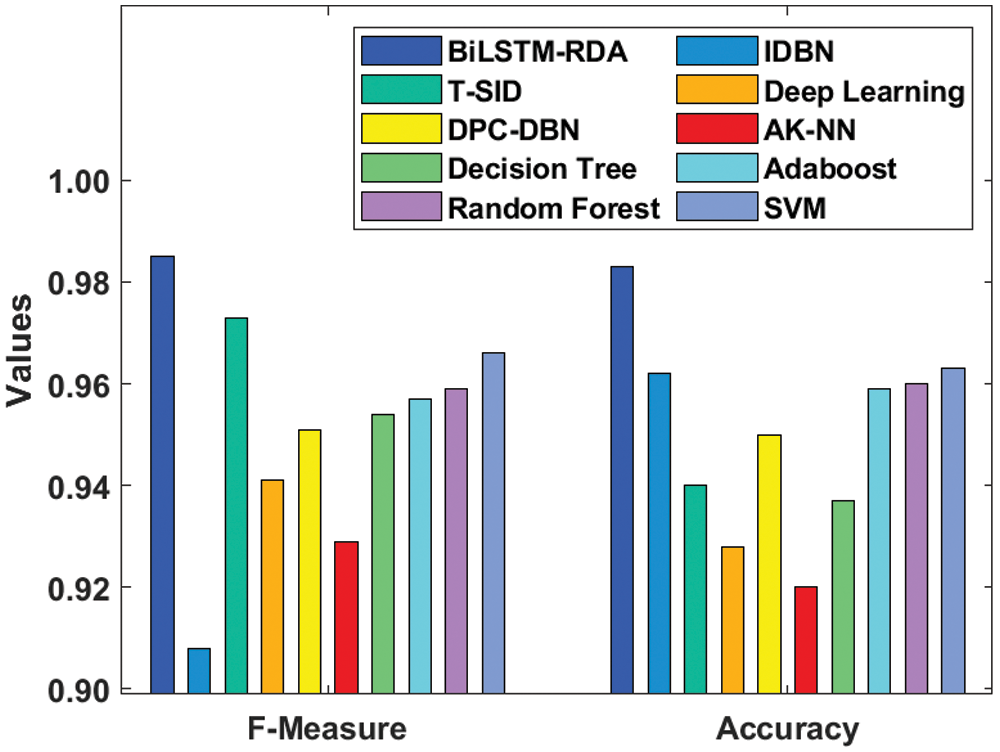
Figure 9: F-score and accuracy analysis of BiLSTM-RDA model
This paper has developed a new DL based BiLSTM-RDA model for anomaly detection in sensor-based CPS. The presented BiLSTM-RDA model operates on three major stages, namely preprocessing, classification, and parameter tuning. At the initial stage, preprocessing is carried out in two stages namely format conversion and normalization. Next to that, the classification process takes place by Bi-LSTM model, where the parameters are tuned by the RDA for tuning the parameters such as number of hidden layers, batch size, epoch count, and learning rate. The application of RDA helps to effectively choose the hyperparameters of Bi-LSTM, and thereby improves the classification results. An extensive experimentations is done to ensure the effective detection efficiency of the Bi-LSTM-RDA model. The attained results demonstrated that the BiLSTM-RDA model has exhibited superior results with an average precision of 0.989, recall of 0.984, F-score of 0.985, and accuracy of 0.983. The experimental outcome stated that the Bi-LSTM-RDA model has appeared as an effective performer over the earlier models. In future, the performance of the Bi-LSTM-RDA model can be improved using lightweight cryptographic techniques to achieve security.
Funding Statement: The authors received no specific funding for this study.
Conflicts of Interest: The authors declare that they have no conflicts of interest to report regarding the present study.
1. N. Krishnaraj, M. Elhoseny, E. L. Lydia, K. Shankar and O. ALDabbas, “An efficient radix trie-based semantic visual indexing model for large-scale image retrieval in cloud environment,” Software: Practice and Experience, vol. 51, no. 3, pp. 489–502, 2021. [Google Scholar]
2. P. Malhotra, L. Vig, G. Shroff and P. Agarwal, “Long short term memory networks for anomaly detection in time series,” in European Symp. on Artificial Neural Networks, Computational Intelligence and Machine Learning, Bruges, Belgium, vol. 89, pp. 89–94, 2015. [Google Scholar]
3. J. Goh, S. Adepu, M. Tan and Z. S. Lee, “Anomaly detection in cyber physical systems using recurrent neural networks,” in Proc. IEEE 18th International Symposium on High Assurance Systems Engineering (HASE), Singapore, pp. 140–145, 2017. [Google Scholar]
4. S. Krishnamurthy, S. Sarkar and A. Tewari, “Scalable anomaly detection and isolation in cyber-physical systems using Bayesian networks,” in Proc. ASME 2014 Dynamic Systems and Control Conf., American Society of Mechanical Engineers, New York, USA, vol. 46193, pp. 1–6, 2014. [Google Scholar]
5. A. Jones, Z. Kong and C. Belta, “Anomaly detection in cyber-physical systems: A formal methods approach,” in Proc. IEEE 53rd Annual Conf. on Decision and Control (CDC), Los Angeles, USA, pp. 848–853, 2014. [Google Scholar]
6. A. Chibani, M. Chadli, S. X. Ding and N. B. Braiek, “Design of robust fuzzy fault detection filter for polynomial fuzzy systems with new finite frequency specifications,” Automatica, vol. 93, pp. 42–54, 2018. [Google Scholar]
7. L. Li, M. Chadli, S. Ding, J. Qiu and Y. Yang, “Diagnostic observer design for T–S fuzzy systems: Application to real-time-weighted fault-detection approach,” IEEE Transactions on Fuzzy Systems, vol. 26, no. 2, pp. 805–816, 2018. [Google Scholar]
8. D. I. Urbina, J. A. Giraldo, A. A. Cardenas, N. O. Tippenhauer, J. Valente et al., “Limiting the impact of stealthy attacks on industrial control systems,” in Proc. of the 2016 ACM SIGSAC Conf. on Computer and Communications Security (CCS), Vienna, Austria, ACM: New York, NY, USA, pp. 1092–1105, 2016. [Google Scholar]
9. A. Kleinmann and A. Wool, “Automatic construction of statechart-based anomaly detection models for multi-threaded industrial control systems,” ACM Transactions on Intelligent Systems and Technology (TIST), vol. 8, no. 4, pp. 1–21, 2017. [Google Scholar]
10. X. Y. Lu, P. Varaiya, R. Horowitz and J. Palen, “Faulty loop data analysis/correction and loop fault detection,” in Proc. of the 15th World Congress on Intelligent Transport Systems, New York, NY, USA, pp. 16–20, 2008. [Google Scholar]
11. N. Zygouras, N. Panagiotou, N. Zacheilas, I. Boutsis, V. Kalogeraki et al., “Towards detection of faulty traffic sensors in real-time,” in Proc. of the 2nd Int. Conf. on Mining Urban Data (MUD), Lille, France, pp. 53–62, 2015. [Google Scholar]
12. S. P. Robinson, “The development and application of an urban link travel time model using data derived from inductive loop detectors,” Ph.D. Thesis, University of London, London, UK, pp. 1–148, 2006. [Google Scholar]
13. Q. Tian, D. Han, K. C. Li, X. Liu, L. Duan et al., “An intrusion detection approach based on improved deep belief network,” Applied Intelligence, vol. 50, no. 10, pp. 3162–3178, 2020. [Google Scholar]
14. S. S. Namini, N. Tavakoli and A. S. Namin, “The performance of LSTM and BiLSTM in forecasting time series,” in Proc. IEEE Int. Conf. on Big Data (Big Data), Los Angels, USA, pp. 3285–3292, 2019. [Google Scholar]
15. A. M. F. Fard, M. H. Keshteli and R. T. Moghaddam, “Red deer algorithm (RDAA new nature-inspired meta-heuristic,” Soft Computing, vol. 24, no. 19, pp. 1–29, 2020. [Google Scholar]
16. M. R. Parsaei, S. M. Rostami and R. Javidan, “A hybrid data mining approach for intrusion detection on imbalanced NSL-KDD dataset,” International Journal of Advanced Computer Science and Applications, vol. 7, no. 6, pp. 20–25, 2016. [Google Scholar]
17. J. Li, Z. Zhao and R. Li, “AI-based two-stage intrusion detection for software defined IoT networks,” IEEE Internet of Things Journal, vol. 6, no. 2, pp. 2093–2102, 2018. [Google Scholar]
18. A. A. Diro and N. Chilamkurti, “Distributed attack detection scheme using deep learning approach for internet of things,” Future Generation Computer Systems, vol. 82, pp. 761–768, 2018. [Google Scholar]
19. Y. Yang, K. Zheng and C. Wu, “Building an effective intrusion detection system using the modified density peak clustering algorithm and deep belief networks,” Applied Sciences, vol. 9, no. 2, pp. 238, 2019. [Google Scholar]
20. Y. Djenouri, A. Belhadi and J. C. W. Lin, “Adapted k-nearest neighbors for detecting anomalies on spatio–temporal traffic flow,” IEEE Access, vol. 7, pp. 10015–10027, 2019. [Google Scholar]
21. O. A. Arqub and Z. A. Hammour, “Numerical solution of systems of second-order boundary value problems using continuous genetic algorithm,” Information Sciences, vol. 279, no. 1, pp. 396–415, 2014. [Google Scholar]
22. Z. H. Hammour, O. A. Arqub, S. Mamoni and N. Shawagfeh, “Optimization solution of troesch’s and bratu’s problems of ordinary type using novel continuous genetic algorithm,” Discrete Dynamics in Nature and Society, vol. 2014, no. 401696, pp. 1–17, 2014. [Google Scholar]
 | This work is licensed under a Creative Commons Attribution 4.0 International License, which permits unrestricted use, distribution, and reproduction in any medium, provided the original work is properly cited. |