DOI:10.32604/iasc.2022.025935
| Intelligent Automation & Soft Computing DOI:10.32604/iasc.2022.025935 | |
| Article |
Automatic Localization and Segmentation of Vertebrae for Cobb Estimation and Curvature Deformity
1Bahria University, Islamabad, 44000, Pakistan
2Bahria University, Karachi, 74800, Pakistan
3National University of Sciences and Technology, Islamabad, 44000, Pakistan
*Corresponding Author: Joddat Fatima. Email: joddat.fatima@bahria.edu.pk
Received: 09 December 2021; Accepted: 25 January 2022
Abstract: The long twisted fragile tube, termed as spinal cord, can be named as the second vital organ of Central Nervous System (CNS), after brain. In human anatomy, all crucial life activities are controlled by CNS. The spinal cord does not only control the flow of information from the brain to rest of the body, but also takes charge of our reflexes control and the mobility of body. It keeps the body upright and acts as the main support for the flesh and bones. Spine deformity can occur by birth, due to aging, injury or spine surgery. In this research article, we have proposed a new three step framework for analysis of spine deformity where we have introduced vertebrae segmentation as object localization problem. You Only Look Once (YOLO) is utilized for localization of vertebrae, which achieved the mAP of 97.5% for Mendeley dataset and 95.2% for Computational methods and clinical applications for Spine Imaging (CSI) 2016 dataset. In the second step, edge detection, is done by Holistic Edge Detection (HED) and for corner calculation, the Harris method is used. In the final step we calculated the Cobb angle for the deformity analysis. Mean Absolute Error (MAE) is calculated that was found to be less than 0.40° for Mendeley and 0.50° for CSI 2016 dataset. The classification of Lumbar Lordosis with corner point Cobb estimation method achieved an accuracy up to 98.04% for the Mendeley dataset and 81.25% for CSI 2016 dataset respectively. A comparative analysis is done for Cobb estimation and the results showed that the proposed framework has reduced mean error up to 2 degree.
Keywords: Spinal cord; vertebrae segmentation; computed tomography; convolutional neural networks; YOLO; cobb
Central Nervous System performs the core processes that are related to the human brain. The control of all vital operations like information transmission, breathing, heart pumping and even blinking of an eye. The movements of our body are controlled by this nervous system along with maintaining the balance of skeleton structure from head to toe. The CNS consists of two organs; one is the brain and the other is spinal cord. Brain is the control unit of the body, while the spinal cord acts as a connecting road that mainly connects the brain with the rest of the body. It acts as information transmission line, any disruption in information transmission procedure can immediately affect performance of vital organs. The injury and damage in spinal cord not only affect the information system, but the structure of the body is distorted which can lead to paralysis [1]. The spinal cord is from 40 to 50 centimeters in length and its width is between 1–1.5 centimeters. This long-twisted cord contains twisted bunch of nerves and tissues combined with 33 individual, which are small but irregular shaped bones that are stacked over one another. These bones are formally named vertebrae. Between these tiny bones, soft mushy substance is present, which supports the tube-like structure to bend and turn. These vertebrae are uniformly arranged and further divided into multiple regions as shown in Fig. 1.
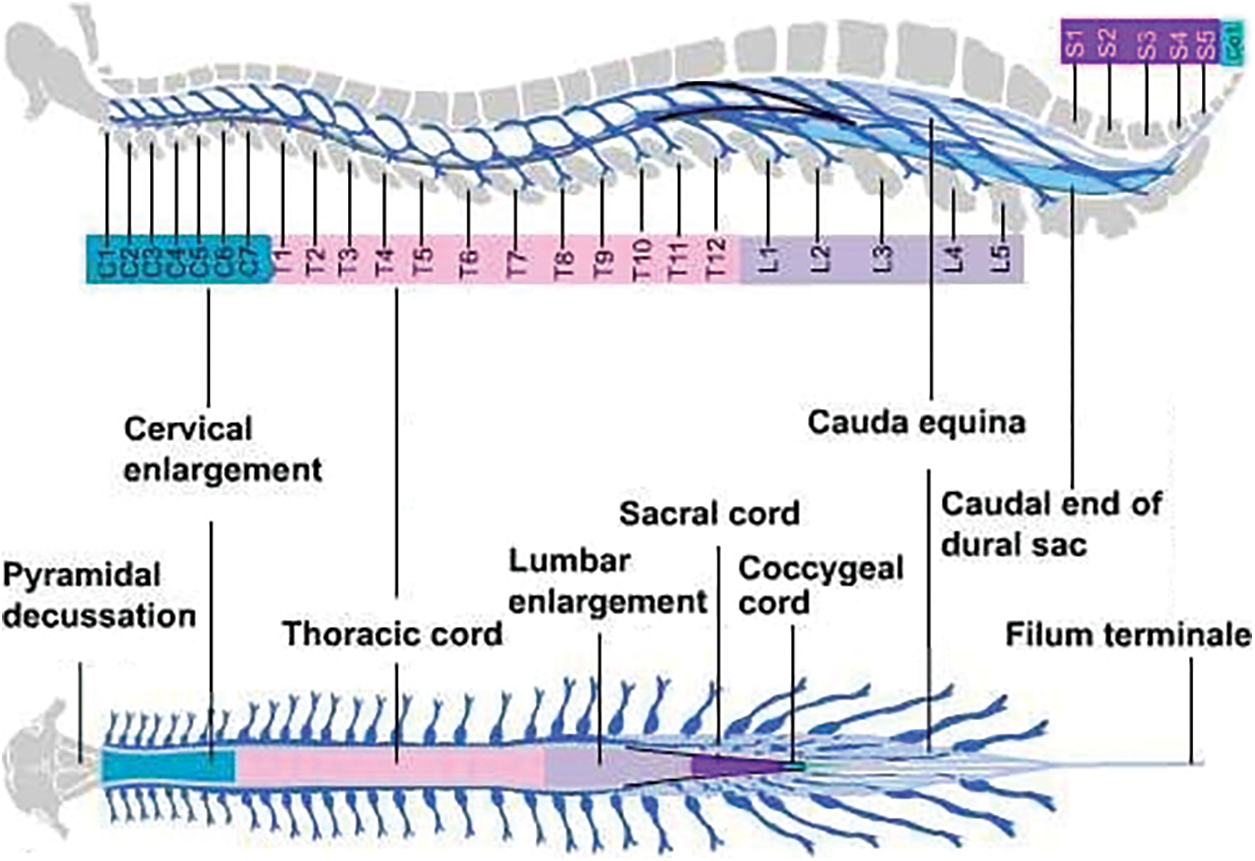
Figure 1: External anatomy of spinal cord [2]
The first one is cervical neck (C1-C7), the second one is thoracic mid-back (T1-T12) and the third and last region is the lumbar lower back (L1-L5). The fourth region is the sacrum (S1-S5) that is connected to the spine with hip structure, while the final fifth one is the coccyx region with single vertebrae (Co1) that acts as a tailbone. Fig. 1 shows the external structure of whole spinal column, along with its division in 5 sections [1,2]. The diagnosis of spinal curvature disorders can be done though physical examination or by neurological evaluations. But, the most common and reliable method is from visualization of the spinal cord, through digital images. The regular symptoms that indicates spinal problems mainly include back ache, immense sweating, weight loss, weakness, loses of senses, muscular numbness, muscular swelling, change in bladder pattern, compromised reflexes and paralysis. These symptoms may appear due to some infectious bacteria, trauma injury, vascular blockage, fracture, inter-vertebral disk problems or even tumors [3]. In this research study, we focused on the spinal postural deformity, which is region-based and is categorized into three types: Scoliosis, Kyphosis and Lordosis. To address this problem, our main goal is to support the clinical specialist, to identify the area of the spine that is affected.
Scoliosis commonly occurs during the growing age and erupts before puberty. At the initial stage, if it is deformed up to 10 degrees, it is considered to be a mild category. But with the passage of time, it can get severe as the child grows [3]. Scoliosis is further divided into three stages on basis of age and growth 1. Infantile (from birth to 3 years), 2. Juvenile (from 4 to 9 years) and 3. Adolescent (from 10 to 18 years). Kyphosis is generally referred to the overelaborate hunch-back from the cervical region of the spinal cord. In simple words, it is the slouching posture deformity from neck to shoulder. The common symptoms are stiffness, fatigue, back ache, breathing difficulties, chest pain and digestion problems. An increase in severity of Kyphosis, can cause disfiguring that further leads to fracture, disk-generation, osteoporosis and cancer. If the lower lumber pelvic curve, which lies above the buttocks, excessively arches inwards, the deformity is termed as Lordosis. The causes of Lordosis might be bad posture, spine surgery, genetics, congenital, injury and neuro-muscular problems, pelvis, or hip illness. Treatment of Lordosis depends upon its severity. In mild cases, one can improve their condition with bracing spine, physiotherapy and exercises. Excess in the arches of the curve is treated with surgery. Fig. 2 presents all the types of curvature deformities.
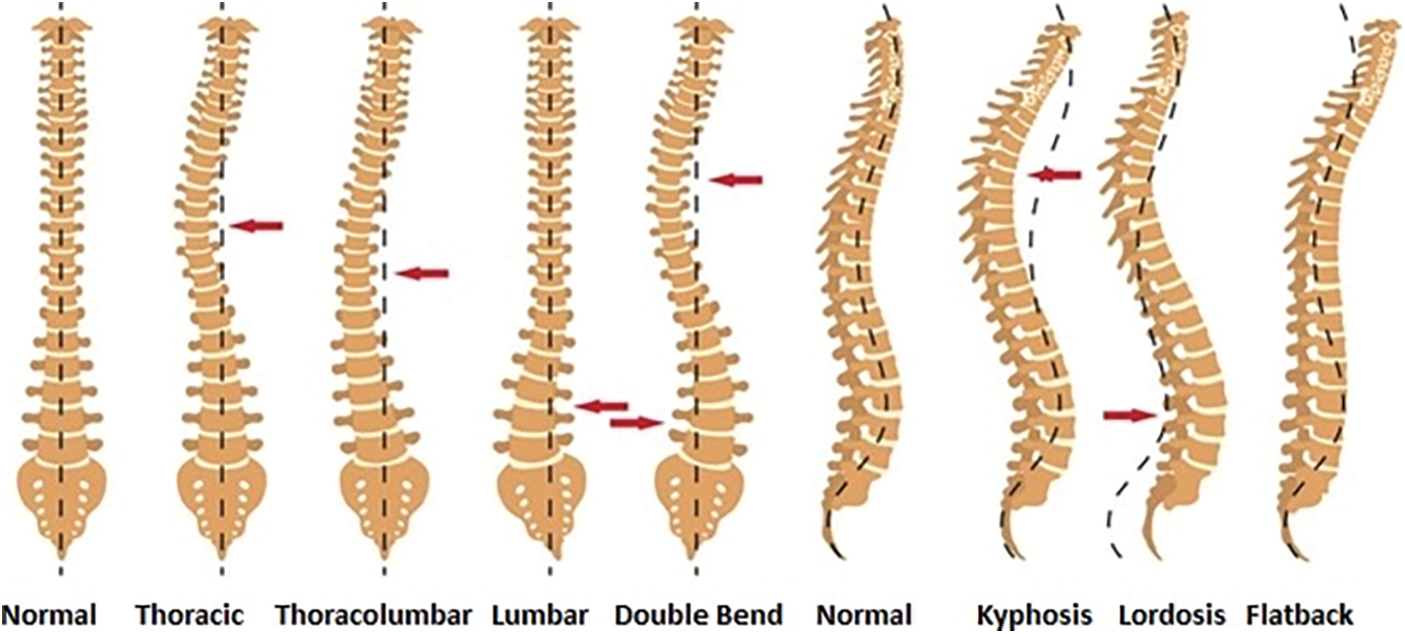
Figure 2: Spine deformity types in anterior and lateral view [4]
In this study, we are proposing a fully automated method for localization of vertebrae and Cobb angle calculation for analysis of deformity in curvature. Input scans are entered into the localization module where predicted vertebrae bounding boxes are detected out of these selected Region of Interests (ROIs) are determined that are L1, L5 and S1. These ROIs are forwarded to edge detection and corner point's identification module. Lastly, Cobb estimation is carried out to classify the lordosis into hypo, hyper and normal categories. In the next section of paper literature review is presented on the segmentation of vertebrae. The third and fourth section explains the proposed methodology and dataset details. Fifth section of paper demonstrates the experimental results section. The final section presents the conclusion.
The significance of the spinal cord and curvature has been already elaborated in the above section. Clinically, physical examination is done for diagnosis of dis-proportionality in spine. Another way of diagnosis is through neurological evaluations. The most common method for diagnosis is with the help of radio-graphic images. The researchers have selected this medium of diagnosis using x-Ray, Computed Tomography (CT) and Magnetic Resonance Imaging (MRI) imaging modalities. The literature section is divided into two sub-sections. The split is created on the basis of vertebrae segmentation and Cobb calculation. The research in these domains revolve around different architectures of Convolutional Neural Networks (CNN). These CNN architectures have produced good results and the articles have used dice similarity coefficient as an evaluation metric for results.
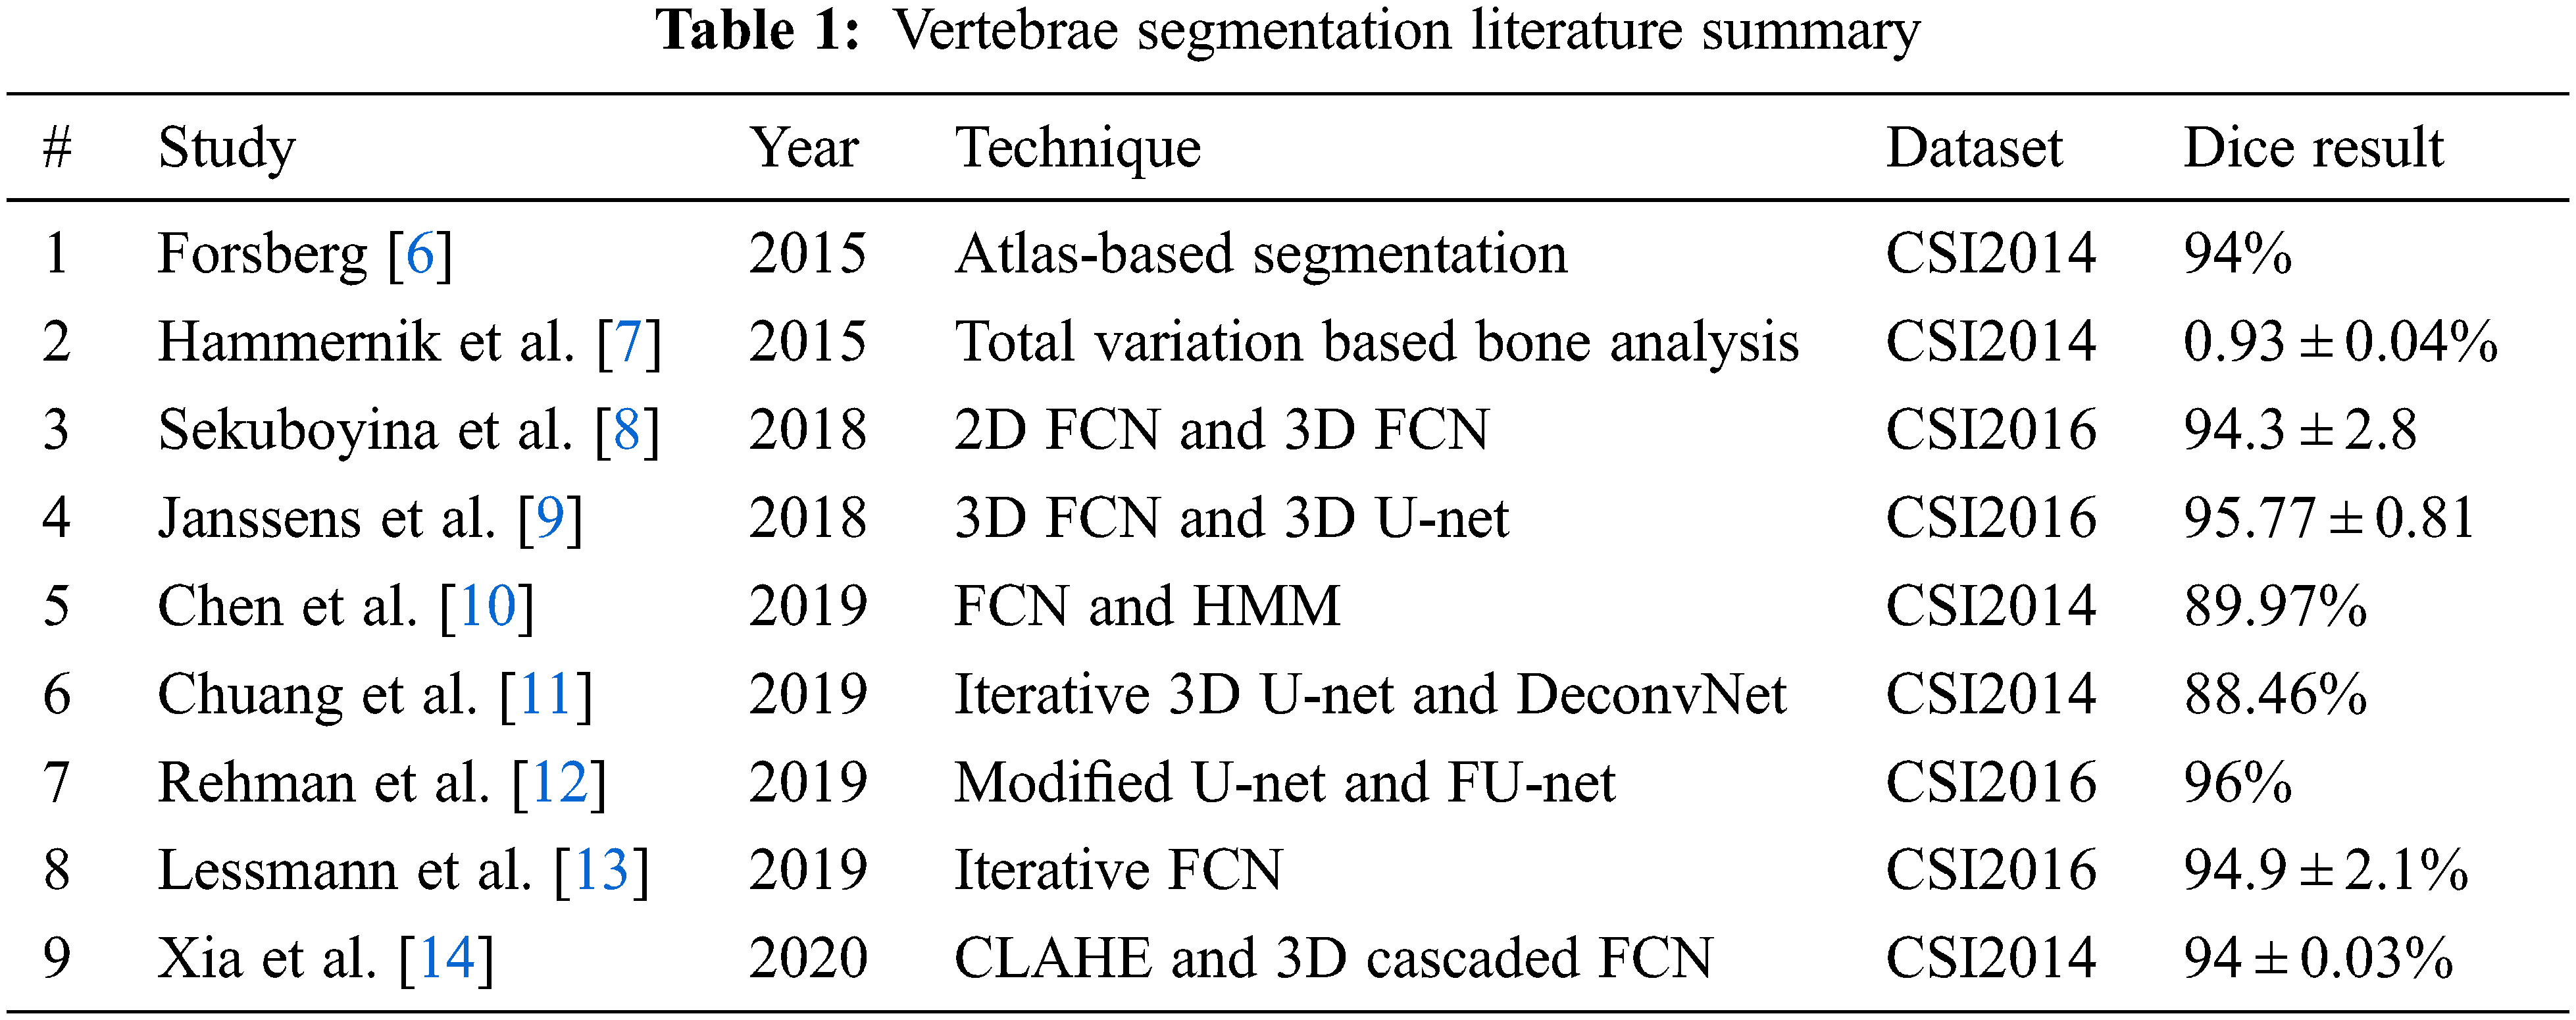
In [5], a comparative study on the 5 best techniques to evaluate the performance of vertebra segmentation methods on the CSI 2014 dataset is discussed. Forsberg [6] has achieved the highest dice up to 0.94. The author presented an Atlas-based segmentation of the thoracic and lumbar vertebrae. The segmentation method is based upon an atlas-based scheme, where the sub volume is extracted from dataset. With the help of these sub volumes, spine atlases are registered. To get the final segmented results, the local phase difference is minimized and label fusion is applied for deformed atlases.
Hammernik et al. [7] achieved a dice similarity coefficient of 0:93 ± 0:04. They have introduced a Total Variation (TV) based bone shape analysis framework. The method requires prior information regarding mean shape model and bone probability map. This information is obtained from the input image intensity. Active contour segmentation is carried out from this prior information incorporation with edge-based information. Sekuboyina et al. [8] in 2018 presented accurate segmentation of spine using deep learning with dice score of 94.3 ± 2.8%. The methodology is divided into two stages. In first stage, 2D Fully Convolution Network (FCN) is utilized providing low-resolution patches that are localization of spinal column. The second stage uses another 3D FCN model with heatmap slices, which produces high-resolution binary segmentation. Results of both models are fused and deliver the segmented volumes of spine.
In [9] Janssens et al. have presented an approach that addresses automatic segmentation of vertebrae. Their approach relies upon 3D FCN. In training phase, the model produces the bounding boxes of the lumbar region. Later, a 3D U-net is used for pixel-wise multi-class segmentation. The evaluation of data has achieved an average dice of 95.77 ± 0.81%. In 2019 Chen et al. [10] used a dataset of MICAAI Challenge 2014 and mean identification rate of 87.97% was found. Initially, the fully convolutional neural network is used for the training and identification of vertebra center points. FCN is again used for gathering both local and global information. This second network handles classification and indexing of vertebrae. To improve robustness, the authors also adopted post-processing strategy where the Hidden Markov Model is imposed.
In [11], emphasis on the paradigm of deep learning in medical images for vertebral segmentation and detection of abnormalities. Chuang et al. suggested an iterative 3D U-Net and DeconvNet model, which segments vertebrae. xVertSeg CSI 2014 dataset is used and average dice attained is 88.46%. In [12], Rehman et al. have discussed the accurate segmentation of vertebrae using region-based deep learning framework. They presented a modified form of U-Net, which also caters to region-based variation levels. In addition to that, FU-Net framework is used for shape prediction. The iterative technique refines the results of the region-based model for shape analysis of vertebral bone. Their approach delivers an average dice score of 96% on both CSI 2016 and CSI 2014 datasets.
Lessmann et al. [13] proposed an iterative approach for segmentation of vertebra. The researchers have split their methodology into 4 levels. Level 1 segments voxels from a 3D patch while level 2 utilizes instance memory. Levels 3 and 4 identify and classify sub-network. The average dice score achieved in segmentation is 94.9 ± 2.1%. Xia et al. in [14] discussed an automatic approach for the segmentation of vertebrae. Contrast Limited Adaptive Histogram Equalization (CLAHE)-Threshold-Expansion was pre-processed to improve the quality of images and it also reduces input voxel points. 3D coarse segmentation FCN and cascaded produce vertebral bodies. Complete multi-vertebrae segmentation and classification. DSC of this methodology is 94.84%.
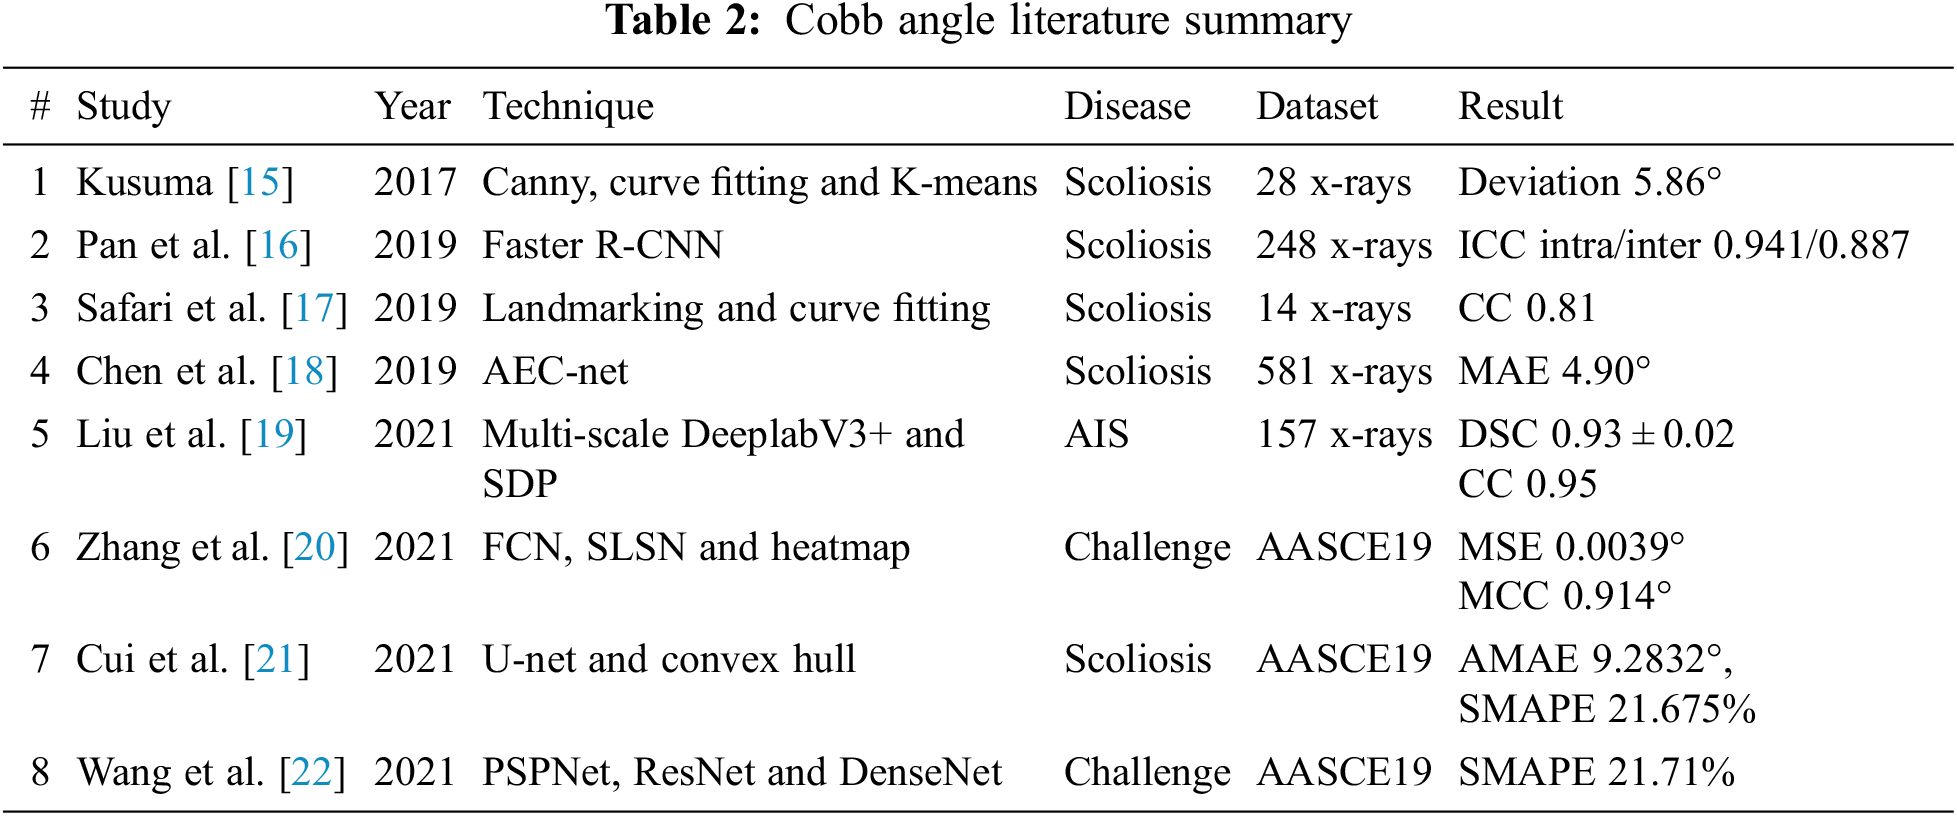
Kusuma [15] addressed the detection of scoliosis using x-Ray images. They pre-processed by converting x-Ray images to grey scale and marked seed locations, then divide image into 12 sub-images. Later, median filtering and canny are applied to get the boundary. After center point calculations, polynomial curve fitting is applied. Cobb estimation from the gradient equation was achieved. Finally, K-Mean clustering played a significant role to determine the scoliosis curve. The average deviation was less than 6 degrees. Pan et al. in [16] have used two Mask R-CNN models separately to detect and segment the spine curve and all vertebral bones on 248 x-Rays. The Cobb angle is measured between superior and interior perpendicular of the cranial and caudal vertebrae. A set of all possible angles is obtained and a maximum angle is considered as the Cobb angle. To assess the reliability and accuracy, two experienced radiologists separately measured the Cobb angle manually. Output results of these models are compared achieving Inter and Intra Class Correlation Coefficients (ICC) 0.941 and 0.887, respectively.
In [17] Safari et al. developed a semi-automatic approach for the estimation of Cobb angle. In the input x-Ray image ROI is extracted using contract-stretching. The complete spine curvature is determined with help of manual land marking. At least one point for each vertebra, 5-th order polynomial curve fitting is applied. Once the morphological curve is determined, in the final phase, the Cobb-angle estimation is carried out by using tangent equation. This equation calculates the angle at the inflection points. The angle lies between two perpendicular lines to the spinal curve. The paper claimed the Correlation Coefficient (CC) between the angle values is 0.81. In paper [18] a new high-precision regression technique, Adaptive Error Correction Net (AEC-Net) is introduced for evaluation of Cobb angle from x-Ray images of spine. The proposed technique has 2 modules: first one is regressing landmark net for boundary features extraction that indirectly supports Cobb angle calculation. The second one is Angle Net for direct approach for Cobb calculation using curve features. The final stage is Error correction Net, which basically estimates both modules output using extrapolation to identify the difference in Cobb angles from both networks. To evaluate the results, 581 spinal anterior-posterior X-ray images are utilized attaining MAE of 4.90 in Cobb angle.
Liu et al. in [19] discussed spinal deformity Adolescent Idiopathic Scoliosis (AIS). In their study, they proposed an automatic algorithm for the vertebrae segmentation using Deeplab V3+ using 157 x-Ray images taken from the public dataset by Digital Image Group in London, Ontario, Canada. The Cobb angle measurements are achieved from the Smallest Distance Point (SDP) method. The performance in the Dice Similarity Coefficient (DSC) is 0.9379 ± 0.0286 and correlation coefficient 0.95. In [20], Zhang et al. discussed spine curvature estimation using non-directional part affinity fields using AASCE 19 dataset. Spinal landmark locations are predicted by using FCN and splitting heatmap channels concerning different vertebra corners. To compute the Cobb angles using landmarks, the basic task is to find the angle between every two vertebrae which is computed from the left and right midpoint of each vertebra. NDPAFs, are being proposed method to handle the landmarks which are not paired. For segmentation, Spinal Landmarks Segmentation Network (SLSN) is applied and to decrease the complexity ShuffleNet structures are used. Cobb estimation technique is selected from literature named as Structured support vector regression. The evaluation results are MSE 0.0039 Mean Correlation Coefficient (MCC) 0.914 respectively.
Cui et al. in [21] attained the Cobb results, Average Mean Absolute Error (AMAE) up to 9.2832° and the symmetric mean absolute percentage error (SMAPE) till 21.675% using AASCE 19 dataset of x-Ray images. The authors utilized the U-Net network for segmentation of target area, in combination with convex hull algorithm for corner detection. Cobb estimation is done using traditional method, firstly to determine the marginal vertebrae of Scoliosis, from the upper and lower vertebrae with the largest inclination angle. A straight line is placed adjacent to the upper endplate of the upper vertebra and the lower endplate of the lower vertebra. The Cobb angle is the angle between these two straight lines. Comparison of automated spinal curvature estimation algorithms is using AASCE 19 dataset in paper [22]. Wang et al. evaluated top eight methods of MICCAI Challenge from 12 teams. The best performing method achieved a SMAPE of 21.71%. In the first phase, PSPNet is used to segment vertebral bodies and inter-vertebral space after that ResNet-101 is applied for feature extraction. In the second phase, the Tencent team used almost all of recent popular architectures, such as ResNet, DenseNet and EfficientNet to accomplish regression tasks and with a combination of all their proposed framework achieved better results, as compared to other teams.
According to the literature, it is assessed that the segmentation of vertebrae with deep learning approaches is one of the prominent strategies for analysis regarding dis-proportionality. Tab. 1 indicates that for CSI datasets, utilized modified versions of U-Net and FCN were mostly used for segmentation. In the Cobb angle, literature Tab. 2 depicts that traditional Cobb techniques with different versions were used for mainly the diagnosis of Scoliosis. All this indicates that the researchers are working in a similar direction. Although, these CNN frameworks are providing semantic information with less processing. But the gaps found in the literature are the use of similar road for segmentation and Cobb calculation. To fill these gaps, experiments with new-fashioned object instance detection techniques. In recent times, the novel concept of object detection is introduced which formulates a tidy bounding box to extract ROI. In the object detection block, it detects the object inside the whole image at one glance and generates region proposals. It quickly produces contextual information and avoids false positives in results. Instead, to segment the whole spine, only edges can give corner information. However, it is essential to mention here that only L1, L5 and (sacrum) S1 are required for Cobb angle calculation.
In this research our main contributions are:
• We have introduced vertebrae localization as an object detection problem, rather than a segmentation to handle low contrast areas with more reliability.
• The hybrid procedure is presented to complement localized vertebrae using HED architecture and Harris for vertebra corner point detection.
• Automated extraction of specific vertebrae L1, L5 and S1 for Cobb estimation.
• Comparative analysis of Cobb estimation techniques for accurate curvature classification.
• A fully automated technique is presented for the diagnosis of lumbar lordosis.
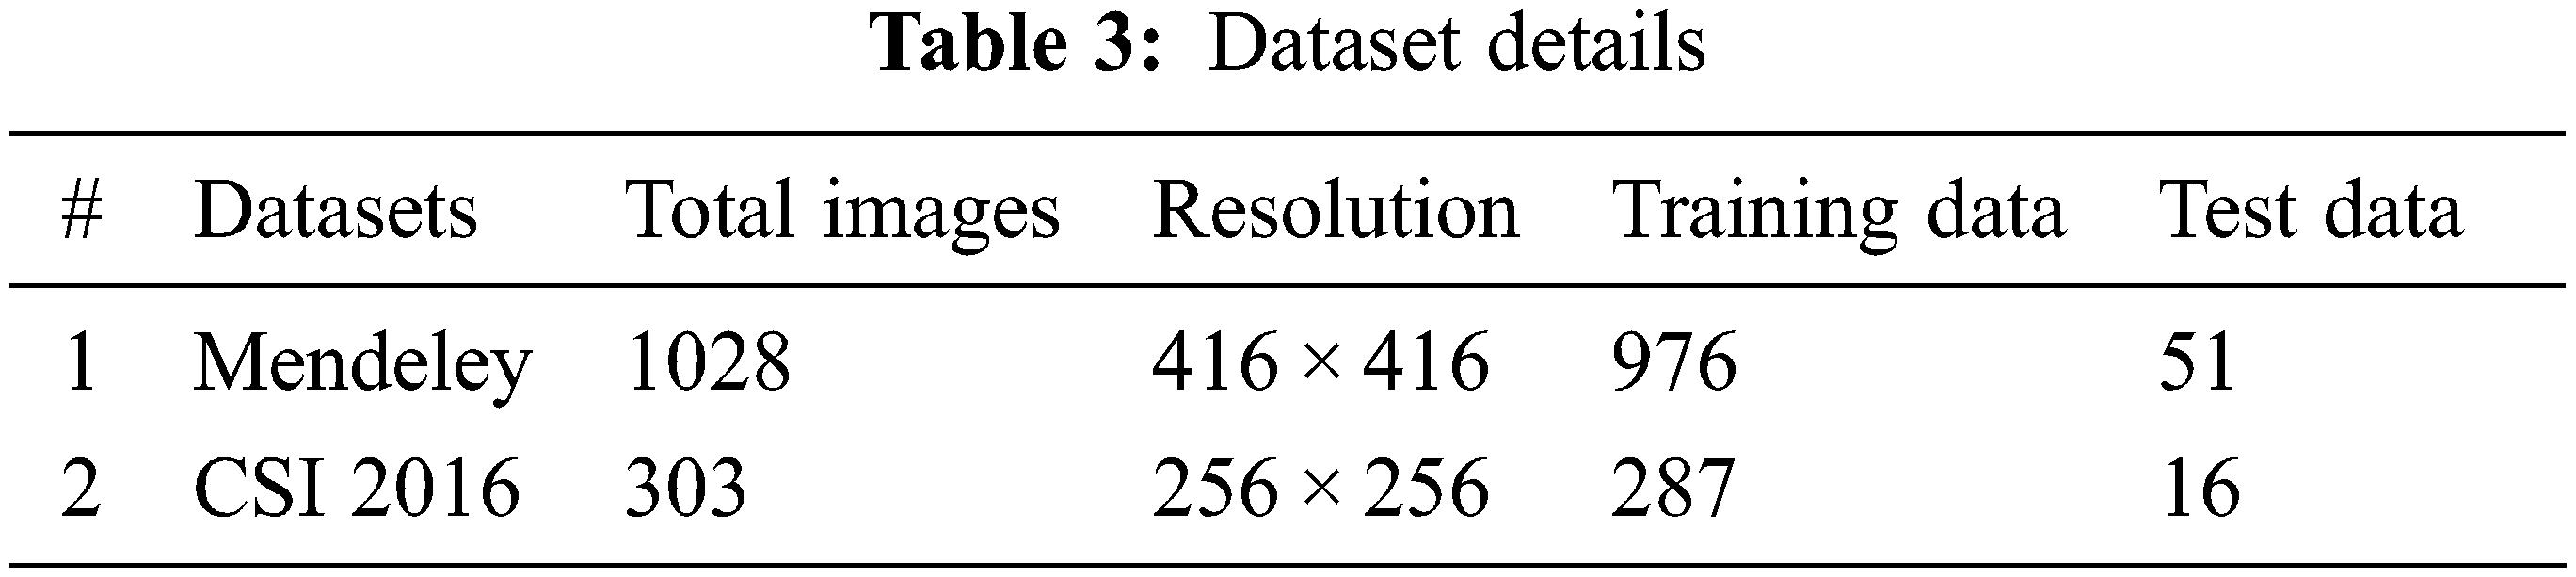
In this research, Mendeley and CSI 2016 datasets are utilized for the experimentation. Data-set details are discussed in this section. The Computational Methods and Clinical Applications for Spine Imaging (CSI) conducted a challenge and produced a dataset in the year 2016 of a sagittal view of lumbar spine CT images. The publicly available training data is divided into 2 splits of training and testing. Input images size is processed and set as 256 × 256. An expert radiologist examined the cases and manually marked the fracture sites [23]. Fig. 3 shows the original images of CSI 2016 datasets. Tab. 3 shows the dataset details with total number of images, along with its resolution. The division of training and testing images is also presented. Data augmentation involved noise addition, horizontal flip, rotation, shearing and cropping which increased the total number of images. For data labelling LabelMe and Roboflow tools were used. The naming convention of labelled images as set the same as original images.
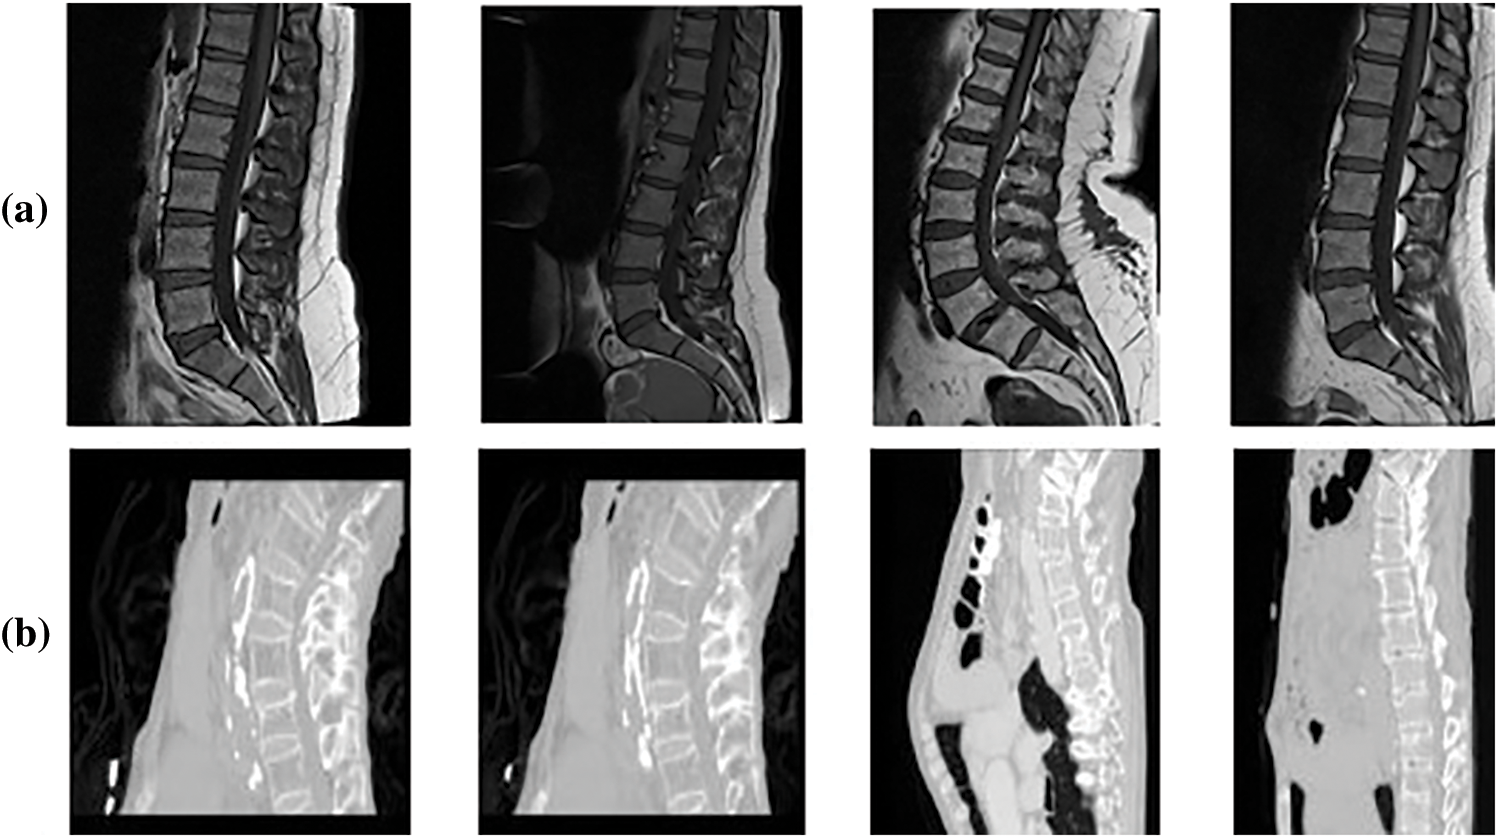
Figure 3: Sample dataset images (a) Mendeley MRI scans (b) CSI 2016 CT scans
This data was published in 2019 with the contribution of [24], containing MRI scans of 575 patients who have symptomatic back pain in sagittal or axial view. The dataset was provided with the support of Universitas Multimedia Nusantara, Liverpool John Moores University. There are a total of 48,345 MRI slices in this dataset with an image resolution of 320 × 320 and 320 × 310 respectively. The image format of MRI scans is .png. Before use images are resized to 416 × 416. Total 514 images were selected and 61 were discarded.
5th International Workshop and Challenge, held in Conjunction with MICCAI 2018, Granada, Spain, September 16, 2018 [25]. CSI2016 dataset has 25 thoracolumbar spine CT scans acquired at a resolution of between 1 and 0.35 mm with Hologic Discovery A DXA scanner, the images are provided in both bmp and .vtk formats with total of 303 scans.
The research study proposes a fully automated model for vertebrae localization and Cobb angle estimation for curvature analysis. The flow of research starts with input scans. These scans are then the scans are passed to localization block which gives bounding boxes of predicted vertebrae. From all predicted vertebrae the star categories are selected as ROI that are L1, L5 and S1. Later, these star vertebrae are passed for edge detection and corner point's identification. At the end with help of corner point values Cobb estimation is carried out. In addition to this, two approaches for Cobb calculation will be applied for comparison of Cobb techniques. These Cobb angles will be later used to classify the lordosis into hypo, hyper and normal categories. The whole methodology procedure is shown in Fig. 4.
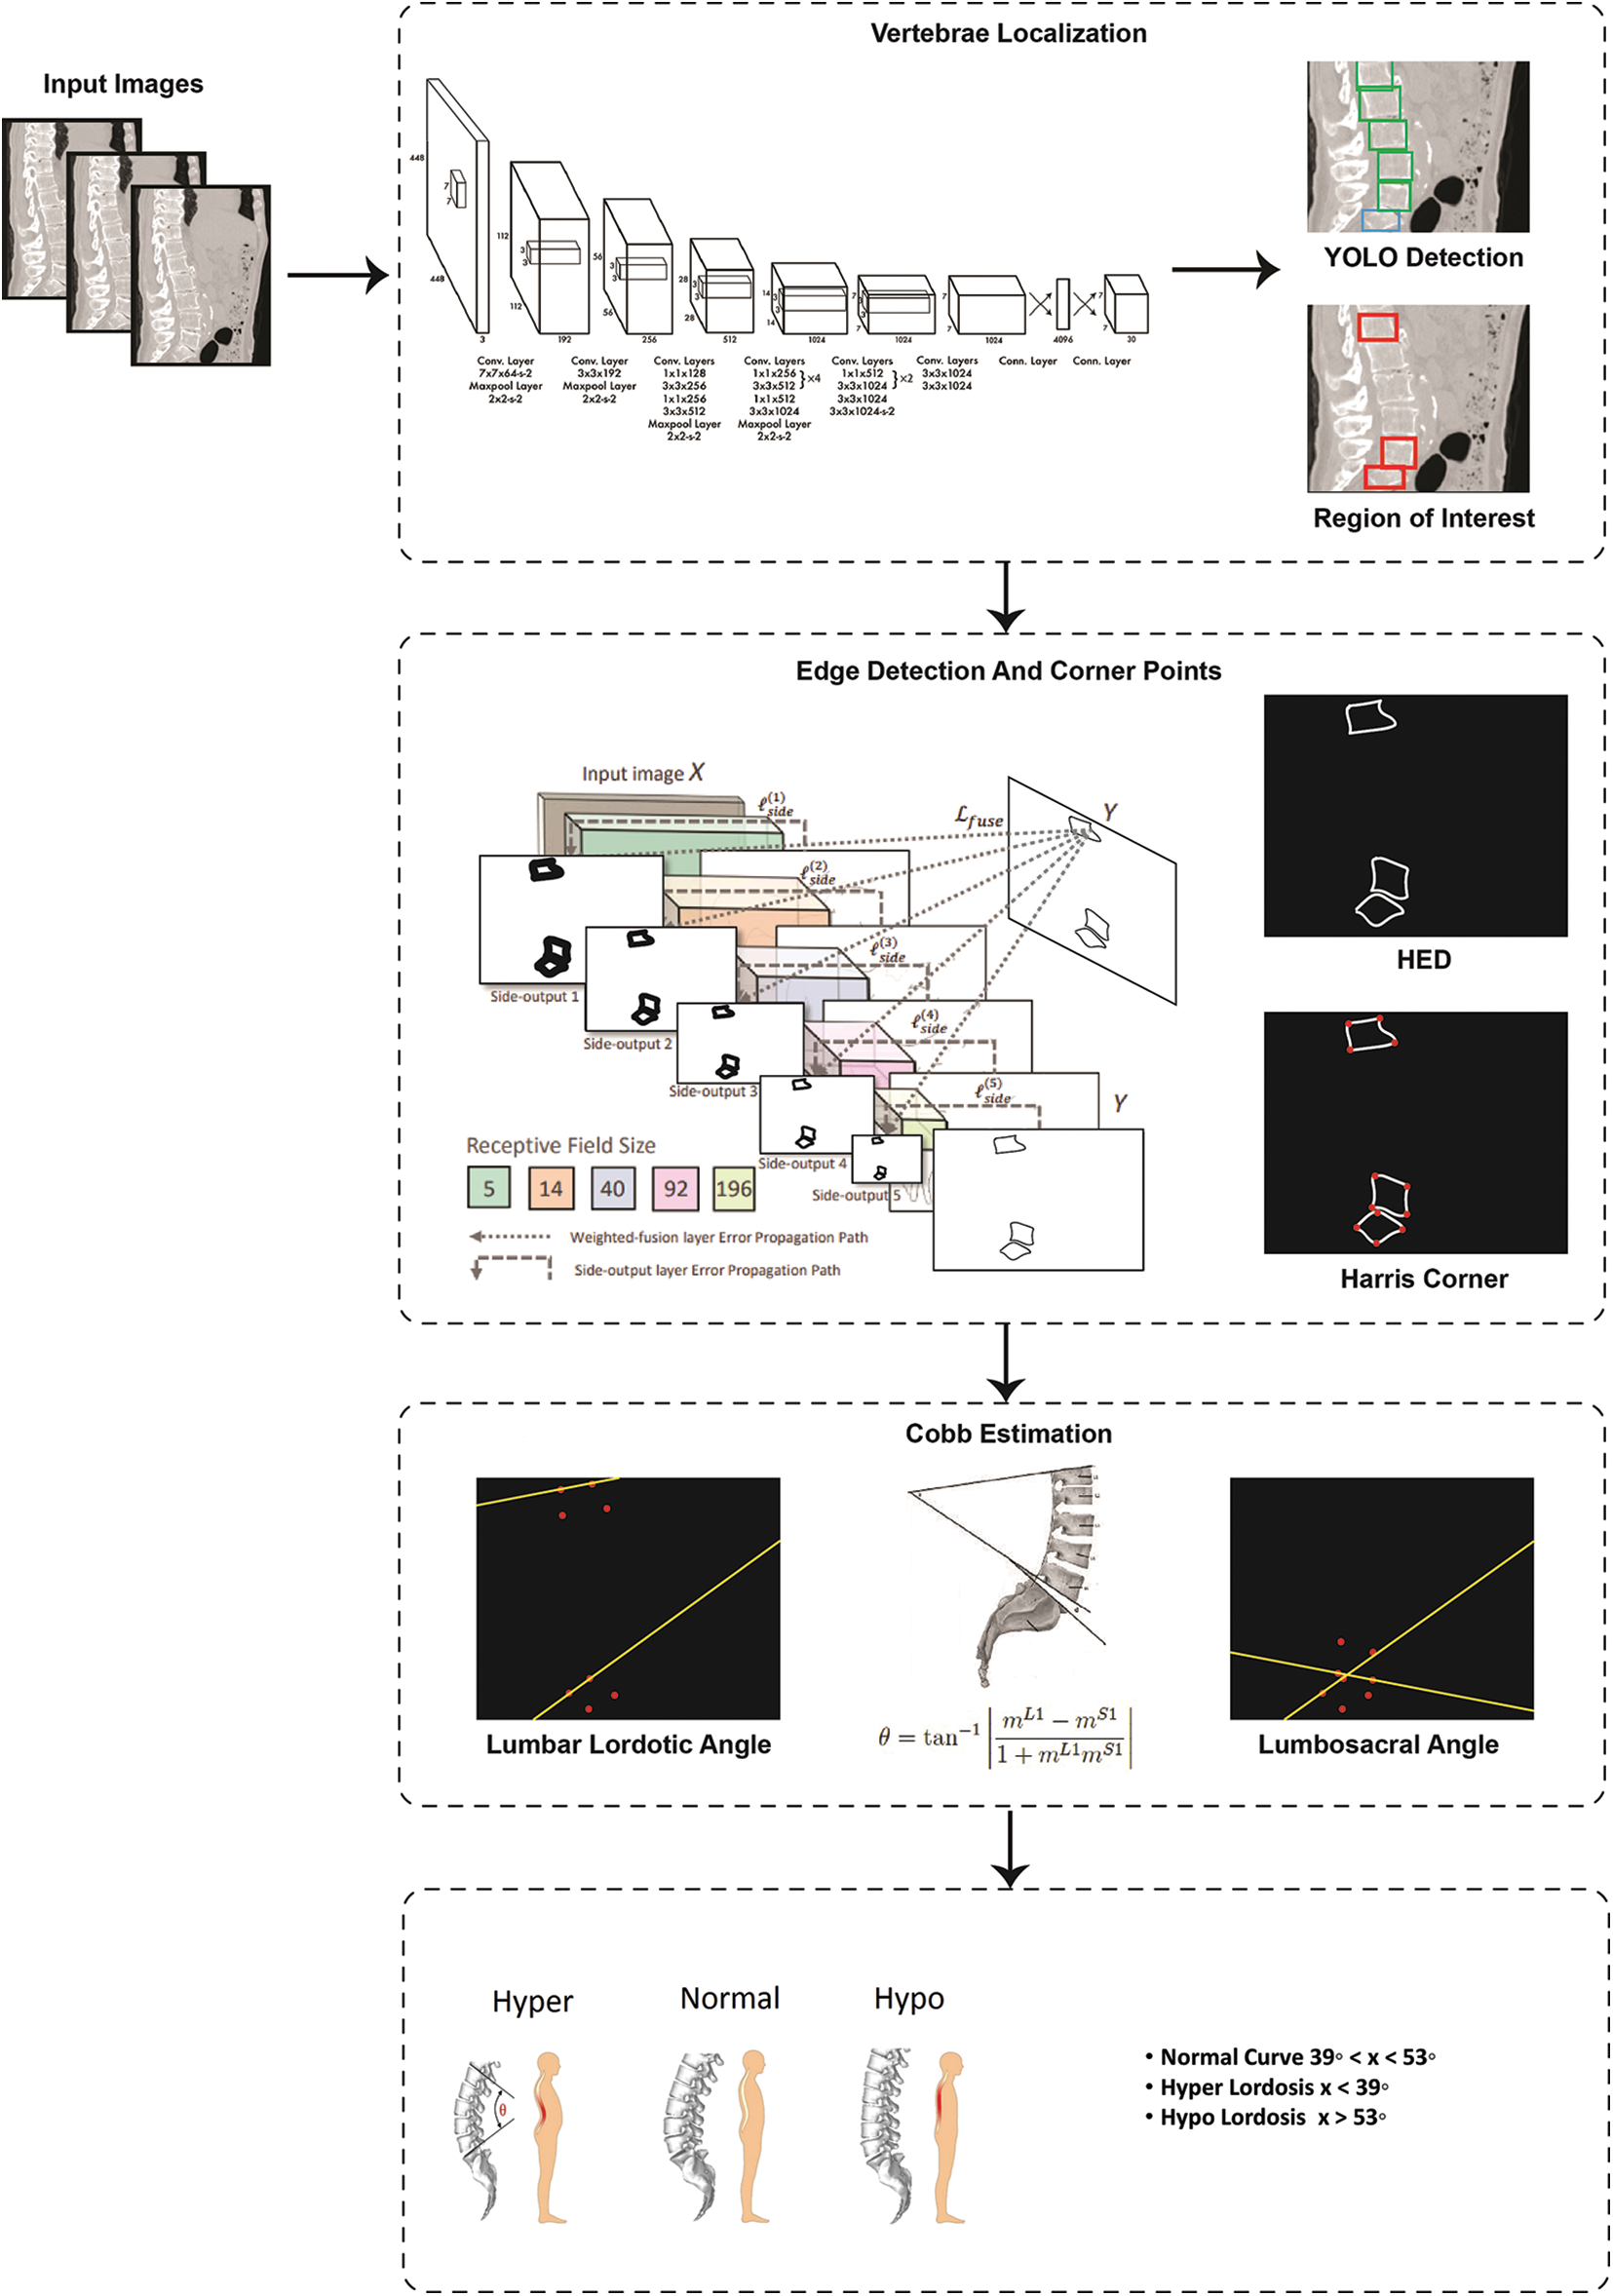
Figure 4: Flow diagram of proposed system
In spinal imaging, precise localization of vertebrae is a difficult task. Assessment regarding spinal disease and its diagnosis, along with pre-planning of surgical intervention and post-surgical inspection all these depend upon the vertebrae localization. The major difficulties that arise in automatic vertebrae detection are due to its smaller size and irregular bone structures. In our proposed technique for the localization block, we have selected the latest approach of object detection which is discussed below.
YOLO stands for You Only Look Once, a clever concept instead of semantic segmentation using a convolution neural network. The method initially considers the whole image to explores what object lies in the image taking it as a classification problem. In the second step it allows to detecting of the object. In the final step, it formulates a bounding box around that detected object. The architecture analyses the features for object prediction. YOLO [26] framework formulates a grid of size S × S and divides the input image in multiple grids. It evaluates each grid to detect that the center of an object lies inside the grid, if true that grid is considered as predicted object bounding box. There are 5 parameters of bounding box: 1) x coordinate value 2) y coordinate value 3) w width relative to the entire image 4) h height relative to the entire image and 5) c confidence score. Here confidence score is the value calculated from Eq. (1) measuring how sure the framework is that the bounding box contains the object. If there is no object inside the grid, the confidence score is zero. Otherwise, it will be equal to the Intersection over Union (IOU) Eq. (2) which is the ratio between the ground-truth and predicted bounding box [26].
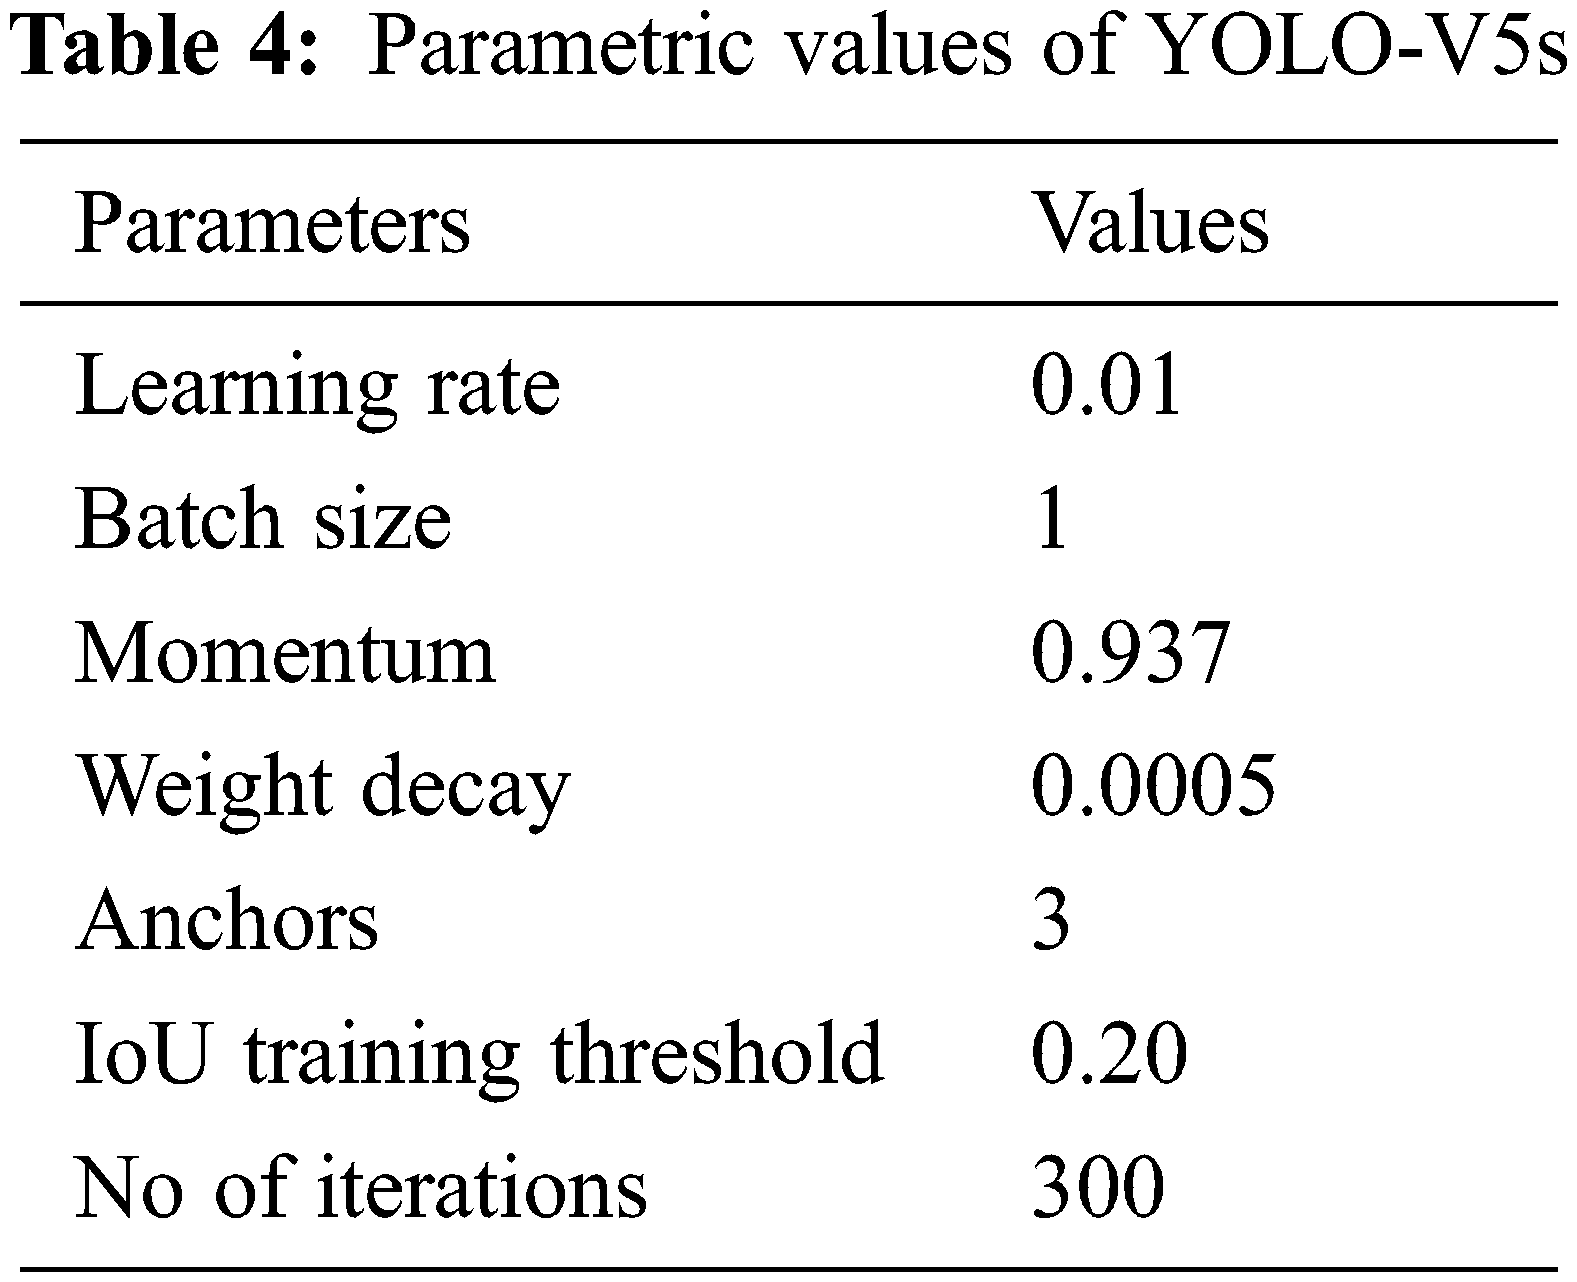
The YOLO architecture is inspired by the image classification model of GoogLeNet. The parametric details are given in Tab. 4. The architecture of YOLO consists of twenty-four convolutional layers subsequently with two fully connected layers. To reduce features space from previous layers, alternative 1 × 1 convolutional layers are used. On the ImageNet classification task, to pre-train the convolutional layers, the resolution is reduced to half and later it is doubled for detection. A fast version of YOLO is also designed, that pushes the boundaries for quick object detection. The fast version of YOLO uses a neural network with nine convolutional layers with lesser number of filters in those layers. Except for the size of the network, all the other training and testing parameters remain the same between other versions. After YOLO localized vertebrae, the center points are calculated by connecting the bounding box diagonals. The intersection of these diagonals is considered as center point of vertebrae.
4.2 Edge Detection and Corner Points
The most common problem in semantic segmentation is the blurriness in boundaries considering the edges as minority pixels. To increase prominence regarding these edges, HED edge detection is used. To calculate Cobb angle, corner point information is required. Therefore, after edge detection, corner points are calculated. Details regarding each step are discussed below.
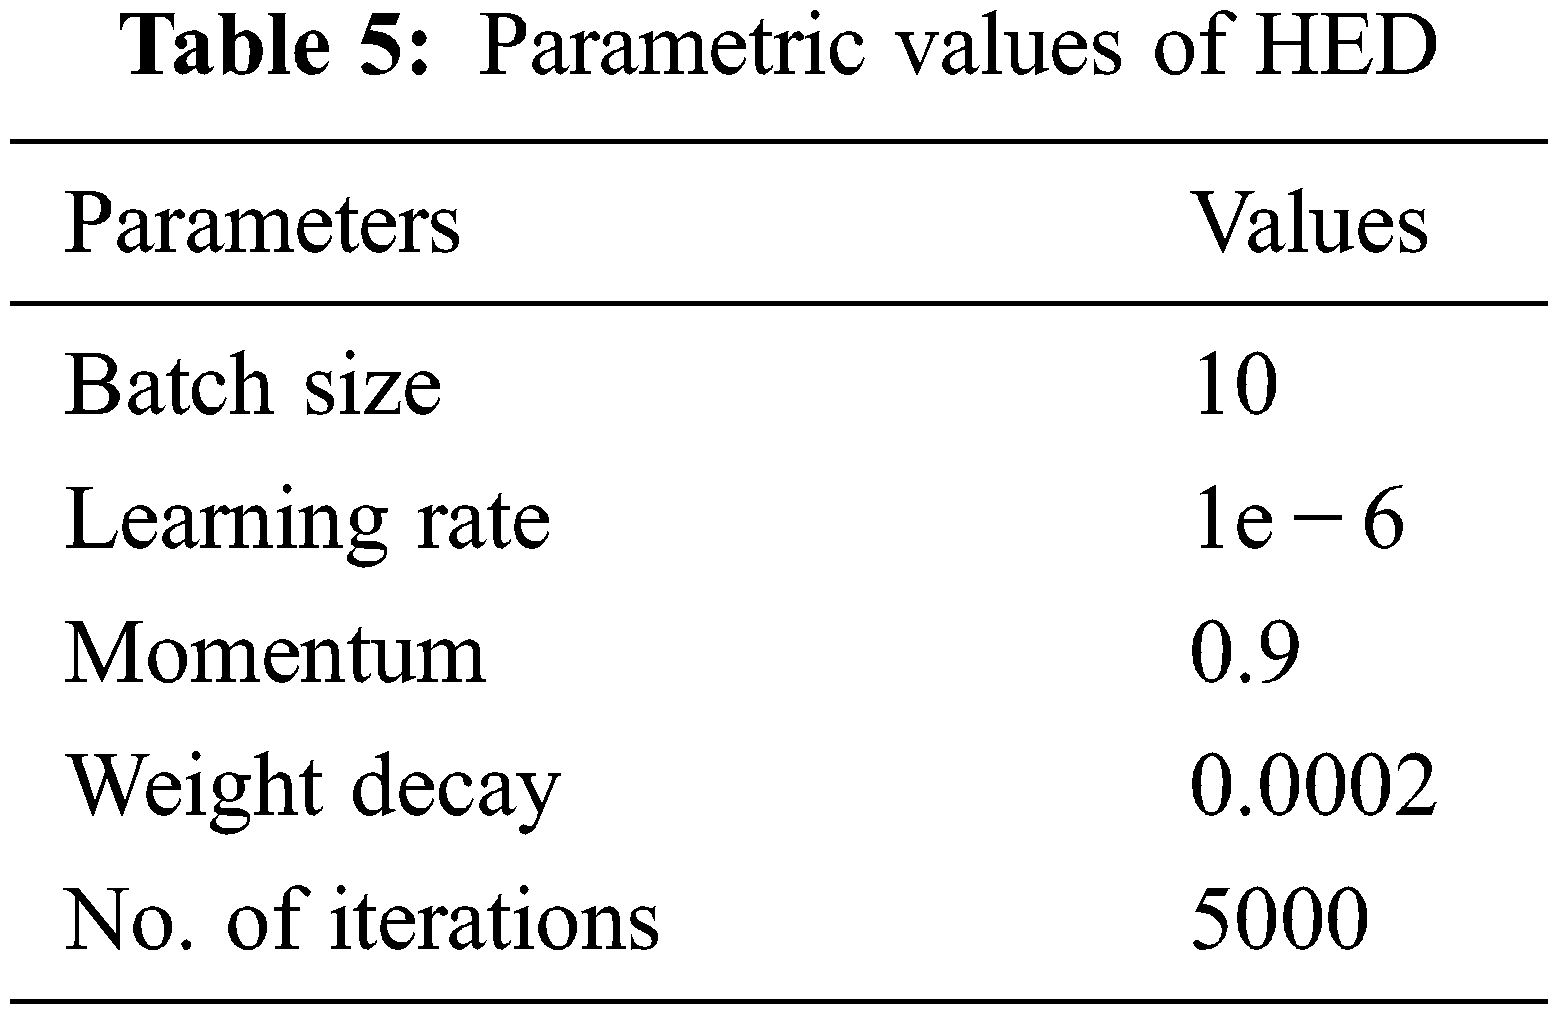
Xie et al. in [27] introduced a simple approach of the nested network which can deliver predictions from multi-scales. Their proposed technique automatically learns the hierarchical features that are difficult to resolve manually in image edge detection. The term holistic, means that belief of interconnect for modeling structured output which aims to predict edges in an image-to-image fashion. The nested term emphasizes refined edge maps that are inherited. They formulated a lone stream of deep network with outputs of various sides. Their proposed architecture performs supervision in hidden a layer so that it can improve both generalization and optimization for classification tasks in the image. The outputs that have multiple sides also provide the flexibility to incorporate more fusion layers to desire a unified output. Their network is divided into 5 levels, the division takes place on basis of strides 1, 2, 4, 8 and 16, respectively. Due to these different field sizes, all nested networks produce multi-sided outputs. The parametric values of architecture are given in Tab. 5.
It is a noteworthy point to mention here that with the help of YOLO we have extracted a region of interest that contains three-star vertebrae L1, L5 and S1 irrespective of any information regarding the orientation of these vertebrae. We have used the simplest and the most popular corner point algorithm presented by Harris et al. in 1988 [28]. Thus, Harris corner is applied on the Gaussian smoothed images that produce the corner points. These corner points will facilitate for calculation of Lumbar Lordotic Angle (LLA) and Lumbosacral Angle (LSA). To calculate the LLA the angle is calculated between superior endplate of L1 and S1. On the other hand, for LSA, the angle is calculated between the inferior endplate of L5 and the superior endplate S1. The slope of the lines can be calculated from Eq. (3).
here m represents the slope, c1 and c2 are corner points with values of x and y axis. The angle was measured using the expression given in Eq. (4).
mL5 and mS1 are the slope of inferior endplates of L5 and superior endplate of mS1. The same equations can be used to find the slope and angle for LLA.
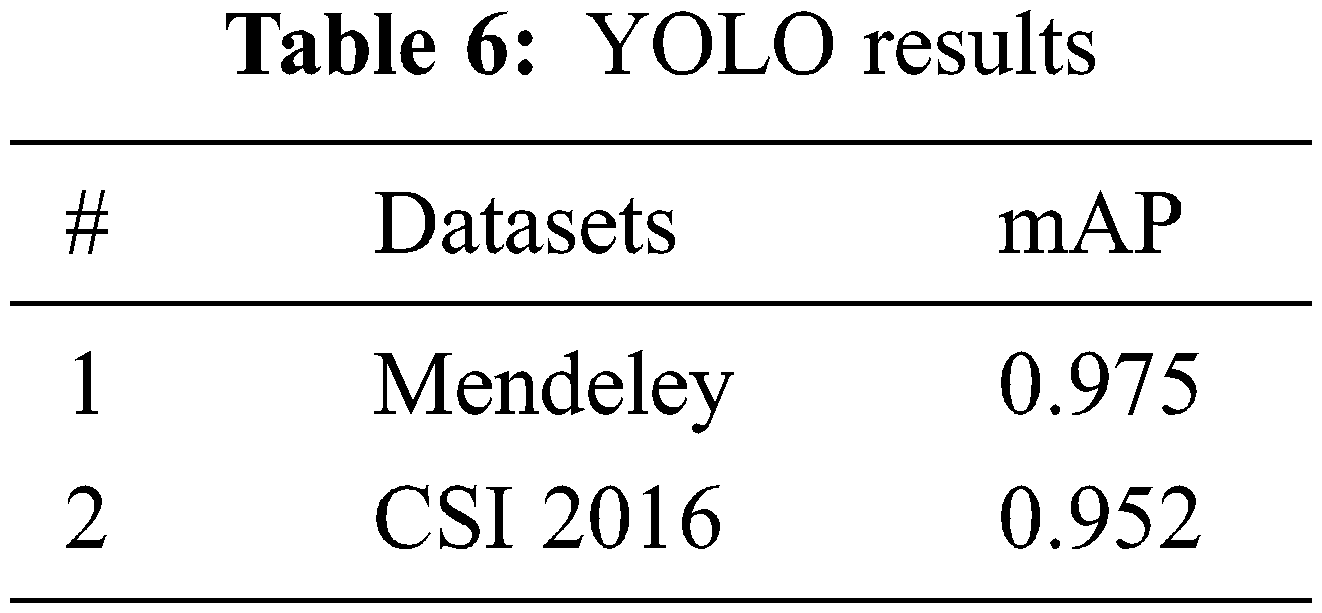
The YOLO models are evaluated based on Mean Average Precision mAP as defined in Eq. (5) and performance is measured using Mendeley and CSI 2016 datasets. Both datasets are publicly available and those are divided into train and test sets as per mentioned in Section 3 and the models are trained and evaluated accordingly. The complete details of the architectures are explained in Section 4. The stats of YOLO for localization against each dataset is presented in Tab. 6.
Here, APk is the average precision of class k and n is the total number of classes.
To verify the YOLO predicted results, the mean and standard deviation of center points from ground truth are calculated for each vertebra. The graph of mean and standard deviation error (pixel-wise distance) is presented in Fig. 5.
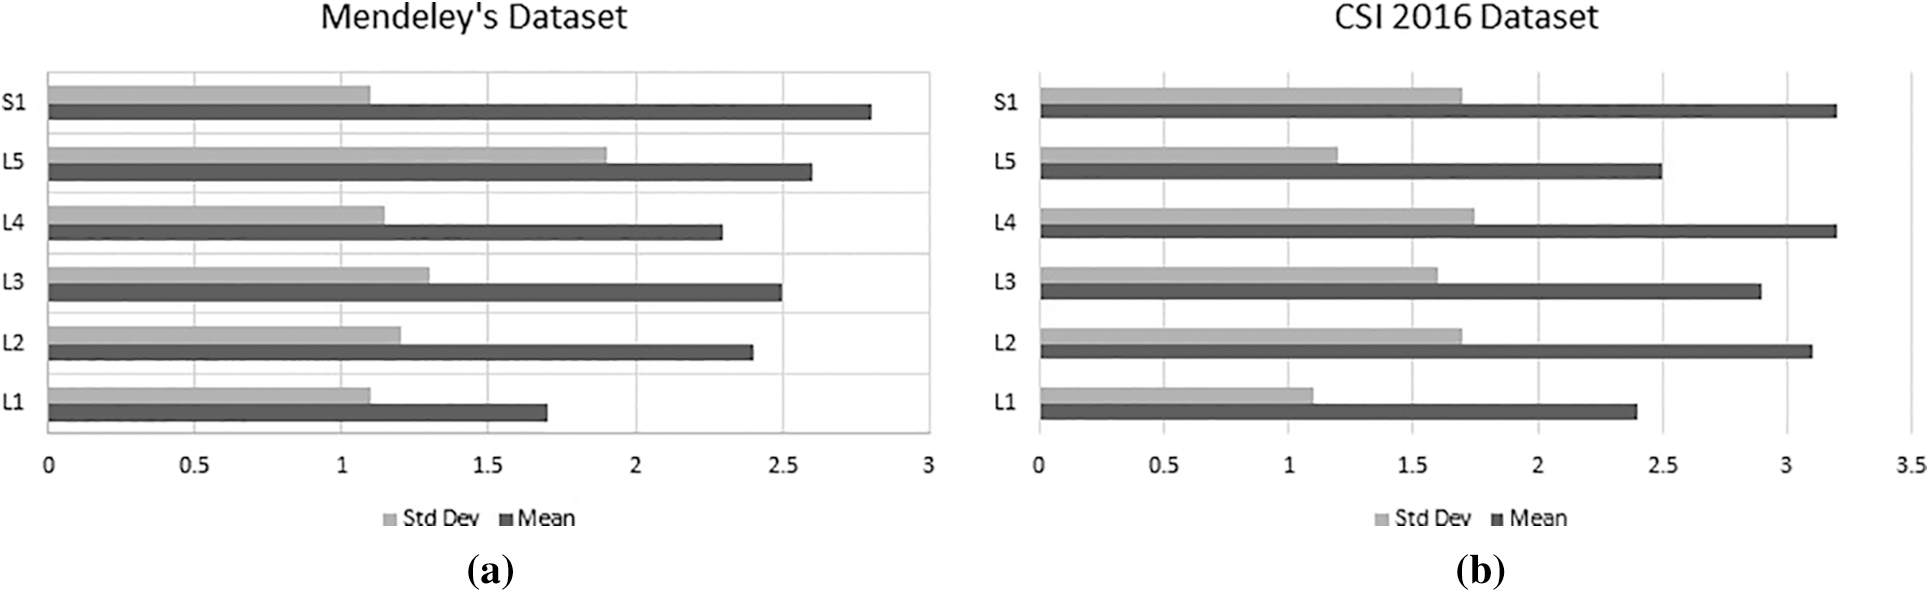
Figure 5: Mean and standard deviation error of (a) Mendeley's dataset and (b) CSI dataset
To further elaborate the robustness of our proposed framework, noise based results of YOLOv5s are illustrated in Fig. 6. We have added Gaussian and Salt & Pepper noise for the experimentations. The results clearly shows an outstanding performance of YOLO architecture.
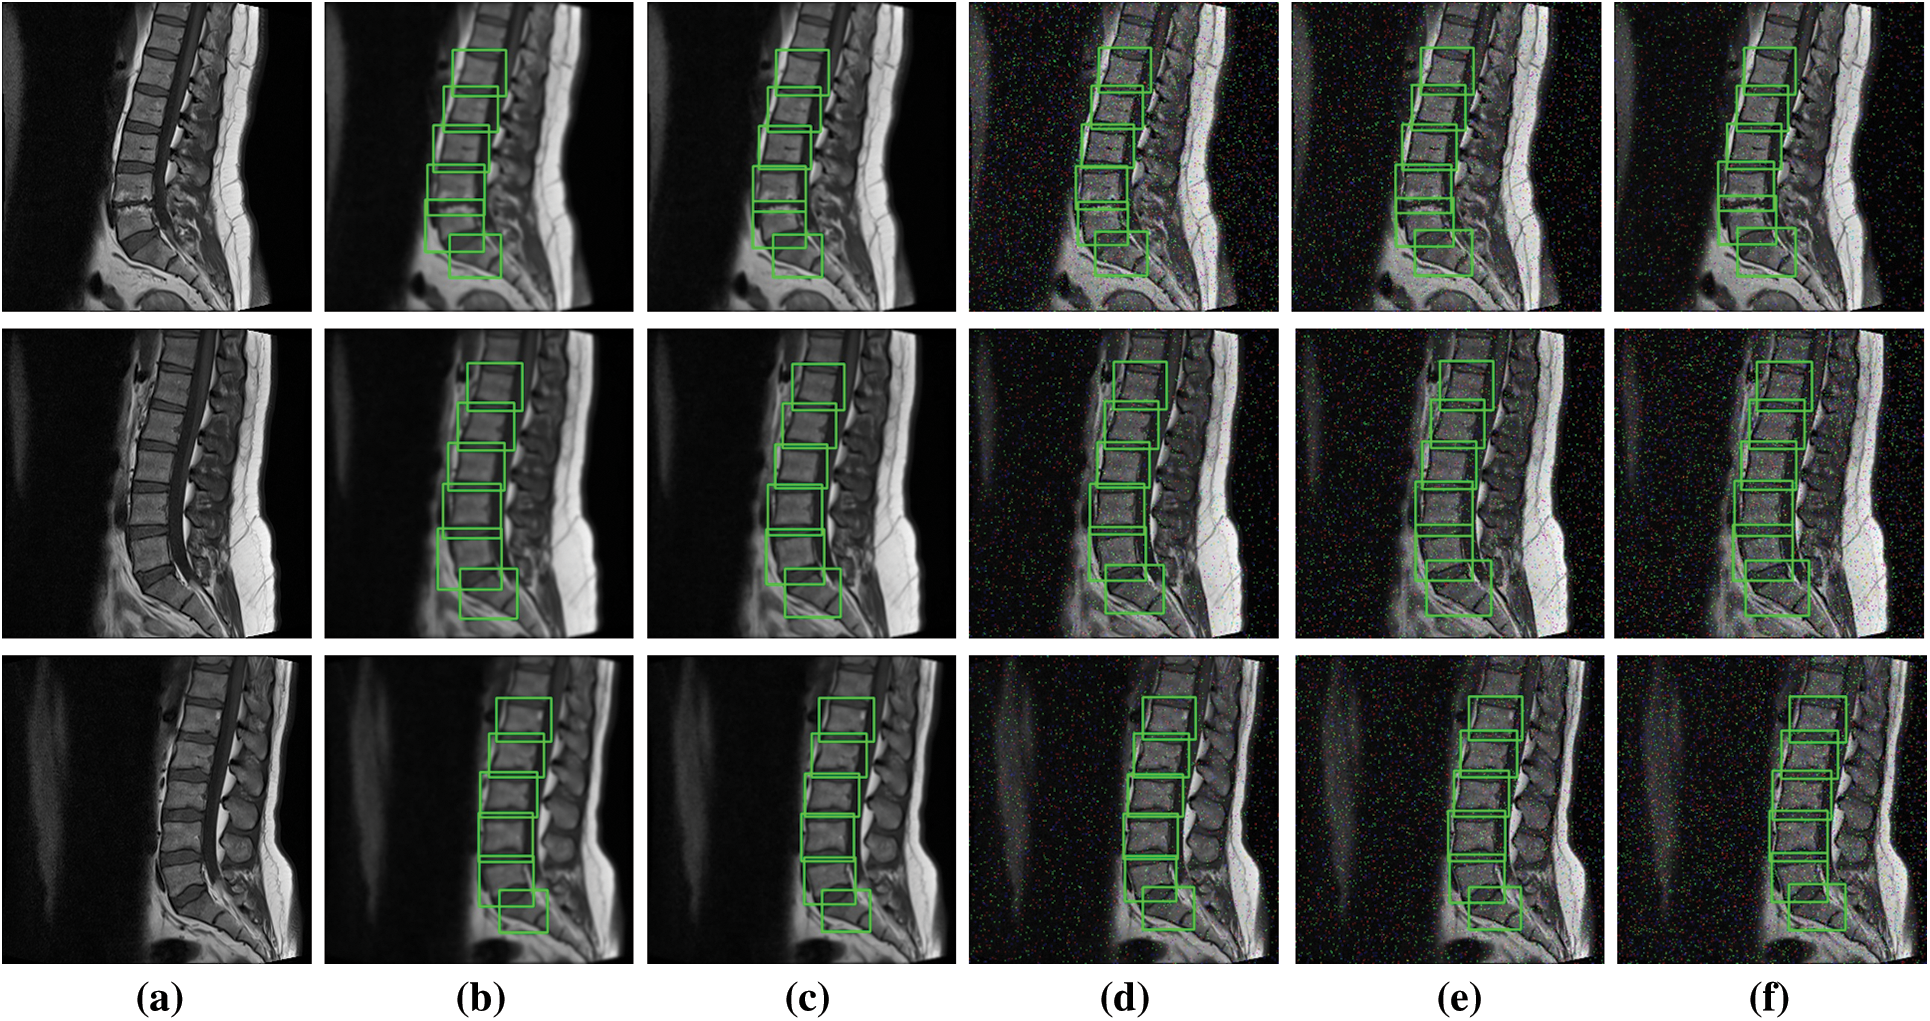
Figure 6: Noise based localization results (a) Original image, (b) and (c) Gaussian noise with sigma 1.5 and 1 (d), (e) and (f) Salt and pepper noise with densities 0.02, 0.03 & 0.05
To evaluate the Cobb estimation procedure, the Mean Absolute Error is calculated from Eq. (6). For comparative assessment another method of Cobb calculation Area Under the Curve (AUC) [29] is selected with the proposed method.
Fig. 7 shows the Cobb estimation techniques. Here, (a) represent the edges detected, from these edges corner points are calculated. The proposed method of Cobb estimation from corner points is presented where L1 and S1 vertebrae are shown. On the other hand, (b) depicts the process of AUC where center-line curvature is formulated and a perpendicular is dropped. Thus, this creates an enclosed region for classification of Lordosis.
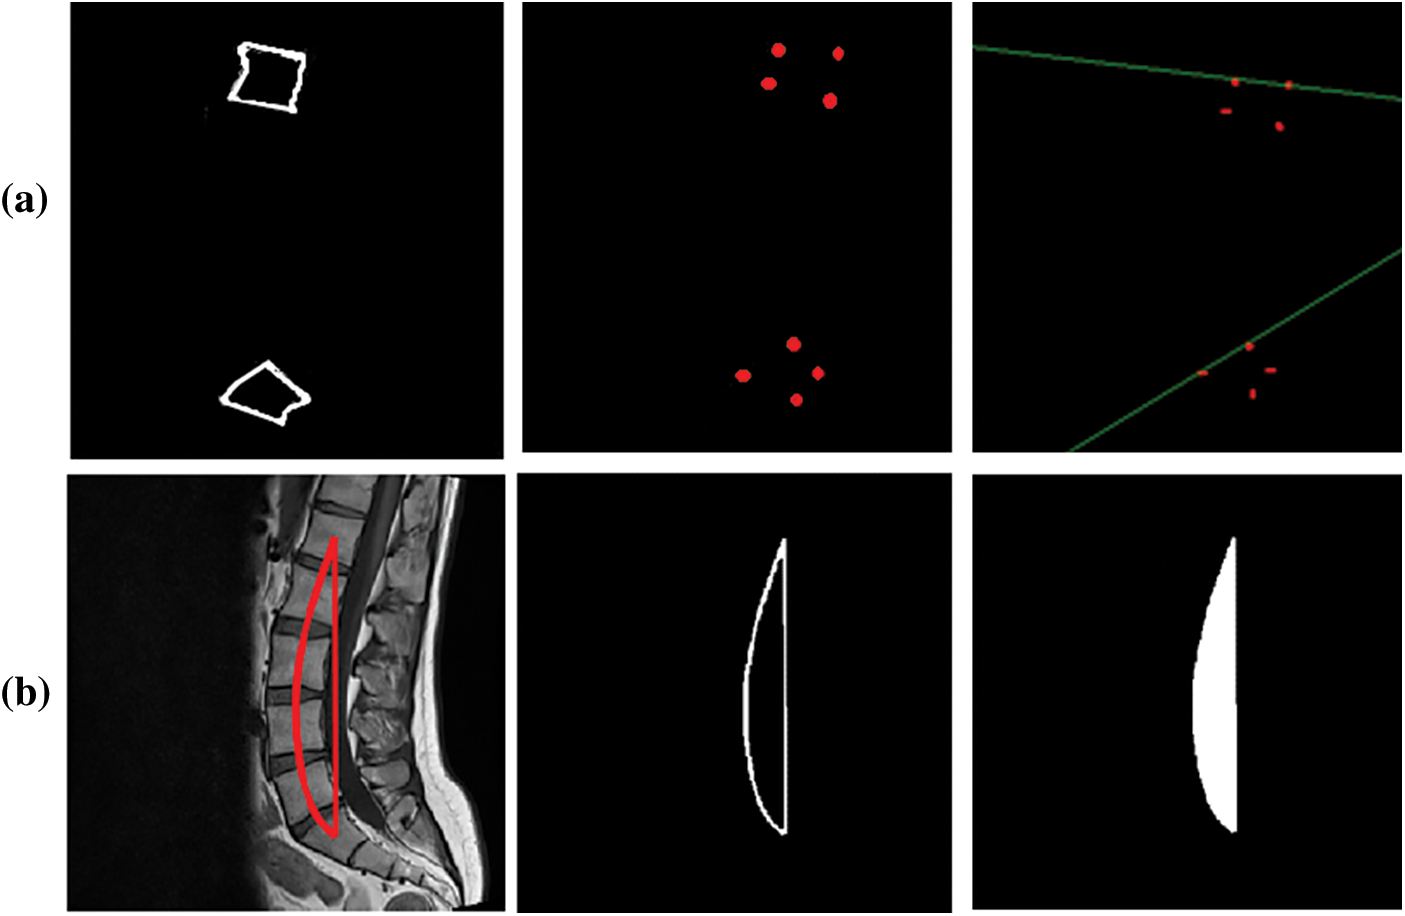
Figure 7: Cobb results (a) Corner point method (b) AUC method
To present this assessment of Cobb estimation the Tab. 7 shows the proposed method of corner points and Tab. 6 represents the area under the curve method.
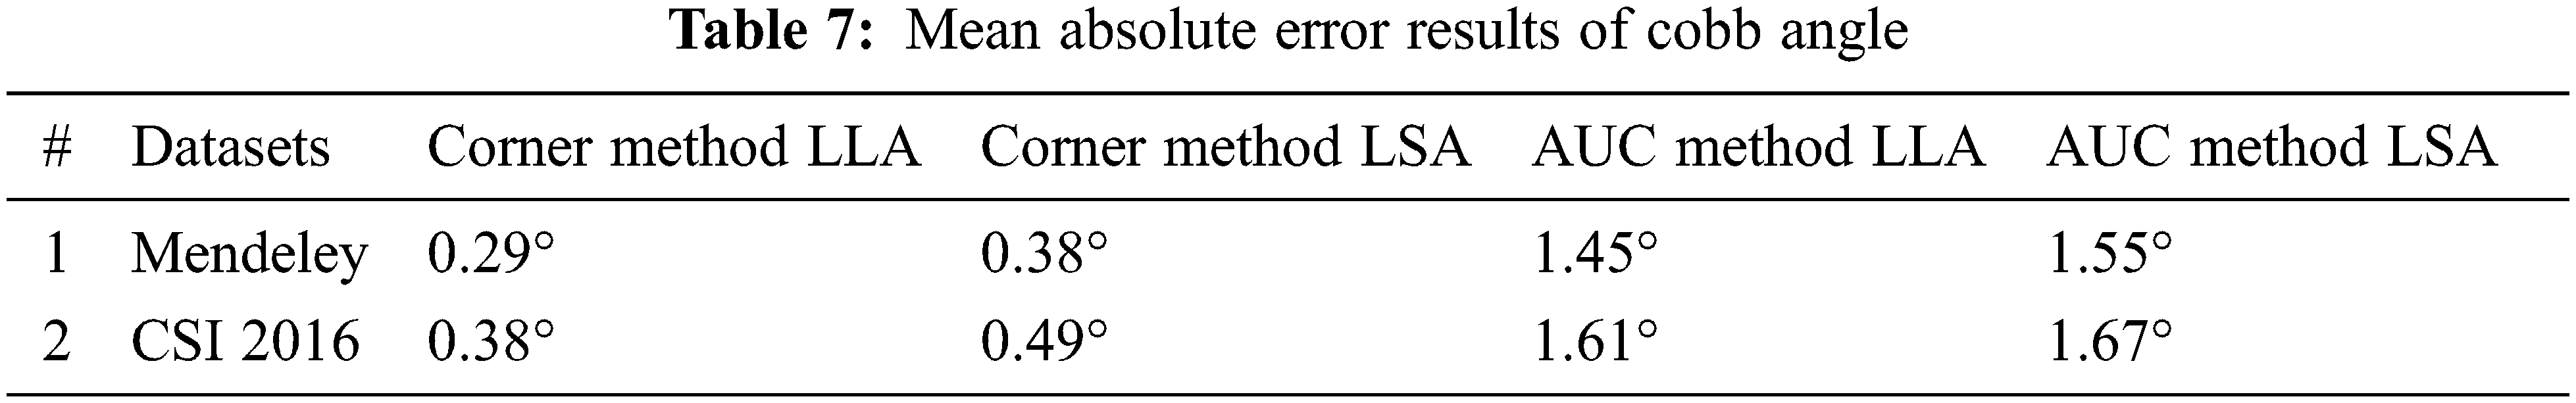
The MAE values for comparison on LLA and LSA using Mendeley and CSI 2016 datasets for both techniques are presented in Tab. 7. The above results indicate that the MAE value for the corner point method is less as compared to the AUC method.
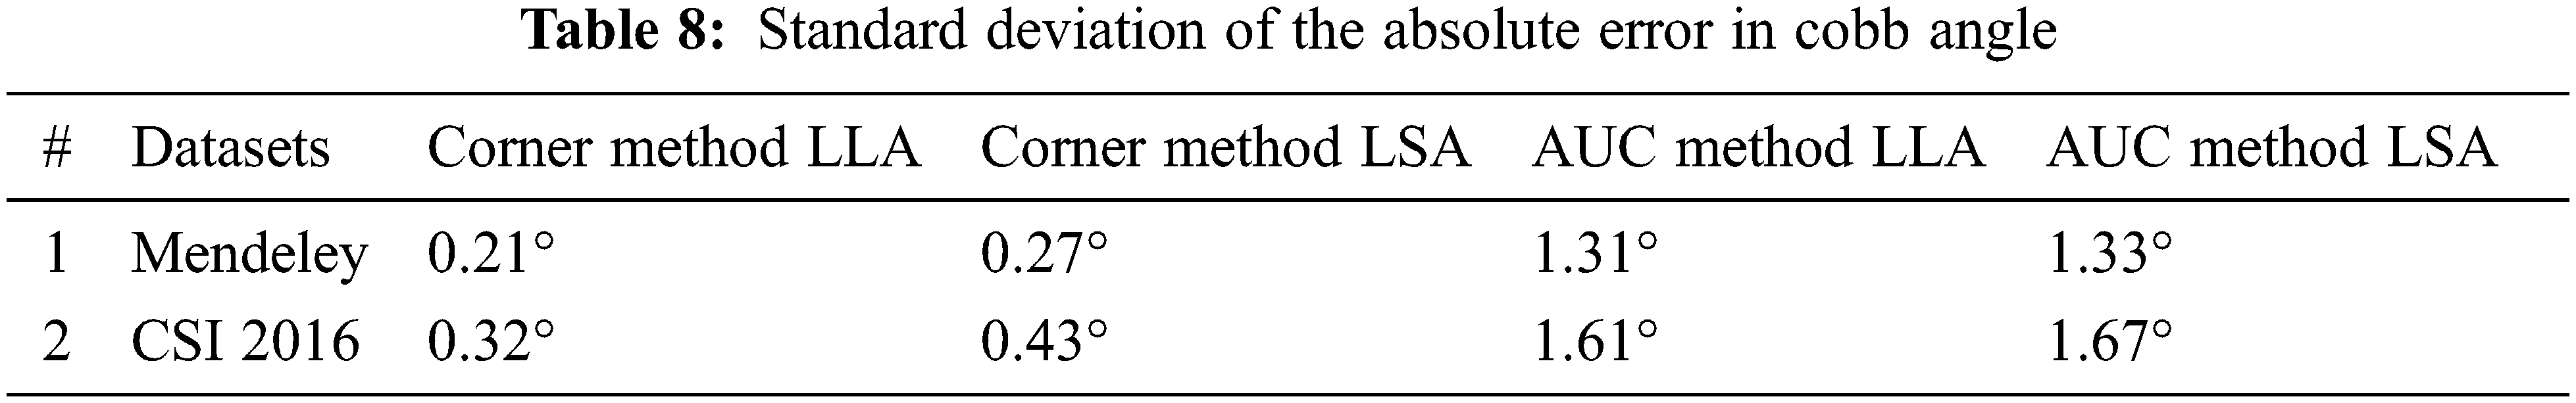
The Standard deviation of an absolute error on LLA and LSA using Mendeley and CSI 2016 datasets for both techniques is presented in Tab. 8. The results show that the proposed technique is more reliable.
As discussed in Section 1, Lordosis is spinal deformity that has inward curvature. The lordosis in lumbar region of the spine is divided into two divisions. Hyper Lordosis is mainly an excessive inward curve whereas Hypo Lordosis is the lesser curve from the normal bend. The Normal Lumber Bend is almost at 53° on the other hand Hyper is greater than 53° and Hypo is less than 53°. To evaluate Cobb angles results for Lumbar Lordosis in Hypo and Hyper categories following confusion metrics depicts the results of the proposed technique on both datasets.
Figs. 8 and 9 present normalized confusion matrices for AUC and Corner Point (CP) methods. For Mendeley's Dataset, we were able to achieve an accuracy of 76.47% using AUC and 98.04% using the CP method. For CSI 2016 Dataset, we attained an accuracy of 75.00% for AUC and 81.25% for CP method. Tab. 9 shows the comparison of proposed methodology on same data with another technique.
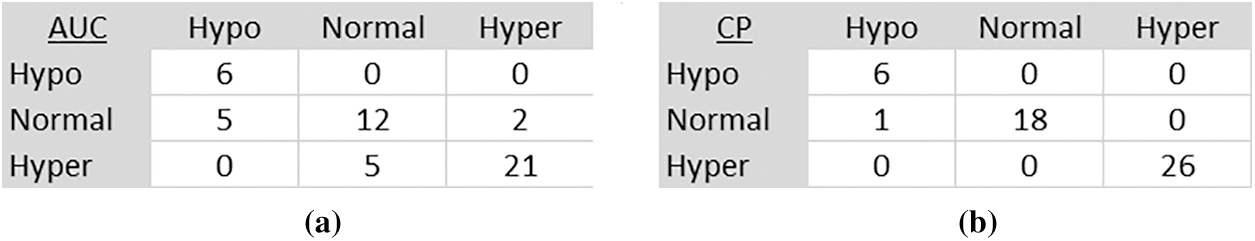
Figure 8: Confusion matrix of mendeley dataset (a) AUC method (b) Corner point method
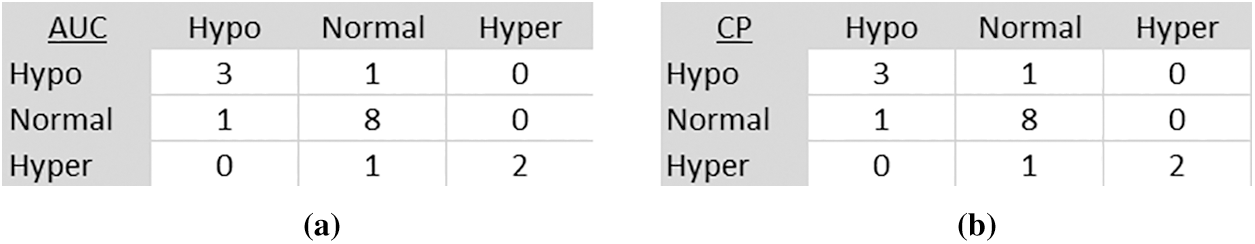
Figure 9: Confusion matrix of CSI 2016 dataset (a) AUC method (b) Corner point method
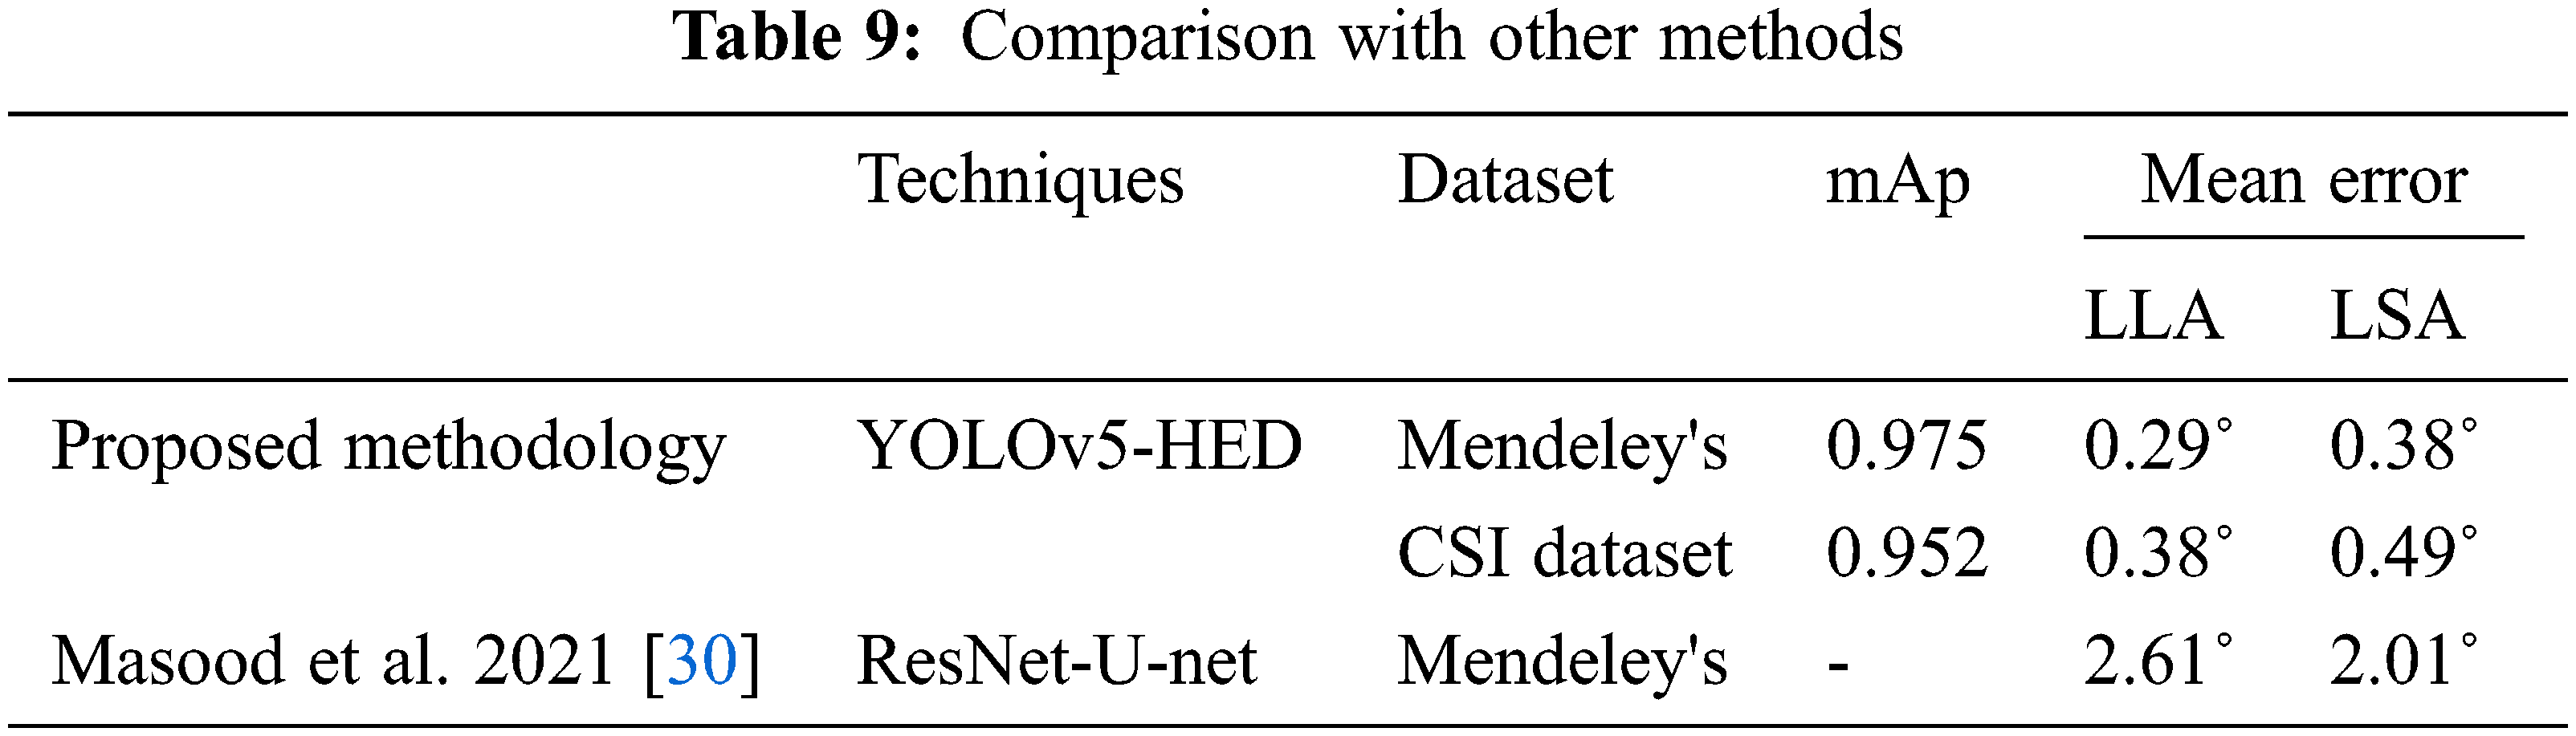
The results show an extraordinary contribution of the YOLOv5 technique that has localized the vertebrae with mAP reached up to 94%. These localized results are later utilized for edge detection and corner point estimation. Here, a point is worth mentioning that instead of vertebrae segmentation, we have opted for a flip approach of vertebrae localization. That is why the comparative analysis with literature is not relevant here due to the opposite nature of the procedure. The grand challenges datasets have been used for assessment of lumbar lordosis. For comparative study, two methods of Cobb estimation are applied that are AUC and CP method. The confusion matrix indicates that corner method calculated from the proposed method delivered better results. The adequacy for this solution regarding clinical point of view is that the lordosis Cobb is evaluated in both categories are LLA and LSA. It indicates severity of curvature disorder based on this information regarding deformity this would help in the treatment plan for clinical specialists.
This research article presents an automated system that is used for the deformity in spine curvature analysis using Cobb estimation. Localization of vertebrae is performed with YOLO architecture. The 3 vertebrae required for Cobb estimation are extracted as ROI. HED algorithm is used for edge detection and with the help of Harris detector corner points are calculated these corner pointers are later used for Cobb calculation. The promising results of YOLO are attained as mAP for CSI 2016 dataset is 0.952 and for Mendeley dataset is 0.975 respectively. The efficiency of the proposed technique for Cobb estimation shows a significant difference in MAE and the corner point method attained values less than 0.40° approximately. The research study conducted has opted for a single novel approach for different imaging modalities. Without segmentation of vertebrae only localization is combined with the edge detection to produce corner points. These corner points are used to measure Cobb angles for classification dis-proportionality in curvature. In future, the work may be extended by using 3D volumetric scans, hence formulating another dataset with different orientations of spine images. Another direction that requires exploration is determining the fractures and accidental patients that require immediate decisions regarding surgical procedures. The other bones of the human body have deformation issues, like arthritis, misalignment, osteophytes, fractures and intervertebral disk space reduction can also be addressed.
Acknowledgement: We would like to acknowledge the support provided by our universities, Bahria University Pakistan and NUST Pakistan for providing us the platform and hardware required to carry out this research. Without the proper hardware, the implementation of our algorithm was a challenge.
Funding Statement: The authors received no specific funding for this study.
Conflicts of Interest: The authors declare that they have no conflicts of interest to report regarding the present study.
1. Christopher and Dana, Retrieved November 30, 2020. [Online]. Available: https://www.christopherreeve.org/living-with-paralysis/health/how-the-spinal-cord-works. [Google Scholar]
2. Neuroanatomy, Retrieved June 30, 2020. [Online]. Available: https://nba.uth.tmc.edu/neuroanatomy/L2/Lab02-p01index.html. [Google Scholar]
3. R. Michael and J. E. Safdieh, “Netter's concise neuroanatomy,” in Updated Edition E-Book, Amsterdam, Netherlands, Elsevier Health Sciences, 2016. [Google Scholar]
4. Shutterstock.com Retrieved August 30, 2021. [Online]. Available: https://www.shutterstock.com/image-vector/spinal-deformity-types-anterior-view-lateral-1155289795. New York. [Google Scholar]
5. J. Yao, J. E. Burns, D. Forsberg, A. Seitel, A. Rasoulian et al., “A multi-center milestone study of clinical vertebral CT segmentation,” Computerized Medical Imaging and Graphics, vol. 49, pp. 16–28, 2016. [Google Scholar]
6. D. Forsberg, “Atlas-based segmentation of the thoracic and lumbar vertebrae,” in Recent Advances in Computational Methods and Clinical Applications for Spine Imaging, Cham: Springer, pp. 215–220, 2015. [Google Scholar]
7. K. Hammernik, T. Ebner, D. Stern, M. Urschler and T. Pock, “Vertebrae segmentation in 3D CT images based on a variational framework,” in Recent Advances in Computational Methods and Clinical Applications for Spine Imaging, Cham: Springer, pp. 227–233, 2015. [Google Scholar]
8. A. Sekuboyina, J. Kukacka, J. S. Kirschke, B. H. Menze and A. Valentinitsch, “Attention-driven deep learning for pathological spine segmentation,” in Int. Workshop on Computational Methods and Clinical Applications in Musculoskeletal Imaging, Cham, Springer, pp. 108–119, 2017. [Google Scholar]
9. R. Janssens and G. Zheng, “Deep learning based segmentation of lumbar vertebrae from CT images,” CAOS, vol. 2, pp. 94–97, 2018. [Google Scholar]
10. Y. Chen, Y. Gao, K. Li, L. Zhao and J. Zhao, “Vertebrae identification and localization utilizing fully convolutional networks and a hidden markov model,” IEEE Transactions on Medical Imaging, vol. 39, no. 2, pp. 387–299, IEEE, 2019. [Google Scholar]
11. C. H. Chuang, C. Y. Lin, Y. Y. Tsai, Z. Y. Lian, H. X. Xie et al., “Efficient triple output network for vertebral segmentation and identification,” IEEE Access, vol. 7, pp. 117978–117985, IEEE, 2019. [Google Scholar]
12. F. Rehman, S. I. A. Shah, M. N. Riaz, S. O. Gilani and R. Faiza, in “A region-based deep level set formulation for vertebral bone segmentation of osteoporotic fractures,” Journal of Digital Imaging Springer, vol. 33, no. 1, pp. 1–13, Springer, 2019. [Google Scholar]
13. N. Lessmann, B. V. Ginneken, P. A. de Jong and I. Ǐsgum, “Iterative fully convolutional neural networks for automatic vertebra segmentation and identification,” Medical Image Analysis, vol. 53, pp. 142–155, Elsevier, 2019. [Google Scholar]
14. L. Xia, L. Xiao, G. Quan and W. Bo, “3D cascaded convolutional networks for multi-vertebrae segmentation,” Current Medical Imaging, vol. 16, no. 3, pp. 231–240, Bentham Science Publishers, 2020. [Google Scholar]
15. B. A. Kusuma, “Determination of spinal curvature from scoliosis x-ray images using K-means and curve fitting for early detection of scoliosis disease,” in 2017 2nd Int. Conf. on Information Technology, Information Systems and Electrical Engineering (ICITISEE), Yogyakarta, Indonesia, IEEE, pp. 159–164, 2017. [Google Scholar]
16. Y. Pan, Q. Chen, T. Chen, H. Wang, X. Zhu et al., “Evaluation of a computer-aided method for measuring the cobb angle on chest x-rays,” European Spine Journal, vol. 28, no. 12, pp. 3035–3043, Springer, 2019. [Google Scholar]
17. A. Safari, H. Parsaei, A. Zamani and B. Pourabbas, “A semi-automatic algorithm for estimating cobb angle,” Journal of Biomedical Physics and Engineering, vol. 9, no. 3, pp. 217, Shiraz University of Medical Sciences, 2019. [Google Scholar]
18. B. Chen, Q. Xu, L. Wang, S. Leung, J. Chung et al., “An automated and accurate spine curve analysis system,” IEEE Access, vol. 7, no. 7, pp. 124596–124605, IEEE, 2019. [Google Scholar]
19. J. Liu, C. Yuan, X. Sun, L. Sun, H. Dong et al., “The measurement of cobb angle based on spine x-ray images using multi-scale convolutional neural network,” Physical and Engineering Sciences in Medicine, vol. 44, no. 3, pp. 809–821, Springer, 2021. [Google Scholar]
20. C. Zhang, J. Wang, J. He, P. Gao and G. Xie, “Automated vertebral landmarks and spinal curvature estimation using non-directional part affinity fields,” Neurocomputing, vol. 438, pp. 280–289, Elsevier, 2021. [Google Scholar]
21. J. L. Cui, D. D. Gao, S. J. Shen, L. Z. Wang and Y. Zhao, “Cobb Angle Measurement Method of Scoliosis Based on U-net Network,” 2021. [Google Scholar]
22. L. Wang, C. Xie, Y. Lin, H. Y. Zhou, K. Chen et al., “Evaluation and comparison of accurate automated spinal curvature estimation algorithms with spinal anterior-posterior x-Ray images: The AASCE2019 Challenge,” in Medical Image Analysis, Amsterdam, Netherlands: Elsevier, pp. 102115, 2021. [Google Scholar]
23. J. Yao, J. E. Burns, H. Munoz and R. M. Summers, “Detection of vertebral body fractures based on cortical shell unwrapping,” in Int. Conf. on Medical Image Computing and Computer-Assisted Intervention, MICCAI 2012 was the 15th International Conference, held in Nice, October 1–5, France, Springer, Berlin Heidelberg, pp. 509–516, 2012. [Google Scholar]
24. S. Sudirman, A. Al Kafri, F. Natalia, H. Meidia, N. Afriliana et al., “Label image ground truth data for lumbar spine MRI dataset,” Mendeley Data, 2019. [Google Scholar]
25. R. Korez, B. Ibragimov, B. Likar, F. Pernuš and T. Vrtovec, “A framework for automated spine and vertebrae interpolation-based detection and model-based segmentation,” in IEEE Transactions on Medical Imaging, vol. 34, no. 8, pp. 1649–1662, IEEE, 2015. [Google Scholar]
26. J. Redmon, S. Divvala, R. Girshick and A. Farhadi, “You only look once: Unified, real-time object detection,” in Proc. of the IEEE Conf. on Computer Vision and Pattern Recognition, Las Vegas, NV, USA, pp. 779–788. 2016. [Google Scholar]
27. S. Xie and Z. Tu, “Holistically-nested edge detection,” in Proc. of the IEEE Int. Conf. on Computer Vision, Santiago, Chile, pp. 1395–1403, 2015. [Google Scholar]
28. C. Harris and M. Stephens, “A combined corner and edge detector,” in Alvey Vision Conference, vol. 15, no. 50, pp. 10–5244, 1988. [Google Scholar]
29. B. P. Yang, C. W. Yang and S. L. Ondra, “A novel mathematical model of the sagittal spine,” Spine, vol. 32, no. 4, pp. 466–470, LWW, 2007. [Google Scholar]
30. R. F. Masood, I. A. Taj, M. Babar, M. A. Qureshi and T. Hassan, “Deep learning based vertebral body segmentation with extraction of spinal measurements and disorder disease classification.” Biomedical Signal Processing and Control, vol. 71, pp. 103230, Elsevier, 2022. [Google Scholar]
 | This work is licensed under a Creative Commons Attribution 4.0 International License, which permits unrestricted use, distribution, and reproduction in any medium, provided the original work is properly cited. |