DOI:10.32604/iasc.2022.024128
| Intelligent Automation & Soft Computing DOI:10.32604/iasc.2022.024128 | |
| Article |
Deep Learning Based Power Transformer Monitoring Using Partial Discharge Patterns
1Department of EEE, Ramco Institute of Technology, Rajapalayam, Tamilnadu, India
2Department of EEE, National Engineering College, Kovilpatti, Tamilnadu, India
*Corresponding Author: D. Karthik Prabhu. Email: dkarthikprabhu1984@gmail.com
Received: 06 October 2021; Accepted: 17 January 2022
Abstract: Measurement and recognition of Partial Discharge (PD) in power apparatus is considered a protuberant tool for condition monitoring and assessing the state of a dielectric system. During operating conditions, PD may occur either in the form of single and multiple patterns in nature. Currently, for PD pattern recognition, deep learning approaches are used. To evaluate spatial order less features from the large-scale patterns, a pre-trained network is used. The major drawback of traditional approaches is that they generate high dimensional data or requires additional steps like dictionary learning and dimensionality reduction. However, in real-time applications, interference incorporated in the measured single and multiple PD patterns may reduce the identification of the exact patterns and causes inaccurate diagnosis of equipment. The residual pooling layer is proposed in this work to overcome the drawbacks and provides fast learning. The projected algorithm consists of a residual encoding module and an aggregation module for spatial information preserving and order less feature generating. The advantages of the proposed work produce low dimensional data compared to other deep learning approaches. At last, the impact of random noise in the measured PD signal on recognition rate is investigated and addressed.
Keywords: Residual pooling; pattern recognition; external interference; training optimizers; deep learning algorithm
Equipment lifetime is predicted by monitoring the condition of high voltage (HV) power equipment. The insulation present in this HV equipment is subjected to electrical stress, mechanical, thermal stress and environmental stress during its operation. These stresses may result in degradation and finally ends up with occurrence of insulation defects under operating conditions. To avoid sudden catastrophic failure, the insulation status must be tracked and its severity like size and defect must be estimated. Partial Discharge (PD) emerged as a powerful tool for identifying such defects to avoid breakdown [1]. Usually phase resolved partial discharge (PRPD) patterns are used as a signature tool for finding PD defects [2–4]. But the real challenges in this method are single and multiple discharges, interference in PD measurement, and automated PD fault classification. This necessitated the intervention of computer-based techniques for handling multiple PD sources and PD recognition [5]. Features are extracted from PRPD patterns for analyzing the fault and PD recognition. Hilbert Huang Transform [6], Principal component analysis [7], fractal image compression techniques [8], and texture features [9], short-time Fourier transform (STFT) [10] are the different feature extraction techniques reported in the literature. The extracted features are fed to machine learning approaches for PD recognition. Artificial neural network [11], Linear discriminant analysis [12], support vector machine [13] are widely used in literature for identifying the fault to avoid premature failures occurring inside insulation. These approaches require prior knowledge about signatures of PD enabling us to extract unique features. Hence a convolutional neural network (CNN) model has been proposed to overcome the issues related to prior approaches. Recently, recognition has shifted its focus on deep learning (DL) approaches [14–17] for condition monitoring of high voltage apparatus using PD patterns in industries and academics. DL can extract deep and hierarchical features without any human expertise and finally classified the types of defects from PD patterns.
In standard, they use a pre-trained deep learning network for features extraction used for PD recognition, but the network trained for recognizing the objects. Features such as shape, textures are evaluated from the model is crucial. Moreover, the proposed work in [18,19] includes various steps such as feature extraction, orderless encoding, and dimension reduction, the benefits presented by end-to-end learning are not entirely employed. Thus, all these [18–20] methods have high dimensional features from the input dataset. The residual pooling layer streamlines the learning procedure in deep learning approaches. During the training process, the network can learn for the dictionary is overcome by the proposed algorithm, which directly considers the extracted features from the network as a dictionary. As an alternative for the soft assignment [21], our algorithm assigns each label to the related PRPD signature at a similar spatial view of the dictionary since there is natural spatial order in pre-trained convolutional features. In addition to that, our proposed work guarantees the size of extracted features which is stable with channel numbers in a pre-trained network.
In this proposed work, without dictionary learning, an automatic learnable residual layer consists of a residual encoding module and an aggregation module. Integrate the traditionally available feature extraction capability from the convolution layer and residual encoding idea into the proposed residual pooling layer. The residual layer generates spatial information from the PRPD patterns and aggregates them into a lower dimension feature for further classification. Finally, the proposed work concluded that spatial information from PRPD pattern before aggregation leads to a better recognition rate for condition monitoring of high voltage transformer.
In common, two different types of Deep learning recognition modules exist. The first type is with dictionary learning (DL) - related pooling methods in which features extracted from the PRPD patterns based on dictionary learning [21,22]. The second type is without DL-fewer pooling methods, which don't need dictionary learning to evaluate orderless features from images [23,24]. The components are extracted from the pre-trained network are classified using fully connected layers performance is less than FV-CNN. The algorithm presented in [20] combined the first and second-order trained network information for classification. A second-order democratic aggregation is presented replacing the sum pooling layer in [25]. The major drawback behind the above said approaches have high dimensional data, which needs large storage memory and high computation time. In this work, an algorithm without dictionary learning a well-organized orderless pooling-based CNN model based on residual coding. In addition to that, the algorithm holds the exact information of the PRPD patterns in the residual coding module and feature orderless in the aggregation module.
3.1 Artificial Transformer PD Model
In real-time operating conditions, power transformer equipment experienced surface degradation because of defects like suspended particles in the transformer oil, cavitations and bubbles present in the oil, paper insulation, internal winding turns, and oil screen. In this proposed work, using laboratory setup, artificial PD models are created, and transformer oil is used as a dielectric medium and shown in Fig. 1. The four artificial defects are corona discharge (F1), void discharge (F2), surface discharge (F3), floating potential defect (F4). Combination of these configurations produces multiple PD discharge as (F5) belongs to the combination of (F12), (F6) determines the combination of (F13), (F7) goes the variety of (F14), (F8) fits the combination of (F23), (F9) goes the combination of (F24), (F10) belongs the variety of (F34). Depending upon the combination of defects, PD inception voltage may apply to the corresponding combination. PD inception voltage for F1 to F4 are 15 kV, 15.6 kV, 16.3 kV and 16.9 kV respectively.
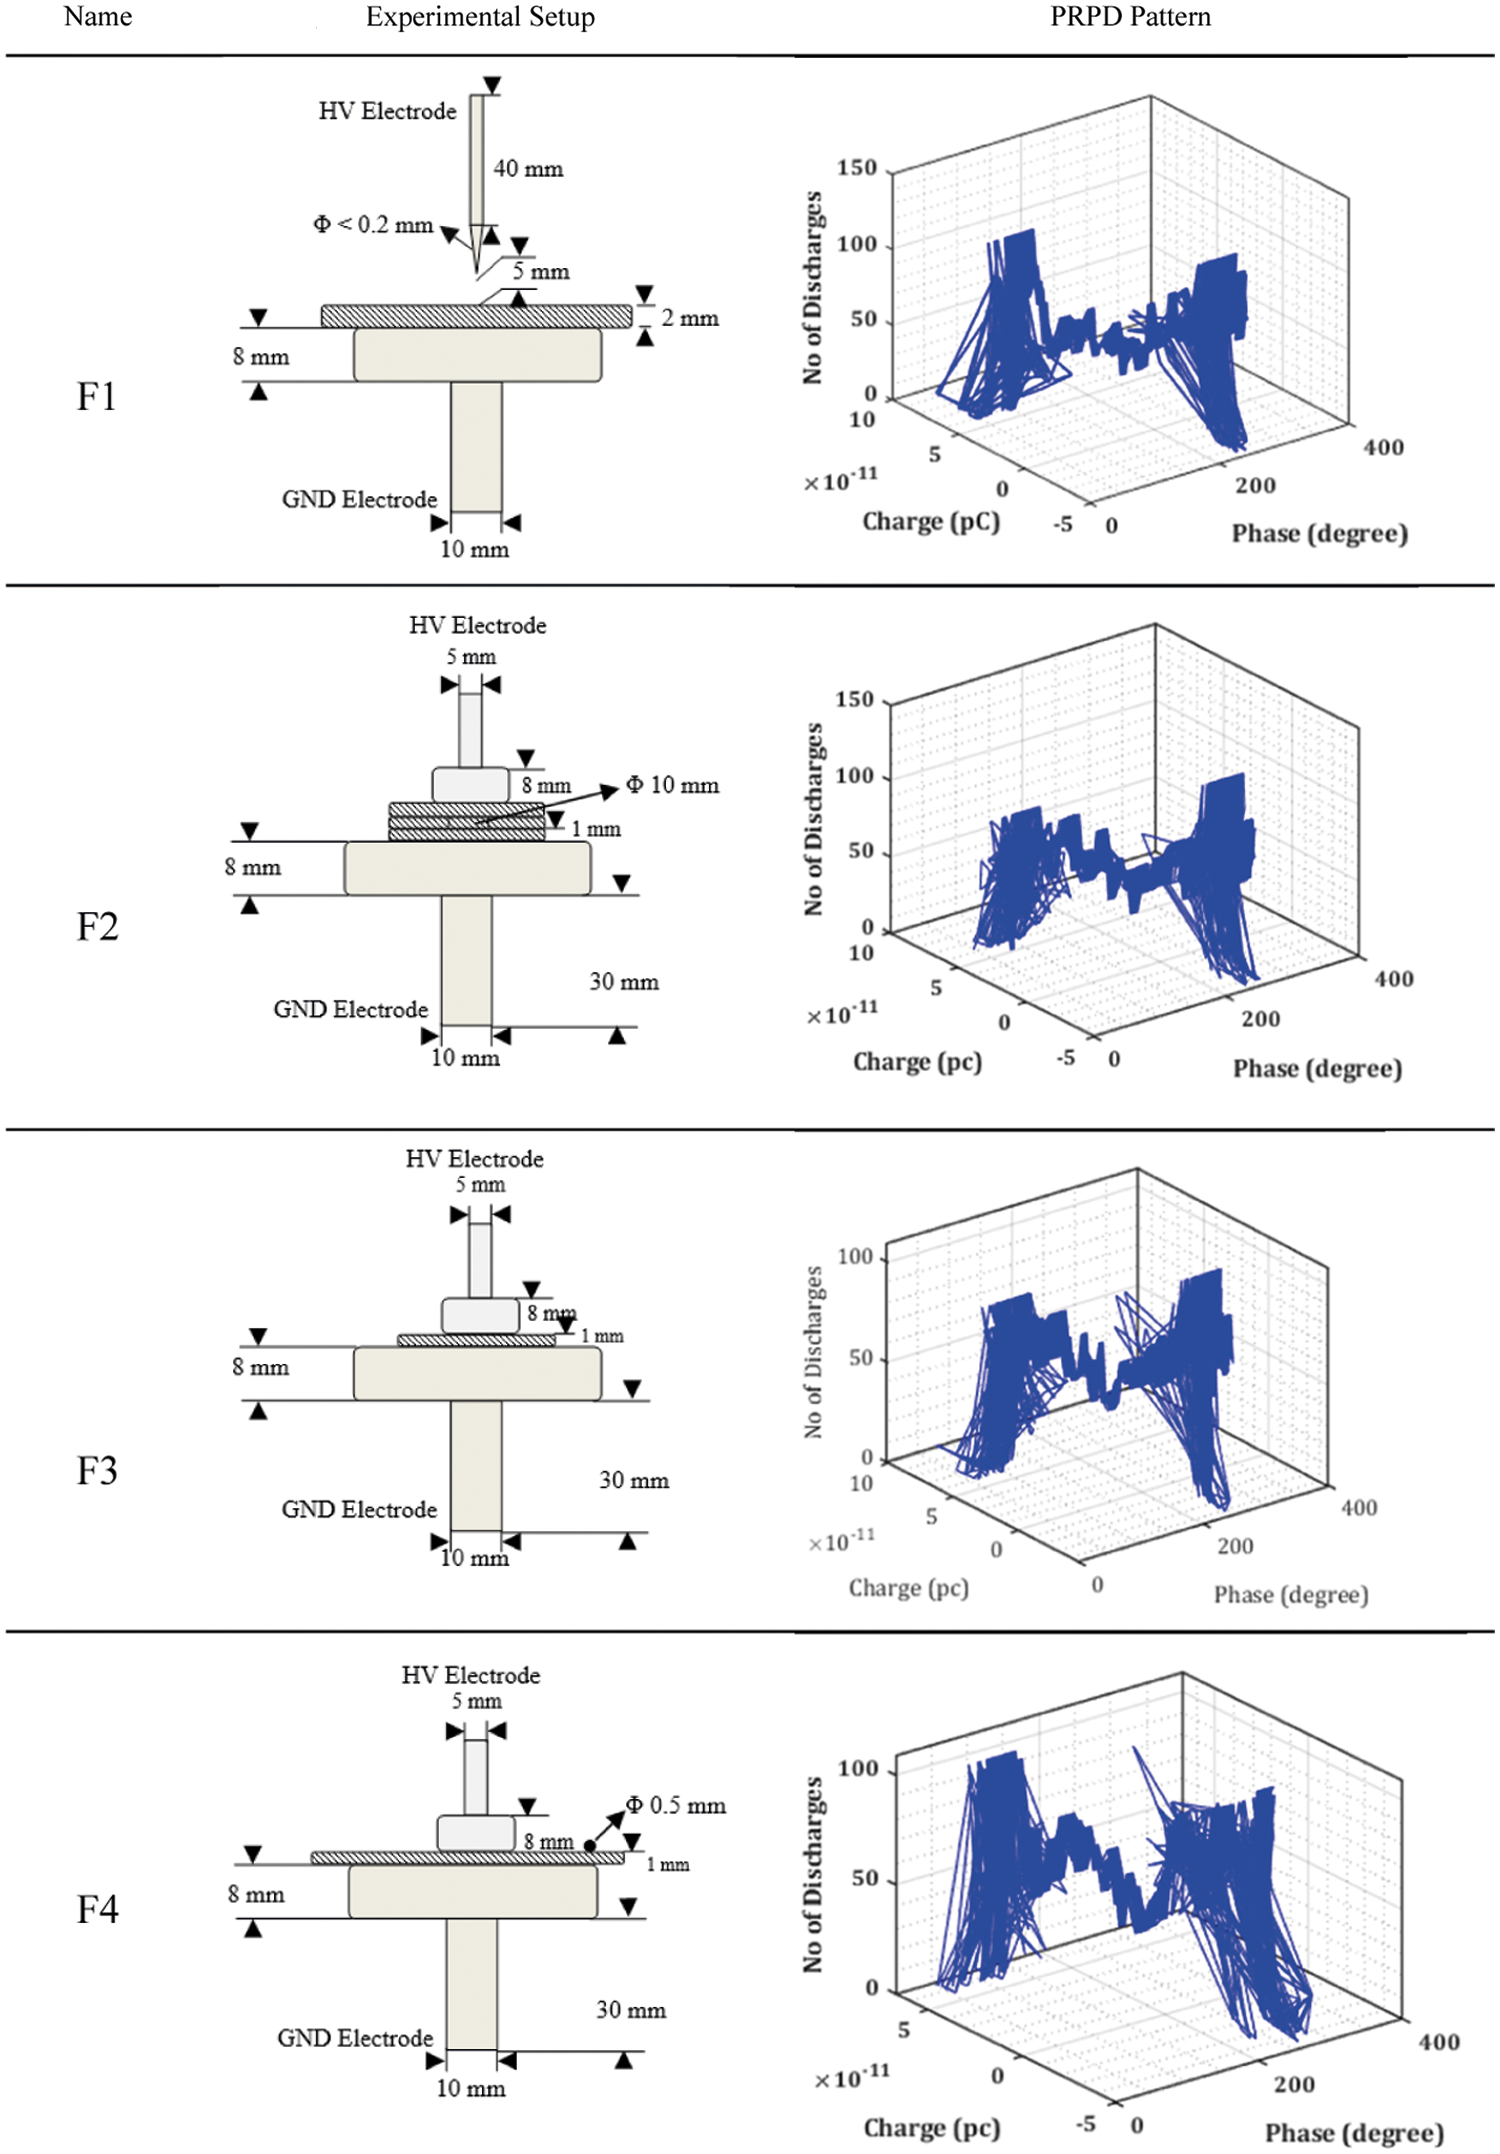
Figure 1: Four typical transformer PD insulation defect model: (F1) Corona discharge defect; (F2) Cavity defect; (F3) Surface discharge defect; (F4) Floating potential defect
3.2 Measurement of Partial Discharge
In this work, PD measurement is proceeding as per the standard International Electro technical Commission (IEC) 60270 to test the artificially created transformer PD models. Fig. 2 represents a schematic representation of PD measurement. A 100 kV variable AC source is an input source and a 50 MHz bandwidth High-frequency current transformer (HFCT) near the ground electrode for measuring the PD during PD testing. PD signal has been sampled at 100 MSa/s, with a sensitivity of 2 mV/div to 5 V/div enabling to proceed further the PD signal into PC for further investigation.
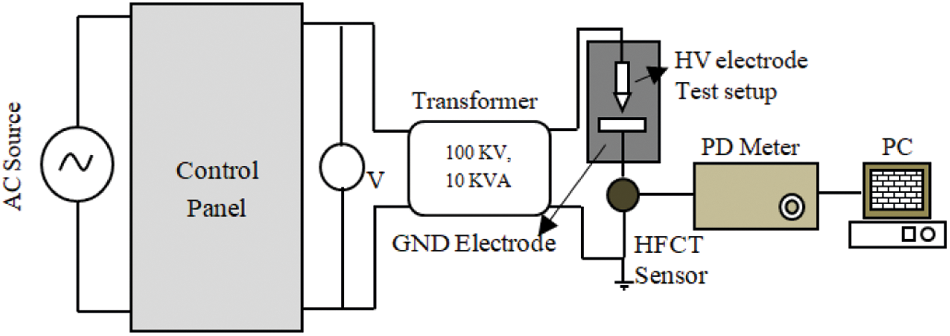
Figure 2: PD experimental setup
3.3 PRPD Pattern Collection Station
A PRPD database collecting station consists of 3000 PD signatures. More specifically, 300 PD signatures for each configuration. 3-D PRPD patterns for the corona discharge defect show convinced oscillation in the discharge pulse spectrum at different discharge time. PRPD pattern for each configuration is different from others, and each is having its unique shape and texture. The proposed algorithm flowchart is shown in Fig. 3.
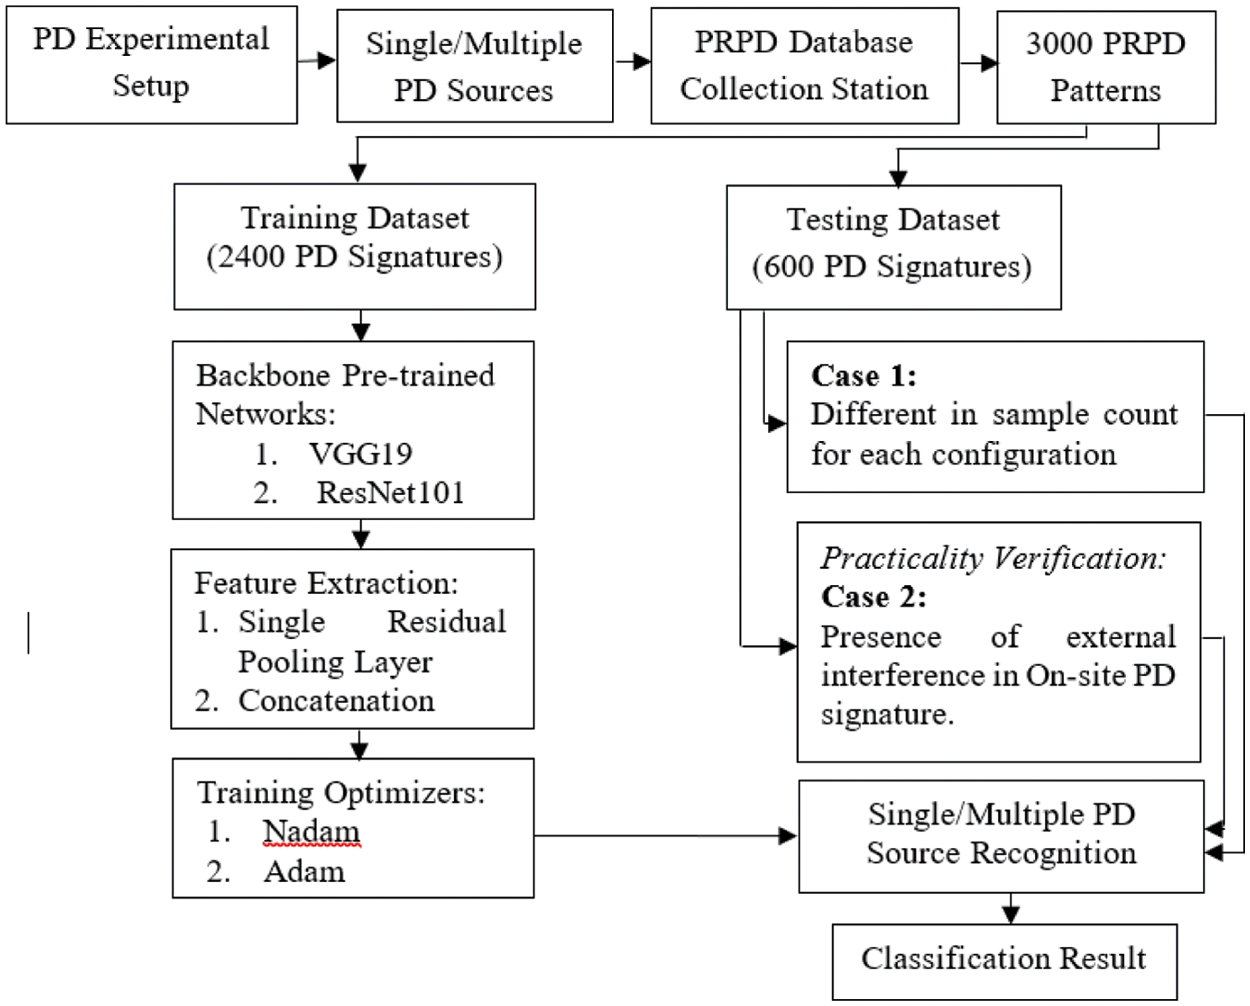
Figure 3: Flowchart of the proposed condition monitoring of HV transformer algorithm
The proposed pooling layer algorithm entails a residual encoding module and aggregation module. Fig. 4 shows the elements of the residual pooling network, which learns from the pre-trained networks as in [26] by eradicating the need for dictionary learning. Tanh is used as an activation function in this proposed work. The aggregation module helps to reduce the dimensionality of the features. ReLU activation function is used in the residual encoding module.
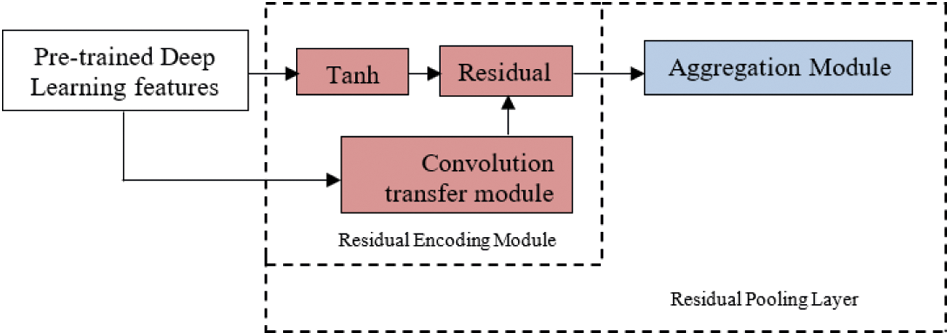
Figure 4: Proposed deep residual pooling network
3.4.1 Residual Encoding Module
In [27], RE methods consists of data with the dimension yk to a watchword wi from the dictionary along with the weight ski and evaluate the residual vectors from Eq. (1).
The extracted residual features from the input pattern are then aggregated for individual watchword wiusing Eq. (2),
From Eq. (2) the N belongs to the quantity of data vector. In continuation to that, for weight one hard assignment is assigned and for weight zero soft assignment is assigned with each watchword [28]. In our proposed algorithm, dictionary learning is eliminated and on behalf of that, the extracted feature from the final layer is consider as a dictionary features for learning. Input PRPD pattern x size is determined as 224 × 224 × 3 and the pre-trained network is fcnn(.) Resnet101 layer comprised for convolution layer CL in Eq. (3).
A convolution transfer module (CTM) is used to learn from the extracted features to evaluate residual V = fctm(CL). It consists of a convolution layer along with the Tanh activation function. In addition to that, to avoid overfitting the problem dropout layer and a batch normalization is added in the CTM. At last, the feature pxyεV at the corresponding position of (x, y) is allocated to the consistent watchword. In this work, pre-trained feature size and corresponding CTM feature size is same. The hard assignment for the residual map Resxyfeature is defined in Eq. (4),
where zxy denotes the pre-trained features. The Tanh activation function highlights the variations between the learned and pre-trained features. These cause CTM to learn a new feature from the PRPD pattern for recognizing the defects that take part in the high voltage transformer.
To find out the spatial orderless features from the input patterns, Aggk module is used next to the residual encoding module. Selection of appropriate features aggregation module consists of ReLU and batch normalisation. At one situation, zero is consider to be the negative residuals because, of retaining the high-level features from the CTM for classification. At last, fagg(.) is used to determine the global average vector in Eq. (5),
The proposed aggregation module is different from various researchers algorithm used in [18,19–21]. The dimension of the output vector depends upon the dictionary features, and other dimensionality reduction techniques [18,19] are used for fast computation time. Our proposed algorithm is motivated by [28,29], but there are two differences. The first one is, retaining the spatial function using CTM from a pre-trained network. The second one is extracting the spatial orderless features using the aggregation module and Tanh activation function, where sigmoidal is used in the [20]. Fig. 5 represents the pre-trained ResNet101 with deep residual pooling layer.
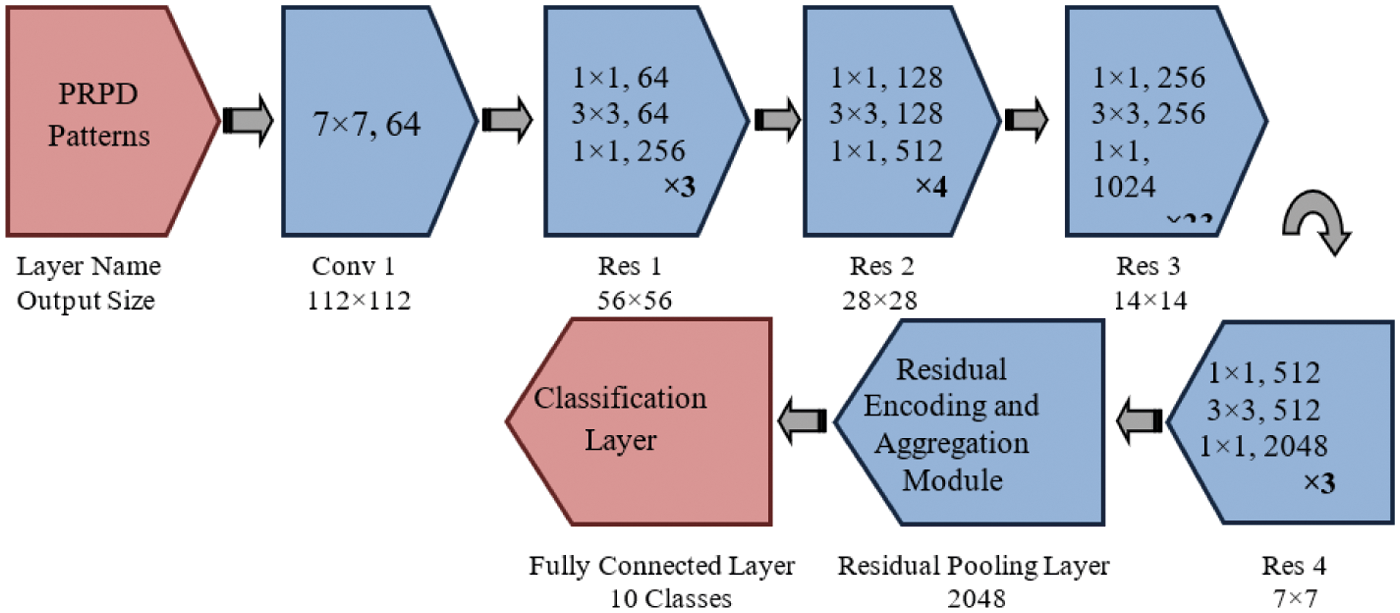
Figure 5: Pre-trained ResNet101 with deep residual pooling layer
The proposed residual pooling layer consists of an aggregation module before the fully connected layer for classification. Fig. 6 shows the deep residual pooling network structure with a backbone of Resnet101 architecture. Based on the number of feature channel aggregation modules generates the feature dimension. Thus, the extracted features as input to the classification layer.
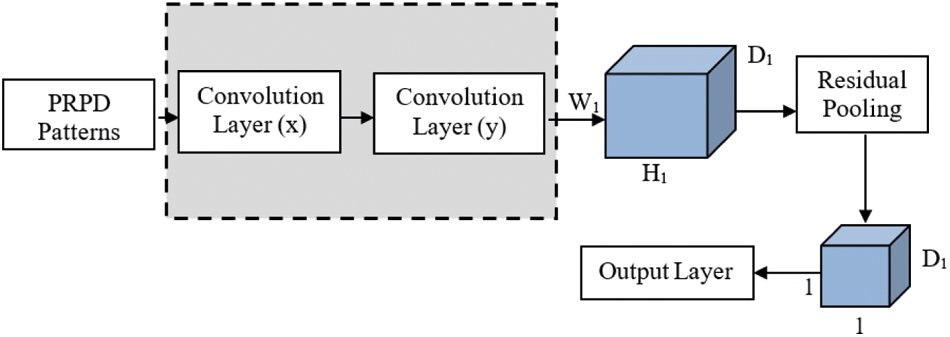
Figure 6: Proposed model with single residual pooling layer
In addition to that, the residual pooling approach permits multiple convolution layer to be merged. Based on the spatial dimension, convolution layer from pre-trained network is divided into convolution blocks. The extracted feature W1, W2, W3……Wn from every convolution layer in pre-trained network is fed as input to the residual pooling layer. Obtained PRPD features using residual pooling layer is defined in Eq. (6)
In common, the last two convolution layer evaluates high level distinguishable features from the patterns and those two blocks are merge for the residual pooling layer. Extracted features from the last two pooling layer are concatenation [18,20,30] as shown in Fig. 7.
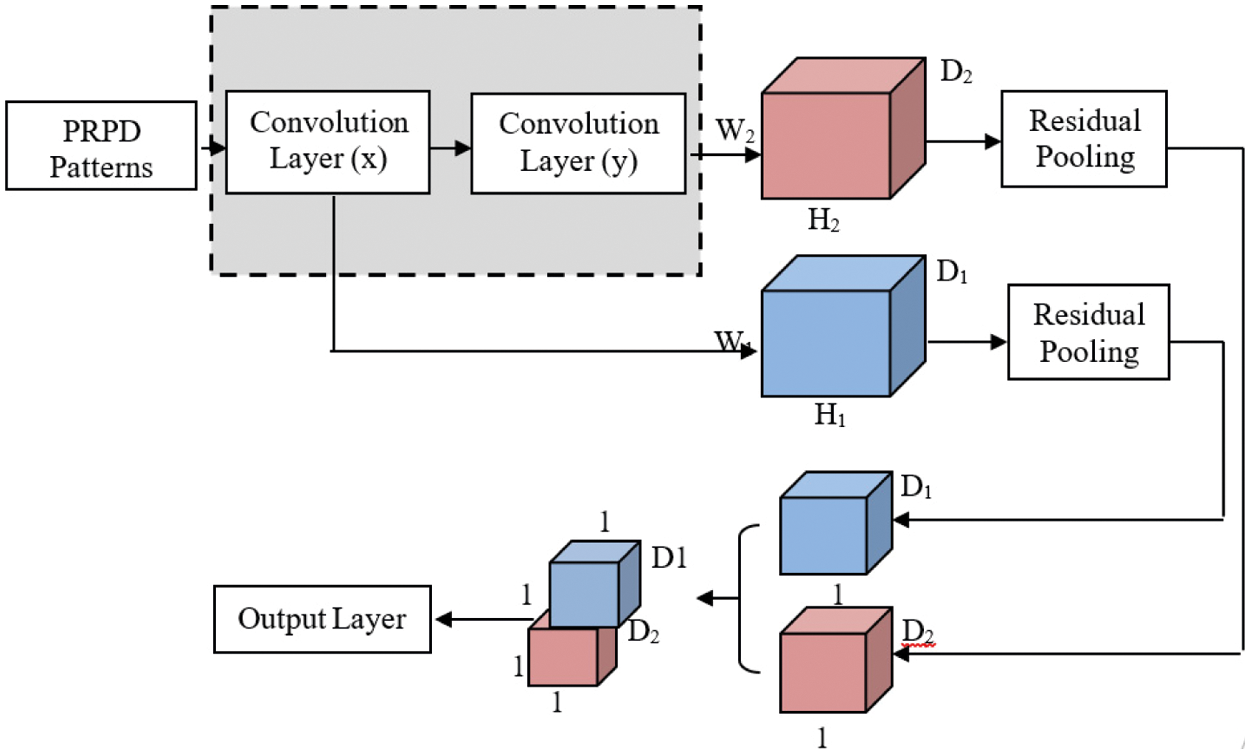
Figure 7: Proposed model with concatenation residual pooling layer
To achieve high recognition rate, the optimizer role is to reduce the loss which is its primary objective. Training optimizers change the weight and learning rate in the network to minimize the loss. Optimization algorithms have the potential to change the parameters to reduce the loss function for a good result. Two different training optimizers are used in this proposed work for comparison.
5 Result Discussions and Analysis
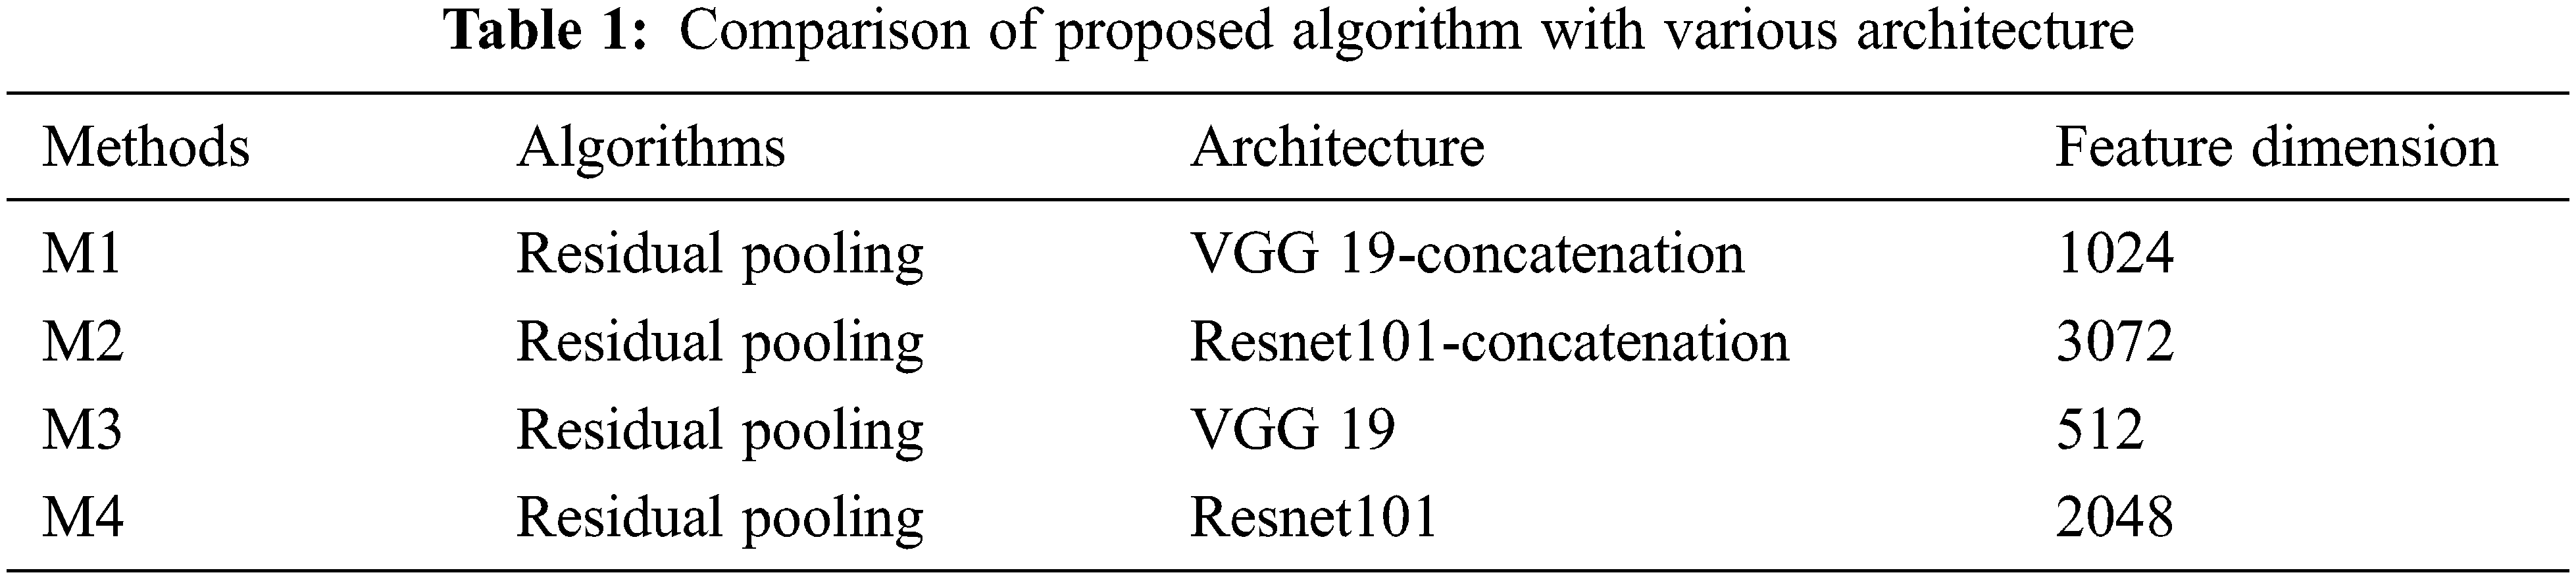
In this proposed work, the investigation was performed for two different case studies with the MATLAB platform, and the system requirement is a corei7 processor with 12 GB RAM. The proposed algorithm is validated using PRPD patterns. In this work, four single PD patterns and six multiple PD signatures patterns are considered. The work is then proceeded further with two different training sample patterns for validating the proposed deep residual neural network. Case 1 belongs to a different sample count for each configuration. Case 2 describes the presence of external interference present in the On-site PD signature. Tab. 1 shows the different backbone architecture used in the proposed work.
In this proposed work, the residual pooling layer of concatenation VGG19 architecture and two different training optimizers are compared. Fig. 8 shows the residual pooling comparison with other training optimizers, Fig. 8a shows that the Nadam optimizers attained more than 90% accuracy during training in 10 epochs, and Adam training optimizers reach more than 85% accuracy in 10 epochs for VGG 19 concatenation architecture. The accuracy stabilization for noisy onsite-PD signal around 15 epochs for Nadam optimizers and 20 epochs for Adam optimizers, shown in Fig. 8b.
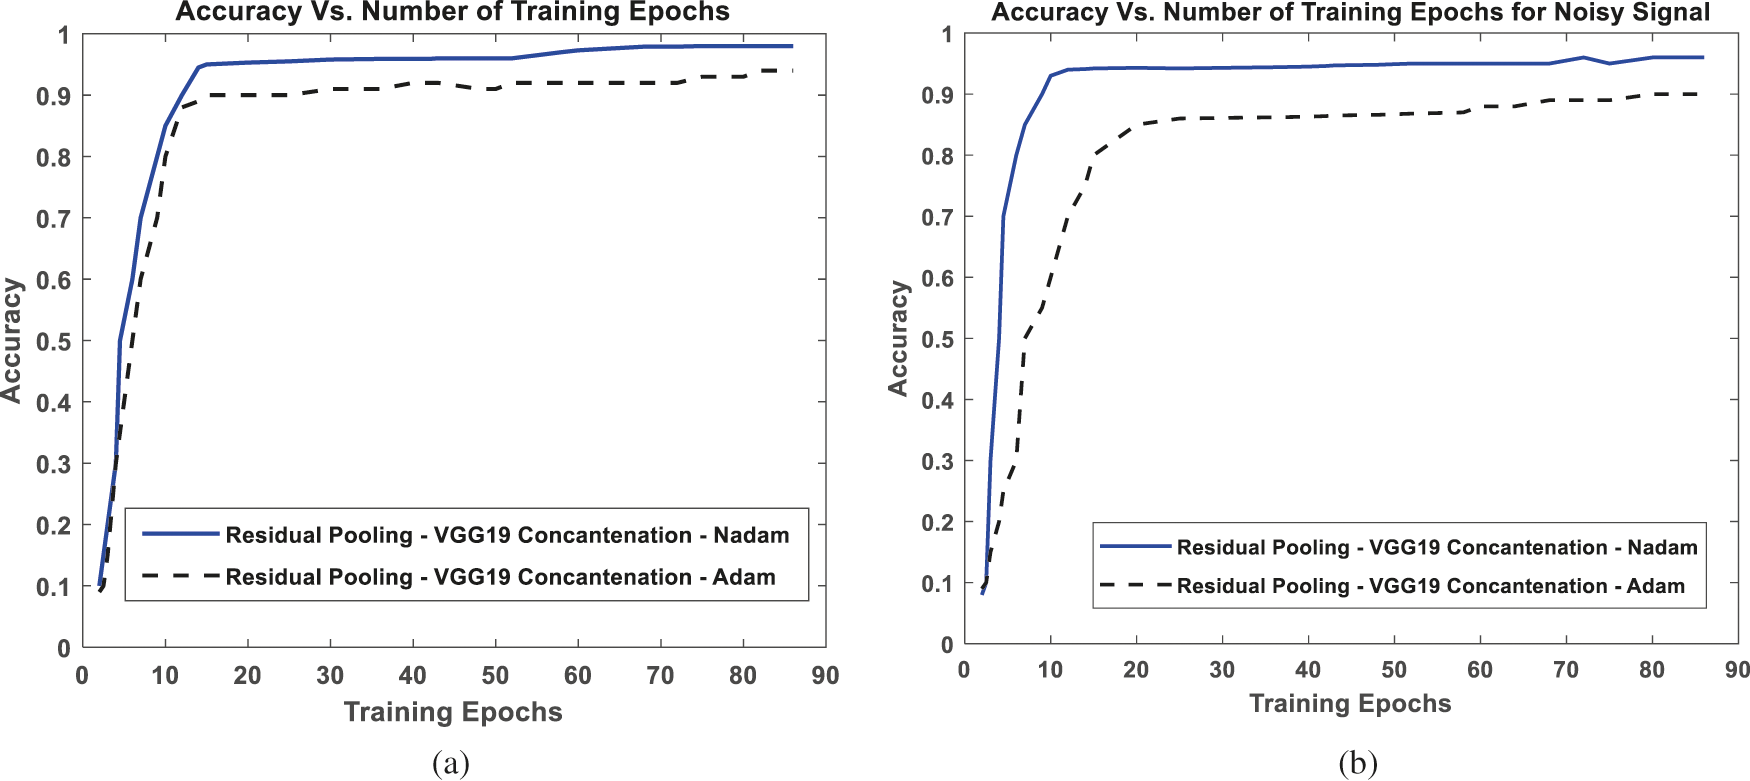
Figure 8: Effectiveness of residual pooling compared to different training optimizers (a) Clear PD signal and (b) Noisy PD signal
From Fig. 8, VGG19 with Nadam optimizers shows better performance. In continuation, to check the practicality of the proposed algorithm, the proposed algorithm is checked with on-site PD readings.
5.1 Case 1: Different in Sample Count for Each Configuration
In this work, 300 samples are considered for each configuration from F1 to F10, with a total of 3000 samples. 2400 samples for training and 600 samples for testing are assigned in this work. Tab. 2 shows the recognition rate in percentage. The highest RR 98.2% achieved in the VGG19 concatenation hybrid with Nadam optimizer. The prediction rate for F1 and F8 is comparatively low when compared to others. The RR for Resnet101 concatenation is 95.5% for Nadam and 92.2% for Adam optimizers. Thus, the proposed residual pooling layer can extract spatial information from the PRPD and leads to orderless features causes a better classification rate. In continuation to that, the training time of the proposed algorithm is low compared to other algorithms.
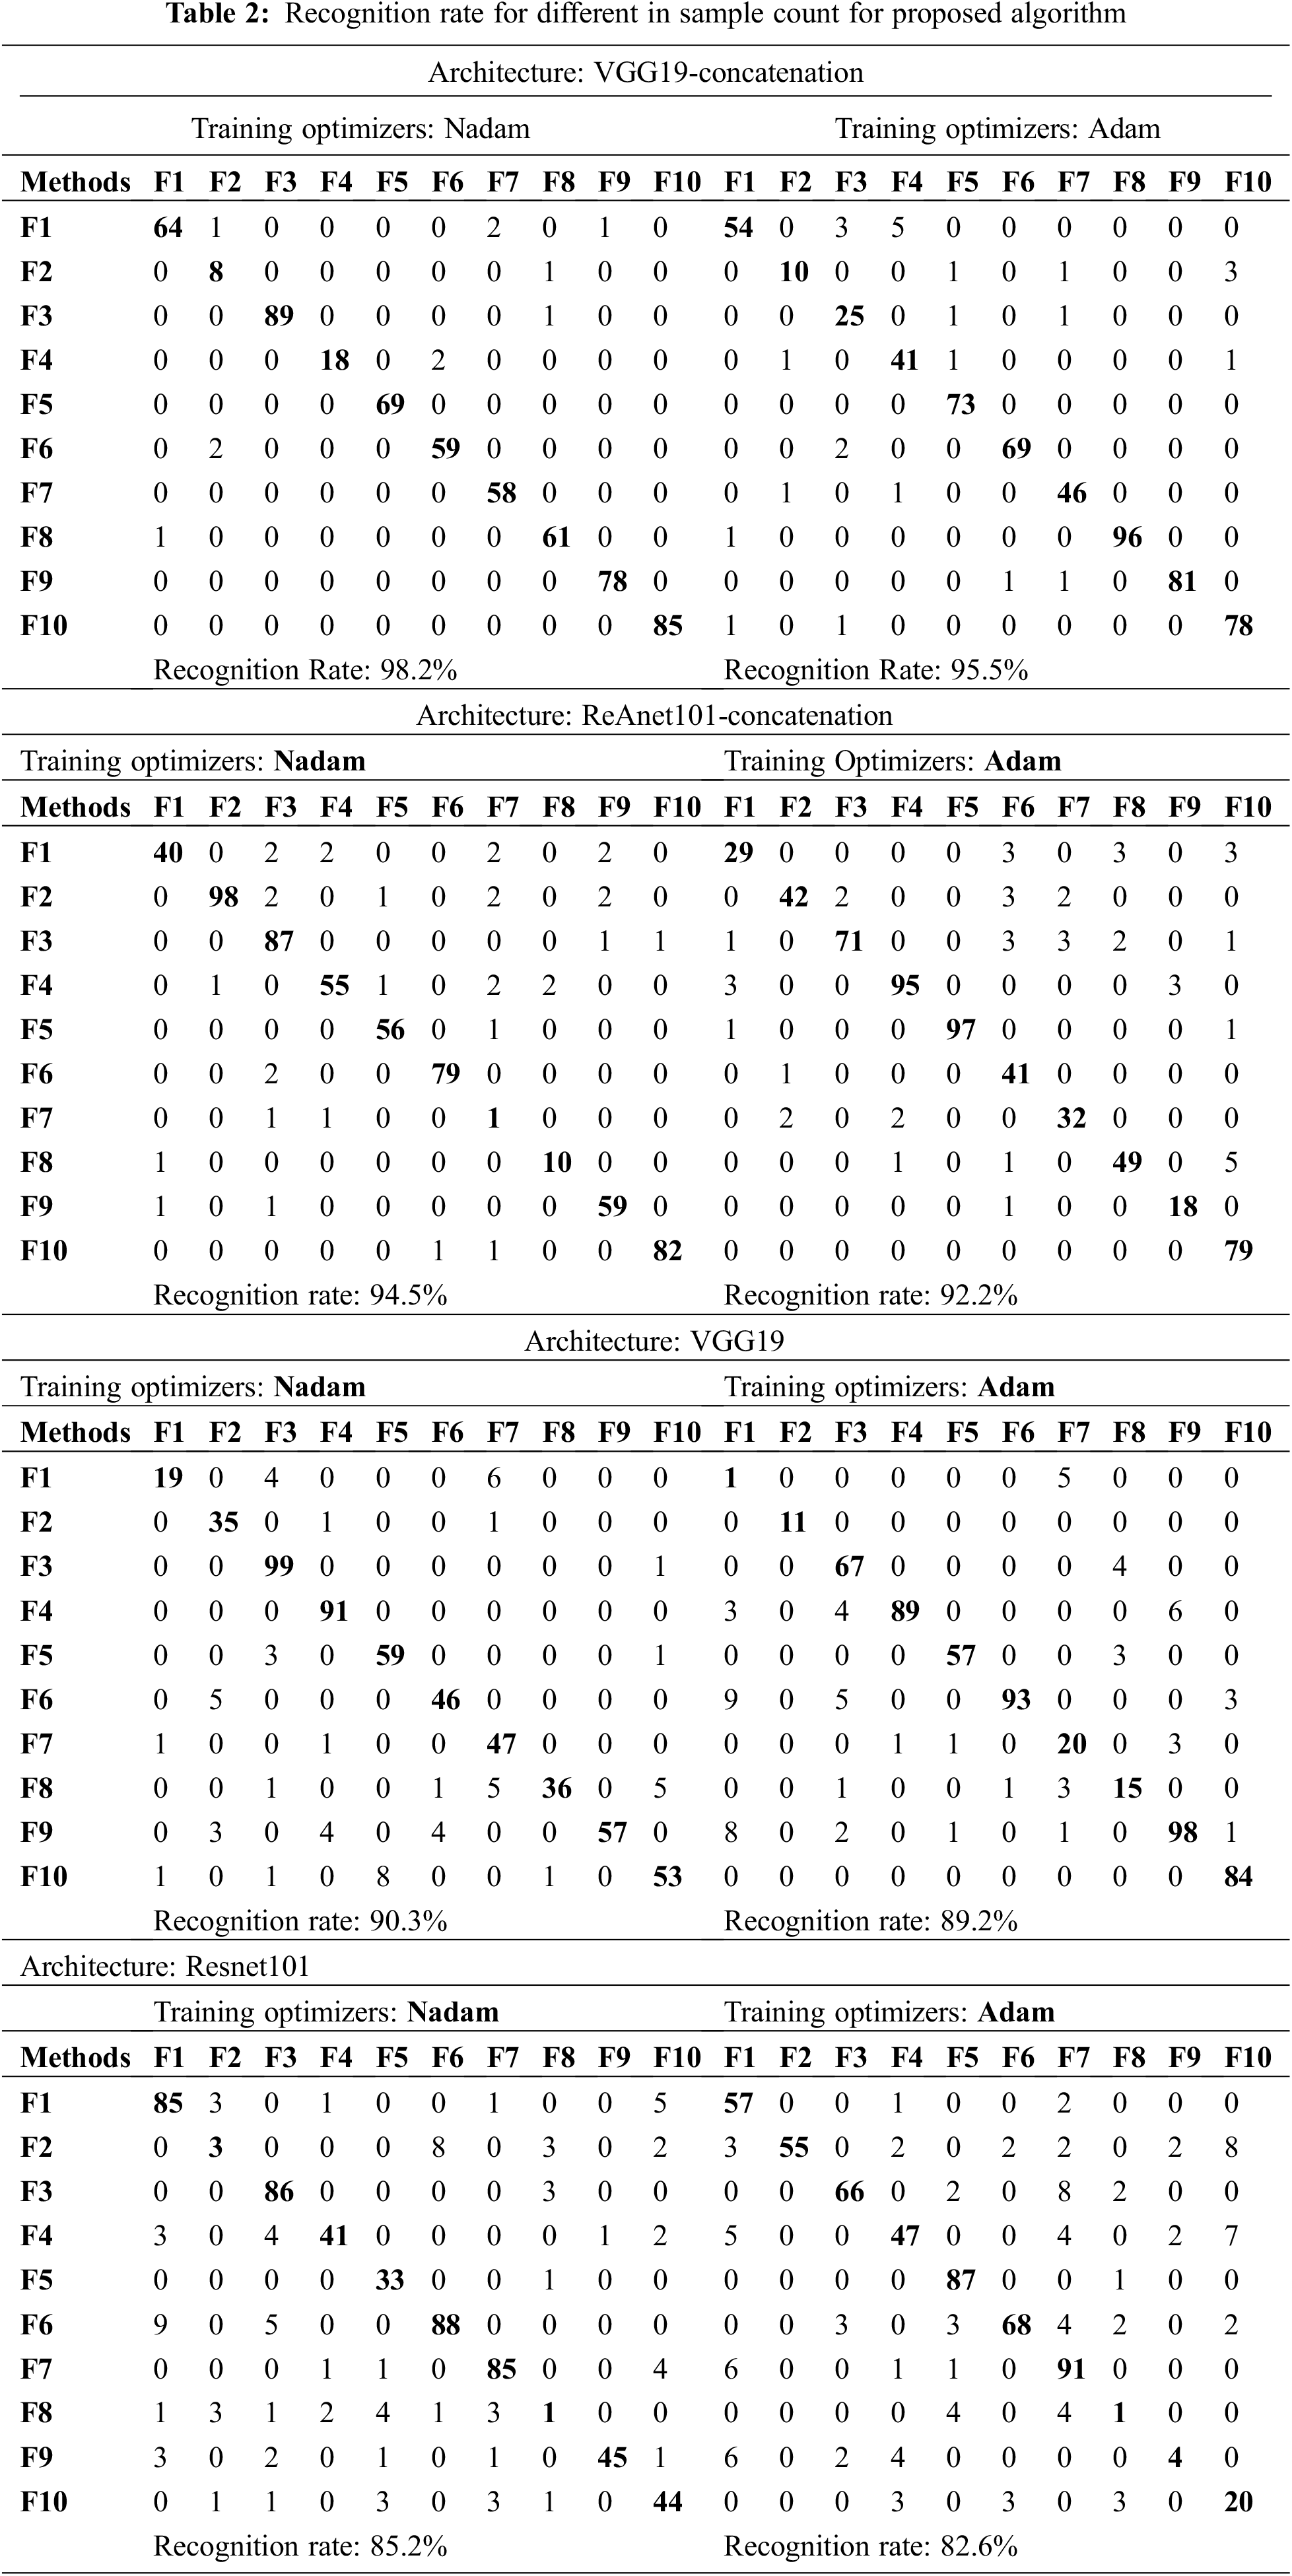
A better recognition rate is achieved because of extracting spatial information from the PRPD patterns and orderless high-level features using aggregation modules. The RR for Resnet101 architecture is 85.2% for Nadam and 82.6% for Adam optimizers. To check the practicality of the proposed algorithm, on-site PD readings are taken for testing the proposed algorithm.
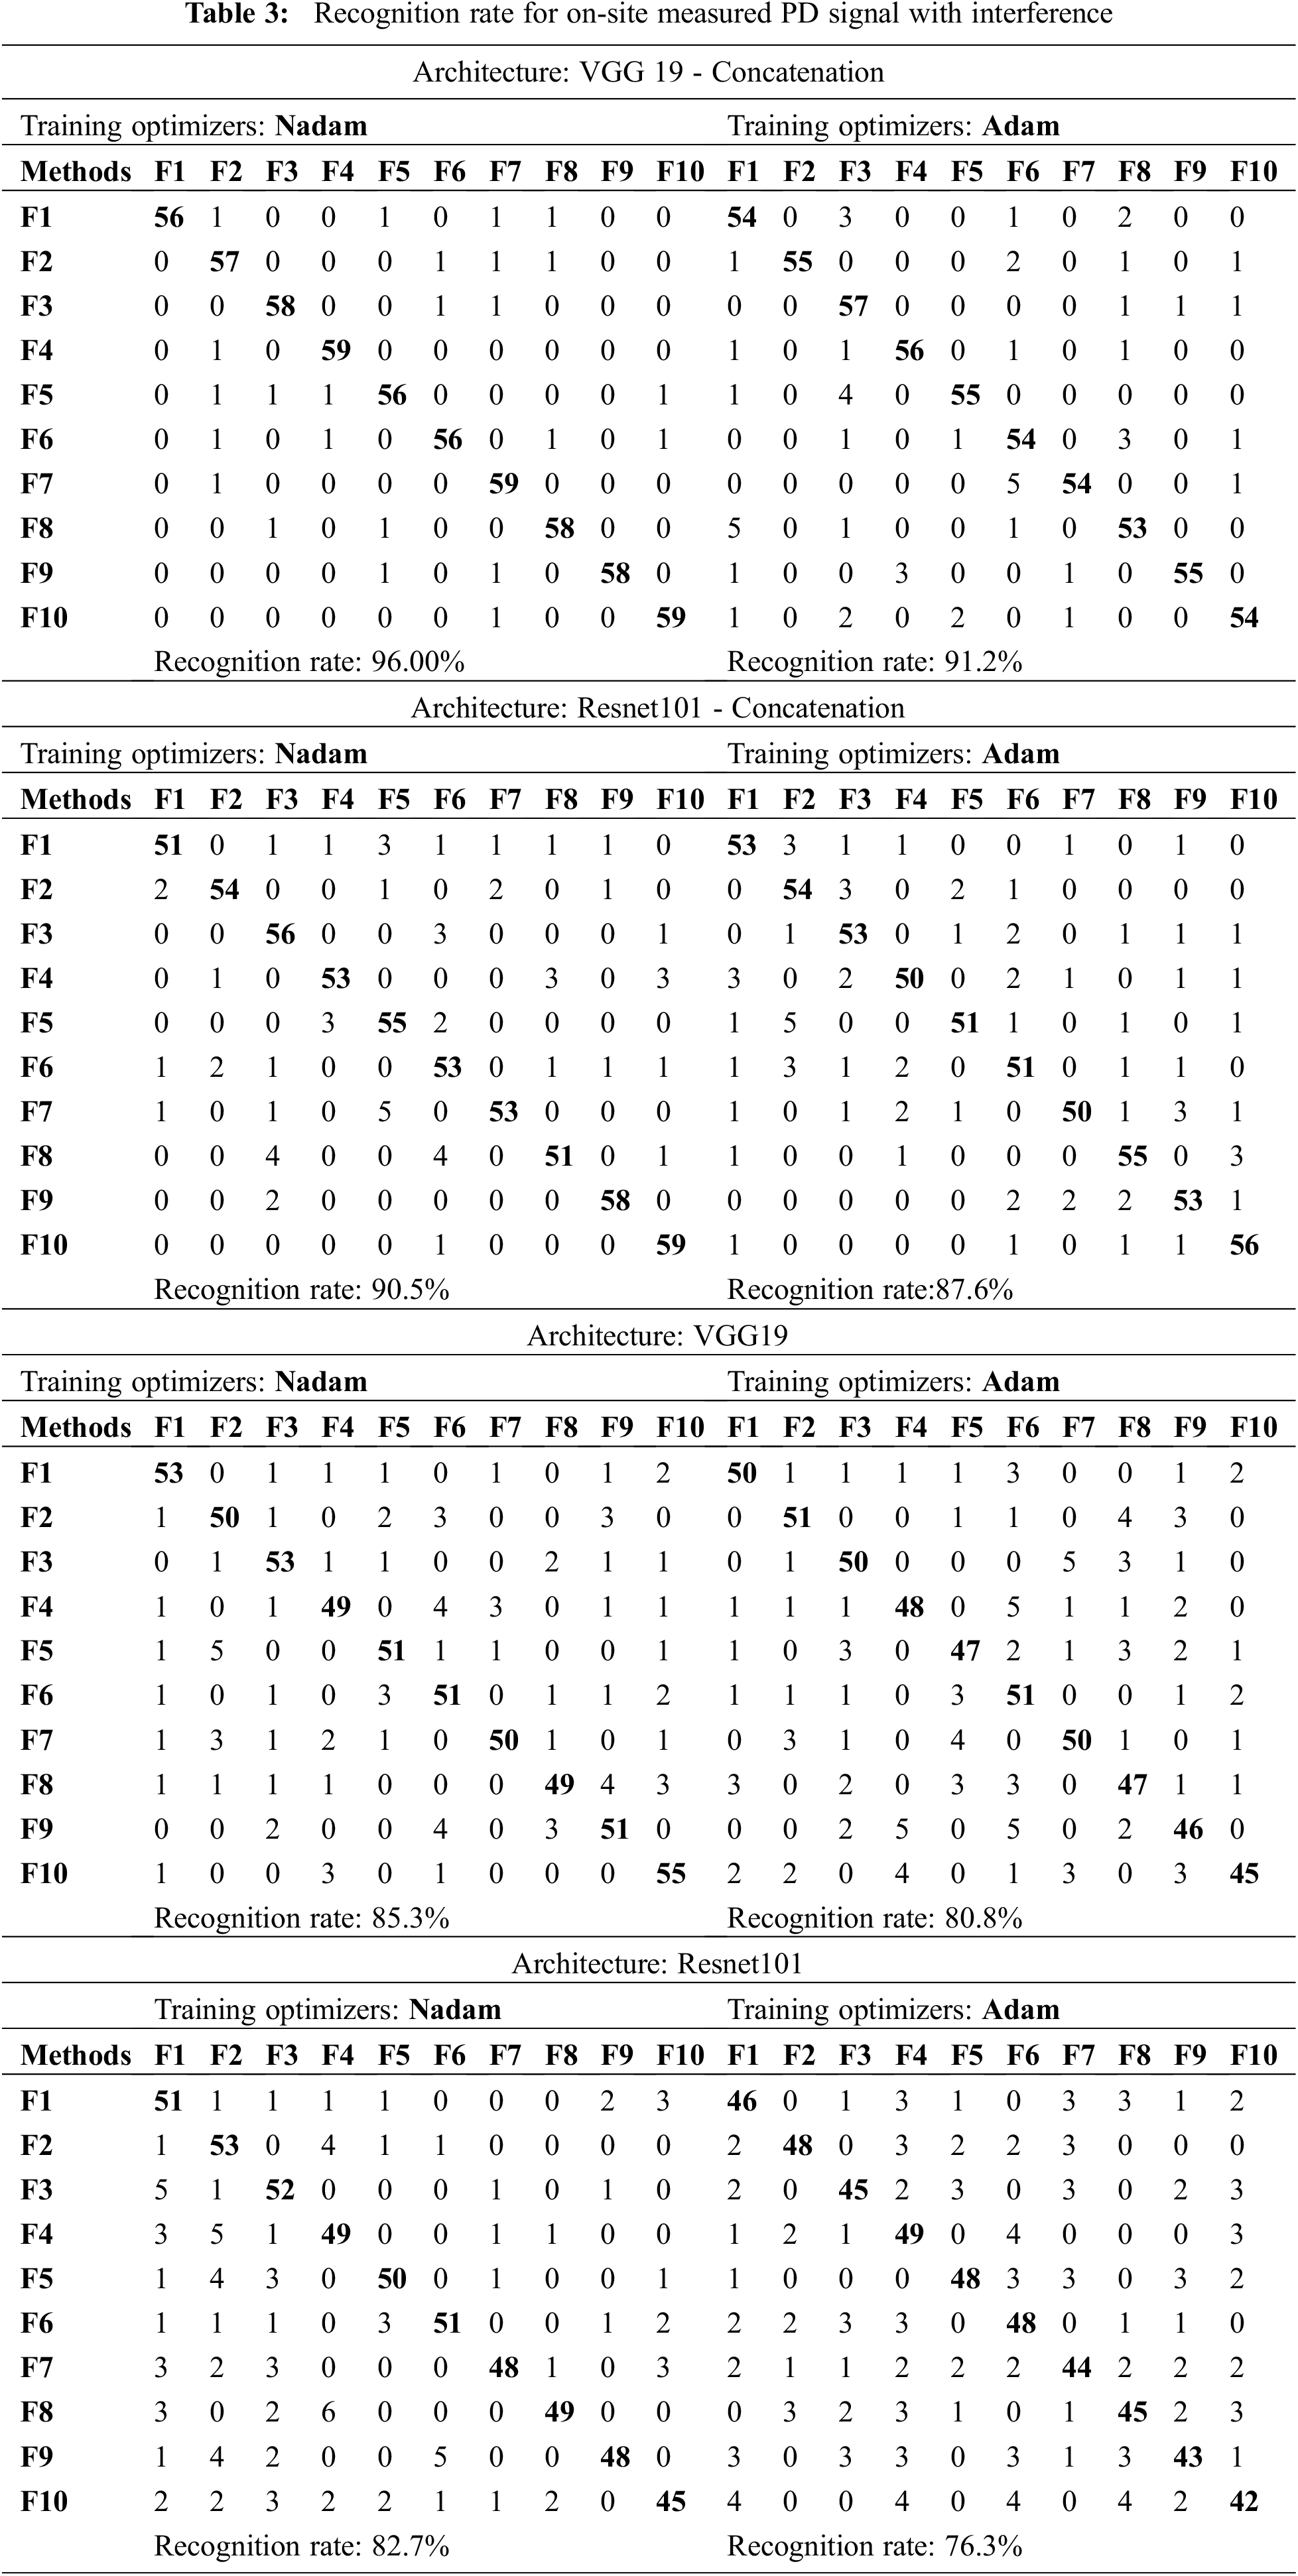
5.2 Case 2 Describes the Presence of External Interference Presence in the PD Signature
When PD measurements happens at online, lot of interferences will occur in the PD signals which get reflected PRPD signature patterns leading to misclassification or wrong interpretation of data leads to a severe issue in the condition monitoring or lifetime estimation of the high voltage transformer. The main reason for the external inference is due to detection methods used for PD measurement. Swapping of measured PD signal containing a broad spectrum of the frequency with external noise having various frequencies causes overlap in the prediction of fault in HV apparatus.
Various researchers introduce de-noising approaches in [30]. But they have specific issues like the de-noising algorithm requires human involvement to process, and further, it requires more storage capacity of post-processing. Three different external interference are discrete spectral interference, white noise, and random noises are studied from the review papers. For this work, 600 different online PD signals are measured and used for analysis. In common, the measured PD signal has a data size (MBs) for storing in system memory. Thus, our proposed work can predict the PD patterns even with external interference because it retains the spatial information of the PRPD pattern along with the orderless generation of features. From Tab. 3, the highest RR attained is 96% with VGG19 concatenation hybrid with Nadam optimizers and the minimum RR reported is 76.3%.
As far as the intricacy is apprehensive, the proposed algorithm model is easy since it wants a single convolution and classification layer for training the network. The main advantage of the proposed algorithm over [18] does not require any dictionary for learning during training. It automatically learns from the backbone architecture extracted features. Comparing Adam and Nadam training optimizers for condition monitoring of high voltage transformer fault detection conditions, Nadam shows a better recognition rate and the minimum processing time and loss rate. Because it's effortless to configure at any circumstance, their parameters perform well, and it converges rapidly.
Deep residual pooling network produces a better recognition rate for condition monitoring of high voltage transformer from different PD signature datasets than Resnet101 subjected to Nadam and Adam training optimizers. The inference stated that:
❖ The proposed network has shown an enhanced recognition rate of 2.5% for different optimizers and produces 4% of better RR than different backbone architecture. The RR may increase upon the data enlargement.
❖ Deep residual pooling network can extract spatial information using residual encoding module with orderless low dimensional data using aggregation module from PRPD patterns. It is a more flexible tool with a fast response because of eliminating dictionaries compared to other deep learning approaches.
❖ Thus, the proposed algorithm is extra appropriate for engineering applications for data analytics and prediction.
Acknowledgement: The authors are grateful to the management of National Engineering College, Kovilpatti, Tamilnadu, India to carry out this part of the research work at High Voltage Laboratory of Electrical and Electronics Engineering Department.
Funding Statement: This work is financially supported by the Department of Science and Technology – fund for improvement of S&T infrastructure in universities & higher educational institutions (DST-FIST) Grant ID (SR/FST/College-061/2017).
Conflicts of Interest: The authors declare that there is no conflict of interest.
1. L. Shibo, C. Hua, S. Animesh and B. T. Phung, “Condition monitoring based on partial discharge diagnostics using machine learning methods: A comprehensive state-of-the-art review,” IEEE Transactions on Dielectrics and Electrical Insulation, vol. 27, no. 6, pp. 1861–1888, 2020. [Google Scholar]
2. J. Hamed, S. Saeed and K. Behzad, “Separation and classification of concurrent partial discharge signals using statistical-based feature analysis,” IEEE Transactions on Dielectrics and Electrical Insulation, vol. 27, no. 6, pp. 1933–1941, 2020. [Google Scholar]
3. J. A. Ardila-Rey, J. M. Martinez-Tarifa and G. Robles, “Automatic selection of frequency bands for the power ratios separation technique in partial discharge measurements: Part II, PD source recognition andapplications,” IEEE Transactions on Dielectrics and Electrical Insulation, vol. 22, no. 4, pp. 2293–2301, 2015. [Google Scholar]
4. J. A. Ardila-Rey, J. M. Martínez-Tarifa, G. Robles and M. V. Rojas Moreno, “Partial discharge and noise separation by means of spectral power clustering techniques,” IEEE Transactions on Dielectrics and Electrical Insulation, vol. 20, no. 4, pp. 1436–1443, 2013. [Google Scholar]
5. H. Janani, B. Kordi and M. J. Jozani, “Classification of simultaneousmultiple partial discharge sources based on probabilistic interpretationusing a two-step logistic regression algorithm,” IEEE Transactions on Dielectrics and Electrical Insulation, vol. 24, no. 1, pp. 54–65, 2017. [Google Scholar]
6. R. V. Maheswari, P. Subburaj, B. Vigneshwaran and L. Kalaivani, “Non linear support vector machine based partial discharge patterns recognition using fractal features,” Journal of Intelligent and Fuzzy Systems, vol. 27, no. 5, pp. 2649–2664, 2014. [Google Scholar]
7. W. J. K. Raymond, H. A. Illias and A. H. A. Bakar, “High noise tolerance feature extraction for partial discharge classification in XLPE cable joints,” IEEE Transactions on Dielectrics and Electrical Insulation, vol. 24, no. 1, pp. 66–74, 2017. [Google Scholar]
8. V. Basharan, W. I. M. Siluvairaj and V. M. Ramasamy, “Recognition ofmultiple partial discharge patterns by multi-class support vector machine using fractal image processing technique,” IET Science Measurement and Technology, vol. 12, no. 8, pp. 1031–1038, 2018. [Google Scholar]
9. R. Rostaminia, M. Saniei, M. Vakilian, S. S. Mortazavi and V. Parvin, “Accurate power transformer PD pattern recognition via its model,” IET Science Measurement and Technology, vol. 10, no. 7, pp. 745–753, 2016. [Google Scholar]
10. W. Zhou, Y. Liu, P. Li, Y. Wang and Y. Tian, “Feature parameters extraction of power transformer PD signal based on texture features in TF representation,” IET Science Measurement and Technology, vol. 11, no. 4, pp. 445–452, 2017. [Google Scholar]
11. M. Allahbakhshi and A. Akbari, “A method for discriminating originalpulses in online partial discharge measurement,” Measurement, vol. 44, no. 1, pp. 148–158, 2011. [Google Scholar]
12. H. Janani and B. Kordi, “Towards automated statistical partial discharge source classification using pattern recognition techniques,” IET High Voltage, vol. 3, no. 3, pp. 162–169, 2018. [Google Scholar]
13. B. Vigneshwaran, M. Willjuice Iruthayarajan and R. V. Maheswari, “Partial discharge pattern analysis using multi-class support vector machine to estimate cavity size and position in solid insulation,” Soft Computing, vol. 24, pp. 10645–10656, 2019. http://dx.doi.org/10.1007/s00500-019-04570-7. [Google Scholar]
14. Y. Huang and Z. Wang, “Multi-granularity pruning for deep residual networks,” Journal of Intelligent and Fuzzy Systems, vol. 39, no. 5, pp. 7403–7410, 2020. [Google Scholar]
15. G. Yanyan, W. Xin, X. Pengcheng and X. Xinzheng, “An ensemble learning framework for convolutional neural network based on multiple classifiers,” Soft Computing, vol. 24, pp. 3727–3735, 2020. [Google Scholar]
16. C. Bhanja, D. Bisharad and R. H. Laskar, “Deep residual networks for pre-classification based Indian language identification,” Journal of Intelligent and Fuzzy Systems, vol. 36, no. 3, pp. 2207–2218, 2019. [Google Scholar]
17. C. Jingwen, X. Xin and D. Hongshe, “Fault detection of insulators using second-order fully convolutional network model,” Mathematical Problems in Engineering, vol. 2019, pp. 1–10, 2019. [Google Scholar]
18. X. Zhang, K. Zhang, M. Jiang and L. Yang, “Research on the classification of lymphoma pathological images based on deep residual neural network,” Technology and Health Care, vol. 29, no. S1, pp. 335–344, 2021. [Google Scholar]
19. Y. Song, F. Zhang, Q. Li, H. Huang, L. J. O'Donnell et al., “Locally-transferred fisher vectors for texture classification,” in Proc. of the IEEE Int. Conf. on Computer Vision, Venice, Italy, pp. 4912–4920, 2017. [Google Scholar]
20. X. Dai, J. Yue-Hei Ng and L. S. Davis, “FASON: First and second order information fusion network for texture recognition,” in Proc. of the IEEE Conf. on Computer Vision and Pattern Recognition, Honolulu, HI, USA, pp. 7352–7360, 2017. [Google Scholar]
21. H. Zhang, J. Xue and K. Dana, “Deep ten: Texture encoding network,” in Proc. of the IEEE Conf. on Computer Vision and Pattern Recognition, Ithaca, New York, United States, pp. 708–717, 2017. [Google Scholar]
22. J. Xue, H. Zhang and K. Dana, “Deep texture manifold for ground terrain recognition,” in Proc. of the IEEE Conf. on Computer Vision and Pattern Recognition, Ithaca, New York, United States, pp. 558–567, 2018. [Google Scholar]
23. T. Y. Lin and S. Maji, “Visualizing and understanding deep texture representations”, in Proc. of the IEEE Conf. on Computer Vision and Pattern Recognition, Las Vegas, NV, USA, pp. 2791–2799, 2016. [Google Scholar]
24. Szeto, P. Man, Parvin, Hamidb, Mahmoudi, Mohammad Rezad; Tuan, Bui Anh, Pho, Kim-Hungg, “Deep neural network as deep feature learner,” Journal of Intelligent and Fuzzy Systems, vol. 39, no. 1, pp. 355–369, 2020. [Google Scholar]
25. L. Liu and P. Fieguth, “Texture classification from random features,” IEEE Transactions on Pattern Analysis and Machine Intelligence, vol. 34, no. 3, pp. 574–586, 2012. [Google Scholar]
26. M. Shangbo, D. Rajan and C. Liang Tien, “Deep residual pooling network for texture recognition,” Pattern Recognition, vol. 112, pp. 107817–107827, 2021. [Google Scholar]
27. H. Jégou, M. Douze, C. Schmid and P. Pérez, “Aggregating local descriptors into a compact image representation,” in: CVPR 2010-23rd IEEE Conf. on Computer Vision and Pattern Recognition, IEEE Computer Society, Las Vegas, NV, USA, pp. 3304–3311, 2010. [Google Scholar]
28. D. G. Lowe, “Distinctive image features from scale-invariant keypoints,” International Journal of Computer Vision, vol. 60, no. 2, pp. 91–110, 2004. [Google Scholar]
29. K. Simonyan and A. Zisserman, “Very deep convolutional networks for large-scale image recognition,” arXiv:1409.1556, 2014. [Google Scholar]
30. B. Vigneshwaran, R. V. Maheswari, L. Kalaivani, S. Vimal, R. Seungmin et al., “Recognition of pollution layer location in 11 kV polymer insulators used in smart power grid using dual-input VGG convolutional neural network,” Energy Reports, vol. 7, pp. 7878–7889, 2021. http://dx.doi.org/10.1016/j.egyr.2020.12.044. [Google Scholar]
 | This work is licensed under a Creative Commons Attribution 4.0 International License, which permits unrestricted use, distribution, and reproduction in any medium, provided the original work is properly cited. |