DOI:10.32604/iasc.2022.025632
| Intelligent Automation & Soft Computing DOI:10.32604/iasc.2022.025632 | |
| Article |
Computer Aided Coronary Atherosclerosis Plaque Detection and Classification
1Department of Electronics and Communication Engineering, Sri Sairam Institute of Technology, Chennai, 600044, Tamilnadu, India
2Department of Electronics and Communication Engineering, K.S.R. College of Engineering, Tiruchengode, Namakkal, 637215, Tamilnadu, India
*Corresponding Author: S. Deivanayagi. Email: deivasubbu13@gmail.com
Received: 30 November 2021; Accepted: 06 January 2022
Abstract: Coronary artery disease (CAD) remains a major reason for increased mortality over the globe, comprising myocardial infarction and ischemic cardiomyopathy. The CAD is highly linked to coronary stenosis owing to the encumbrance of atherosclerotic plaques. Particularly, diversified atherosclerotic plaques are highly responsible for major cardiac adverse events over the calcified and non-calcified plaques. There, the recognition and classification of atherosclerotic plaques play a vital role to prevent and intervene in CAD. The process of detecting various class labels of the atherosclerotic plaques is significant to identify the disease at the earlier stages. Since several automated coronary plaque recognition models are mainly based on handcrafted features, it is needed to design deep learning (DL) models for improved performance. With this motivation, this study introduces an automated invasive weed optimization with densely connected networks (AIWO-DN) for coronary atherosclerosis plaque recognition and classification. Primarily, the Two Dimensional (2D) transverse cross-sectional image with the provided centreline from the input 3-D Computed Tomography Angiography (CTA) image is extracted in three orthographic aspects. In addition, the coronary lumen is segmented on every cross section and extracts the region of interest (RoI). Moreover, the Densely Connected Networks (DenseNet169) model is applied to derive the useful set of features vectors. Furthermore, invasive weed optimization (IWO) with weighted extreme learning machine (WELM) based classification model is employed to detect and classify different classes of atherosclerotic plaques. In order to validate the performance of the superior outcomes of the Automated Invasive Weed Optimization – Deep Learning (AIWO-DN) technique, a set of simulations were performed and the outcomes are inspected interms of varying metrics. The experimental results showed the betterment of the AIWO-DN technique over the existing techniques interms of several evaluation metrics.
Keywords: Coronary artery disease; atherosclerotic plaque; deep learning; densenet; classification; parameter optimization
Coronary artery disease (CAD) is one of the most widespread types of heart disease [1]. CAD arises once the atherosclerotic plaque build-up in the wall of the coronary arteries. It might result in stenosis that is limited blood flow to the myocardium, occlusion, or narrowing of the coronary artery lumen and it could lead to myocardial ischemia. Atherosclerotic plaque is categorized into mixed, calcified, and non-calcified plaque that is plaque comprising non-calcified and calcified components [2]. As varying grades of stenosis and distinct kinds of plaque result in distinct patients’ management approaches, it is critical to characterize and detect coronary artery stenosis and plaque [3]. Coronary Computed Tomography angiography (CCTA) is a well-known modality for exclusion and detection of patients with suspicious CAD. It permits for non-invasive characterization and detection of coronary artery stenosis and plaque. Nowadays, this task is performed typically in the healthcare centre by visual assessment, or semi-automatically by using arterial and lumen wall segmentation and then, define the existence of stenosis or plaque [4]. But, the former suffers from considerable inter-observer variability, once it is implemented by well trained professionals, whereas the latter is based on wall segmentation and coronary artery lumen that is cumbersome and usually time-consuming, particularly in images with wide-ranging imaging artefacts or atherosclerotic plaque [5]. Considering the significance of plaque detection, several approaches for coronary artery plaque quantification and detection were introduced.
The fully automated algorithm could precisely identify calcified lesions and acquire Coronary Artery Calcium Scoring (CACS) from CCTA demonstrate to be medically appropriate [6] since this might avoid the necessity for devoted non-contrast scans while minimizing variability, radiation dose, and time of the procedure [7]. The Machine Learning (ML) method is a branch of computer science where computer algorithm is trained to identify certain patterns and features from input data. In cardio-vascular imaging, ML algorithm has been trained to manually identify calcified lesions, calculate CACS from non-contrast scan, non-obstructive and obstructive lesions [8]. Though efficient in several applications, conventional neural network is not well-suited for tasks that need sequential data processing, viz., where the data exhibits spatial or temporal dynamics like speech recognition, text, and image processing. For this task, recurrent neural network (RNN) has been proved to be very efficient.
In recent times, research using convolution neural network (CNN) for the detection of calcium without needing coronary segmentation has yielded good results for the detection of Coronary Artery Calcium (CAC) [9]. But, the accuracy of a Deep Learning (DL) approach executing Recurrent Neural Network (RNN)- Long Short Term Memory (LSTM) hasn’t been examined so far. Increased use of this technique for the detection of pathology has two possible consequences. It provides further layers of security to safeguard pathology recognition that is extremely important for those with limited experience or trainees in interpretation of CCTA and enhanced workflow through automatic highlighting of atherosclerotic plaque [10]. Also, it assists radiotherapists to distinguish stent from calcification. This study introduces an automated invasive weed optimization with densely connected networks (AIWO-DN) for coronary atherosclerosis plaque recognition and classification. The AIWO-DN technique involves the Densely Connected Networks (DenseNet169) model for the generation of features vectors. Moreover, invasive weed optimization (IWO) with weighted extreme learning machine (WELM) based classification model is employed to detect and classify different classes of atherosclerotic plaques. The design of IWO algorithm assists in appropriately choosing the parameters involved in the WELM model and thereby resulting to enhance plaque performance. For examining the outstanding performance of the AIWO-DN technique, a wide range of experiments were carried out and the outcomes are inspected interms of varying metrics.
Yang et al. [11] constructed a support scheme for the biosensor-enabled DL concept for atherosclerosis disease detection. Using this medical information, this arithmetical method could forecast heart disease-based DL-enabled k-means geometric distribution, artificial neuron model. The atherosclerotic plaque formation describes the earlier atherosclerotic lesion’s growth in timely method. Jain et al. [12] focused on automatic plaque classification in the internal carotid artery (ICA) with hybrid deep learning (HDL) and solo deep learning (SDL) algorithms. These methods consist of 10 kinds of HDL or SDL algorithms using a depth of four layers. Five of the model uses cross-entropy (CE)-loss and another five model uses Dice similarity coefficient (DSC)-loss function acquired from UNet+, UNet, SegNet-UNet+, SegNet, and SegNet-UNet.
Li et al. [13] developed an end-to-end DL-CNN method to automatically detect calcified plaque, media-adventitia border, and luminal region in Intravascular Ultrasound (IVUS) images. An overall of 713 grayscale IVUS images from 18 people is utilized as trained data for the presented DL method. The method is created by utilizing the three modified U-Nets and integrating with the concepts of cascaded network to avoid mistakes in the recognition of calcification due to the intervention of pixel outside the plaque region. Niu et al. [14] demonstrated the benefit of melding DL with current attenuation compensation approach to attain precise atherosclerotic tissue segmentation in Optical Coherence Tomography (OCT) images. By integrating OCT images with contrast-enhanced and attenuation-compensated equivalents, over-all classification performance was enhanced. Abdolmanafi et al. [15] presented a spatial pyramid pooling model with dilated convolution for semantic separation to extract atherosclerotic tissue nevertheless of their kinds and training a sparse Auto Encoder (AE) for reconstructing the input feature and increase the plaque type characterization and training data in OCT image. Olender et al. [16] proposed an image-based tissue characterization technique employed for whole acquisition sequence post hoc for the calculation of diseased vessels. The pixel-based techniques use areas of arterial physiology and pathology, and leverage advances in CNN technology for segmenting diseased vessel walls into the similar tissue class as virtual histology with grayscale Intravascular Ultrasound (IVUS) image. Arputham et al. [17] introduced a DL algorithm for automatically detecting and measuring plaque in transverse B-mode images of the carotid artery. The presented approach takes a transverse B-mode image of the carotid artery as input and classifies the vessel wall in the transverse cross section image with CNN model.
3 The Proposed AIWO-DN Technique
In this study, a novel AIWO-DN technique has been developed for coronary atherosclerosis plaque recognition and classification. The AIWO-DN technique encompasses a series of processes namely pre-processing, DenseNet169 based feature extraction, WELM based classification, and IWO based parameter optimization. The design of IWO algorithm assists in appropriately choosing the parameters involved in the WELM model and thereby resulting to enhance plaque performance. Fig. 1 illustrates the working process of proposed AIWO-DN technique.

Figure 1: Overall process of AIWO-DN technique
Primarily, it can be retrieving 2D transverse cross-sectional image beside the provided centreline in the new 3D CTA image from 3 orthographic views. Secondary, it can be segmentation the coronary lumen on all cross-sectional and evaluated the lumen radius by averaging on segmented of coronary artery that is utilized for extracting Region of Interest (ROI) on the cross- sectional.
3.2 Feature Extraction Using DenseNet169 Model
At this stage, the generation of the feature vectors takes place using the DenseNet169 model. Dense-Net is a CNN with dense connections. Stimulated by the feature transfers method of “jump connection” in Res-Net method framework, this presents a “front layer transfers” method, namely, an input of some next layer from the networks are superposition of output resultant of every preceding layer, and outcomes of this layer that transferred to next layer as input. In Res-Net NN transmissions feature with identity map for preventing gradient dispersion. The Res-Net feature is passed as follows:
The feature of Dense-Net is for utilizing the transfers method amongst the front layers. The Dense-Net feature transfers approach as:
where

Figure 2: Layered in DenseNet169 model
3.3 WELM Based Classification Model
WELM is considered as a cost-sensitive learning variety of ELM effectively for handling imbalanced data [19]. Related to CS-SVM, the basic concept of WELM is for assigning distinct penalties to various types, where the minority class is a superior penalty factor
where
where
Clearly, no matter the weight distribution technique was utilized, some kinds of instances are provided further weight. The users are determine
3.4 Parameter Tuning Using IWO Algorithm
In order to determine the weight values of the KELM model, the IWO algorithm can be utilized. The IWO algorithm is a bio-inspired arithmetical optimization approach which stimulates the natural behaviour of weeds. Even though the process is simple, it is stated to be powerful in converging to the optimum solution by utilizing key characteristics like competition, seeding, and growth in a weed colony [21]. Weed tends to colonize and discover proper places for reproduction and growth. The population contains the overall amount of weeds. The appropriateness of every herb is defined by how closer or further it is from the optimum solution. A sequence of seeds is created around every weed, where higher-condition weed produces extra seeds when compared to lower-condition weed. Normally, the produced seed is distributed around the mother grass with a different variance and mean equivalent to zero. Then, the population is upgraded to add each weed and seed. This procedure repeats till the end condition is satisfied. The IWO approach contains four fundamental stages competitive exclusion, population initialization, reproduction, and spatial distribution. Population Initialization: the population is distributed arbitrarily over the D-dimension solution space since weeds are generated arbitrarily. The fitness of every herb is evaluated. The worst and best fitness values are defined. Reproduction: The amount of seeds released by every weed is calculated according to the fitness value. All the seeds have an opportunity to reproduce, and the reproduction rate ranges from maximal to minimal based on the best to worst fitness seeds. Then, this seed developed into wild plant which can produce novel units.
Now, f represents the fitness of the weed. fworst and fbest denote the worst and best fit of the existing population, correspondingly. Smin and Smax indicate the minimal and maximal amount of seeds, correspondingly. The seed produced are distributed arbitrarily over the D-dimension searching space, with arbitrary numbers usually having a mean equivalent to 0 with a variance. By arbitrarily distributing this seed, it is safeguarded that they are closer to the parent plants. But, the Standard Deviation (SD) (σ) of the arbitrary function might reduce from a predetermined primary value (σinit) to the last value (σfinal) at all the iterations.
where itermax represents the maximal amount of iterations, σcur indicates the SD at the existing time step, σinit denotes the initial standard deviation, σfinal signifies the last standard deviation, and n implies the modulation index. Competitive exclusion: Afterward a provided iteration, the amount of weeds in a colony would exceed the maximal population number with quick reproduction. In this period, all the weeds were provided a seed production permit. Then, the seed produced is permitted to distribute into the searching space. Once each seed has found a location in the searching space, they organize with their parent (as a colony of weeds).
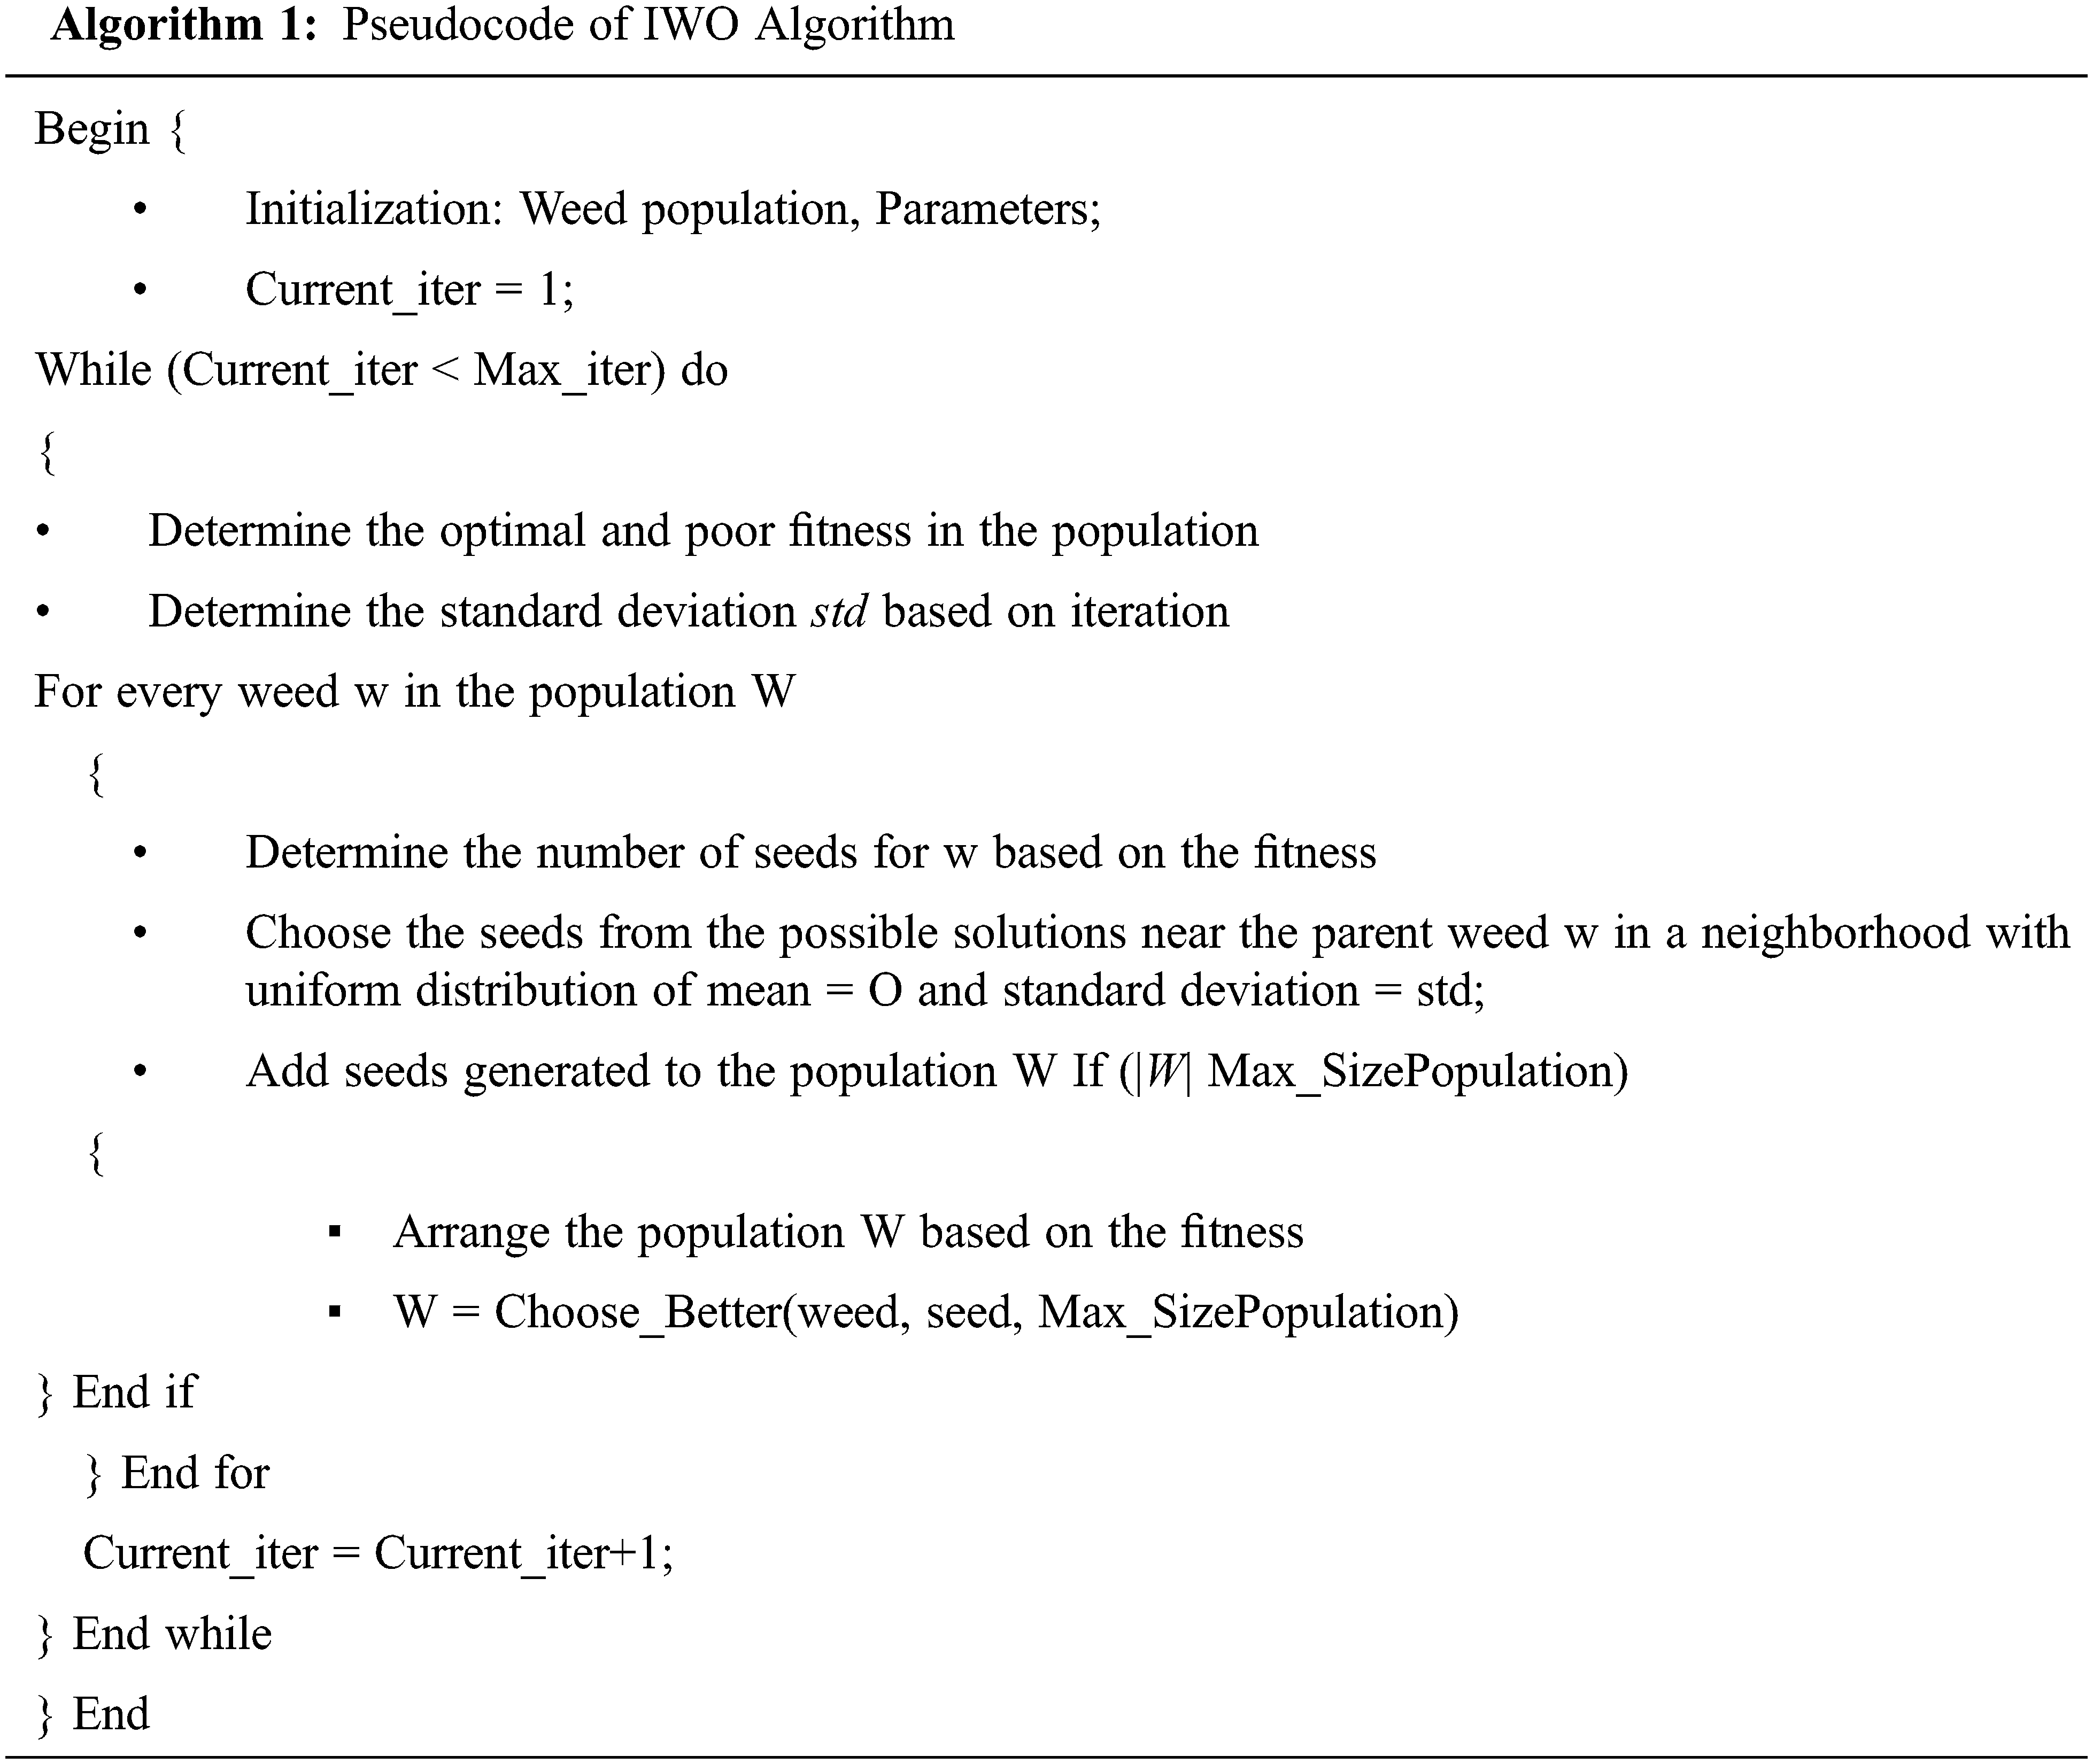
Then, the low fitness weed is removed for reaching the maximal population permitted in a colony. Therefore, seeds and weeds are organized together and those with optimal fitness survive and are permitted to reproduce. This procedure repeats till the maximal iteration or other end conditions are met. The weeds with the optimal fitness are chosen as the best possible solution. The IWO method comes with a FF for gaining increased classification efficiency. It defines a positive integer for representing the optimum efficiency of the candidate solutions. During this study, the minimized classification error rate has been regarded as FF, to provide in Eq. (8). An optimum solution is a lesser error rate and the worst solution gains an improved error rate.
The performance validation of the AIWO-DN technique is tested using the Rotterdam Coronary Artery Evaluation Dataset [22], which includes 18 CTA images with manually derived center lines by 3 experts. The dataset has 1786 atherosclerotic plaques with 729 under non-calcified plaques, 511 under calcified plaques, 546 mixed plaques, and 14,628 normal cross sections. Primarily, the classification results analysis of the AIWO-DN technique take place under axial and cross section images are tabulated in Tab. 1.

Fig. 3 illustrates the performance validation of the AIWO-DN technique on the classification of axial CTA images [23]. The results show that the AIWO-DN technique has gained improved classification performance in all classes. For instance, the AIWO-DN technique has identified the images under Non-calcified class with

Figure 3: Result analysis of AIWO-DN approach on axial CTA images
Fig. 4 demonstrates the results analysis of the AIWO-DN technique on the classification of cross sectional CTA images. The figure reported that the AIWO-DN technique has resulted in enhanced classification performance in all classes. For instance, the AIWO-DN technique has recognized the images under Non-calcified class with
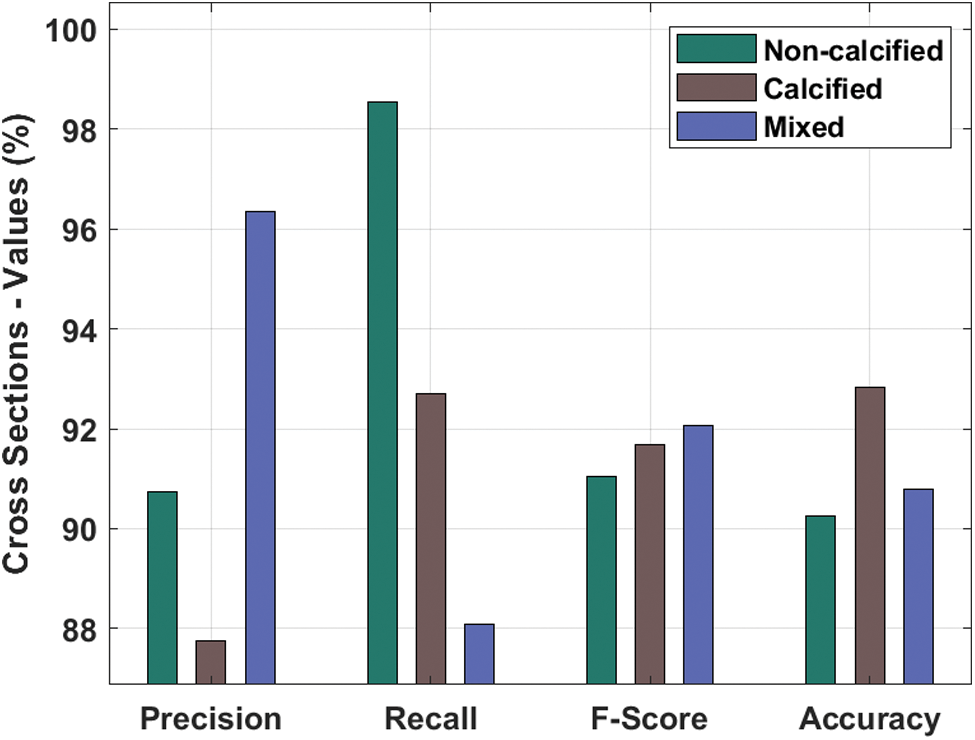
Figure 4: Result analysis of AIWO-DN approach on cross sectional CTA images
The ROC analysis of the AIWO-DN technique on the classification of plaque is shown in Fig. 5. The results exhibited that the AIWO-DN technique has accomplished improved classification performance with a maximum ROC of 97.0969. Tab. 2 and Fig. 6 provides a brief comparative

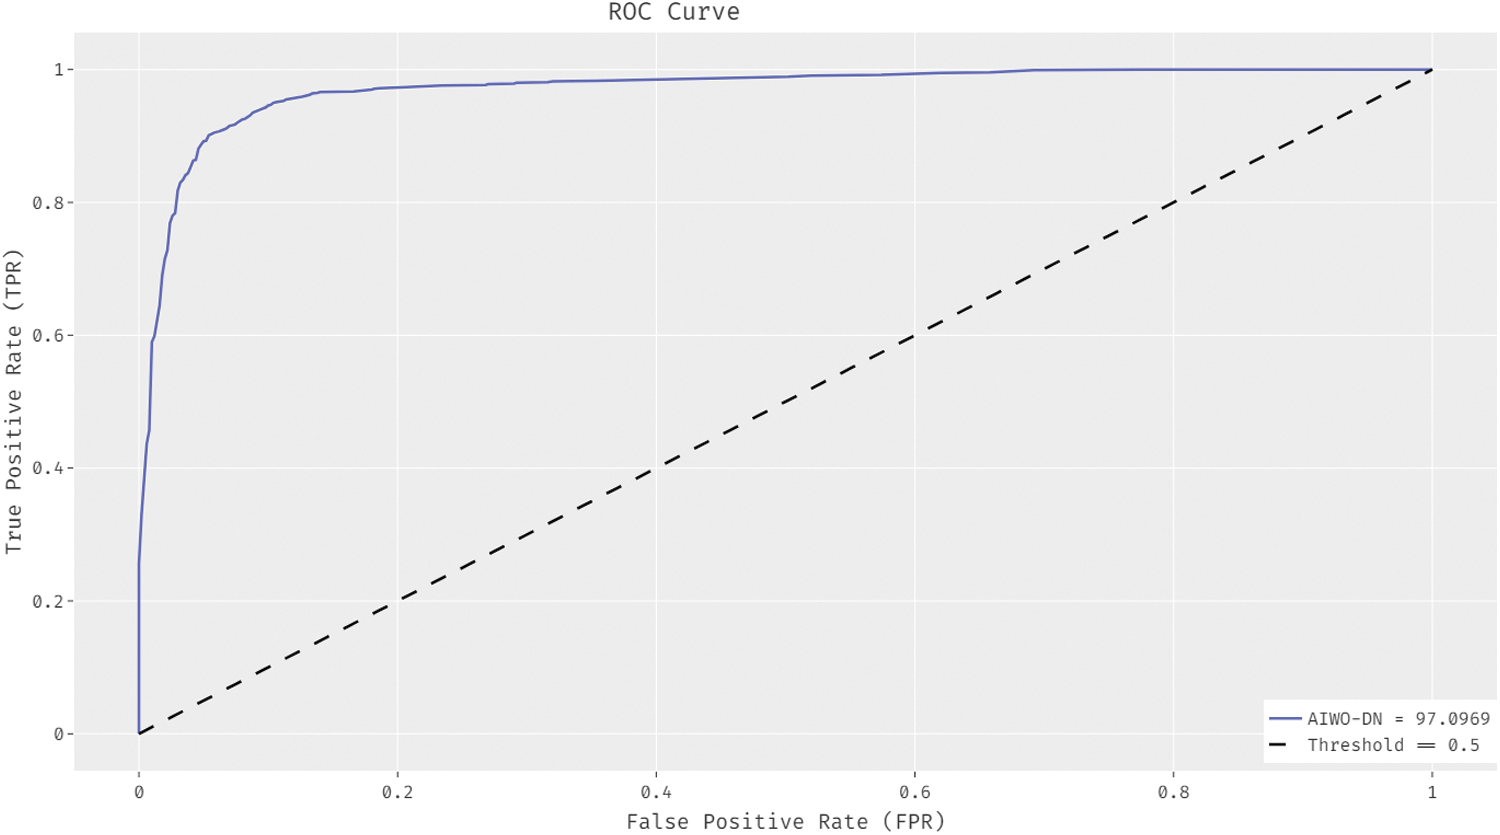
Figure 5: ROC analysis of AIWO-DN approach
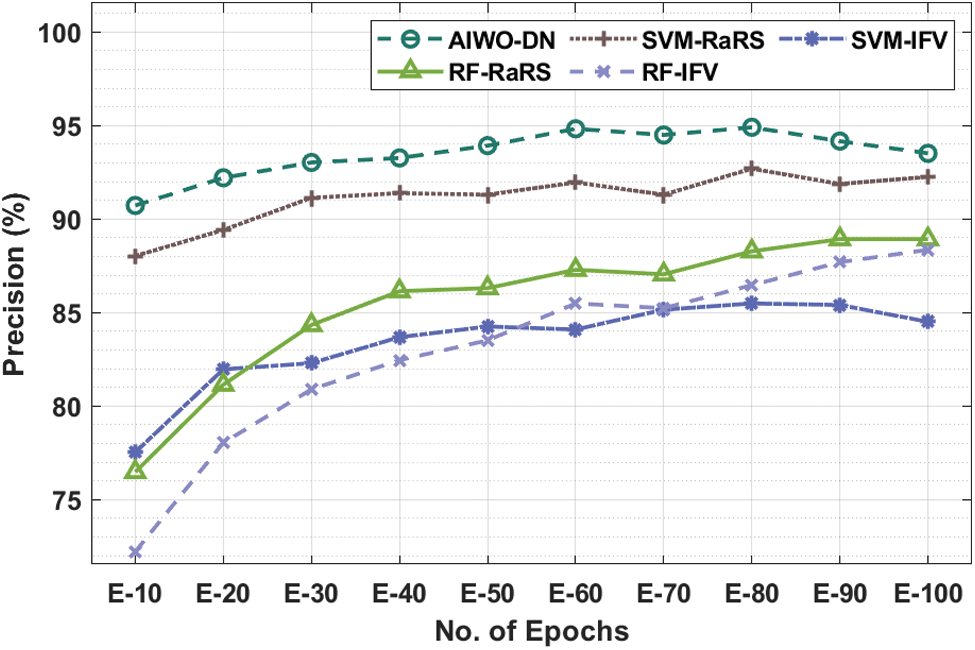
Figure 6: Comparative analysis of AIWO-DN approaches in terms of precision
For instance, with 10 epochs, the AIWO-DN technique has resulted in increased

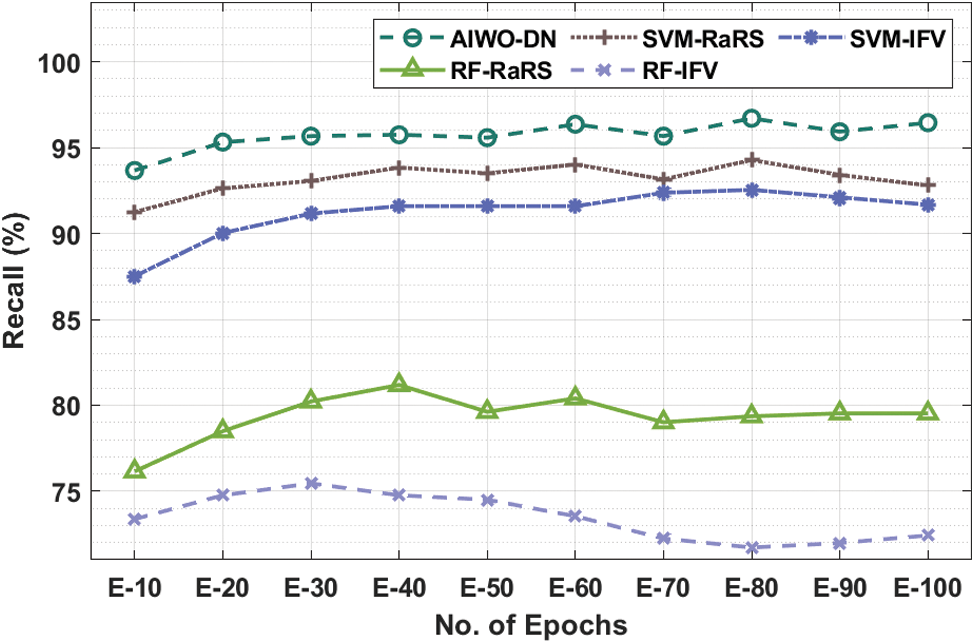
Figure 7: Comparative analysis of AIWO-DN approaches in terms of recall
Tab. 4 and Fig. 8 exhibited a detailed comparative

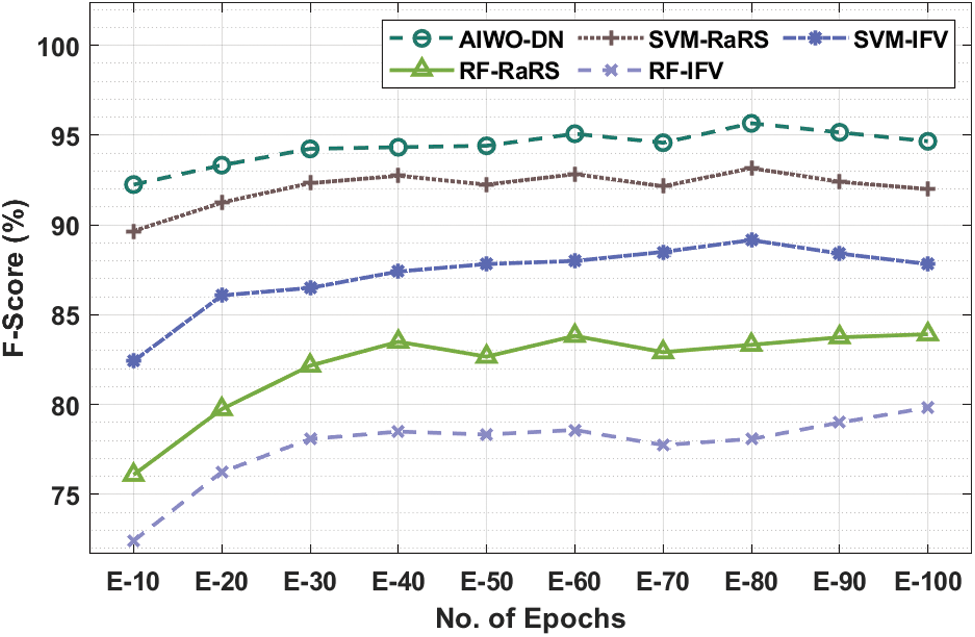
Figure 8: Comparative analysis of AIWO-DN approaches in terms of F-score
Tab. 5 and Fig. 9 illustrates a detailed comparative

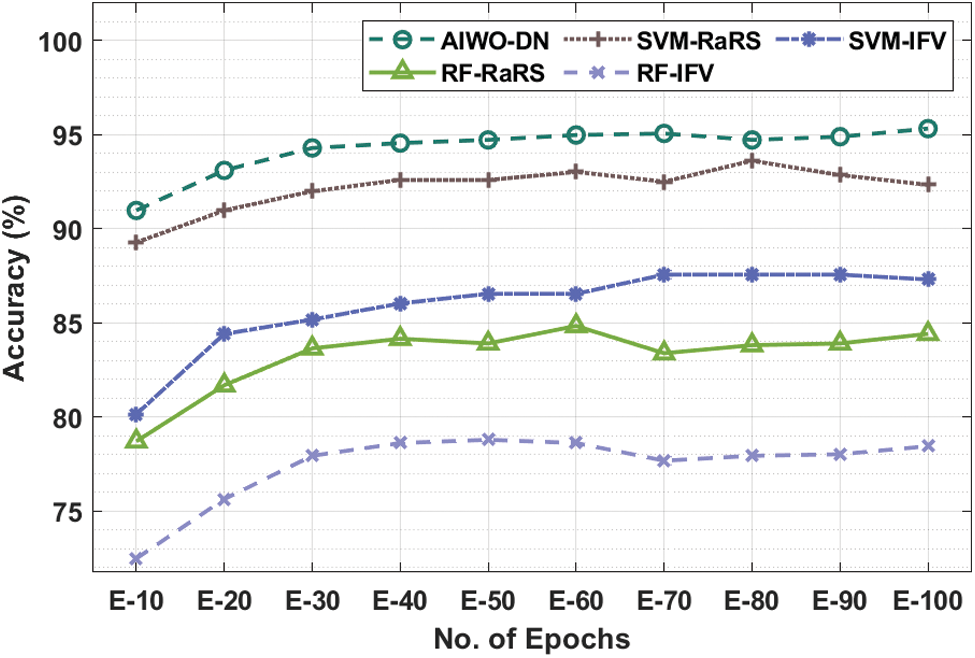
Figure 9: Comparative analysis of AIWO-DN approaches in terms of accuracy
Simultaneously, with 100 epochs, the AIWO-DN technique has provided maximum
In this study, a novel AIWO-DN technique has been developed for coronary atherosclerosis plaque recognition and classification. The AIWO-DN technique encompasses a series of processes namely pre-processing, DenseNet169 based feature extraction, WELM based classification, and IWO based parameter optimization. The design of IWO algorithm assists in appropriately choosing the parameters involved in the WELM model and thereby resulting to enhance plaque performance. For examining the outstanding performance of the AIWO-DN technique, a wide range of experiments were carried out and the outcomes are inspected interms of varying metrics. The experimental results showed the betterment of the AIWO-DN technique over the existing techniques interms of several evaluation metrics. In future, the performance of the AIWO-DN technique can be boosted by the design of multimodal DL based plaque classification approaches. Besides, as a part of future extension, the AIWO-DN model can be realized in the Internet of Things (IoT) and cloud enabled environment to aid diagnostic process in real time environment.
Funding Statement: The authors received no specific funding for this study.
Conflicts of Interest: The authors declare that they have no conflicts of interest to report regarding the present study.
1. M. Zreik, R. W. V. Hamersvelt, J. M. Wolterink, T. Leiner, M. A. Viergever et al., “A recurrent CNN for automatic detection and classification of coronary artery plaque and stenosis in coronary CT angiography,” IEEE Transactions on Medical Imaging, vol. 38, no. 7, pp. 1588–1598, 2018. [Google Scholar]
2. D. Mozaffarian, E. J. Benjamin, A. S. Go, D. K. Arnett, M. J. Blaha et al., “Heart disease and stroke statistics - 2016 update,” Circulation, vol. 133, no. 4, pp. e38–e360, 2016. [Google Scholar]
3. J. M. Wolterink, T. Leiner, B. D. De Vos, J. L. Coatrieux, B. M. Kelm et al., “An evaluation of automatic coronary artery calcium scoring methods with cardiac CT using the or CaScore framework,” Medical Physics, vol. 43, no. 5, pp. 2361–2373, 2016. [Google Scholar]
4. A. Cassar, D. R. Holmes Jr, C. S. Rihal and B. J. Gersh, “Chronic coronary artery disease: Diagnosis and management,” Mayo Clinic Proceedings, vol. 84, no. 12, pp. 1130–1146, 2009. [Google Scholar]
5. J. M. Wolterink, T. Leiner, B. D. D. Vos, R. W. V. Hamersvelt, M. A. Viergever et al., “Automatic coronary artery calcium scoring in cardiac CT angiography using paired convolutional neural networks,” Medical Image Analysis, vol. 34, no. 4, pp. 123–136, 2016. [Google Scholar]
6. A. M. Fischer, M. Eid, C. N. D. Cecco, M. A. Gulsun, M. V. Assen et al., “Accuracy of an artificial intelligence deep learning algorithm implementing a recurrent neural network with long short-term memory for the automated detection of calcified plaques from coronary computed tomography angiography,” Journal of Thoracic Imaging, vol. 35, no. Suppl. 1, pp. S49–S57, 2020. [Google Scholar]
7. R. Detrano, A. D. Guerci, J. J. Carr, D. E. Bild, G. Burke et al., “Coronary calcium as a predictor of coronary events in four racial or ethnic groups,” The New England Journal of Medicine, vol. 358, no. 13, pp. 1336–1345, 2008. [Google Scholar]
8. C. Hong, C. R. Becker, U. J. Schoepf, B. Ohnesorge, R. Bruening et al., “Coronary artery calcium: Absolute quantification in nonenhanced and contrast enhanced multi-detector row CT studies,” Radiology, vol. 223, no. 2, pp. 474–480, 2002. [Google Scholar]
9. T. R. Veeramakali, B. Sivakumar, P. C. S. Mahesh and N. Krishnaraj, “An intelligent internet of things-based secure healthcare framework using blockchain technology with an optimal deep learning model,” The Journal of Supercomputing, vol. First Online, pp. 1–21, 2021. [Google Scholar]
10. S. Mittal, Y. Zheng, B. Georgescu, F. V. Higuera, S. K. Zhou et al., “Fast automatic detection of calcified coronary lesions in 3D cardiac CT images,” in Proc. First Int. Conf. on Machine Learning in Medical Imaging, Berlin, Heidelberg, pp. 1–9, 2010. [Google Scholar]
11. H. Yang, Z. Li and Z. Wang, “Prediction of atherosclerosis diseases using biosensor-assisted deep learning artificial neuron model,” Neural Computing and Applications, vol. 33, no. 10, pp. 5257–5266, 2021. [Google Scholar]
12. P. K. Jain, N. Sharma, A. A. Giannopoulos, L. Saba, A. Nicolaides et al., “Hybrid deep learning segmentation models for atherosclerotic plaque in internal carotid artery B-mode ultrasound,” Computers in Biology and Medicine, vol. 136, no. 6, pp. 104721–104732, 2021. [Google Scholar]
13. Y. C. Li, T. Y. Shen, C. C. Chen, W. T. Chang, P. Y. Lee et al., “Automatic detection of atherosclerotic plaque and calcification from intravascular ultrasound images by using deep convolutional neural networks,” IEEE Transactions on Ultrasonics, Ferroelectrics, and Frequency Control, vol. 68, no. 5, pp. 1762–1772, 2021. [Google Scholar]
14. Y. Niu, M. L. Olender, D. Marlevi, F. R. Nezami and E. R. Edelman, “Improving automated tissue characterization in optical coherence tomography by melding attenuation compensation with deep learning,” in Proc. IEEE EMBS Int. Conf., on Biomedical and Health Informatics (BHI), Athens, Greece, pp. 1–4, 2021. [Google Scholar]
15. A. Abdolmanafi, L. Duong, R. Ibrahim and N. Dahdah, “A deep learning-based model for characterization of atherosclerotic plaque in coronary arteries using optical coherence tomography images,” Medical Physics, vol. 48, no. 7, pp. 3511–3524, 2021. [Google Scholar]
16. M. L. Olender, L. S. Athanasiou, L. K. Michalis, D. I. Fotiadis and E. R. Edelman, “A domain enriched deep learning approach to classify atherosclerosis using intravascular ultrasound imaging,” IEEE Journal of Selected Topics in Signal Processing, vol. 14, no. 6, pp. 1210–1220, 2020. [Google Scholar]
17. C. Arputham, N. Krishnaraj, L. B. Russeliah and A. Russeliah, “Mammographic image classification using deep neural network for computer-aided diagnosis,” Intelligent Automation & Soft Computing, vol. 27, no. 3, pp. 747–759, 2021. [Google Scholar]
18. G. Huang, Z. Liu, L. V. D. Maaten and K. Q. Weinberger, “Densely connected convolutional networks,” in Proc. IEEE Conf. on Computer Vision and Pattern Recognition, Hawaii, United States, pp. 4700–4708, 2017. [Google Scholar]
19. S. Zheng, J. Gai, H. Yu, H. Zou and S. Gao, “Software defect prediction based on fuzzy weighted extreme learning machine with relative density information,” Scientific Programming, vol. 2020, no. 6, pp. 1–18, 2020. [Google Scholar]
20. W. Zong, G. B. Huang and Y. Q. Chen, “Weighted extreme learning machine for imbalance learning,” Neurocomputing, vol. 101, no. 1–3, pp. 229–242, 2013. [Google Scholar]
21. Y. Zhou, Q. Luo, H. Chen, A. He and J. Wu, “A discrete invasive weed optimization algorithm for solving traveling salesman problem,” Neurocomputing, vol. 151, pp. 1227–1236, 2015. [Google Scholar]
22. H. A. Kirisli, M. Schaap, C. T. Metz, A. S. Dharampal, W. B. Meijboom et al., “Standardized evaluation framework for evaluating coronary artery stenosis detection, stenosis quantification and lumen segmentation algorithms in computed tomography angiography,” Medical Image Analysis, vol. 17, no. 8, pp. 859–876, 2013. [Google Scholar]
23. F. Zhao, B. Wu, F. Chen, X. Cao, H. Yi et al., “An automatic multi-class coronary atherosclerosis plaque detection and classification framework,” Medical & Biological Engineering & Computing, vol. 57, no. 1, pp. 245–257, 2019. [Google Scholar]
 | This work is licensed under a Creative Commons Attribution 4.0 International License, which permits unrestricted use, distribution, and reproduction in any medium, provided the original work is properly cited. |