DOI:10.32604/iasc.2022.025153
| Intelligent Automation & Soft Computing DOI:10.32604/iasc.2022.025153 | |
| Article |
Wireless Intrusion Detection Based on Optimized LSTM with Stacked Auto Encoder Network
1Hindusthan College of Engineering and Technology, Coimbatore, 641032, India
2KPR Institute of Engineering and Technology, Coimbatore, 641048, India
*Corresponding Author: S. Karthic. Email: karthi131@gmail.com
Received: 13 November 2021; Accepted: 13 January 2022
Abstract: In recent years, due to the rapid progress of various technologies, wireless computer networks have developed. However, the activities of the security threats and attackers affect the data communication of these technologies. So, to protect the network against these security threats, an efficient IDS (Intrusion Detection System) is presented in this paper. Namely, optimized long short-term memory (OLSTM) network with a stacked auto-encoder (SAE) network is proposed as an IDS system. Using SAE, significant features are extracted from the databases such as input NSL-KDD database and the UNSW-NB15 database. Then extracted features are given as input to the optimized LSTM which is used as an intrusion identification system. To enhance the effectiveness of the LSTM, we present the pigeon optimization algorithm (POA). Using this algorithm, weight parameters of the LSTM are chosen optimally. Finally, the proposed IDS model decides whether the input packets are intruded or not. The results confirm that the proposed IDS model surpasses the previous machine learning-based IDS models in terms of correctness, F1-score and G mean.
Keywords: Optimized LSTM; stacked autoencoder; pigeon optimization algorithm; and intrusion detection system
As computer networks have gotten broadly utilized in all parts of our lives, the security of networks has gotten progressively significant. Network security incorporates primarily the integrity, confidentiality, and availability of its conveyor’s data. Any action endeavoring to weak these parameters or to sidestep the security schemes of a network can be viewed as a network intrusion. An IDS is a sort of security management framework that is used to identify intrusion in the network and is a basic section of network security frameworks these days [1–3]. An IDS ordinarily checks all incoming as well as outgoing data of a specific network to decide if every packet has indications of an intrusion. All-around developed IDS can recognize the qualities of most activities of intrusion and consequently react to them by keeping in touch with security logs or giving alerts [4].
Numerous researches using AI have designed IDS with machine learning models. For example, GAs (Genetic Algorithms) [5], ANNs (Artificial Neural Networks) [6], and (support vector machine) SVM [7] have accomplished great outcomes in the area of intrusion detection. Nevertheless, the lightweight AI technique experiences numerous constraints, while intrusion is getting more complicated and differentiated. Along these lines, to address this issue, the accompanying contributions are presented in this paper.
• To shorten the complexity of IDS, the input features from the dataset are to be extracted initially. So, for efficient feature extraction, a Stacked Auto Encoder Network is presented.
• Then the extracted features are given as input to the optimized LSTM based RNN model. In this detection model, the performance of LSTM is enhanced by optimizing the weight parameters using the pigeon optimization algorithm (POA).
• This proposed approach is implemented in the platform of Python. For performance analysis, the NSL-KDD and UNSW-NB15 datasets are used.
The article is sorted as follows. Section 2 relates the recent literature that focused research on identifying the intrusions in the wireless networks. Section 3 proposes feature extraction using Stacked Auto Encoder Network and also presents wireless intrusion detection system using pigeon optimization algorithm based LSTM. Section 4 discusses the results of the proposed approach. Lastly, the conclusion of the work is described in Section 5.
In this section, some recent literature that focused research on detecting the intrusions in the wireless network is reviewed. Yang et al. [8] had proposed a Supervised Adversarial Variational Auto-Encoder with Regularization based deep neural network abbreviated as SAVAER-DNN for intrusion detection. Using this proposed model, the authors had enhanced the rate of detection of fewer count attacks. The decoder of the SAVAER was utilized to process the samples of unknown and fewer count attacks. By presenting this proposed approach the authors had achieved a better F1 score and detection rate. IDS system plays an important role to enhance security in a different communication system. So, Kasongo et al. [9] had presented Wrapper depend on Feature Extraction Unit based Feed-Forward Deep Neural Network IDS system abbreviated as WFEU-FFDNN. To produce a reduced vector of optimal feature, WFEU based extraction scheme utilized the Extra Trees algorithm. The authors had compared their proposed approach with the k-Nearest Neighbor, Random Forest, Naive Bayes, SVM and Decision Tree. Simulation results of the article showed that the specified WFEU-FFDNN had achieved better accuracy than the existing algorithms.
Wu et al. [10] had introduced a semantic re-encoding and deep learning method abbreviated as SRDLM for intrusion detection. In this approach, the authors had considered normal and intrusion network traffic. Applying the proposed method, flows of network traffic were re-encoded, distinguishability of traffic was increased as well as generalization ability of the method was improved using the deep learning algorithm. The simulation results of the article showed that the infiltration detection rate of the proposed method is higher than that of conventional machine learning programs.
To improve the performance of the IDS system, Xu et al. [11] had used deep learning theory for the detection of intrusion and automatic extraction of the feature was extracted using a deep network system. The authors had considered the time-related intrusion features. The proposed IDS system consists of a continuous neural network consisting of cadet recurrent units, a softmax module, and a multi-layer perceptron. The proposed IDS system achieved a 99.42% detection rate utilizing the KDD 99 dataset as well as a 99.31% detection rate utilizing the NSL-KDD dataset. Because of the proposed model, the authors had achieved a better false-positive rate.
Vijayanand et al. [12] had presented SVM based IDS system on wireless mesh networks. As the unnecessary and redundant variables in the observed data lack detection accuracy, optimal election of features has an important role in the IDS system. Thus, for feature selection, a genetic algorithm was presented as well as multiple support vector machines were proposed for intrusion classification. Simulation results of the article showed that the proposed scheme had attained high detection accuracy. Qu et al. [13] had presented a knowledge-based intrusion detection strategy abbreviated as KBIDS. They had preferred Mean Shift Clustering Algorithm abbreviated as MSCA for distinguishing the normal and abnormal behavior of nodes in WSN. Also, the margin among the normal and abnormal features was maximized using a support vector machine as a classifier. The authors had also presented the strategy of feature updating for reflecting the dynamics of the network. By presenting this proposed approach, the authors had attained a maximum detection rate.
Although many machine learning schemes were presented for network intrusion detection, they were not sufficient to provide good performance for multiple classes. So, Zhou et al. [14] had presented a new modified adaptive boosting based ensemble framework with region under curve algorithm abbreviated as M-AdaBoost-A for identifying the network intrusions. For further improvement of the classification accuracy, feature selection plays an important role. Prakash et al. had presented Hybrid local fisher discriminant analysis (HLFDA) for reducing dimension of the input dataset and it ensures better classification accuracy when the HLFDA feature selection is used along with Type2fuzzy neural network classifier [15]. The authors had jointed multiple classifiers based on M-AdaBoost-A to an ensemble by performing different objectives, containing particle swarm optimization. Besides, the authors had balanced the multiple classes in network intrusion detection M-AdaBoost-A algorithm. Because of this proposed scheme, the authors had achieved better classification accuracy.
Liu et al. [16] had proposed a select group of kernel intensive learning machines abbreviated as KELMs, abbreviated as Adaptive Network Navigation Detection ANID based on random features. The proposed scheme was termed as ANID-SEoKELM. Using this proposed scheme, different unauthorized uses were detected. In the proposed scheme, multiple KELMs were learned using the strategy of bagging with sparse random feature representation that was behind the reason for generating a lightweight intrusion detector. Besides, the authors had introduced the ultimate intrusion detector by presenting selective ensemble based marginal distance minimization abbreviated as MDMbSE. Simulation results of the article showed that, the proposed scheme achieved higher detection accuracy.
Aroba et al. [17] had introduced a Gaussian elimination technique combined with distributed energy efficient clustering (referred to as DEEC-Gauss) to guarantee energy efficient regulation in remote climates. Moreover, Rodríguez et al. [18] have introduced the Energy-efficient Cluster Steering Conference for WSN, which was based on the Yellow Saddle Goat Fish Algorithm (YSGA). The conference was planned to increase the life of the company by reducing energy use.
3 Wireless IDS Based on Optimized LSTM with Stacked Auto Encoder Network
Fig. 1 presents the overall structure of the proposed IDS system. As depicted in Fig. 1, initially, from the NSL dataset and UNSW-NB15 dataset which include the features of all incoming and outgoing packets of wireless network, a set of features is selected using Stacked Auto Encoder Network to reduce the complexity of the proposed IDS system. Then, the selected features are given as input to the proposed IDS system. In this approach, an optimized LSTM based RNN model is used as the IDS system. Besides, the performance of the LSTM is enhanced by presenting the pigeon optimization algorithm (POA). Using this algorithm, weight parameters of the LSTM network are chosen optimally. The processes of feature selection and detection are followed in the training phase as well as in the testing phase. In the testing phase, the proposed model finds whether the input packets are intruded or not.
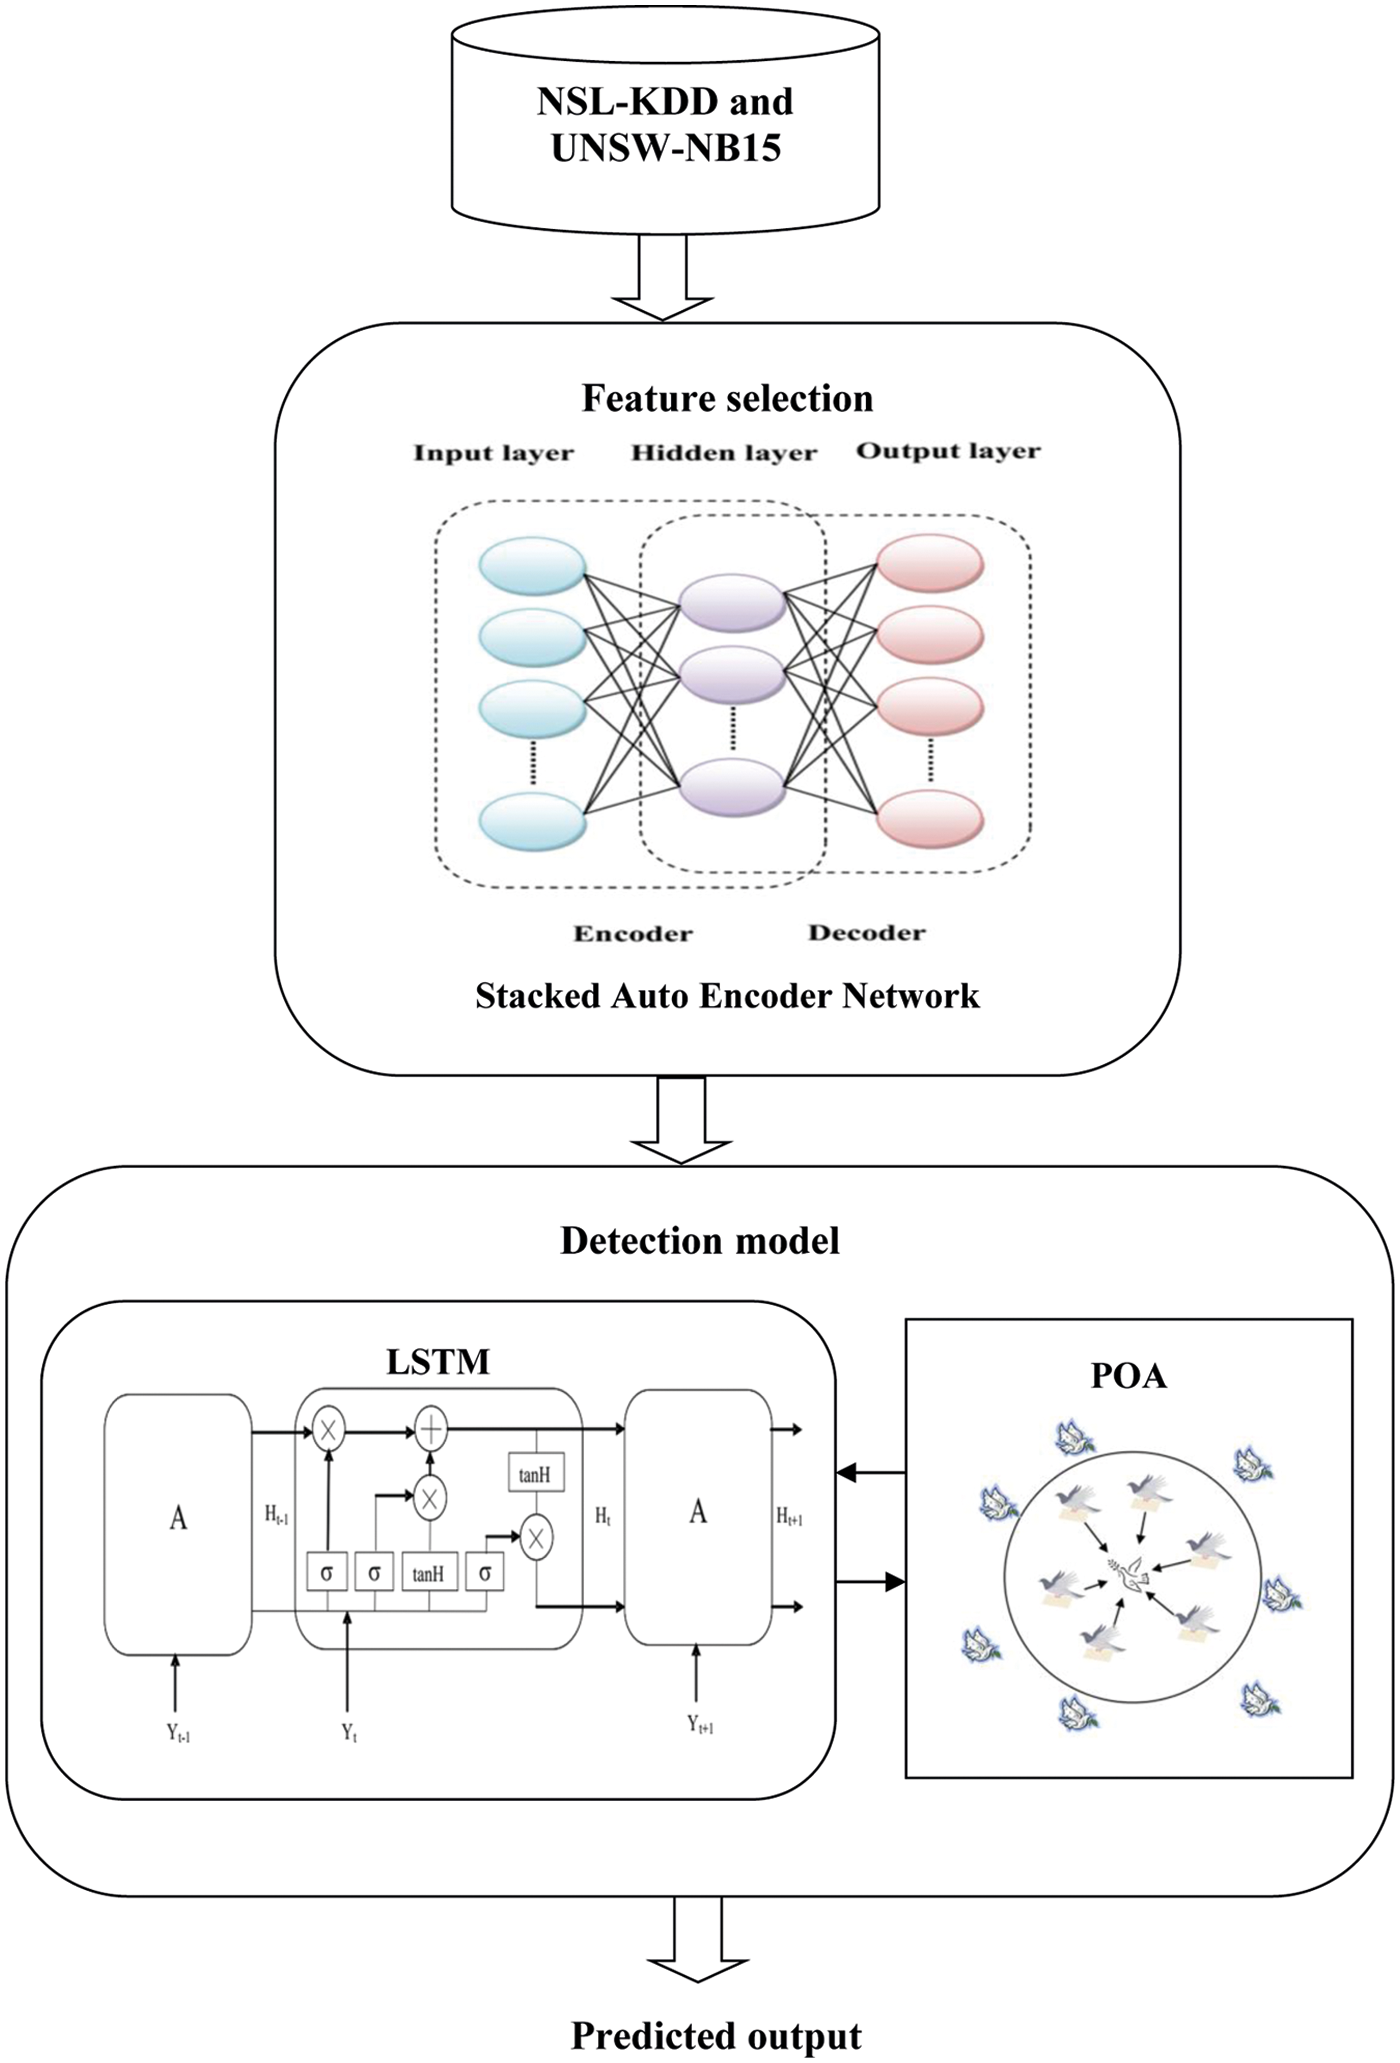
Figure 1: Overview of the proposed IDS system
3.2 Feature Selection using Stacked Auto Encoder Network
AE is a sort of unsupervised learning structure which possesses three layers: input, hidden, and output layer appeared in Fig. 2. The training process of AE comprises of two sections that are encoder and decoder. In the section of the encoder, the input data is mapped to the representation of hidden. In the decoder, the input data is reconstructed from the representation of hidden. Parameters used in auto-encoder is given in Tab. 1.
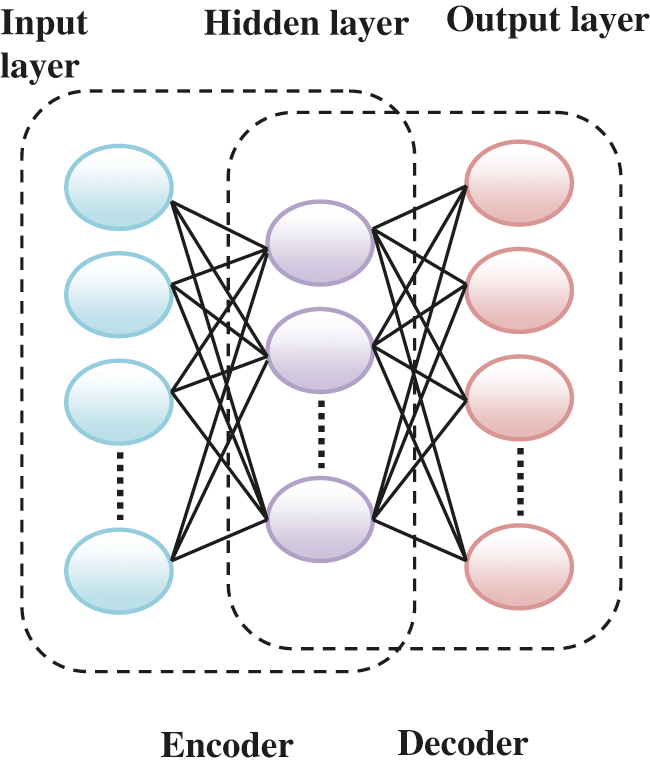
Figure 2: The structure of AE
From the input dataset
where, E denotes the encoding function, W1 denotes the weight matrix, and b1 denotes the bias vector.
The process of the decoder is defined as follows:
where, D denotes the decoding function, W2denotes the weight matrix, and b2denotes the bias vector.
The set of parameters of AE is enhanced to minimize the reconstruction error:
where, L denotes a loss function and it is defined as follows:
3.2.2 Stacked Auto Encoder (SAE) Network
In this approach, the SAE network is used for feature extraction. Using this network, correlated features are extracted from the input dataset. Fig. 3 shows the structure of the SAE network. SAE is stacking n AEs into n hidden layers and this network is fine-tuned using an unsupervised learning algorithm. The SAEs based method can be divided into three steps:
(1) As shown in the Fig. 3, SAE with two hidden layers is used in this approach. So, each layer is trained in the way of unsupervised learning. Thus, based on the input data the first autoencoder is trained to attain the learned feature vector;
(2) The output in first hidden layer is given as input to the second layer and this process is continued until completing the training process.
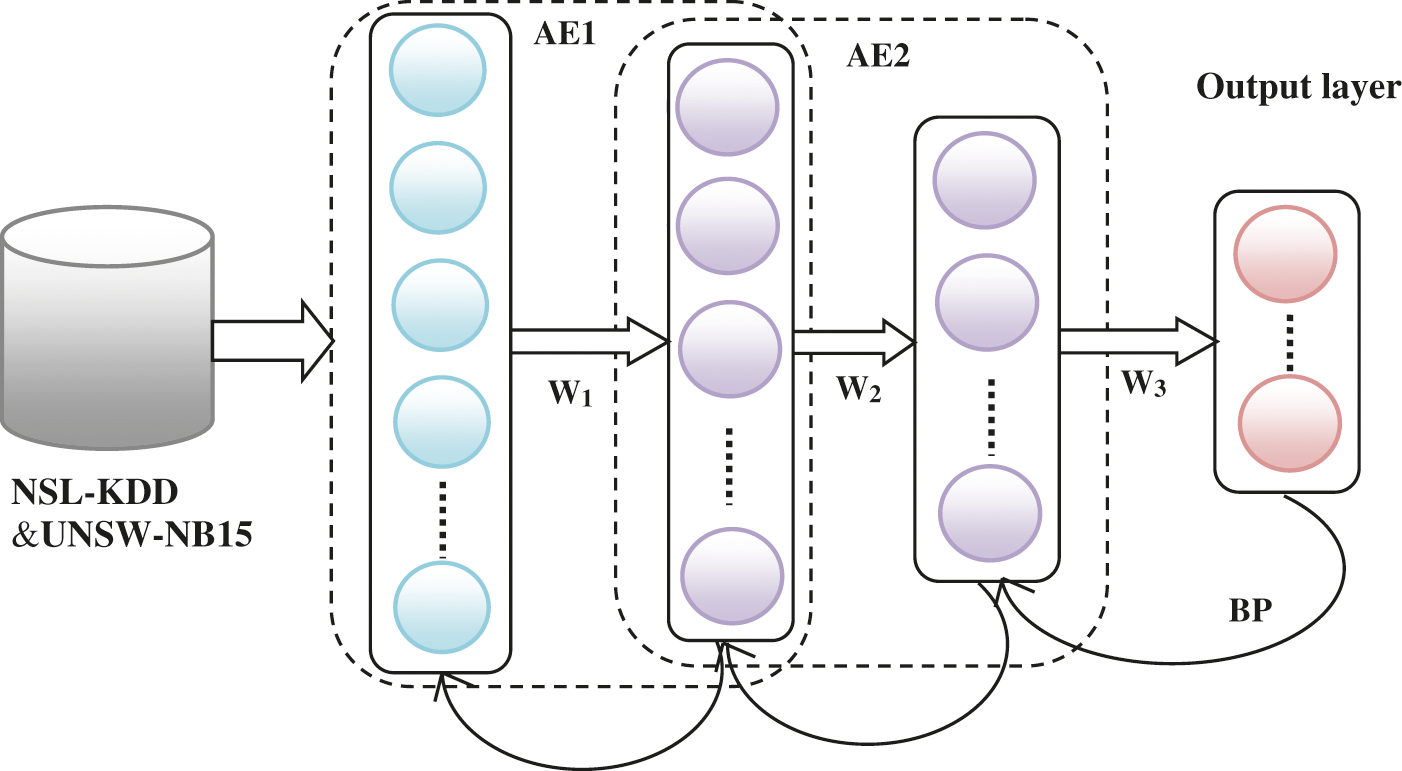
Figure 3: The structure of SAE
The output of the hidden layer 1 or encoder of AE1 is defined as follows:
The output of the hidden layer 2 or encoder of AE2 is defined as follows:
The output layer or decoder process is defined as follows:
(3) After the completion of the training process in hidden layers, the backpropagation algorithm (BP) is used backpropagation algorithm (BP) is used for minimizing the cost function () and weights are updated to attain the fine-tuning.
3.3 Intrusion Detection using POA Based LSTM
The output vectors or features are given as input to the proposed IDS model which detects whether the input packets are intruded or not. The extracted feature set is represented as follows,
where, As denotes the Sth feature.
The proposed optimized LSTM is a type of artificial neural network. To overcome the problem of not considering a series of factors in traditional artificial neural framework, RNN has been introduced. RNN was built to understand this obstacle. The arrangement of RNN is given in Fig. 4. In this concept, the hidden state Ht is taken the input At from input state and produce the output Lt−1. This approach is mainly used for present model loss function and evaluate the next layer output Lt+1. Basically, RNN have feedback loops in a continuous layer. This permits data to be put away in ‘memory’ over the long haul.
where, cL represent the hidden state parameter, wL represent the weight parameter. AT defines the input. tanL is used to add or remove data to the earlier input. Lt is calculated using the Eq. (9).
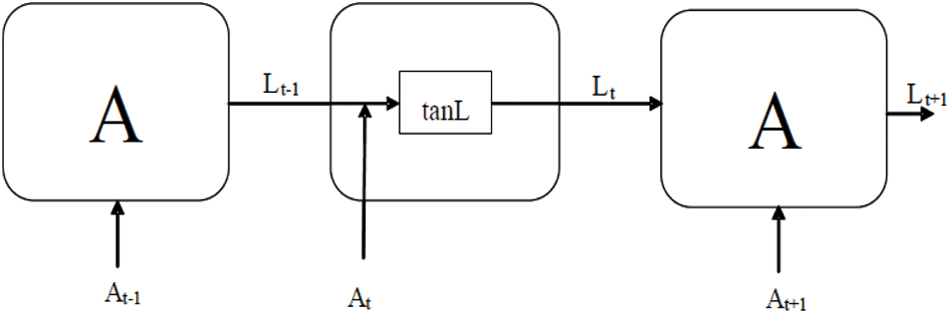
Figure 4: Architecture of RNN
Fig. 5 showcase that LSTM comprise of four NN layers that associate inside an excellent way. Through marvelously planned construction called as a “gate”, the memory cell state data can be added or deleted based on LSTM. This is the area where entryway truly picks functional data, viz. attributes of information. It has the sigmoid activation function. The sigmoid output range is [0,1].
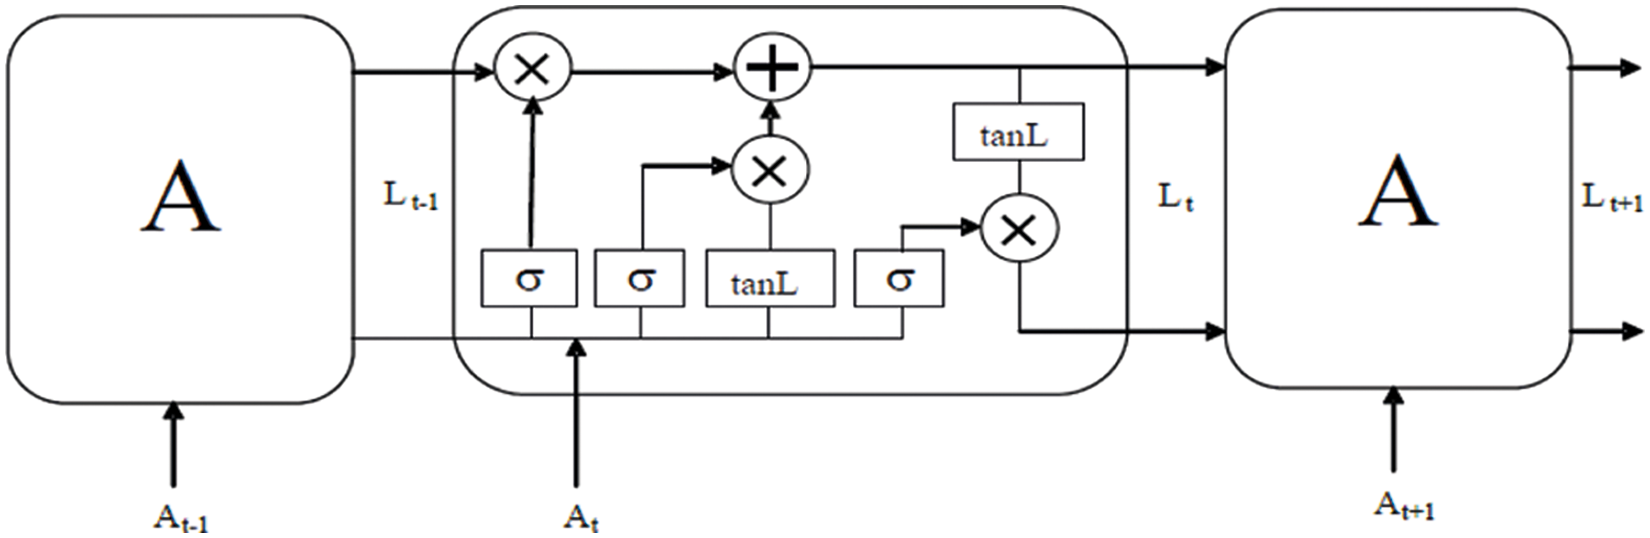
Figure 5: Architecture of LSTM
The Forget gate used to select the discard and selected information and stored in memory. The mathematical function is given in Eq. (10)
where, Ft defines forget gate, cF represent the forget gate control parameter, WeiF represent the forget gate weight, At defines input of the system, Lt−1 represent the output of existing LSTM block, represent the logistic sigmoid function. In the case, the output achieved is the ‘0’ means gates are blocked. If the outcome is ‘1’ gates allow all to pass through. The input gate function is given in Eq. (11).
where It is the input gate, At represents LSTM block present output, WeiI indicates input gate neurons weight and CI is the bias value of input gate
The candidate value of tanL layer is calculated using Eq. (12) as follows;
where, Vt represents the timestamp (t) for the cell state. tanL layer informs the network about weather information to be added or removed. The control parameter is Cv and Wv denotes weight parameter.
The candidate value is selected by input gate, and the forget gate chooses whether to hold or remove data on memory depends on the output from the Eq. (13).
where, memory cell state represented as Mt and * defined as the element wise multiplication. At last, the output gate regulates using Eq. (14) that which part of the memory will be provided for the longest:
where, the output gate is denoted a Ot, Wo denotes the weight value of output neuron, and bias value is denoted as Co. The output function is calculated using Eq. (15).
where, the * denotes the vector’s element wise multiplication and memory cell sate is represented as Vt. Ht indicates the output of the current block. The total loss function of LSTM system is given in Eq. (16).
where, Tt denotes the desired output and N represents total number of data point to calculate the loss mean square error.
3.3.1 Stacked Auto Encoder (SAE) Network
To improve the LSTM’s performance, weight parameters {WeiF, WeiI, WeiV, WeiO}, are chosen optimally using POA algorithm. Pigeons are the most familiar feathered creature on the planet, and they were once used to send the message by Egyptians, which likewise happened in numerous military issues. Homing pigeons can without much of a stretch discover their residence by utilizing three attributes: sun, magnetic field, and the landmarks [17]. In this pigeon optimization algorithm (POA), the map and compass operator model was introduced with respect to the sun and the magnetic field, while the milestone operator model was introduced. Propelled by the above directing practices of pigeons, a novel bio-enlivened multitude knowledge streamlining agent has been proposed in this paper.
Initialization: Initially, the parameters of the POA algorithm such as Dth dimension of solution space, size of the solution population SP, the factor of map and compass L, and the number of iterations
where, SD denotes the solution in the Dth dimensional space and can be defined as follows.
Fitness calculation: For each initialized solution, fitness is calculated for finding the optimal solution. The minimum value of the error function of the DNN is considered as the fitness function and this function is defined as follows
where, Error denotes the error function of the LSTM and is defined in Eq. (16).
Update the solution: To update the position of the directing qualities of pigeons, two operators are planned by utilizing a few guidelines:
Map and compass operator: Pigeons usually detect the field of Earth field using magnetic collection to create a plan in their minds. The height of the sun is considered as a compass to change path. When they glide towards the target, they are not dependent on magnetic fields and the sun. Virtual pigeons are commonly used in the POA model. In this model, the standards (Yi) and the pigeon’s ith momentum (Vi) are classified, and the locations and velocities at the D measurement site are revised with every cycle. The new location Yi and momentum Vi of ith pigeon at round t can be determined with the accompanying conditions:
where, L denotes the factor of the map and compass, rand represents the arbitral number, and Yg represents the current global best spot. When the number of iteration (Niter) is greater than maximum number of iteration (Niter1 max), terminate the map and compass operator and initiate the next operator i.e., the Landmark operator.
As denoted in Fig. 6, the optimum position of all the pigeons is confirmed by diagram and compass. Unlike all flight positions, the position of the pigeon focusing on the right is ideal. As indicated by Eq. (15) expressed by the thick arrows, each pigeon can follow this pigeon and change its flying head. The thin arrows are its previous flying heading, which has a connection to
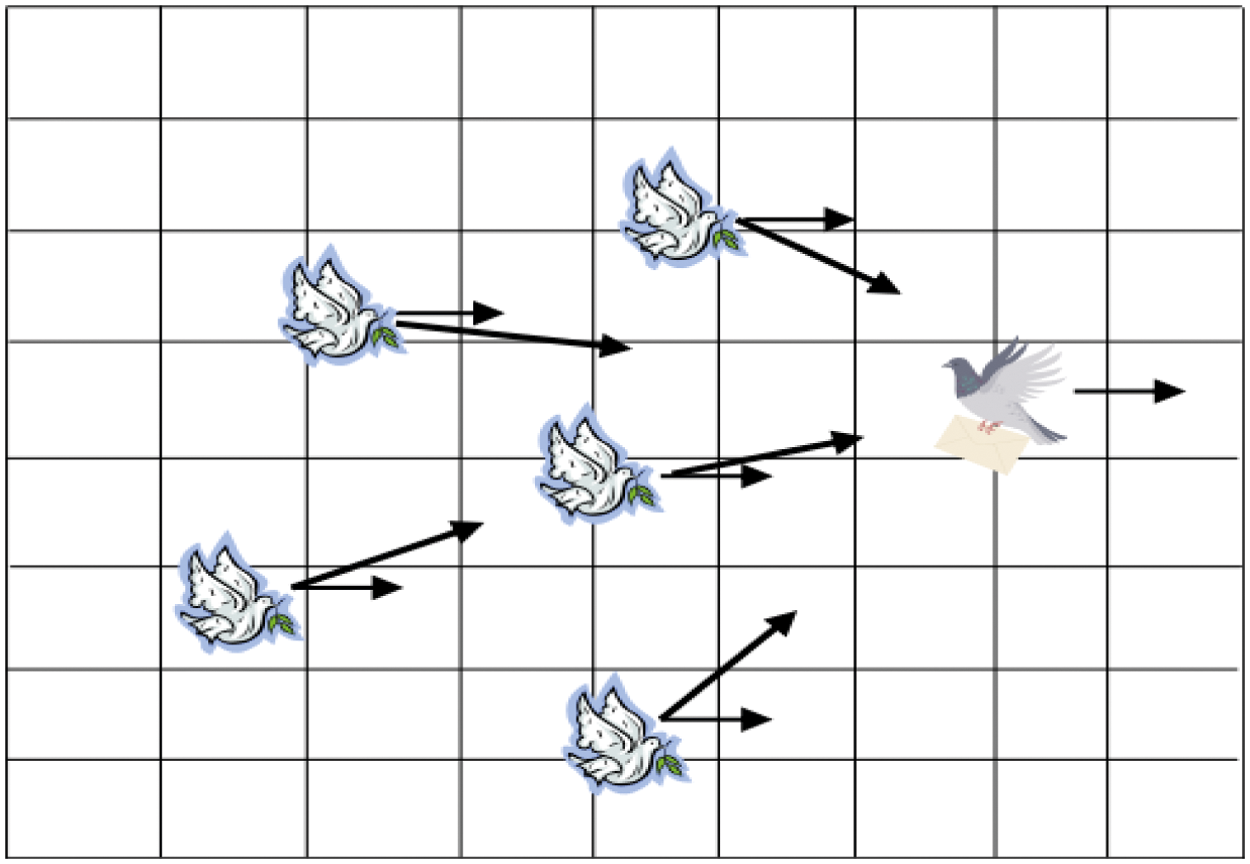
Figure 6: Map and compass operator of POA [19]
Landmark operator: As the pigeons move towards their target, they will depend on nearby signals. If they know the signals, they will glide directly towards the target. Because it is so far from the finish line and new to the signals, it will follow the pigeons that know the signals. At the reference point operator, SP halves the number of pigeons per age. After all, pigeons are still far from the target and are new to the signs. YF (t)th Let some dove be the focal point as you repeat, and keep in mind that each dove can fly directly towards the target.
The position updating rule for pigeon I at the t-th cycle can be determined by:
where, Fit() denotes the strength of the pigeon individual and it can be defined as
As appeared in Fig. 7, the focal point, all things considered (the pigeon in the focal point of the circle) is their objective in every cycle. Half of the apparent multitude of pigeons (the pigeons out of the circle) that are a long way from their objective will follow the pigeons that are near their objective, which additionally implies that two pigeons might be at a similar position. The pigeons that are near their objective (the pigeons in the circle) will travel to their objective rapidly.
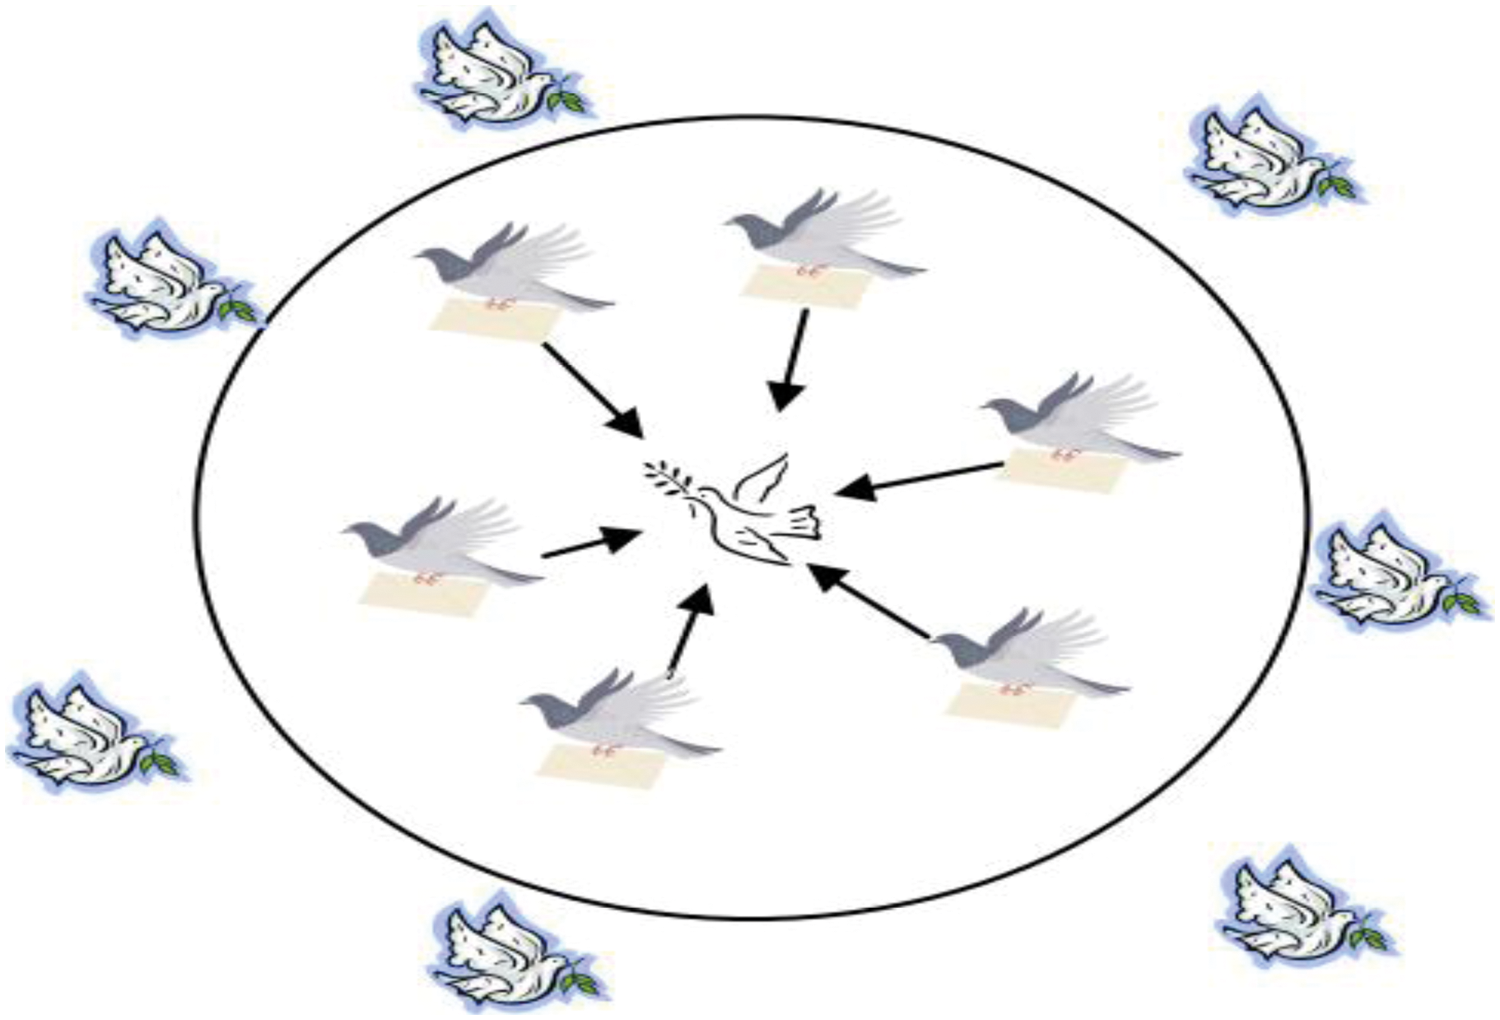
Figure 7: Landmark operator of POA [19]
Termination: The solution will be updated using the two operators until finding the optimal solution or optimal weight parameters. The algorithm will be terminated if the desired result is obtained.
Testing phase: After the completion of the training process, we attain the trained structure of OLSTM. In this trained model, 20% of data from the documents are taken as input for testing it. The processes that have been done for the training process are also followed for the testing phase. Namely, feature extraction based on SAE is done for the testing data. By processing the testing data, the proposed OLSTM outputs the predicted value which is compared with the threshold value (0.5). If the predicted value is exceeded than the threshold value, then the input packet is considered as an intruded packet otherwise it is considered a normal packet.
The proposed Wireless Intrusion Detection System Based on Optimized LSTM with Stacked Auto Encoder Network (OLSTM + SAE) was implemented in the platform of Python and the system having Intel Core i7 @ 3.4 GHz, 64 GB RAM. The performance of the proposed IDS system is analyzed or evaluated by using the data from the datasets NSL-KDD and UNSW-NB15.
For experimental analysis, NSL-KDD and UNSW-NB15 dataset is used. NSL-KDD dataset is updated version of KDD’99 dataset. This dataset eliminates the redundant and duplicate records present in the KDD dataset. Generally, the dataset is divided into two set training and testing. The attack types in the dataset records are Probe, DoS (Denial of Service), U2R (User to Root), and R2L (Remote to Local). In this proposed approach, KDDTrain + 20Percent.txt is used as the training set and KDDTest+, and KDDTest-21 is used as the test sets.
UNSW-NB15 dataset includes 42 features such as service, state, rate, proto, etc. Among the features, three are nominal and the remaining features are numeric. Besides, this dataset has two subsets of the training set that are UNSW-NB15-25 and UNSW-NB15-75. Here, UNSW-NB15-25 denotes 25% of the full training set and UNSW-NB15-75 denotes 75% of the full training set.
4.2 Performance Analysis using NSL KDD Dataset
Here the potential of the proposed intrusion detection model is analyzed against NSL-KDD dataset. Based on the testing data KDDTest+ and KDDTest-21, the performance of the different feature extraction techniques and intrusion detection models are analyzed. The following sections describe the comparative analysis of the proposed models with the existing models.
In this section, the potential of the Intrusion detection models LSTM + POA, LSTM + PSO (Particle swarm optimization), LSTM, SVM (Support Vector Machine), and KNN (K-Nearest Neighbor) are analyzed in terms of various attacks and metrics. Besides, these checks are carried by using KDDTest+ and KDDTest-21. The detection rate of the different detection models by using KDD test+ is shown in Fig. 8. The LSTM + POA technique achieves a better detection rate than the other detection models. Although LSTM + PSO achieves a better detection ratio than LSTM, SVM, and KNN, LSTM + POA attains the highest detection ratio due to the adaptability and better convergence speed of POA. The overall performance of the different detection models is analyzed in terms of accuracy, recall, precision, F1-score, G-mean, and FPR in Fig. 9. LSTM + POA achieves improved performance compared to other detection models. Namely, the LSTM + POA attains 90.4% of detection accuracy while LSTM + PSO, LSTM, SVM and KNN obtain 81.2%, 78.7%, 73.3% and 78.9% of accuracy respectively.
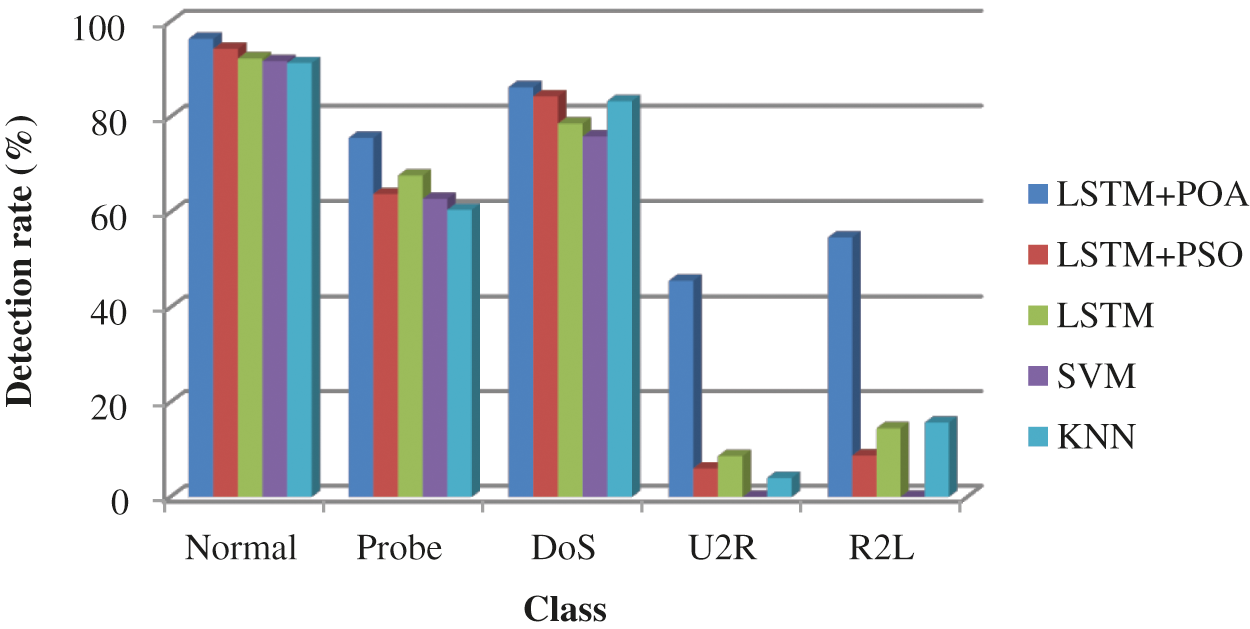
Figure 8: Detection rate of the different detection models by using KDD test+
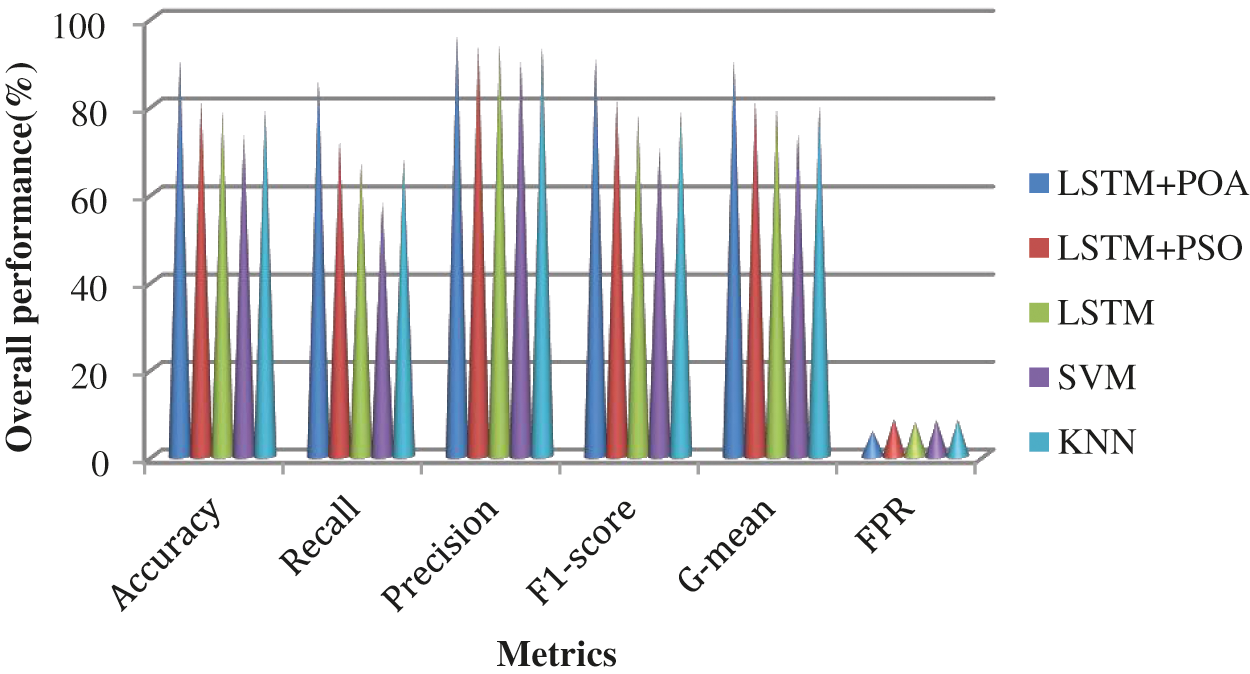
Figure 9: Performance of the different detection models by using KDD test+
Fig. 10 shows the detection rate of the different intrusion detection models by using the KDD test-21. As the detection performance of LSTM is enhanced using POA which includes better convergence speed and adaptability than PSO, the detection rate is increased than other detection models. The detection models attain a high detection rate except for LSTM + PSO and KNN when detecting the normal attacks. Namely, LSTM + POA, LSTM, and SVM achieve 82.8%, 70.7%, and 69.3% of detection rate respectively when detecting the normal attacks but LSTM + PSO and KNN attain maximum detection rate when detecting the DoS attacks i.e., they obtain 72.7% and 70.9% of detection rate respectively. Fig. 11 shows the overall performance of the various detection schemes by using the KDD test-21. LSTM + POA achieves better performance than the other detection models. Namely, the LSTM + POA attains 81.4% of detection accuracy.
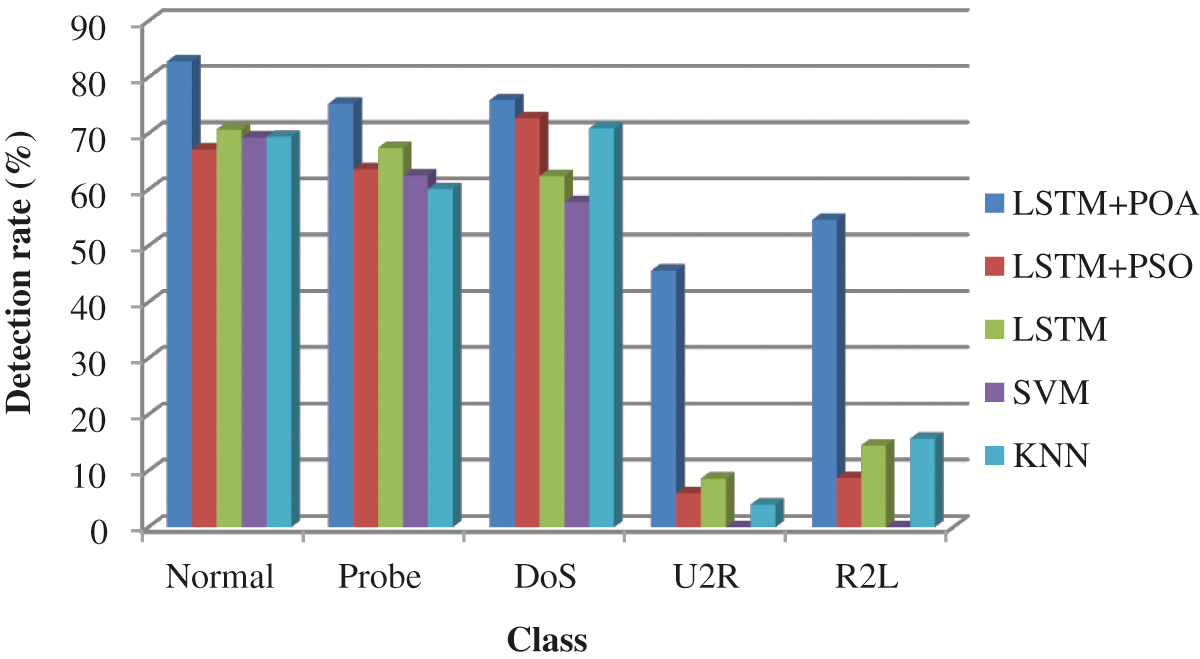
Figure 10: Detection rate of the different intrusion detection models by using KDD test-21
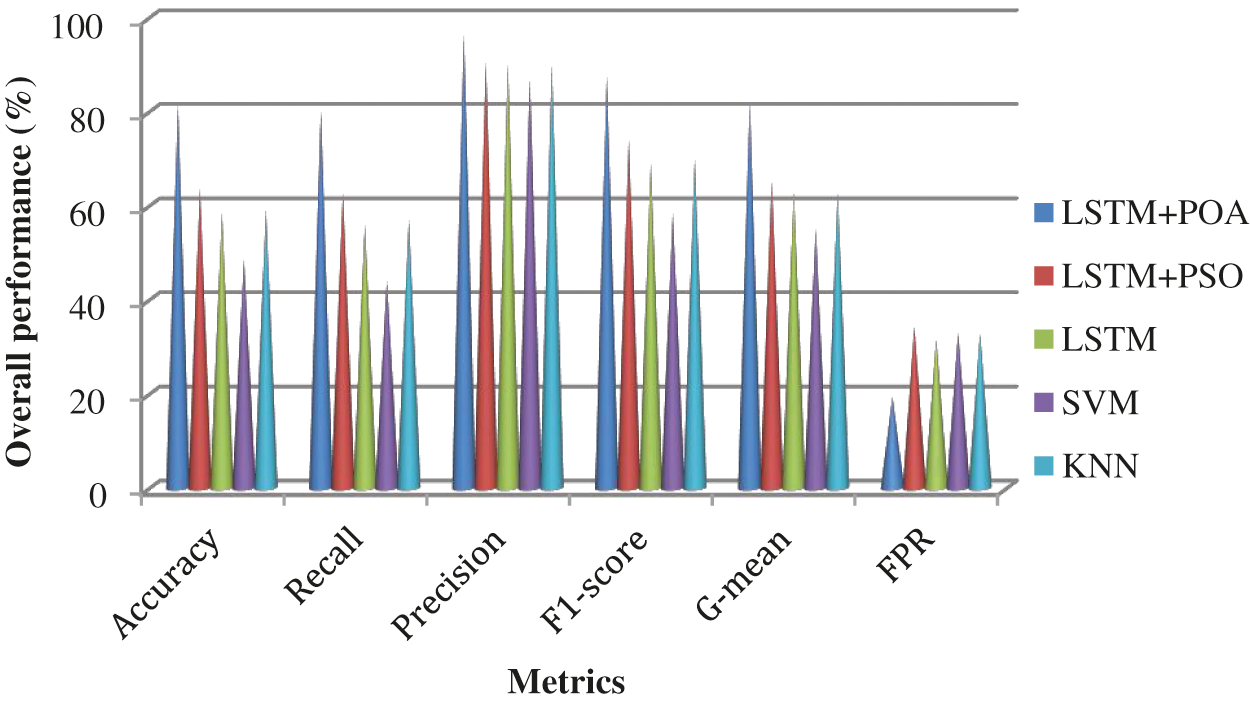
Figure 11: Performance of the various detection models by using KDD test-21
4.3 Performance Analysis using UNSW-NB15 Dataset
The overall performance of the different feature extraction techniques by using UNSW-NB15 is shown in Fig. 12. The SAE attains 91.5% of accuracy, 91.8% of F1-score, and 91.3% of G-mean while AE obtains 83.7% of accuracy, 84.5% of F1-score, and 84.8% of G-mean. Fig. 13 shows the overall performance of the different detection models by using UNSW-NB15. LSTM + POA achieves better performance than the other detection models.
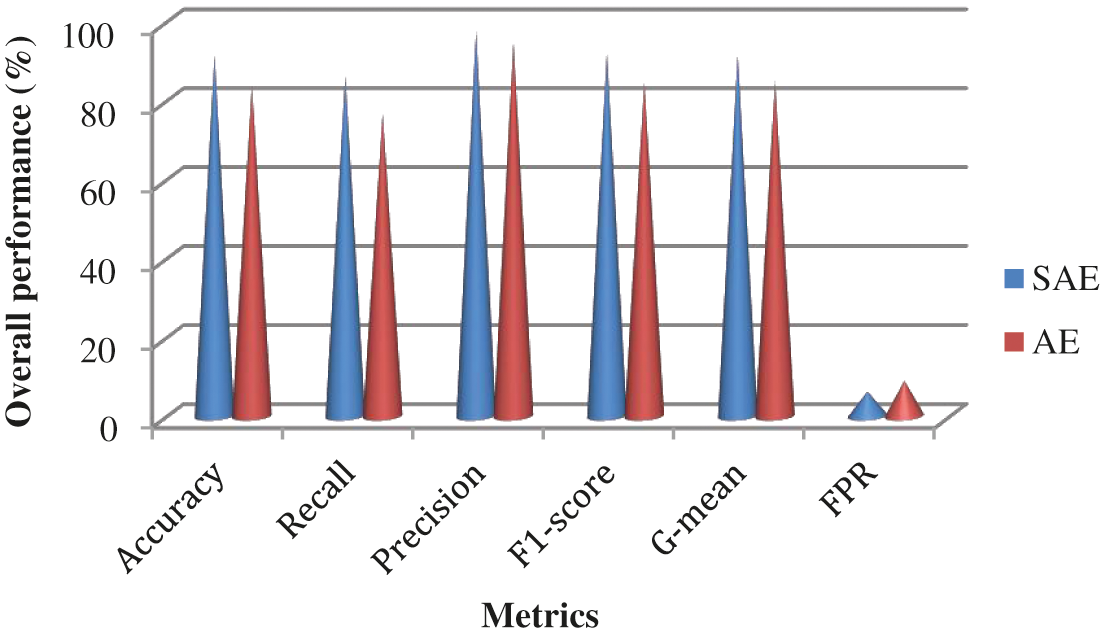
Figure 12: Performance of the different feature extraction techniques by using UNSW-NB15
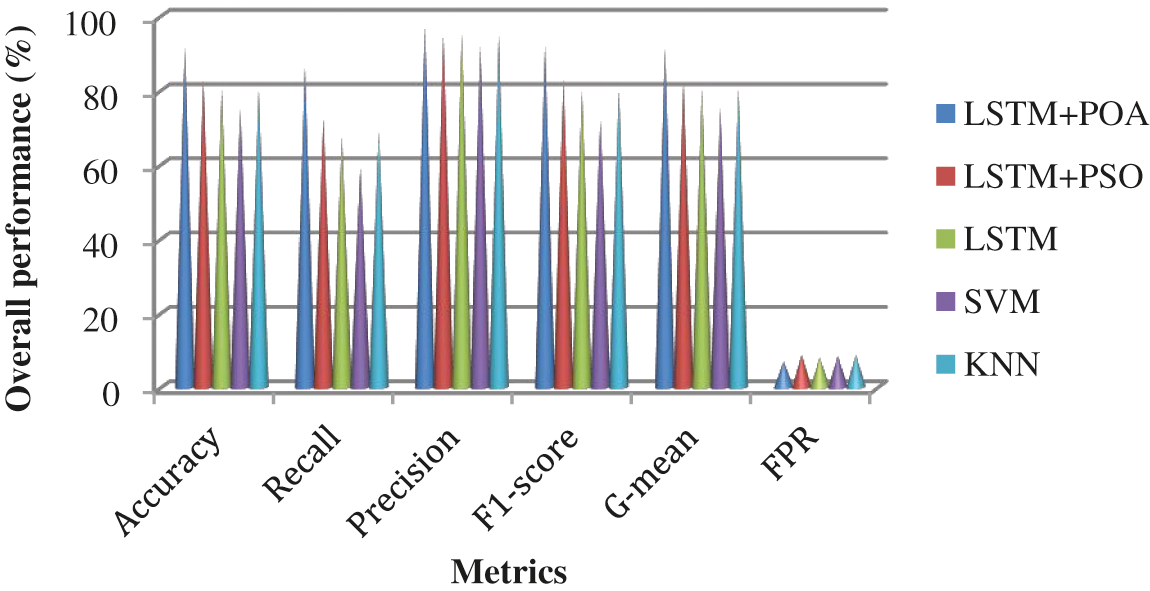
Figure 13: Performance of the various detection models by schemes by using UNSW-NB15
To solve the issues of security threats from the wireless network, we have presented optimized long short-term memory (OLSTM) network with a stacked autoencoder (SAE) network-based IDS system. Using the SAE network, the significant features have been extracted from NSL-KDD dataset. Based on these extracted features, the optimized LSTM has been trained for intrusion detection. For enhancing the detection rate of LSTM, its weight parameters have been optimized using a pigeon optimization algorithm (POA). The potential of the proposed IDS model is analyzed with various test data of NSL-KDD such as KDDTest+, and KDDTest-21 and that of the UNSW-NB15 dataset. Simulation values showed that the performance of the proposed IDS model is improved than the previous machine learning-based IDS schemes with respect to detection rate, accuracy, F1-score, and G mean. In future, we will implement cryptography algorithm for privacy and also, we will develop hybrid algorithm for intrusion detection system.
Funding Statement: The authors received no specific funding for this study.
Conflicts of Interest: The authors declare that they have no conflicts of interest to report regarding the present study.
1. N. K. Mittal, “A survey on wireless sensor network for community intrusion detection systems,” in 3rd Int. Conf. on Recent Advances in Information Technology (RAIT), Dhanbad, Jharkhand, India, pp. 107–111, 2016. [Google Scholar]
2. Z. Tao and A. B. Ruighaver, “Wireless intrusion detection: Not as easy as traditional network intrusion detection,” in TENCON 2005–2005 IEEE Region 10 Conf., Melbourne, Australia, pp. 1–5, 2005. [Google Scholar]
3. A. Yadav, H. Gupta and S. K. Khatri, “A security model for intrusion detection and prevention over wireless network,” in 4th Int. Conf. on Information Systems and Computer Networks (ISCON), Mathura, Uttar Pradesh, India, pp. 12–16, 2019. [Google Scholar]
4. S. Chaipa, M. M. Eloff and M. M. Eloff, “Towards the development of an effective intrusion detection model,” in 2017 Information Security for South Africa (ISSA), Johannesburg, South Africa, pp. 32–39, 2017. [Google Scholar]
5. C. Zhongmin, X. Sheng, F. Jianyuan and X. Renzuo, “The research of intrusion detection technology based on genetic algorithms,” in 2009 Int. Conf. on Networks Security, Wireless Communications and Trusted Computing, Wuhan, China, vol. 2, pp. 248–250, 2009. [Google Scholar]
6. S. Kumar and A. Yadav, “Increasing performance of intrusion detection system using neural network,” in 2014 IEEE Int. Conf. on Advanced Communications, Control and Computing Technologies, Ramanathapuram, Tamil Nadu, India, pp. 546–550, 2014. [Google Scholar]
7. X. Bao, T. Xu and H. Hou, “Network intrusion detection based on support vector machine,” in 2009 Int. Conf. on Management and Service Science, Wuhan, China, pp. 1–4, 2009. [Google Scholar]
8. Y. Yang, K. Zheng, B. Wu, Y. Yang and X. Wang, “Network intrusion detection based on supervised adversarial variational auto-encoder with regularization,” IEEE Access, vol. 8, pp. 42169–42184, 2020. [Google Scholar]
9. S. Kasongo and Y. Sun, “A deep learning method with wrapper based feature extraction for wireless intrusion detection system,” Computers & Security, vol. 92, pp. 101752, 2020. [Google Scholar]
10. Z. Wu, J. Wang, L. Hu, Z. Zhang and H. Wu, “A network intrusion detection method based on semantic Re-encoding and deep learning,” Journal of Network and Computer Applications, vol. 164, pp. 102688, 2020. [Google Scholar]
11. C. Xu, J. Shen, X. Du and F. Zhang, “An intrusion detection system using a deep neural network with gated recurrent units,” IEEE Access, vol. 6, pp. 48697–48707, 2018. [Google Scholar]
12. R. Vijayanand, D. Devaraj and B. Kannapiran, “Intrusion detection system for wireless mesh network using multiple support vector machine classifiers with genetic-algorithm-based feature selection,” Computers & Security, vol. 77, pp. 304–314, 2018. [Google Scholar]
13. H. Qu, Z. Qiu, X. Tang, M. Xiang and P. Wang, “Incorporating unsupervised learning into intrusion detection for wireless sensor networks with structural co-evolvability,” Applied Soft Computing, vol. 71, pp. 939–951, 2018. [Google Scholar]
14. Y. Zhou, T. Mazzuchi and S. Sarkani, “M-AdaBoost-A based ensemble system for network intrusion detection,” Expert Systems with Applications, vol. 162, pp. 113864, 2020. [Google Scholar]
15. P. N. S. Prakash, and N. Rajkumar, “Improved local fisher discriminant analysis based dimensionality reduction for cancer disease prediction,” Journal of Ambient Intelligence and Humanized Computing, vol. 12, pp. 8083–8098, 2021. [Google Scholar]
16. J. Liu, J. He, Z. Wuxia and T. Ma, “ANID-SEoKELM: Adaptive network intrusion detection based on selective ensemble of kernel ELMs with random features,” Knowledge-Based Systems, vol. 177, pp. 104–116, 2019. [Google Scholar]
17. O. J. Aroba, N. Naicker and T. Adeliyi, “An innovative hyperheuristic, Gaussian clustering scheme for energy-efficient optimization in wireless sensor networks,” Journal of Sensors, vol. 2021, 2021. [Google Scholar]
18. A. Rodríguez, C. Soto and R. Velázquez, “Energy-efficient clustering routing protocol for wireless sensor networks based on yellow saddle goatfish algorithm,” Mathematics, vol. 8, no. 9, 2020. [Google Scholar]
19. H. Duan and P. Qiao, “Pigeon-inspired optimization: A new swarm intelligence optimizer for air robot path planning,” International Journal of Intelligent Computing and Cybernetics, vol. 7, pp. 24–37, 2014. [Google Scholar]
 | This work is licensed under a Creative Commons Attribution 4.0 International License, which permits unrestricted use, distribution, and reproduction in any medium, provided the original work is properly cited. |