DOI:10.32604/iasc.2022.024952
| Intelligent Automation & Soft Computing DOI:10.32604/iasc.2022.024952 | |
| Article |
A Stacked Ensemble-Based Classifier for Breast Invasive Ductal Carcinoma Detection on Histopathology Images
Department of Clinical Laboratory Sciences, College of Applied Medical Sciences, King Khalid University, Abha, 9088, Saudi Arabia
*Corresponding Author: Ali G. Alkhathami. Email: aagaithan@gmail.com
Received: 05 November 2021; Accepted: 31 December 2021
Abstract: Breast cancer is one of the main causes of death in women. When body tissues start behaves abnormally and the ratio of tissues growth becomes asymmetrical then this stage is called cancer. Invasive ductal carcinoma (IDC) is the early stage of breast cancer. The early detection and diagnosis of invasive ductal carcinoma is a significant step for the cure of IDC breast cancer. This paper presents a convolutional neural network (CNN) approach to detect and visualize the IDC tissues in breast on histological images dataset. The dataset consists of 90 thousand histopathological images containing two categories: Invasive Ductal Carcinoma positive (IDC+) and Invasive Ductal Carcinoma negative (IDC-). For the detection of this disease, we have proposed an ensemble learning-based deep learning model that consists of the multi-model structure having different internal configuration settings of CNN. As a result, the proposed method has significant progress as per present techniques in terms of accuracy as 92.7%. Therefore, the ensemble approach of multi-model CNN can provide the evolution of IDC at different stages, and this would help the pathologist in the cure of cancer. The experimented results show that the proposed ensemble-based approach of multi-model CNN generated the preeminent results with an accuracy of 92.7% as compared to the already existing techniques.
Keywords: Breast cancer; CNN; invasive ductal carcinoma (IDC); ensemble; histopathological images
Although the human body consists of a solid defense system against cancerous disease, cancerous tissues act like a virus spread to halt healthy tissues of the body [1]. Many women suffer breast cancer (BC) in their lifetimes, around the ratio of one out of ten women diagnoses with the BC in the United States of America according to a recent report. Moreover, a recent study reveals that in Korea around fourteen to fifteen thousand of BC cases occur every year [2]. After the skin and other cancers, BC is one of the utmost common cancers occurs in both men as well as women, but especially it’s more common in women [3].
Recently, there are many applications occur to detect BC, like digital mammography, Magnetic Resonance Imaging, ultrasound imaging, and Computer-Aided systems. Mammography is the most important method to detect BC. On the other hand, MRI is the best alternative to mammography, although it’s a safe procedure sometimes it creates allergic reactions to the skin during diagnoses. Ultrasound imaging uses the X-ray mammography technique, which detects masses that cause cancer, while the CAD systems work with digital mammography and detect specific patterns to detect BC [4]. By considering the properties of the tumor, including size, shape, and spread types, there are some treatment methods like radiation therapy, chemotherapy, and hormone therapy to detect invasive ductal carcinoma (IDC) [5].
Breast tumors are most found in the lobules or milk ducts leading to the nipple. There are many stages of BC. It is generally classified on a numerical scale ranging from stage 1 (earliest) to 4 (most advanced). The phases of IDC are Stage 1 BC is distinct as a tumor that is having size of almost 2 centimeters and has not spread out of the breast tissues. At second stage: A BC with a size between 2–4 centimeters and spread across the underarm’s parts of the body. The third stage cancer has spread all over the breast and effected the surrounding tissues of the body. While at the fourth stage: The BC effected the outside of the underarm’s parts of the body and damage the other organs such as bones, liver, and brain tissues [6].
Invasive ductal carcinoma (IDC) is the initial stage of BC. It has two categories as Invasive Ductal Carcinoma positive (IDC+) and Invasive Ductal Carcinoma negative (IDC-). As the BC is a progressive disease, so the IDC at the starting stage is in the normal condition and detectable to cure. It is also known as infiltrating ductal carcinoma and occurs in 80–90 percent of breast cancer cases. The initial signs of IDC is the swelling of breast body parts, skin irritation, nipple pain, redness and nipple discharge other than breast milk. Moreover, medullary breast cancer (MBC) and not otherwise specified (NOS) are also severe types of BC [2]. An automatic detection of breast IDC with wavelet packet transfer, Google Cloud AutoML, Gene expression, Naive Bayes, Random Forest, AdaBoost, Support Vector Machine, Least-square SVM, and Adabag and Logistic Regression are all examples of machine learning algorithms [7–9].
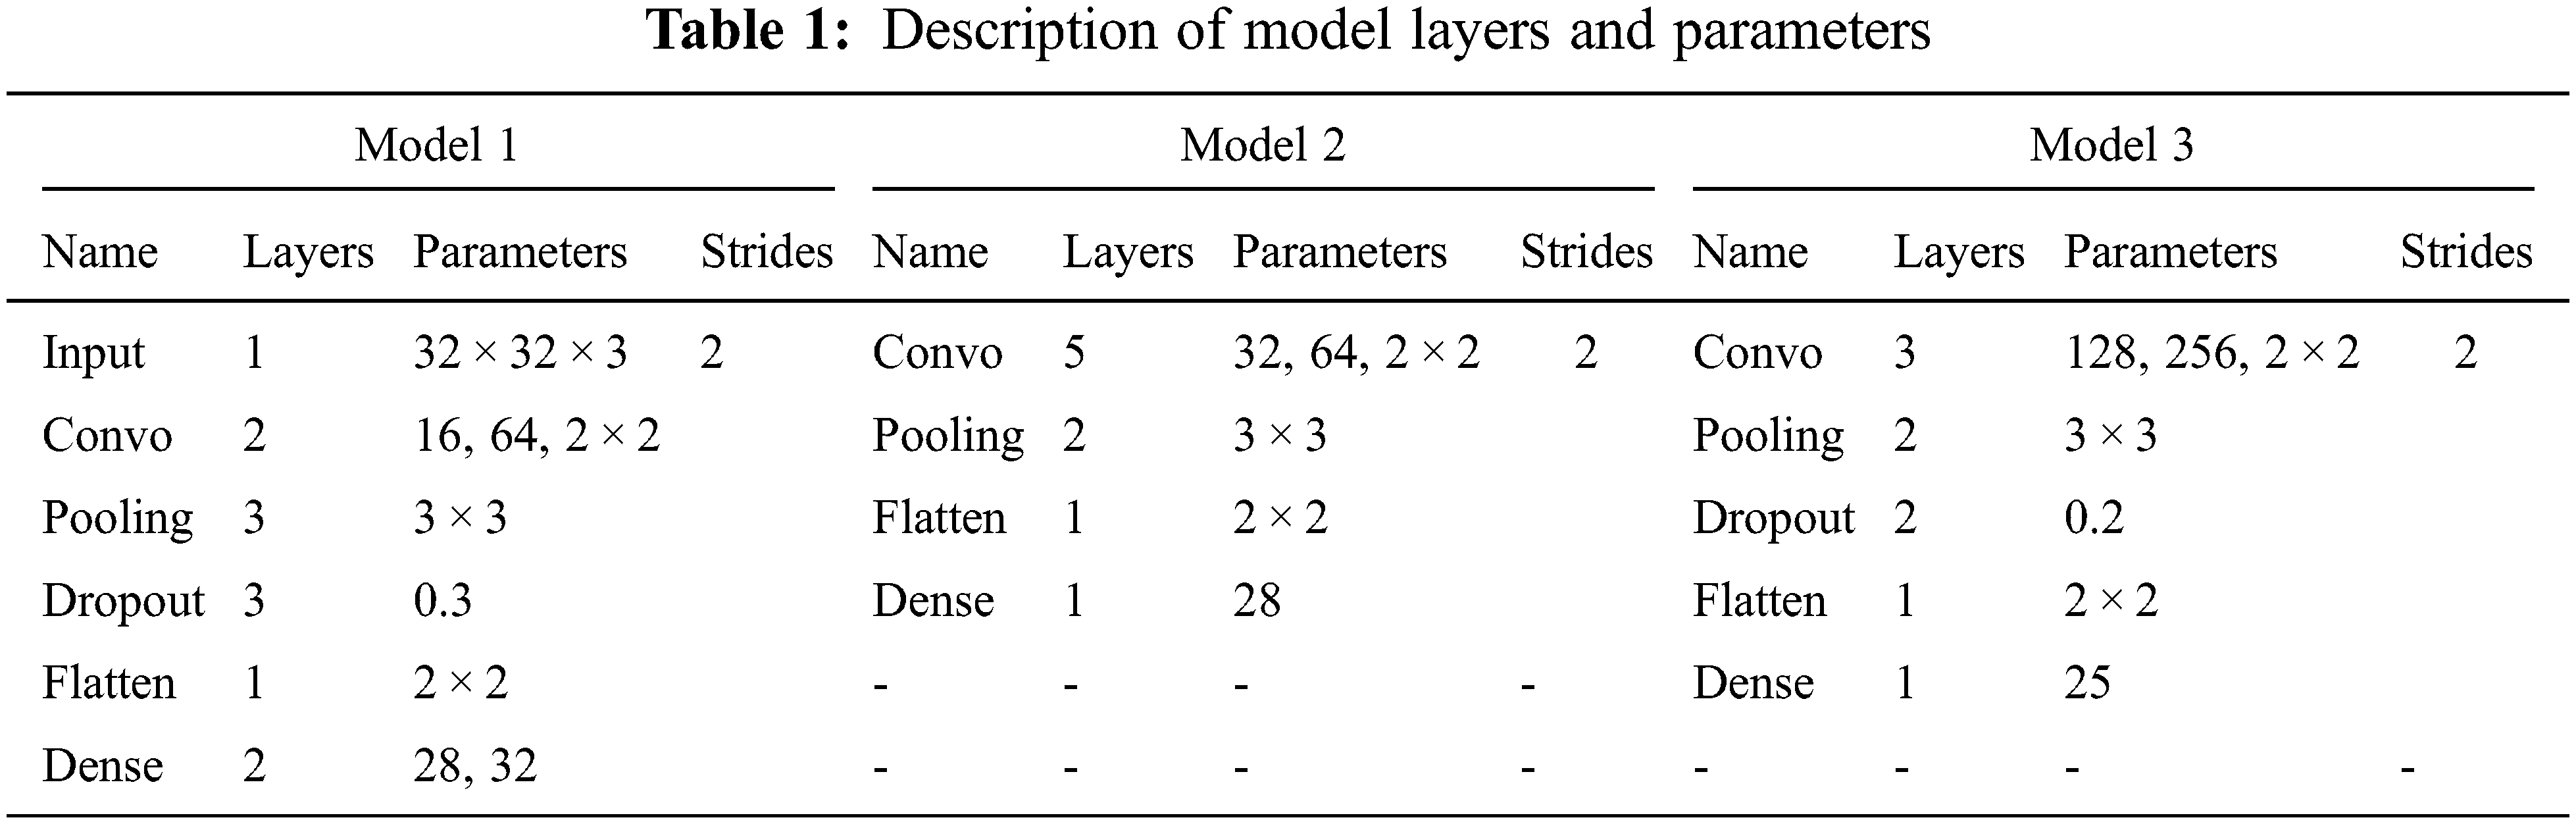
Therefore, this paper presents an ensemble-based CNN approach to detect and visualize the IDC tissues in the breast cancer on IDC histopathological images dataset. The CNN technique is very much suitable for detection of specific area of IDC tissues and their classification. Especially, when data samples are in the large form then CNN classifier learns automatically to get best quality features. The ensemble-based approach is the combination of different model outputs. It consists of three CNN models as: model 1, model 2 and model 3 with different parametric functionalities. The outputs from all the models are used as inputs in ensemble model which is used for the detection and classification of IDC breast cancer. The proposed approach for the detection and classification of IDC BC tissues, the model consists of three different CNN models. These models contain of multiple convolutional, ReLU, max-pooling, dropout, flatten, dense layers with different parameters and strides, filters, and learning rates as shown in Tab. 1.
The paper is prepared in three sections. The most related work of the field is offered in Section 2. The whole methodology is described in Section 3 as the methodology. The attained results and discussion is described in Section 4. The obtained outcomes are to be maximum precise in the form of precision when compared to the other existing techniques.
IDC is a prominent form of breast cancer. It affects the breast tissues at the initial level of BC. In [2] study the author compares the clinical pathologic characteristics of MBC and IDC. The patients with IDC cases were reviewed thoroughly during this study. As a result, more than fifty plus patients were identified with MBC and about five thousand plus patients were found with IDC cases.
On the other hand, another utmost common subtype of BC is invasive lobular carcinoma (ILC). The ILC is different in clinical pathologic physical characteristics and responsiveness of systemic therapy as compared to IDC. Clinical evidence suggests that ILC receives a distinctive benefit from systemic therapy as compared to IDC. Furthermore, detailed molecular investigations of ILCs have been performed, demonstrating that these tumors have distinct genetic profiles from IDCs. Despite these distinctions, treatment trials and clinical practice guidelines address BC as a single entity [5].
Moreover, regarding the detection and classification of the histopathological images, there exist many techniques of image processing and machine learning such as SVM, decision tree, and some of them also proposed colors, texture, and morphology-based approaches for breast cancer identification [10–15]. Mostly, the analysis of histopathological images is based on deep learning techniques such as AlexNet, Resnet, ImageNet, and U-Net which automatically learns the features map to optimally solve the detection issues [16–18].
On the other hand, deep learning techniques integrated with some other classifiers such as SVM, decision tree, random forest tree, and these techniques used an appropriate mechanism for training such as patches, pre-processing, selection of parametric function, and loss function for detection purposes [19–22]. Most of the methods used in detection and classification purpose are fully dependable on convolutional neural networks (CNN). As related to detection and classification tasks the method used in [23] won first place in the challenge of ISBI2016 Metastasis detection by using CNN architecture [21]. While the method outperforms in terms of accuracy by using CNN in [24]. Another method for the detection of IDC used in [4] outperforms the best accuracy method as compared to the other handcrafted feature extraction methods by using the dataset available at [25].
A CNN-based AlexNet was performed to differentiate the malignant and benign BC. This approach performed in the best way as the already existing method depends on handcrafted texture techniques on the BreakHis dataset [12]. The study [26] anticipated evaluation between CNN and the handcrafted feature abstraction technique for the classification of the breast cancer histological images of the BreakHis dataset. On the other, for the same dataset the BC histological image classification task was performed without the image magnification factor [27].
The author in [20] used the three different configurations for Resnet architecture for the multi-classification of BC and achieved remarkable accuracy for the ICIAR2018 challenge provided dataset [19]. Similarly, in another study, AlexNet used the same training mechanism for IDC and lymphoma multi-level classification for the dataset presented at [25]. It performed in the best way for IDC detection and classification [4]. On the other hand, a FusionNet architecture was proposed for the multi-level classification of IDC and lymphoma. The performance of FusionNet is evaluated on the digital histological images and later compared by ResNet and U-Net. The detection task’s F-measure score improved by 5.06 percent, while the classification task’s accuracy measure improved by 1.09 percent [28].
The two CNN models were used for the detection of IDC in the depth wise separable and standard CNN convolution to improve the accuracy of the network. The ReLU and sigmoid activation functions were also used for testing purposes. As well as the Gaussian noise and SoftMax classifiers were also used to enhance the robustness of the two models and achieved an accuracy of 87.5% [29]. To detect the malignant and benign cancer for IDC breast tissue of the breast histopathology image dataset a deep learning method Resnet was also used in [30]. The CNN method was used for the IDC patch base classification task and achieved an accuracy of 85.41% [6].
The methodology section explains the complete structure of the proposed methodology to detect and visualize the invasive ductal carcinoma (IDC) tissues in BC on the IDC histological images dataset. The ensemble-based approach is the combination of different models output. It combines the decision from multiple models to enhance the overall accuracy results. The proposed ensemble-based machine learning (EBML) model is the combination of three convolutional neural network models known as multi-models’ convolutional neural networks (MMCNN). These models consist of multiple convolutional, ReLU, max-pooling, dropout, flatten, and dense layers with different parameters and strides, filters, and learning rates. The detailed description of the proposed model is presented in Fig. 1.
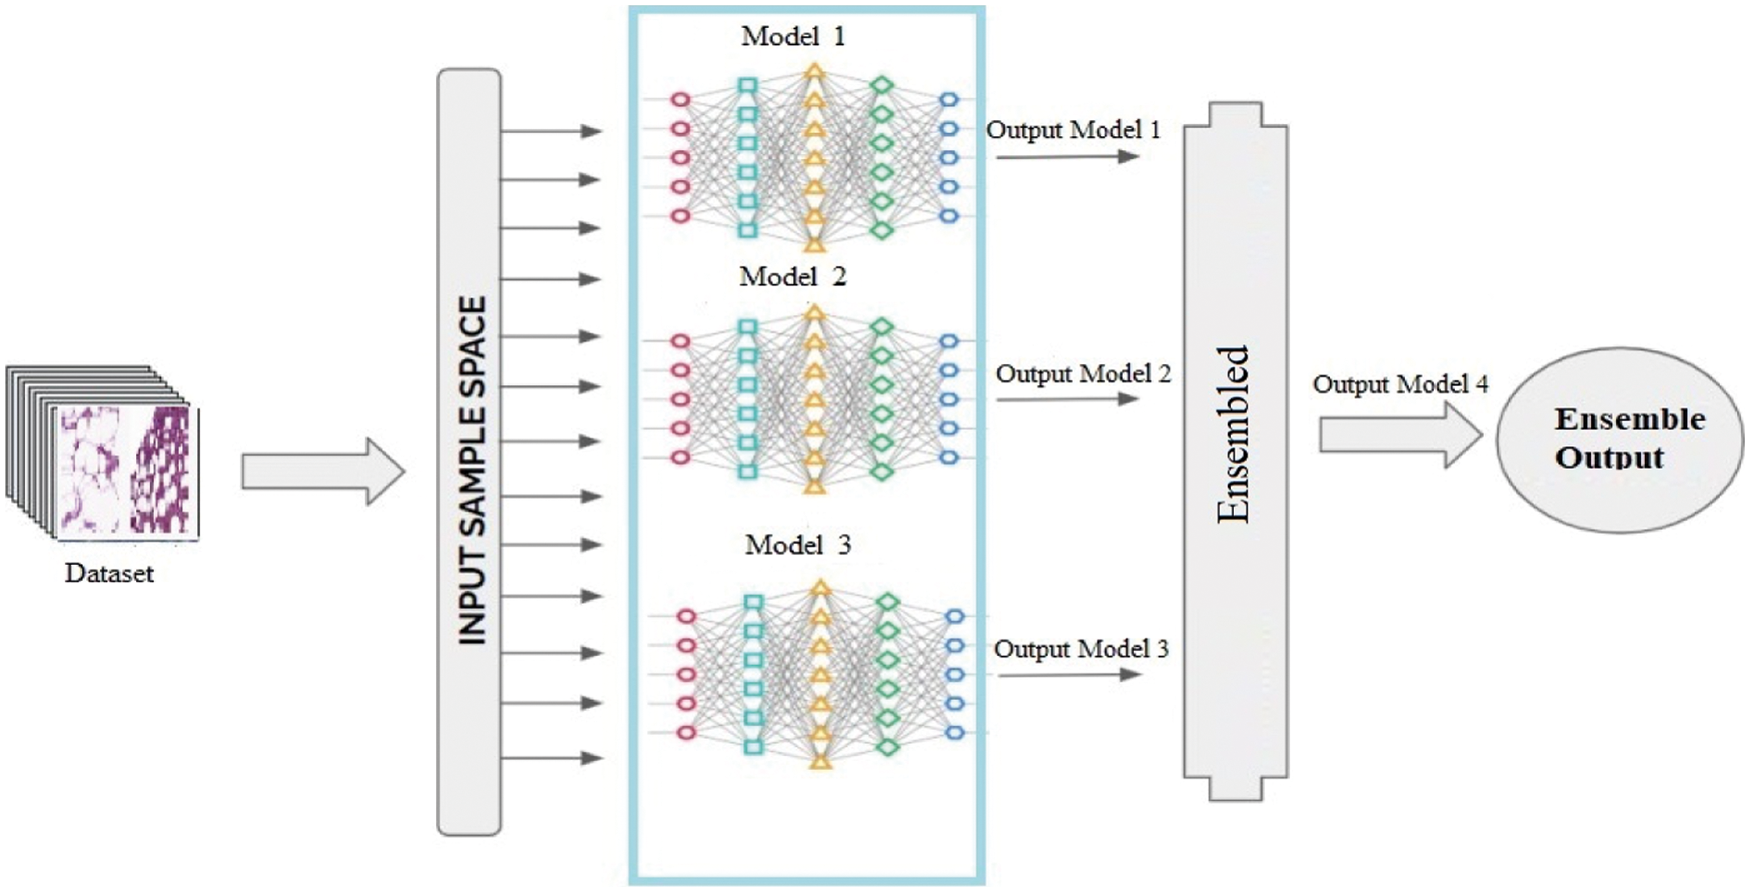
Figure 1: Workflow of ensemble-based model
3.1 Proposed Ensemble-based Modeling
The ensemble-based technique is known as the multiple model technique that combining many techniques, such as classifiers or other techniques, to handle a precise computational complex problem. It is largely participated to increase the accuracy of models in terms of classifications and predictions. It combines the conclusion from manifold replicas to improve the inclusive accuracy results. Other uses of it contains turning over a confidence level to the model’s results and selecting the best option by using voting and weight techniques [31].
The anticipated ensemble method consists of two initial stages. First one is preprocessing and the second one is the feature section and to find relevant features related to IDC BC. In pre-processing the texture feature are extracted from the ROI obtained from IDC. On the other hand, in the second phase, the extracted features are matched to the accurate one feature to create correlation-based classification metrics. It helps to optimize the computational time and accuracy.
In our proposed ensemble approach for the detection and classification of IDC BC tissues, the model consists of three different CNN models. These models contain of multiple convolutional, ReLU, max-pooling, dropout, flatten, and dense layers with different parameters and strides, filters, and learning rates. These models create different results for the detection and classification of IDC BC. Model 1 of the convolutional neural network contains of one image input layer with image width, height, and channel size, two convolutional layers from size 16 to 64 with filter size 2 × 2. There are three max-pooling layers with size 3 × 3, dropout layer with rate 0.3 and in the end, flatten and dense layers are applied. The activation functions used for these models are the SoftMax and ReLU with stride 2 and learning rate 0.1. The detailed explanation of model layers with parameters is given away in Tab. 1.
According to model 2, a CNN consists of five convolutional layers from size 32 to 64 with filter size 2 × 2. There are two max-pooling layers with size 3 × 3, learning rate 0.1, and in the end, one flatten and one dense layer are applied. The activation functions used for these models are the SoftMax and Relu with stride 2 and learning rate 0.1. The detailed description of model layers with parameters is presented in Tab. 1.
The convolutional neural network of model 3 contains three convolutional layers from size 128 to 256 with filter size 2 × 2. There are two max-pooling layers with size 3 × 3, a dropout layer with a rate of 0.3 and in the end, one flatten and one dense layer are applied. The activation functions used for these models are the SoftMax and ReLU with stride 2 and learning rate 0.1. The detailed description of model layers with parameters is displayed in Tab. 1.
On the other hand, by combining results from all the three models, the resultant metrics are stored in another model known as model 4 or ensemble model as shown in Eq. (1). The ensemble model shows the results by using different weighted techniques. Where i1, i2 and i3 is the model numbers and
3.1.1 Maximum Voting Technique
In most classification situations, the maximum voting method is used. Multiple models are employed to produce predictions for each data point in this technique. Each model’s predictions are regarded as a vote. The final prediction is based on the majority of the models’ projections [32]. In our work, all the models are assigned with a voting number from range 1 to 5. The model with the highest voting number is used as input for the ensemble model as shown in Eq. (2). Where i1, i2 and i3 is the model numbers.
Multiple forecasts are made for each data point in averaging, like the maximum voting procedure. We utilize the average of all the models’ forecasts to produce the final prediction in this method. In regression problems, averaging can be used to make predictions, and in classification problems, it can be used to compute probabilities [33]. All the model weight is averaged to take the highest accuracy for the ensemble technique as shown in Eq. (3). Where i1, i2 and i3 is the model numbers.
3.1.3 Weighted Averaging Technique
This is a variation in the averaging technique. Different weights are assigned to each model, indicating how important it is for prediction [34]. All the models are assigned with weight numbers from range 0 to 1. The model with the highest weighted average is used for the ensemble-based model for IDC classification and detection as shown in Eq. (4). Where i1, i2 and i3 is the model numbers.
The anticipated ensemble-based machine learning (EBML) model was implemented in python on the computer system having GPU 6GB GTX1060, Core i7, 8th generation with RAM 16GB to calculate results of IDC breast cancer detection and classification.
4.1 Dataset Description and Pre-processing
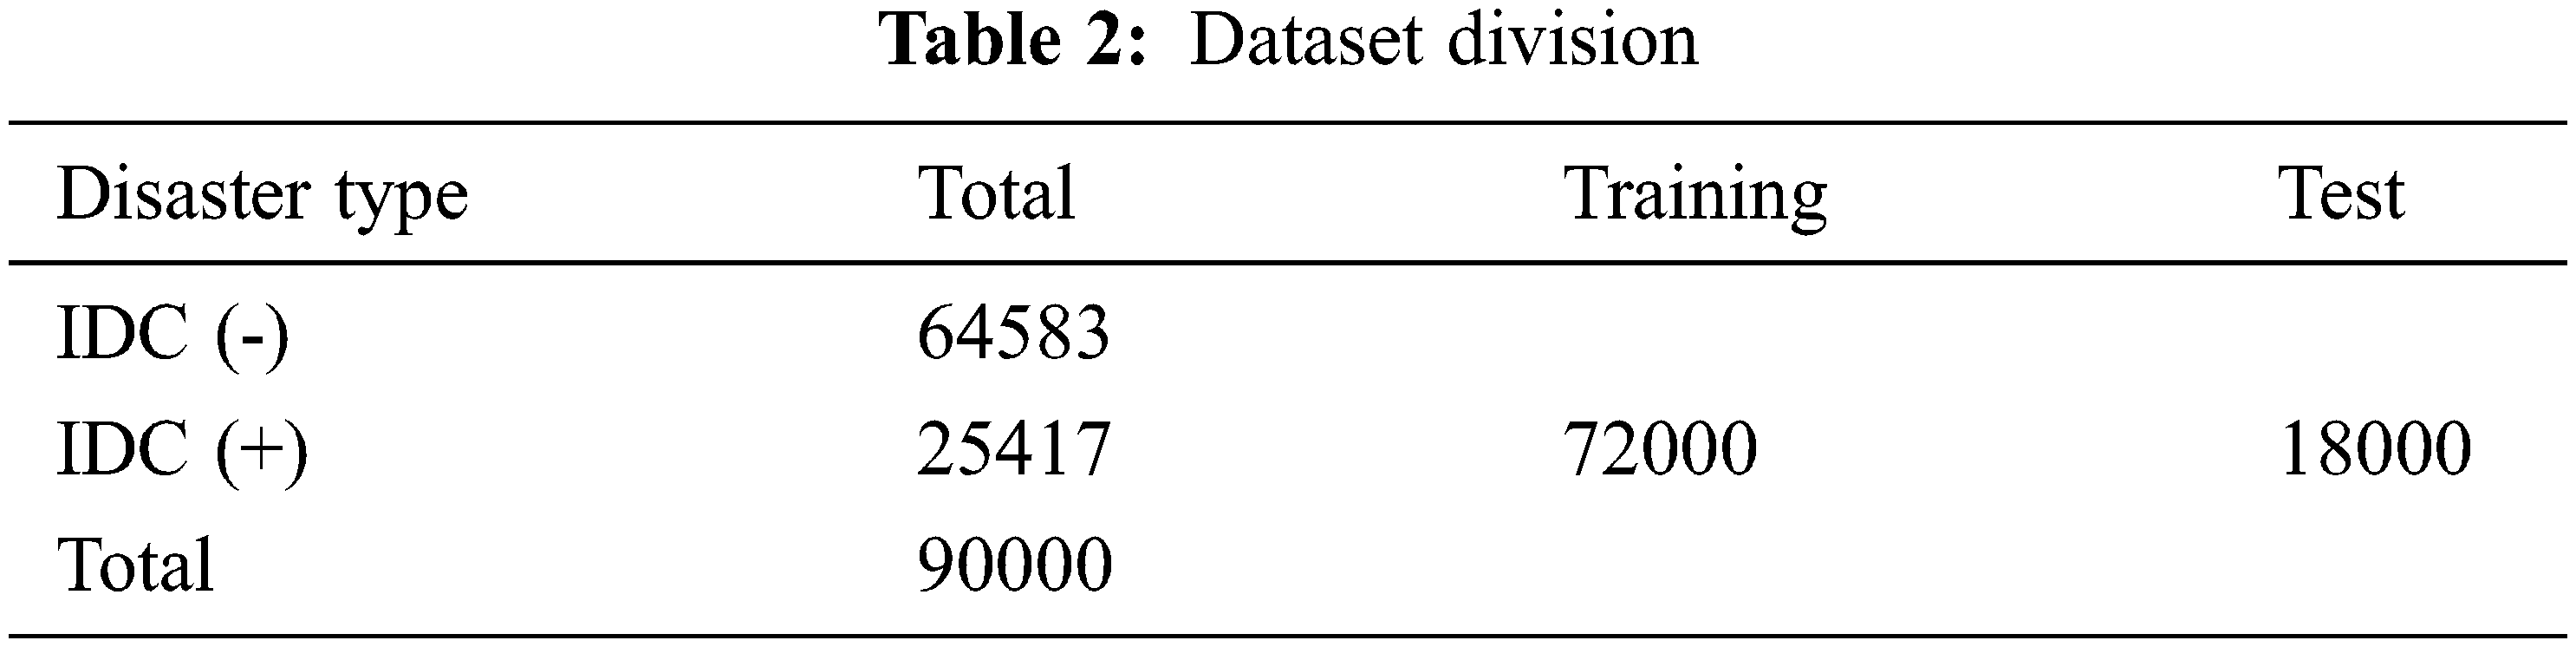
This paper introduces the histopathological images dataset for BC. The dataset consists of 90 thousand images of breast cancer with 50 × 50 width and height respectively. It consists of two categories known as Invasive Ductal Carcinoma positive (IDC+) and Invasive Ductal Carcinoma negative (IDC-) [35] as shown in Fig. 2. To remove the noise a histogram equalizer (HE) was used to clarify images as a preprocessing analysis. Training and testing were used to partition the entire dataset into two groups. The dataset used for training 80% and testing 20% of the total as shown in Tab. 2. These dataset percentages were utilized to instruct the machine on which dataset percentage values should be used for testing and training processes.
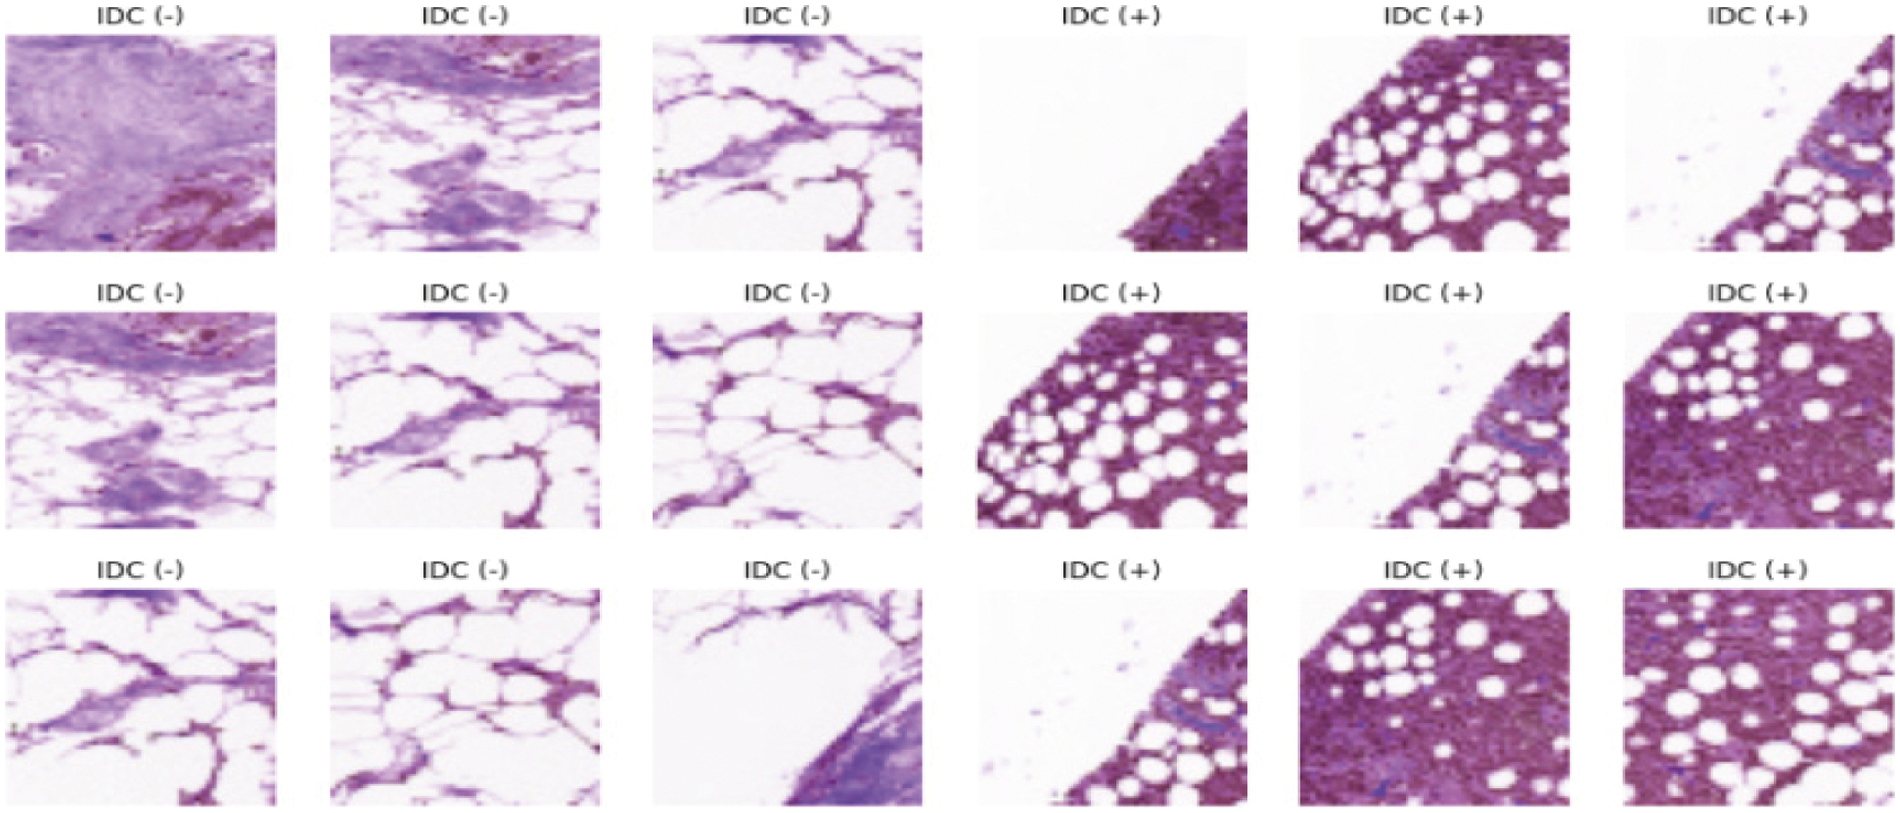
Figure 2: Dataset image samples
During the training process, the pre-processed dataset is feed to the proposed to get the required results. At this stage, many parameters are used with the proposed ensemble-based architecture. The layers for the training process are convo, max pooling, flatten, dense, and dropout.
The test dataset from the data pre-processing phase is fed into the model in the exact similar layout as the training dataset once the model has been built. It is determined how accurate the classification or prediction is. The better the model, the closer it comes to a hundred percent accuracy. Of course, as the scope of the data raises and variations are made to the model, it is statistically difficult to shape a model with 100% accuracy.
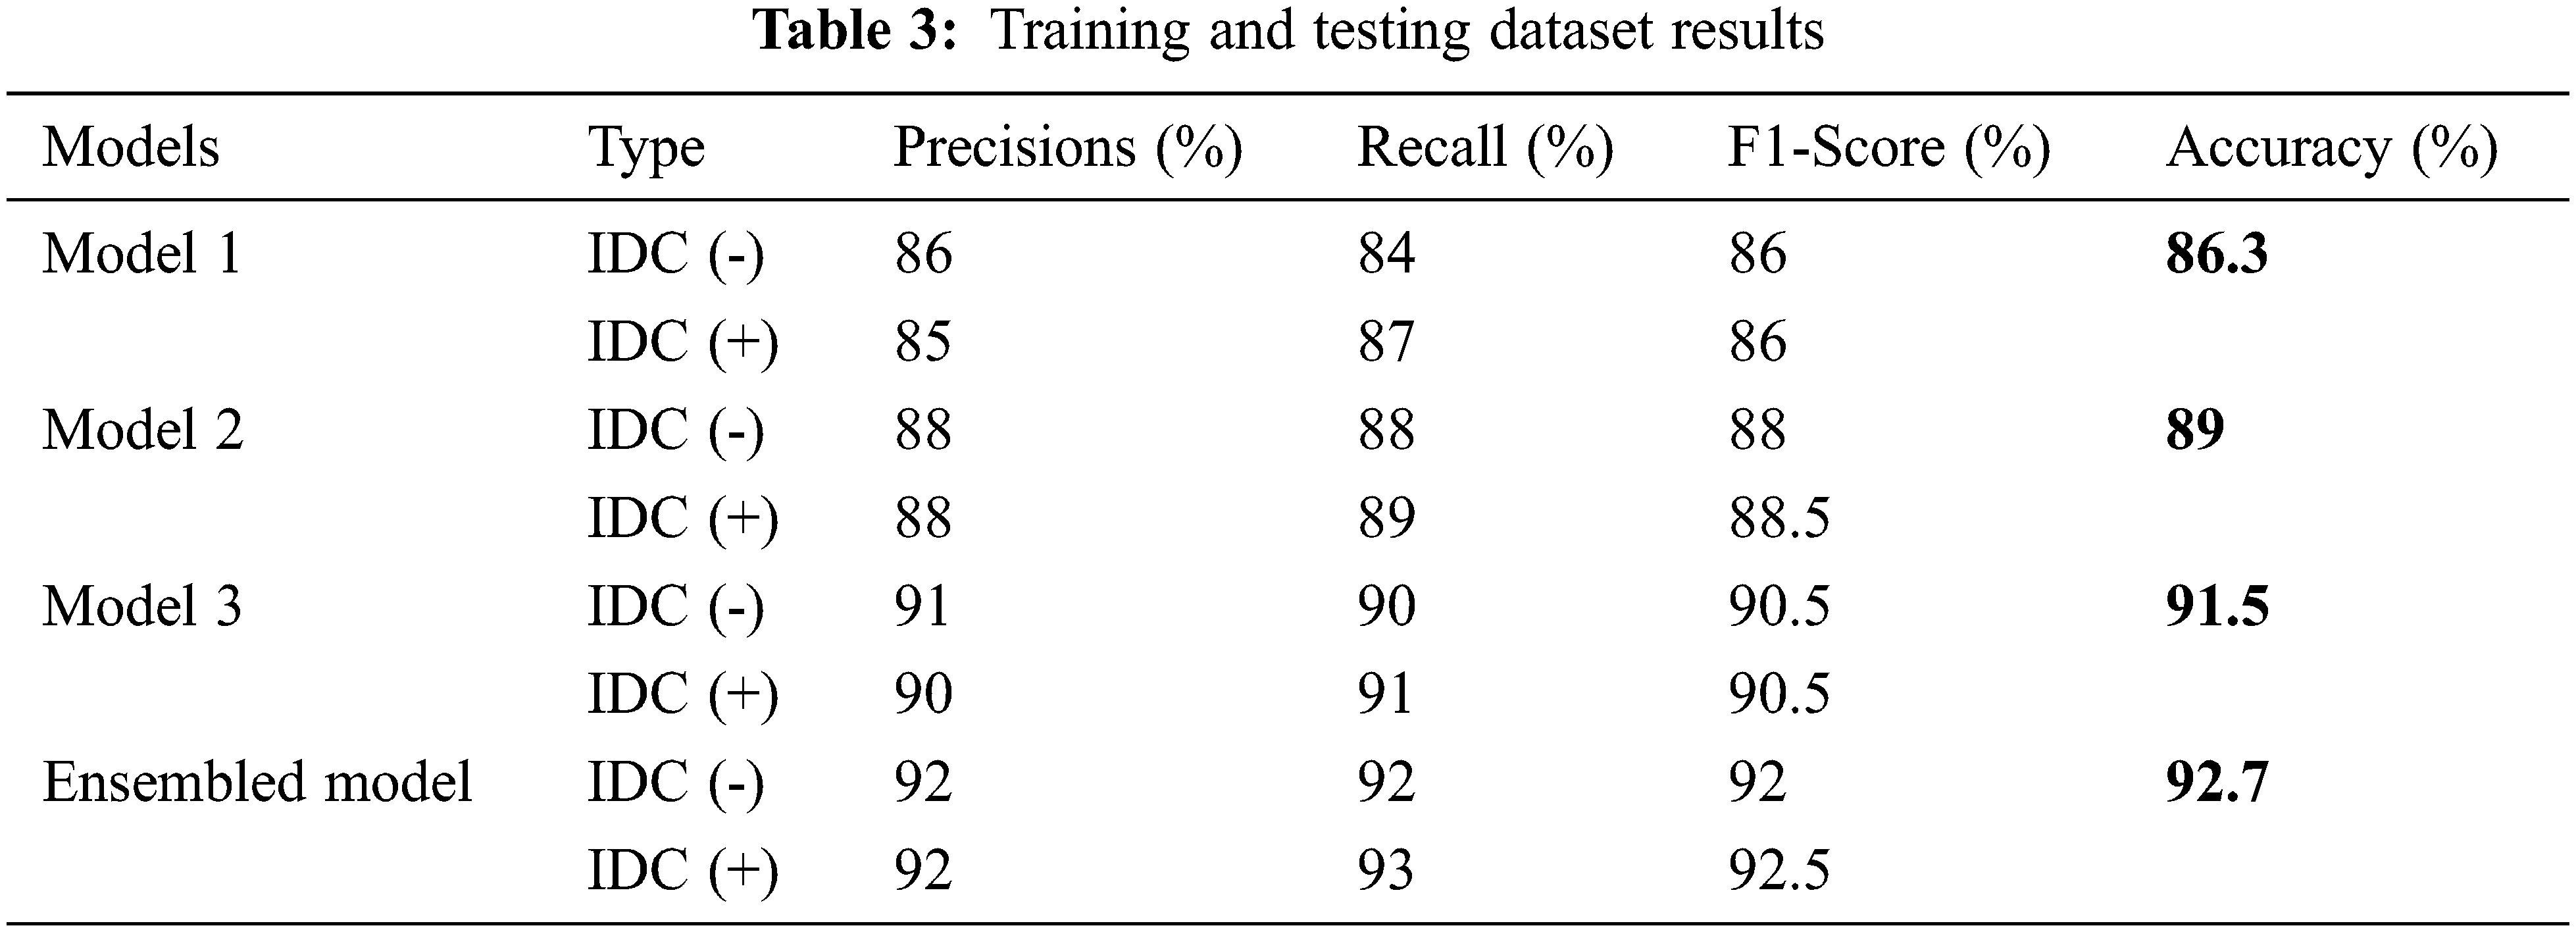
The proposed model used different classifiers models for IDC breast cancer classification and detection. The model values are calculated with help of different statistical equations given below from Eqs. (5)–(8). True positive was the correctly classified images knows as Tp, a true negative is the negative classified images represent as Tn, Fp represents the number of incorrectly positive classified images and the Fn represents the number of incorrectly negative classified images. The statistical values sensitivity, accuracy rate, specificity, and precision were used to measure the model’s output. Where there was a clash between accuracy and sensitivity, so the F1-score was used to assess the results.
The evaluation of the training and testing process for the proposed model is specified in Tab. 3 and the confusion matrix for the testing process is shown in Fig. 3A. The Fig. 4A displays the training and validation accuracy and loss of the training process. The dotted blue and red lines demonstrate the training-validation accuracy and loss respectively. On the other hand, the evaluation of the training and testing process for the proposed model 2 is specified in Tab. 3, and the confusion matrix for the training process is shown in Fig. 3B. The Fig. 4B displays the training and validation accuracy and loss of the training process. The dotted blue and red lines display the training-validation accuracy and loss respectively. Moreover, the evaluation of the training and testing process for the proposed model 3 is specified in Tab. 3, and the confusion matrix for the training process is revealed in Fig. 3C. The Fig. 4C displays the training and validation accuracy and loss of the training process. The dotted blue and red lines show the training-validation accuracy and loss respectively. The evaluation of the training and testing process for the proposed ensemble-based model is also specified in Tab. 3 with a 92.7% accuracy value. Fig. 3D displays the confusion matrix of proposed model.
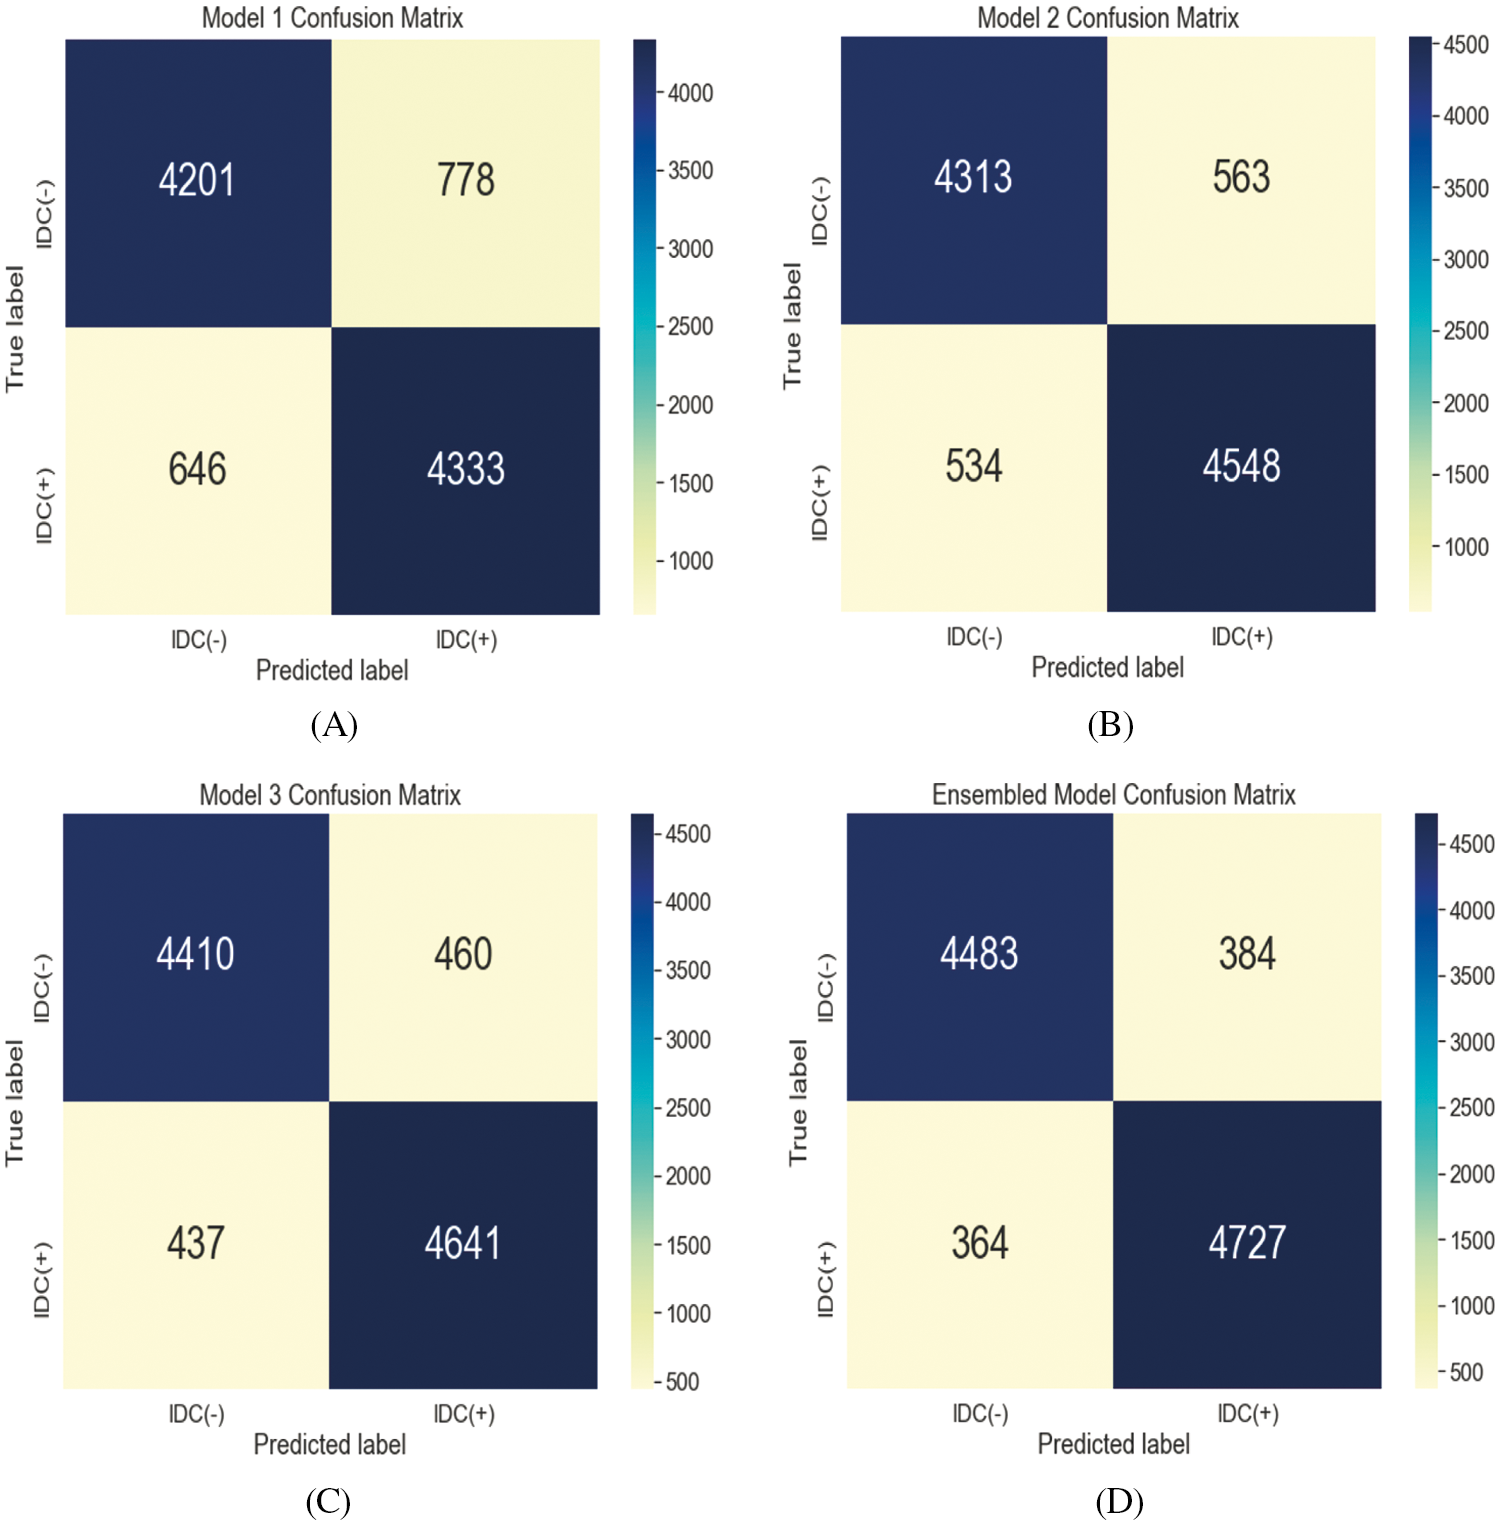
Figure 3: Two-class classification confusion matrix for the testing process of Model 1 (A), Model 2 (B), Model 3 (C), and ensemble model (D)
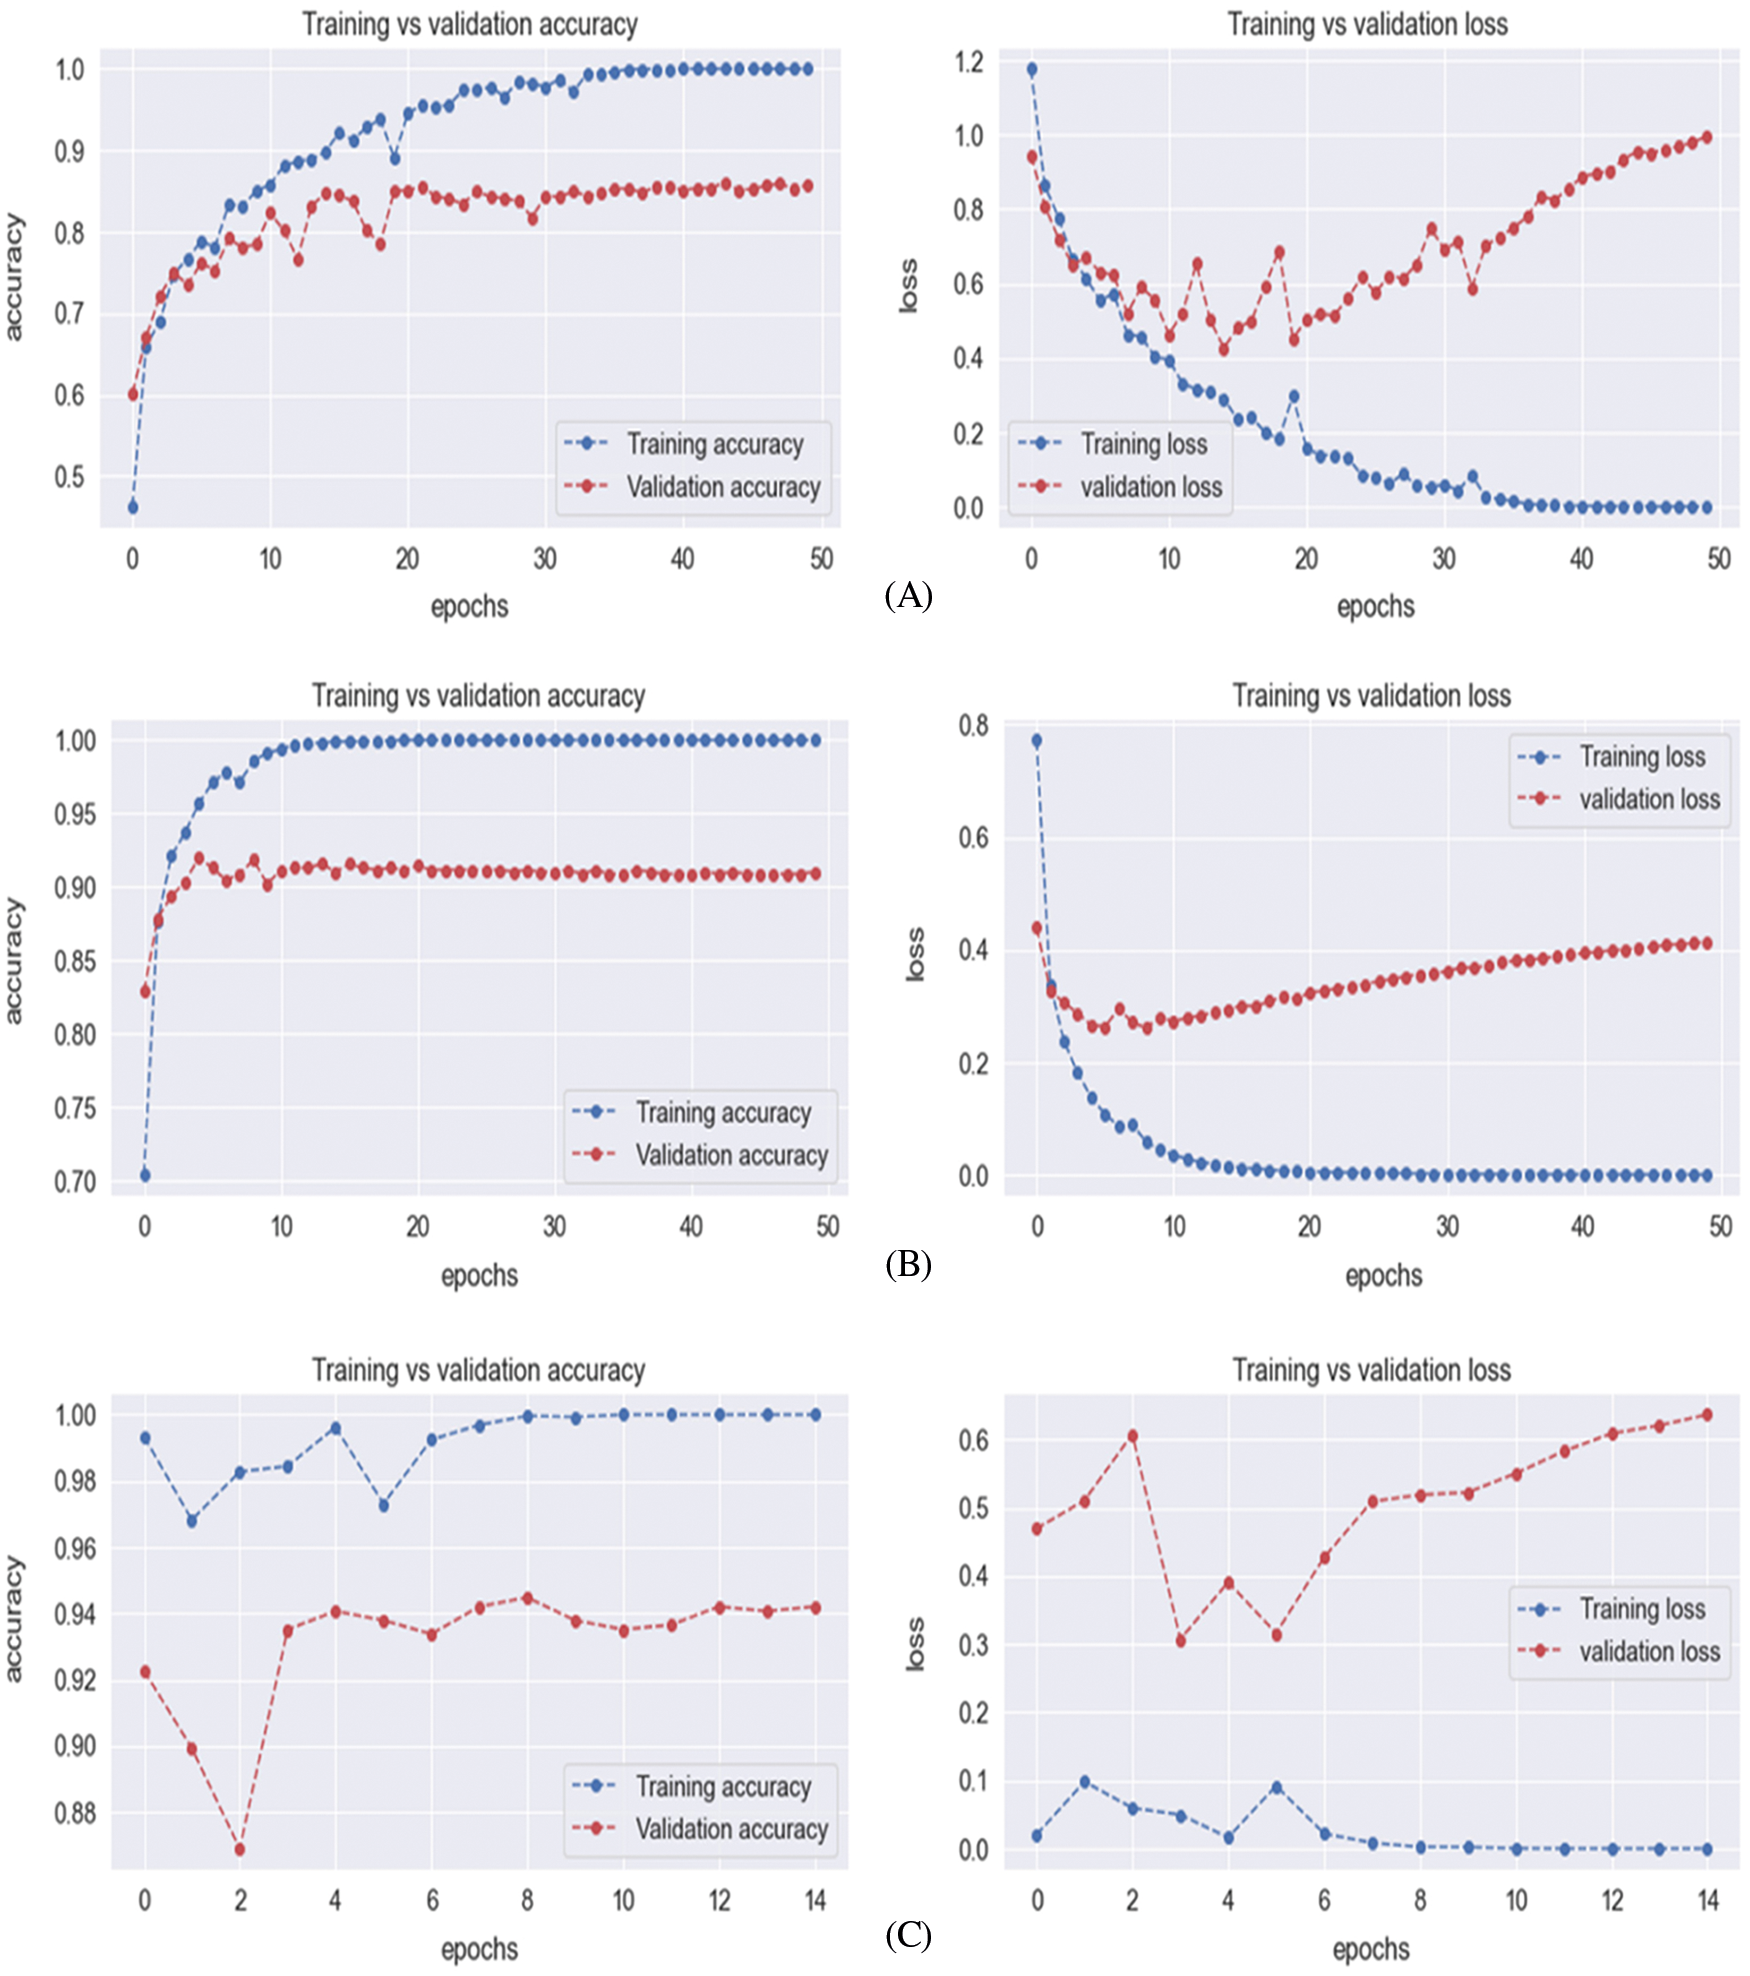
Figure 4: Training-validation loss graph of Model 1 (A), Model 2 (B), and Model 3 (C)
The results in Tab. 4 show that the simple classifiers on the same dataset produce different types of results as accuracy in terms of low values. The reason is that the simpler classifiers do not consist of special parameters and these classifiers take input values and show the results only. In this classifier, there exists no customization for the parameters for the complex dataset execution.
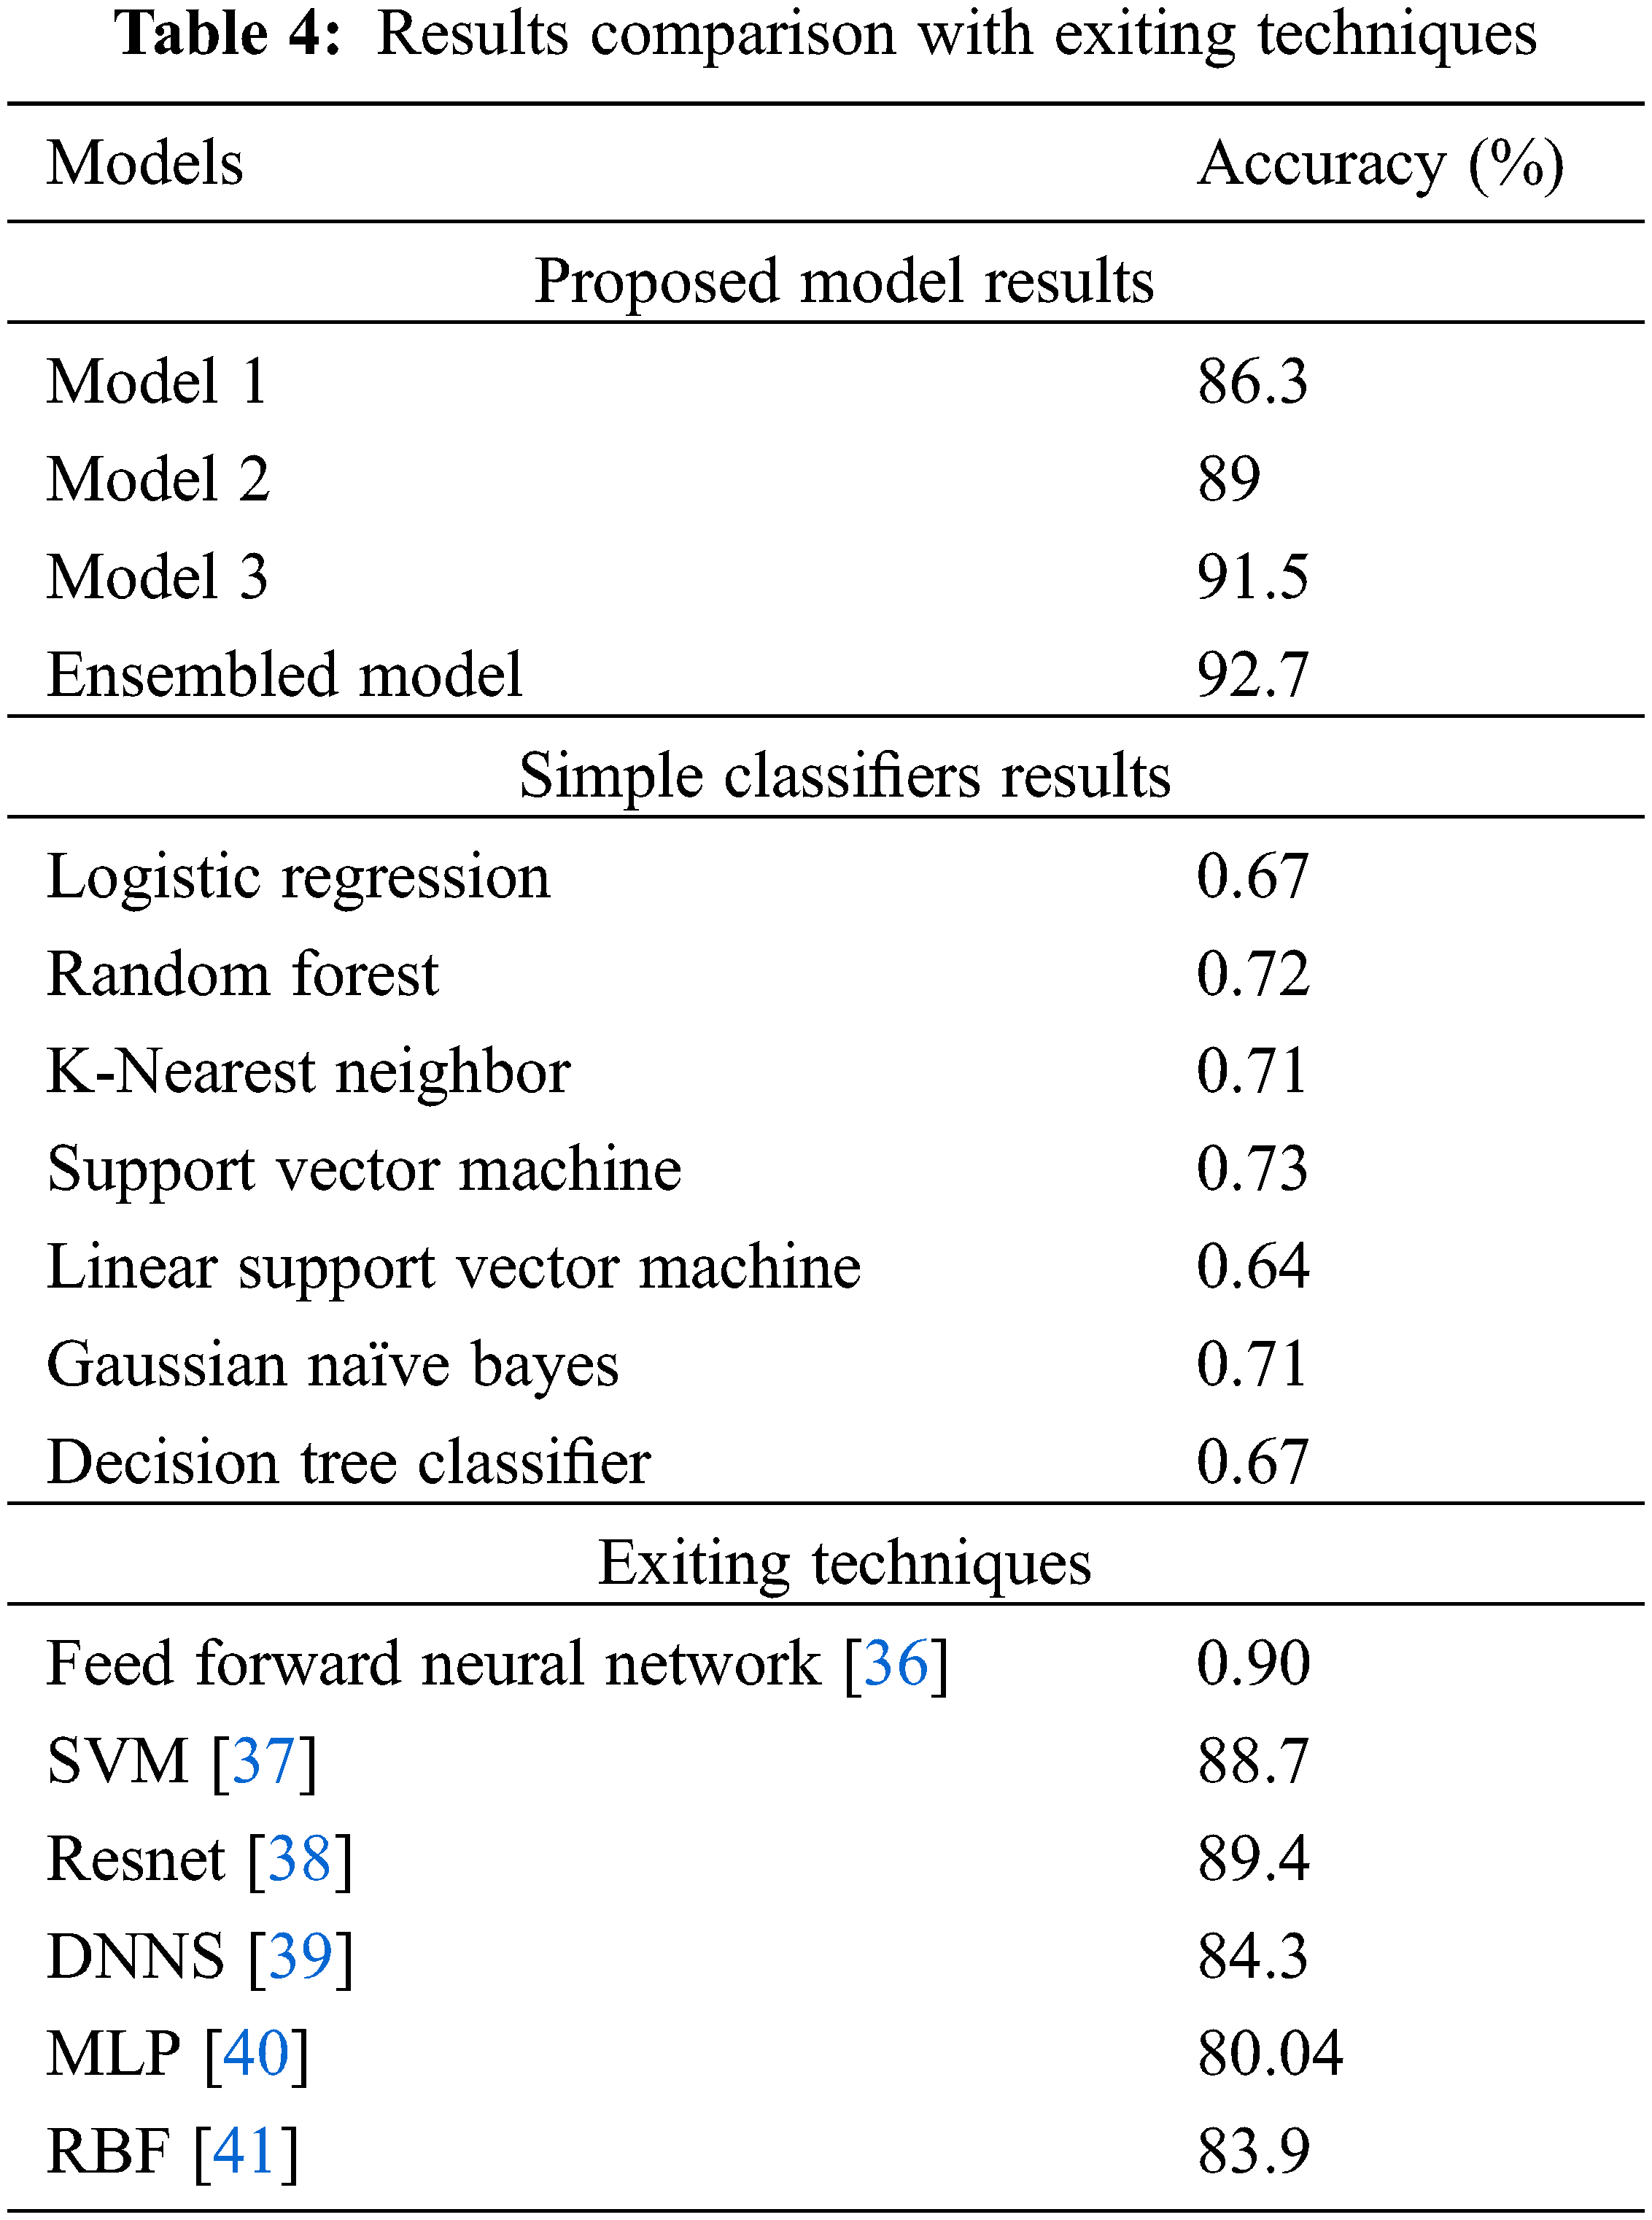
On the other hand, Tab. 4 also shows the comparison of accuracy values with the already existing algorithms. The proposed ensemble-based technique for IDC breast cancer classification and detection shows better results as accuracy: 92.7% because of the multi-model structure, the number of parameters, and filters used that minimizes the complexity to give the highest results.
More than 80% of breast cancer cases consist of infiltrating ductal carcinoma disease. For the detection of this disease, we have proposed an ensemble learning-based deep learning model that consists of a multi-model structure having different internal configuration settings of CNN. The data yielded 72000 images as features extractions for the training model and 18000 images for testing purposes. After preprocessing and data balancing techniques passed data to our classifier model and found significant improvement in comparison to the baseline papers as well as state-of-the-art classifiers on this dataset. According to the results, the proposed approach has considerable improvement as per existing techniques in terms of accuracy achieved by 92.7%. Thus, the ensemble approach of multi-model CNN can provide the progression of IDC at different stages and this would help the pathologist in the treatment of cancer. As a future directions the proposed method would be enhanced to get better results for different available breast cancer medical images dataset.
Data Availability: The dataset is publicly available at https://www.kaggle.Com/paultimothymooney/breast-histopathology-images (accessed on 12 Jan 2021).
Funding Statement: The author acknowledges the support from King Khalid University Saudi Arabia under grant code GRP/6/42.
Conflicts of Interest: The authors declare that they have no conflicts of interest to report regarding the present study.
1. M. B. Terry, Y. Liao, A. S. Whittemore, N. Leoce, R. Buchsbaum et al., “10-year performance of four models of breast cancer risk: A validation study,” The Lancet Oncology, vol. 20, no. 4, pp. 504–517, 2019. [Google Scholar]
2. I. Ark, J. Kim, M. Kim, S. Y. Bae, S. K. Lee et al., “Comparison of the characteristics of medullary breast carcinoma and invasive ductal carcinoma,” Journal of Breast Cancer, vol. 16, no. 4, pp. 417–425, 2013. [Google Scholar]
3. S. J. Mambou, P. Maresova, O. Krejcar, A. Selamat and K. Kuca, “Breast cancer detection using infrared thermal imaging and a deep learning model,” Sensors (Basel), vol. 18, no. 9, pp. 2799–2818, 2018. [Google Scholar]
4. A. R. Cruz, A. Basavanhally, F. González, H. Gilmore, M. Feldman et al., “Automatic detection of invasive ductal carcinoma in whole slide images with convolutional neural networks,” in Proc. Medical Imaging 2014: Digital Pathology, San Diego, California, USA, vol. 9041, pp. 03–18, 2014. [Google Scholar]
5. R. Barroso-Sousa and O. Metzger-Filho, “Differences between invasive lobular and invasive ductal carcinoma of the breast: Results and therapeutic implications,” Therapeutic Advances in Medical Oncology, vol. 8, no. 4, pp. 261–266, 2016. [Google Scholar]
6. G. Sultan, S. Zubair, I. A. Tayubi, H. U. Dahms and I. H. Madar, “Towards the early detection of ductal carcinoma (a common type of breast cancer) using biomarkers linked to the PPAR (γ) signaling pathway,” Bioinformation, vol. 15, no. 11, pp. 799–805, 2019. [Google Scholar]
7. W. Liu, R. Zhang, Y. Ling, H. Tang, R. She et al., “Automatic recognition of breast invasive ductal carcinoma based on terahertz spectroscopy with wavelet packet transform and machine learning,” Biomedical Optics Express, vol. 11, no. 2, pp. 971–981, 2020. [Google Scholar]
8. Y. Zeng and J. Zhang, “A machine learning model for detecting invasive ductal carcinoma with google cloud AutoML vision,” Computers in Biology and Medicine, vol. 122, no. 103861, pp. 1–8, 2020. [Google Scholar]
9. L. Tapak, N. Shirmohammadi-Khorram, P. Amini, B. Alafchi, O. Hamidi et al., “Prediction of survival and metastasis in breast cancer patients using machine learning classifiers,” Clinical Epidemiology and Global Health, vol. 7, no. 3, pp. 293–299, 2019. [Google Scholar]
10. B. B. Ehteshami, M. Balkenhol, G. Litjens, R. Holland, P. Bult et al., “Automated detection of DCIS in whole-slide H&E stained breast histopathology images,” IEEE Transactions on Medical Imaging, vol. 35, no. 9, pp. 2141–2150, 2016. [Google Scholar]
11. R. Nateghi, H. Danyali and M. S. Helfroush, “Maximized inter-class weighted mean for fast and accurate mitosis cells detection in breast cancer histopathology images,” Journal of Medical Systems, vol. 41, no. 9, pp. 1–15, 2017. [Google Scholar]
12. F. A. Spanhol, L. S. Oliveira, C. Petitjean and L. Heutte, “A dataset for breast cancer histopathological image classification,” IEEE Transactions on Biomedical Engineering, vol. 63, no. 7, pp. 1455–1462, 2016. [Google Scholar]
13. T. H. Vu, H. S. Mousavi, V. Monga, G. Rao and U. K. A. Rao, “Histopathological image classification using discriminative feature-oriented dictionary learning,” IEEE Transactions on Medical Imaging, vol. 35, no. 3, pp. 738–751, 2016. [Google Scholar]
14. K. -H. Yu, C. Zhang, G. J. Berry, R. B. Altman, C. Ré et al., “Predicting non-small cell lung cancer prognosis by fully automated microscopic pathology image features,” Nature Communications, vol. 7, no. 1, pp. 12474–12483, 2016. [Google Scholar]
15. Y. Zhang, B. Zhang, F. Coenen, J. Xiao and W. Lu, “One-class kernel subspace ensemble for medical image classification,” EURASIP Journal on Advances in Signal Processing, vol. 2014, no. 1, pp. 1–13, 2014. [Google Scholar]
16. K. He, X. Zhang, S. Ren and J. Sun, “Deep residual learning for image recognition,” in Proc. 2016 IEEE Conf. on Computer Vision and Pattern Recognition (CVPR), Las Vegas, NV, USA, pp. 770–778, 2016. [Google Scholar]
17. A. Krizhevsky, I. Sutskever and G. E. Hinton, “ImageNet classification with deep convolutional neural networks,” Communications of the ACM, vol. 60, no. 6, pp. 84–90, 2017. [Google Scholar]
18. O. Ronneberger, P. Fischer and T. Brox, “U-Net: Convolutional networks for biomedical image segmentation,” in Proc. Medical Image Computing and Computer-Assisted Intervention–MICCAI 2015, Munich, Germany, pp. 234–241, 2015. [Google Scholar]
19. G. Aresta, T. Araújo, S. Kwok, S. S. Chennamsetty, M. Safwan et al., “BACH: Grand challenge on breast cancer histology images,” Medical Image Analysis, vol. 56, no. 1, pp. 122–139, 2019. [Google Scholar]
20. N. Brancati, M. Frucci and D. Riccio, “Multi-classification of breast cancer histology images by using a fine-tuning strategy,” in Proc. Int. Conf. Image Analysis and Recognition, Póvoa de Varzim, Portugal, pp. 771–778, 2018. [Google Scholar]
21. Y. Liu, K. Gadepalli, M. Norouzi, G. E. Dahl, T. Kohlberger et al., “Detecting cancer metastases on gigapixel pathology images,” 2017. [Online]. Available: arXiv preprint arXiv:1703.02442. [Google Scholar]
22. M. Veta, P. J. van Diest, S. M. Willems, H. Wang, A. Madabhushi et al., “Assessment of algorithms for mitosis detection in breast cancer histopathology images,” Medical Image Analysis, vol. 20, no. 1, pp. 237–248, 2015. [Google Scholar]
23. D. Wang, A. Khosla, R. Gargeya, H. Irshad and A. H. Beck, “Deep learning for identifying metastatic breast cancer,” 2016. [Online]. Available: arXiv preprint arXiv:1606.05718. [Google Scholar]
24. H. Chen, Q. Dou, X. Wang, J. Qin and P. A. Heng, “Mitosis detection in breast cancer histology images via deep cascaded networks,” in Proc. Thirtieth AAAI Conf. on Artificial Intelligence, Phoenix, Arizona, USA, pp. 1160–1166, 2016. [Google Scholar]
25. A. Janowczyk and A. Madabhushi, “Deep learning for digital pathology image analysis: A comprehensive tutorial with selected use cases,” Journal of Pathology Informatics, vol. 7, no. 1, pp. 1–29, 2016. [Google Scholar]
26. D. Bardou, K. Zhang and S. M. Ahmad, “Classification of breast cancer based on histology images using convolutional neural networks,” IEEE Access, vol. 6, no. 1, pp. 24680–24693, 2018. [Google Scholar]
27. N. Bayramoglu, J. Kannala and J. Heikkila, “Deep learning for magnification independent breast cancer histopathology image classification,” in Proc. 2016 23rd Int. Conf. on Pattern Recognition (ICPR), Cancun, Mexico, pp. 2440–2445, 2016. [Google Scholar]
28. N. Brancati, G. De Pietro, M. Frucci and D. Riccio, “A deep learning approach for breast invasive ductal carcinoma detection and lymphoma multi-classification in histological images,” IEEE Access, vol. 7, no. 1, pp. 44709–44720, 2019. [Google Scholar]
29. H. Alghodhaifi, A. Alghodhaifi and M. Alghodhaifi, “Predicting invasive ductal carcinoma in breast histology images using convolutional neural network,” in Proc. 2019 IEEE National Aerospace and Electronics Conf. (NAECON), Dayton, OH, USA, pp. 374–378, 2019. [Google Scholar]
30. H. Chapala and B. Sujatha, “ResNet: Detection of invasive ductal carcinoma in breast histopathology images using deep learning,” in Proc. 2020 Int. Conf. on Electronics and Sustainable Communication Systems (ICESC), Coimbatore, India, pp. 60–67, 2020. [Google Scholar]
31. N. F. Abubacker, I. A. T. Hashem and L. K. Hui, “Mammographic classification using stacked ensemble learning with bagging and boosting techniques,” Journal of Medical and Biological Engineering, vol. 40, no. 6, pp. 908–916, 2020. [Google Scholar]
32. A. Martinez-Uso, P. Latorre-Carmona, J. M. Sotoca, F. Pla and B. Javidi, “Depth estimation in integral imaging based on a maximum voting strategy,” Journal of Display Technology, vol. 12, no. 12, pp. 1715–1723, 2016. [Google Scholar]
33. M. Szkulmowski and M. Wojtkowski, “Averaging techniques for OCT imaging,” Optics Express, vol. 21, no. 8, pp. 9757–9773, 2013. [Google Scholar]
34. A. G. Usman, S. Işik and S. I. Abba, “A novel multi-model data-driven ensemble technique for the prediction of retention factor in HPLC method development,” Chromatographia, vol. 83, no. 8, pp. 933–945, 2020. [Google Scholar]
35. R. Krithiga and P. Geetha, “Breast cancer detection, segmentation and classification on histopathology images analysis: A systematic review,” Archives of Computational Methods in Engineering, vol. 28, no. 4, pp. 2607–2619, 2021. [Google Scholar]
36. S. Pramanik, D. Bhattacharjee and M. Nasipuri, “Texture analysis of breast thermogram for differentiation of malignant and benign breast,” in Proc. 2016 Int. Conf. on Advances in Computing, Communications and Informatics (ICACCI), Jaipur, India, pp. 8–14, 2016. [Google Scholar]
37. T. Gaber, G. Ismail, A. Anter, M. Soliman, M. Ali et al., “Thermogram breast cancer prediction approach based on neutrosophic sets and fuzzy c-means algorithm,” in Proc. 2015 37th Annual Int. Conf. of the IEEE Engineering in Medicine and Biology Society (EMBC), Milan, Italy, pp. 4254–4257, 2015. [Google Scholar]
38. L. Shen, L. R. Margolies, J. H. Rothstein, E. Fluder, R. McBride et al., “Deep learning to improve breast cancer detection on screening mammography,” Scientific Reports, vol. 9, no. 1, pp. 12495–12506, 2019. [Google Scholar]
39. A. R. Vaka, B. Soni and S. Reddy, “Breast cancer detection by leveraging Machine Learning,” ICT Express, vol. 6, no. 4, pp. 320–324, 2020. [Google Scholar]
40. F. AlFayez, M. W. A. El-Soud and T. Gaber, “Thermogram breast cancer detection: A comparative study of two machine learning techniques,” Applied Sciences (Basel), vol. 10, no. 2, pp. 551–570, 2020. [Google Scholar]
41. S. Mojrian, G. Pinter, J. H. Joloudari, I. Felde, A. S. Gali et al., “Hybrid machine learning model of extreme learning machine radial basis function for breast cancer detection and diagnosis; A multilayer fuzzy expert system,” in Proc. 2020 RIVF Int. Conf. on Computing and Communication Technologies (RIVF), Ho Chi Minh City, Vietnam, pp. 1–7, 2020. [Google Scholar]
 | This work is licensed under a Creative Commons Attribution 4.0 International License, which permits unrestricted use, distribution, and reproduction in any medium, provided the original work is properly cited. |