DOI:10.32604/iasc.2022.024777
| Intelligent Automation & Soft Computing DOI:10.32604/iasc.2022.024777 | |
| Article |
AI Powered Asthma Prediction Towards Treatment Formulation: An Android App Approach
1Faculty of Computing, Universiti Malaysia Pahang, 26600, Pekan, Pahang, Malaysia
2Department of Information and Communication Engineering, Noakhali Science and Technology University (NSTU), Noakhali, Bangladesh
3Department of Information and Communication Technology, Comilla University (CoU), Comilla, Bangladesh
4Computer Science and Engineering Discipline, Khulna University, Khulna, 9208, Bangladesh
5Department of Computer Science, College of Computers and Information Technology, Taif University, Taif, 21944, Saudi Arabia
6Department of Computer Science, Stevens Institute of Technology, Hoboken, NJ 07030, USA
*Corresponding Author: Anupam Kumar Bairagi. Email: anupam@ku.ac.bd
Received: 30 October 2021; Accepted: 17 December 2021
Abstract: Asthma is a disease which attacks the lungs and that affects people of all ages. Asthma prediction is crucial since many individuals already have asthma and increasing asthma patients is continuous. Machine learning (ML) has been demonstrated to help individuals make judgments and predictions based on vast amounts of data. Because Android applications are widely available, it will be highly beneficial to individuals if they can receive therapy through a simple app. In this study, the machine learning approach is utilized to determine whether or not a person is affected by asthma. Besides, an android application is being created to give therapy based on machine learning predictions. To collect data, we enlisted the help of 4,500 people. We collect information on 23 asthma-related characteristics. We utilized eight robust machine learning algorithms to analyze this dataset. We found that the Decision tree classifier had the best performance, out of the eight algorithms, with an accuracy of 87%. TensorFlow is utilized to integrate machine learning with an Android application. We accomplished asthma therapy using an Android application developed in Java and running on the Android Studio platform.
Keywords: Artificial intelligence; asthma prediction; machine learning; android application
Asthma is a lung condition that affects children and adults alike. The air passages in the lungs constrict due to inflammation and stiffness of the muscles around the small airways. In 2019, asthma afflicted an estimated 262 million individuals, resulting in 461000 deaths [1]. The most prevalent chronic illness among children is asthma. Although it affects people of all ages, asthma is more common in children and is the most common cause of chronic airway disease. As patients become older, it becomes increasingly challenging to identify [2] adult-onset asthma from other conditions such as chronic obstructive pulmonary disease (COPD) or Asthma-COPD overlap syndrome (ACOS), leading to frequent misdiagnosis or underdiagnosed [3]. Furthermore, asthma imposes a high cost on the social, economic, and health-care systems of many countries. Inhaled medication can help individuals with asthma control their symptoms and live every day, active life. Eliminating asthma triggers may also help to reduce asthma symptoms. Due to fast population expansion, automatic disease identification has become a critical topic in medical science. Coronavirus (COVID-19) has spread extensively and has become one of the most severe and acute infections in recent years. This paper [4] describes a deep learning strategy for diagnosing COVID-19 from X-ray pictures that combines a convolutional neural network (CNN) and a long short-term memory (LSTM). In [5], the author gave an overview of newly created systems based on deep learning techniques that used several medical imaging modalities such as CT and X-ray.
In recent years, a slew of Asthma prediction techniques has been developed and published. Tong et al. [6] developed an automated technique for producing explanations for rules for the predictions of any machine learning model based on imbalanced tabular data and for proposing tailored actions without com-promising prediction precision. Our technology has worked fine to explain our Intermountain Healthcare model forecasts [7]. However, the technique has a drawback in that it is not used in reality. The disadvantage of this paradigm is that it is only implemented for children, but our model is for individuals of all ages. In [8], the author has created prediction algorithms to assess the health data for children with Asthma. These prediction models are developed using machine learning classifiers, including linear regression, decision trees, the Random Forest, KNN [9] and methods of the Naive Bayes [10,11]. They got a good accuracy [12] for random forest classifiers and it’s around 91%. Bhat et al. [13] describe a method based on machine learning for Asthma risk prediction (ML) [14]. The author created a model for prediction but did not provide any treatment for the patient, which is something we did in our model. The complete technology is used via Internet-of-Things resources on a mobile-health (m-health) phone (IoT). This investigation shows a connection between the indoor and outdoor particulate matter (PM) and the PEFR. The mining of data comprising patients’ past health information has utilized an efficient technique for Asthma illness prediction [15]. These studies utilize five methods of categorization for machines called Naive Bayes, J48, Random Forest and Random Tree. The authors of [16] have created a breast cancer prediction model that employs 10-fold cross validation to achieve a reliable result. Wisconsin breast cancer diagnosis data collection is collected from the UCI machine learning repository for breast cancer. Another prediction model for breast cancer is also being developed in [17]. In [18], a new mathematical model for breast cancer was created. The difference between those three papers and our research is that they focused on breast cancer while we focused on asthma. In [19], the authors propose an approach for employing a deep neural network to diagnose diabetes by training its features in a five-fold and ten-fold cross validation fashion. They only utilised one model in this study, but we used eight in ours. Using Random Forests (RFs) and Artificial Neural Networks, this research [20] proposes an expert system for the classification of liver disorders (ANNs). The approaches employ 10-fold cross validation to train the input features, while we used 23. Among all of these disorders, heart disease is the most frequent, and its effects are far more deadly than those of any other disease. The author of this paper [21] compared a lot of computational intelligence algorithms for coronary artery heart disease prediction, but they don’t provide any practical applications like Android apps.
In [22] the 2012–2014 real-world Asthmatic patients were trained in a big town in China on prediction models including logistic regression, random forest, supporting vector machines, regression classification tree and backpropagation neural network [23]. The goal of the author was to create models that used machine learning to forecast the probability of exacerbations. The goal of the author [24] was to create models that used machine learning to forecast the probability of exacerbations. AUPRC = 0.007 (95% CI: 0.0002) was provided for the model validated on the test data, suggesting that it may be unable to estimate an incident of Asthma exacerbation for the near future by historical clinical data only.
Machine learning is often recognized as the most effective method for predicting illnesses such as heart disease and asthma. For asthma illness prediction, we employ 23 characteristics. Compared to previous approaches in works like [15] the findings demonstrate a higher degree of performance. We utilize eight machine learning algorithms, and the decision tree achieved the highest accuracy (87% precision). Aside from that, the number of Android users is growing by the day. To carry out the therapy, we use the Java programming language to develop an Android application in which we recommended necessary lab tests and medications for Asthma patients. In recent years, inhaler therapy has been a popular therapeutic option in the medical sector. Followings are the concrete contents of contributions in this paper:
1. Using machine learning techniques, improve the accuracy of asthma illness forecasts. We used 23 asthma risk factor characteristics and consulted with a renowned asthma doctor to complete this assignment. All of the characteristics are significantly linked to asthma. We discovered that the Decision Tree algorithm has the highest accuracy, which is 87 percent.
2. Provide proper treatment for asthma patients. After we’ve trained all of the asthma characteristics, our model will tell us whether or not this person has asthma. If the model finds a positive output, it indicates he or she has asthma, and the model will provide treatment; otherwise, the model will notify that he or she is asthma-free.
3. Developed an Android app for identifying asthma patients and administering medication. For asthma patients, this application contains 23 fields that are utilized to identify the patient. After entering all of his information, the app will notify him/her if he/she has asthma or not. This application also makes appropriate recommendations based on the output.
The remainder of the article is arranged as follows, with Section 2 delving into the methodology. We went through all of the pre-processing, ML algorithms, and Java applications. Section 3 goes through the results and discussions. We have demonstrated all of the expected results and the development of the Android application in this section. Section 4 describes the work that will be done in the future. A conclusion is included in Section 5.
In this work, we perform the job in two modules. The data analysis and prediction are accomplished by machine learning, whereas the treatment is performed by an android application developed in Java. We utilized Google Colab to do Asthma data pre-processing and prediction [25]. We use five key steps to obtain the forecast: data sources, label verification, data prepossessing, training data using ML algorithms, and prediction. The data quality is maintained by using a large number of samples with a wide range of variance. To get the prediction in machine learning, we have utilized eight robust ML algorithms and made a comparison between those algorithms. After that, we have utilized Android Application 9.0 to development an application, and the languages used are Java and XML. In this case, Java is used for coding, while an XML file is used for the design section. Fig. 1 describes how the machine learning models and android application in the forecast node have been implemented. During training, the selection of features is employed to remove duplicates that do not significantly contribute to the prediction result and enhance overall fidelity to the model. The imputation will initially be done to adapt the missing data, followed by the feature scaling to standardize the dataset’s value range. Finally, the binary classifiers are fitted to the data during the k-fold cross validation phase with all the samples for training, validation, and testing to provide a more robust classification [13] following that, the machine learning file is loaded into Android Studio. We generated a file using Tensorflow after receiving predictions from ML models, and this file was imported into Android Studio. Based on the ML algorithm, this smartphone app attempts to determine whether or not this person has Asthma. Finally, this application provides the appropriate therapy based on this forecast.
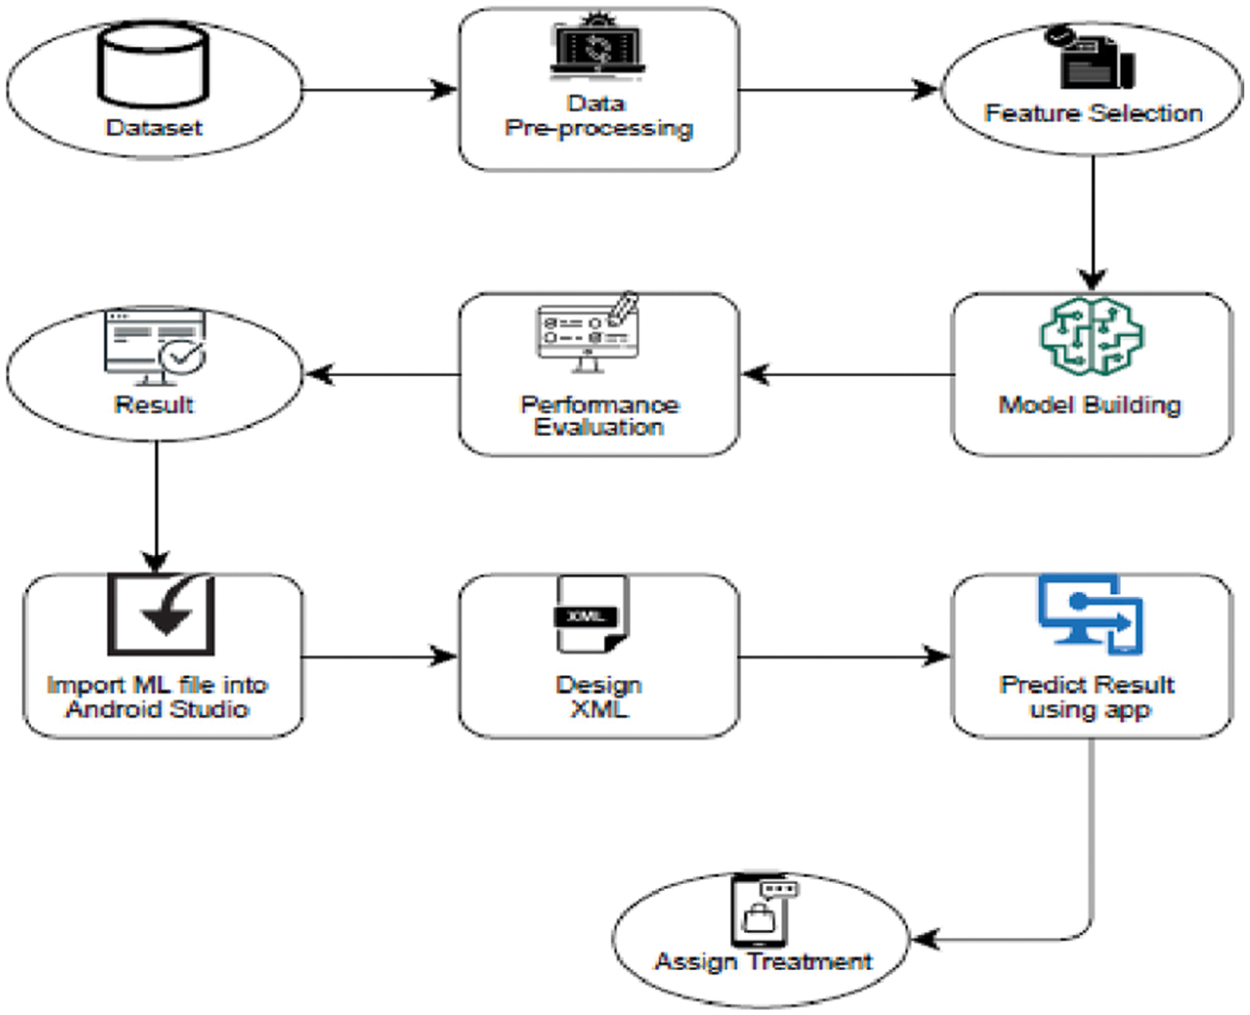
Figure 1: Experiment workflow
For each iteration m, the performance of each model built based on 22 features and ML methods employed is recorded. We have assessed our dataset using eight ML algorithms to achieve a better outcome. Sub-Section (1) covers data sources, Sub-Section (2) examines the verification of the label, Sub-Section (3) provides predisposition of information, Sub-Section (4) describes the implementation of ML algorithms, sub-Section (5) compare the performance between those implemented algorithms and finally best outcome is shown as result and this result is transfer to android studio.
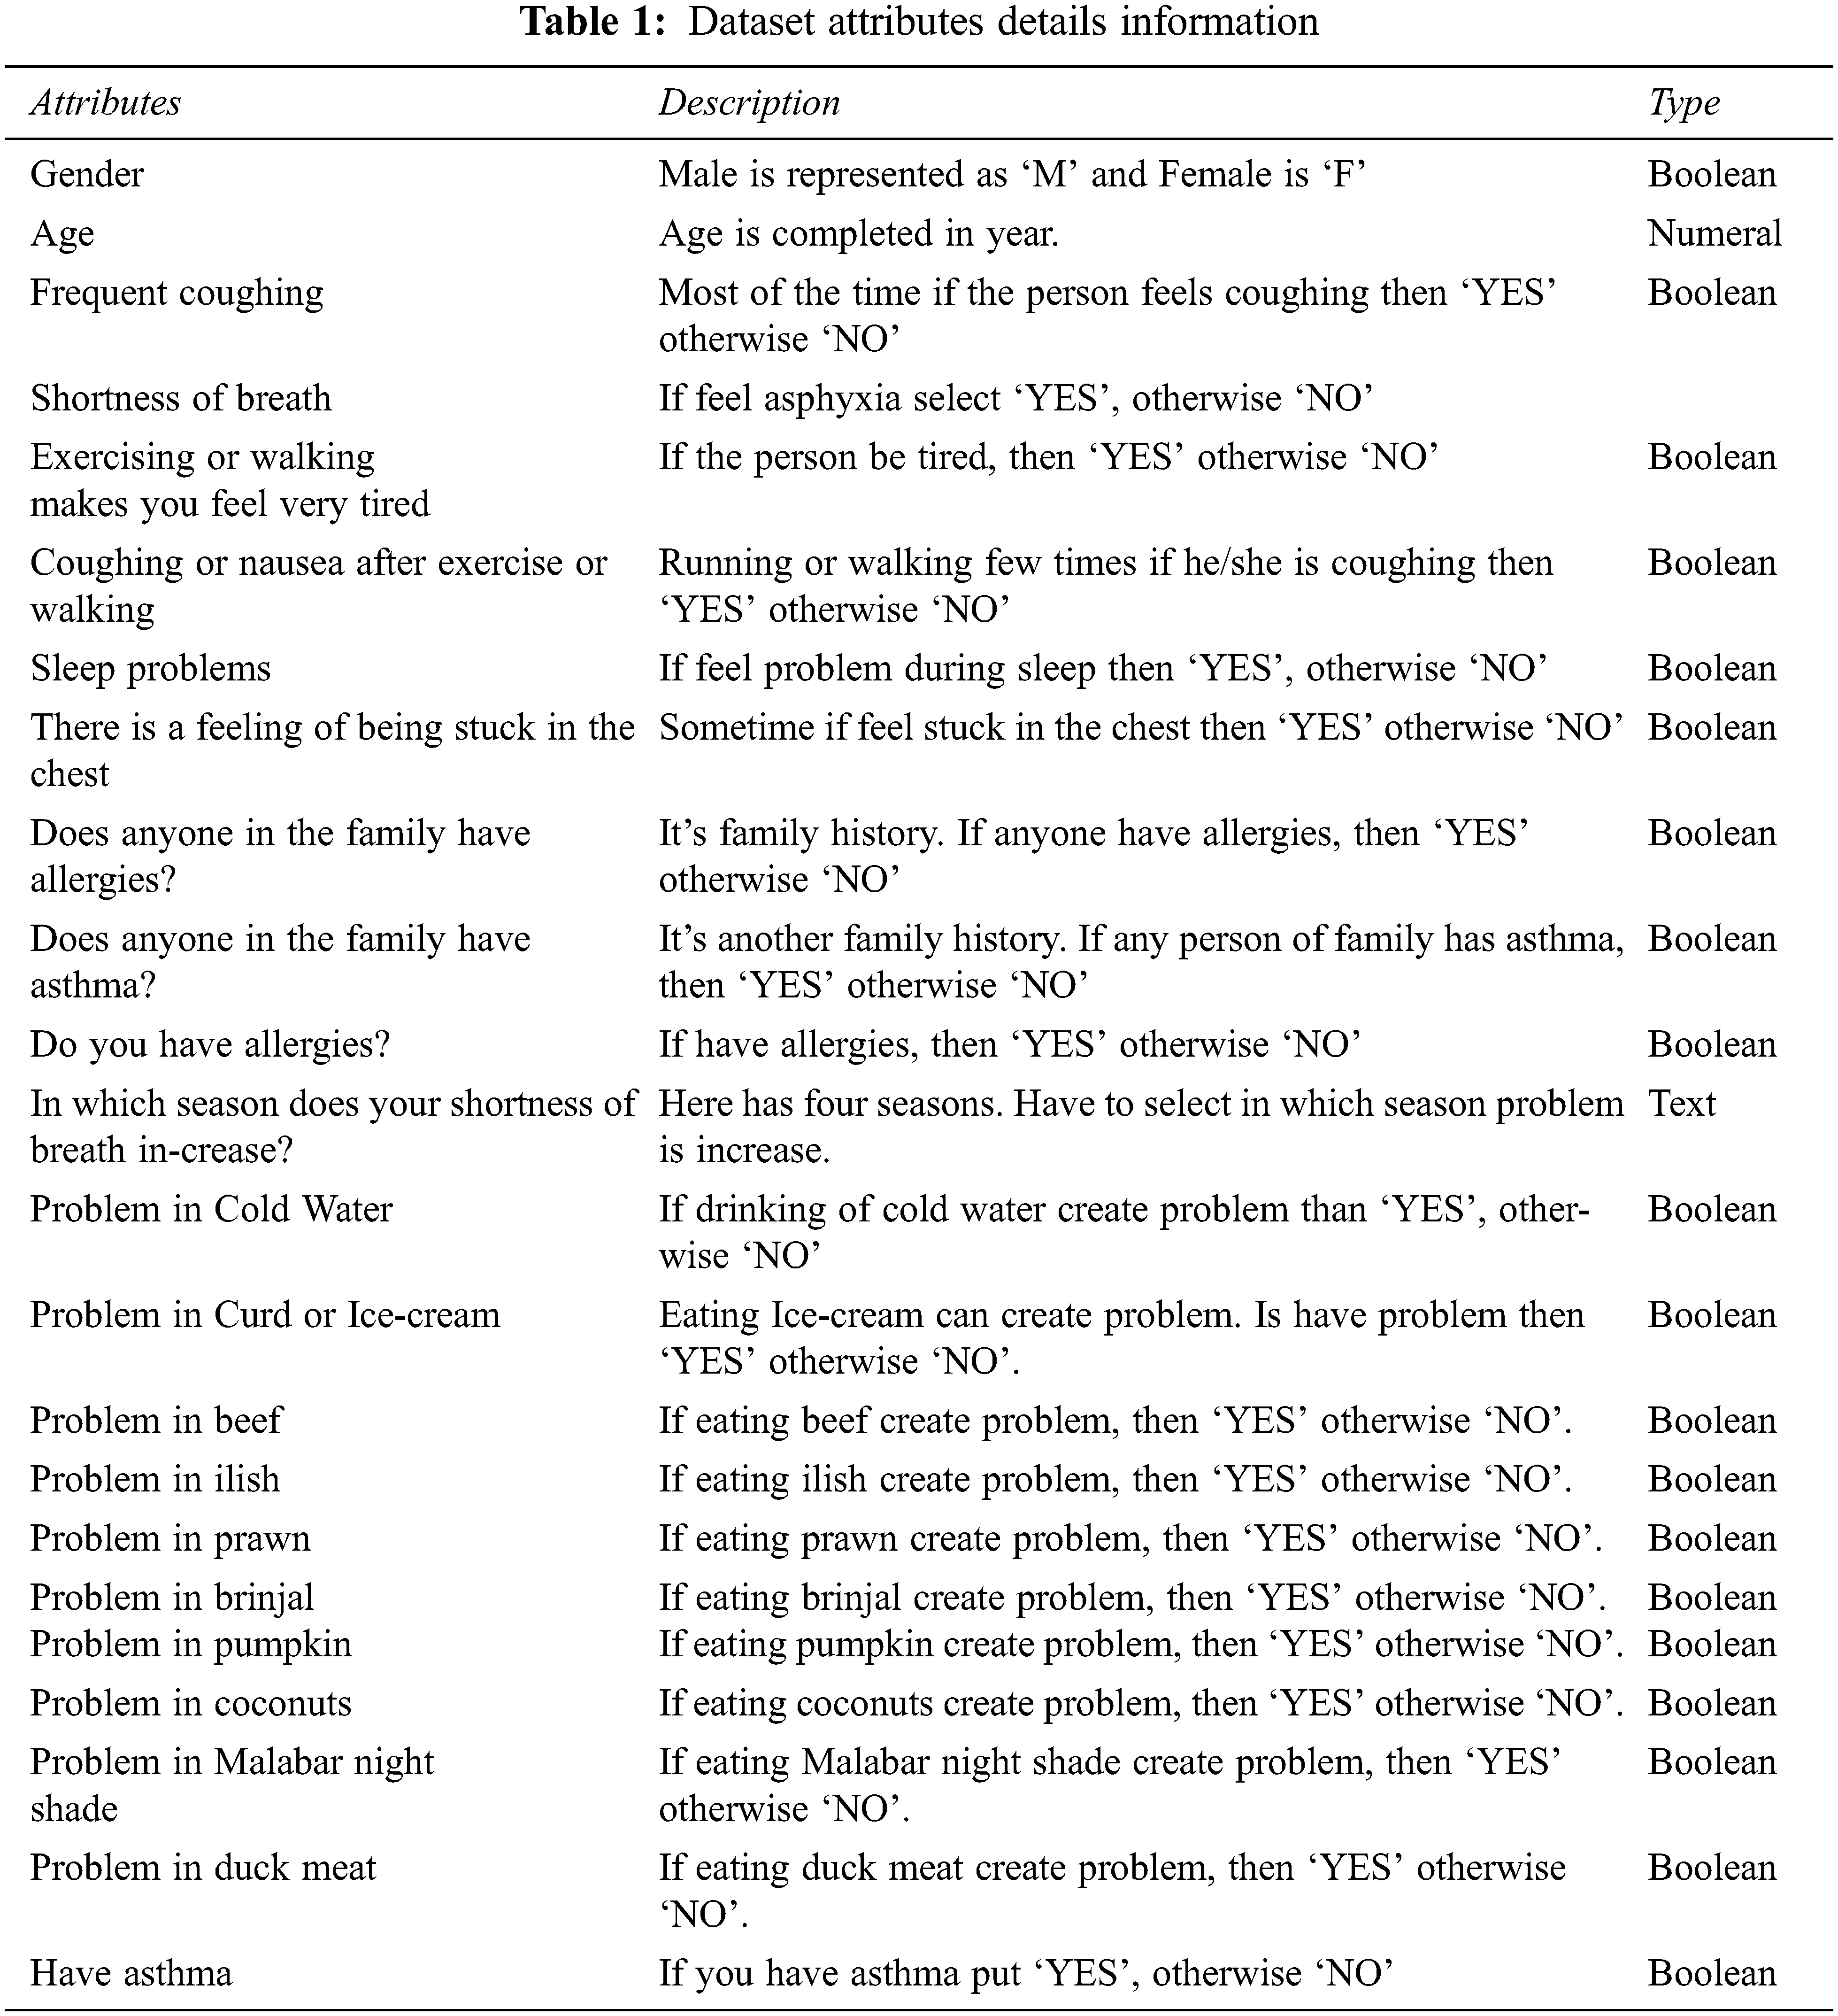
We consult with Asthma professionals before collecting data. The doctor explained to us the characteristics that cause asthma and we had taken a short note from his description. Finally, we gathered 23 features from him. We built a Google form based on those features. For data collection, we used social media and went to the doctor’s chamber. To gather data via social media, we shared this Google form with an open public group, posted it on our timeline, emailed it to our known contacts and we got a good response from there. Beside this, we spent many days physically collecting data from the doctor’s chamber to take the data from asthma patents and who has symptoms of asthma. Some prior studies only collected data from children [9], but we gathered data from people of all ages in our study. We don’t have any age restrictions. Finally, we collected around 4500 data points from social media and the visiting doctor chamber. Tab. 1 shows all the features based on which we collect the data.
Following the gathering of various records, data on asthma illness is pre-processed [13]. The collection comprises about four thousand five hundred entries, many of which have missing values. We utilized a mathematical model, mean, and median to fill in the missing value.
Mean: In mathematics and statistics, the idea of mean is crucial. The arithmetic average of all terms is the most frequent formulation for the mean of a statistical distribution containing a discrete random variable. In a group of numbers, the mean is the average or most frequent value which is expressed by the Eq. (1).
Median: Whether the number of terms in a discrete random variable distribution is even or odd affects the median. If the total number of observations (n) is odd, the median can be represented by Eq. (2).
If the number of observations is even, then the median is the average of the two middle terms and can be presented as Eq. (3).
Labeling and Verification: We collect various types of data. It is necessary to encode the dataset to use the ML model [26]. We utilized OneHotEncoding for this. We transform the whole dataset in 1 and 0 to use with the ML Algorithms. Here is a non-patient value of 1 and a patient value of 0. Tab. 2 shows some features of the patient and non-patient data gathered.
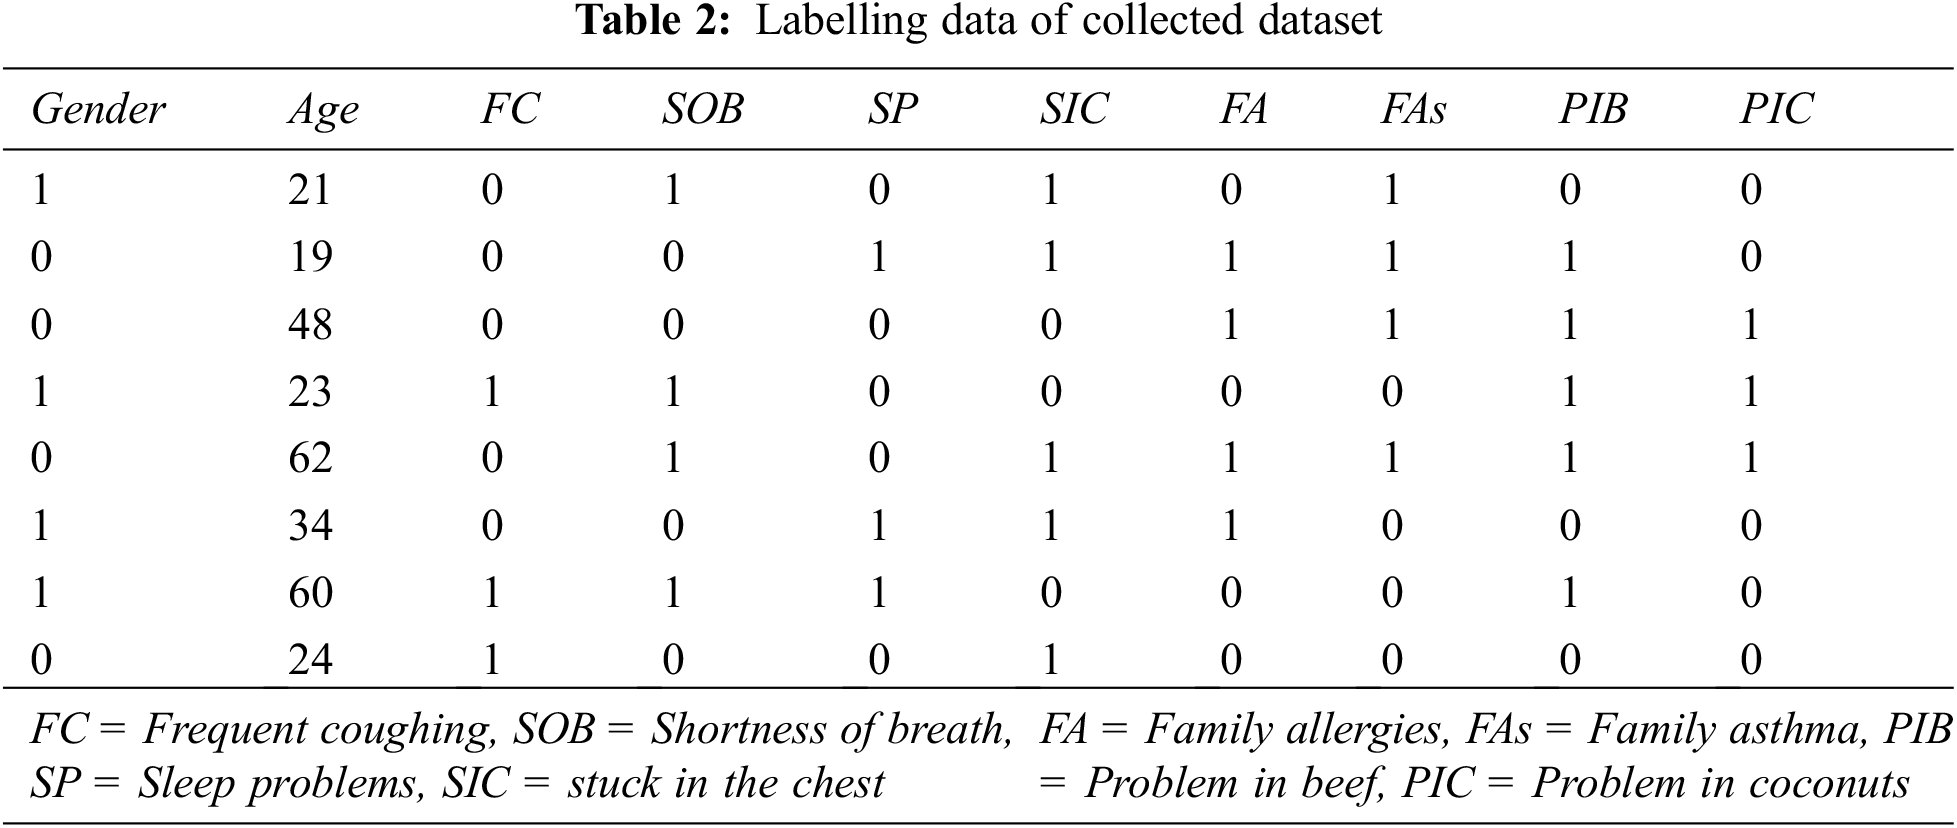
One characteristic is utilized as level data out of the 23 attributes in the data set. The patient’s information ‘Have Asthma’ is level data. The remaining 22 characteristics are significant because they provide critical information and those are feature data. We found a good correlation between input and output characteristics after pre-processing [27]. We found best, 0.49 correlation coefficient between Shortness of breath and Have Asthma. As a reason, they are highly linked. This information is necessary for diagnosing and learning about Asthma. Several (ML) methods are employed in this experiment, including KNeighborsClassifier, RandomForestClassifier, Bernoulli, MLPClassifier, Impact Learning, SVM Classifier and AdaBoostClassifier, as previously indicated. The experiment was replicated using all 23 characteristics and all of the ML methods.
We utilized eight machine learning algorithms to find the most incredible accuracy. For this dataset, each method performs admirably. Based on the lowest error rate of the algorithms, the best-performing model is identified.
Random Forest: Random Forest is a well-known supervised machine learning algorithm. We may use it for both classification and regression problems. “A Random Forest classifier is a classifier that combines several decision trees on different subsets of a dataset and averages the results to improve the dataset’s prediction accuracy.” The better the accuracy and the smaller the danger of overfitting, the more trees in the forest there are. Given a training set
The unseen samples
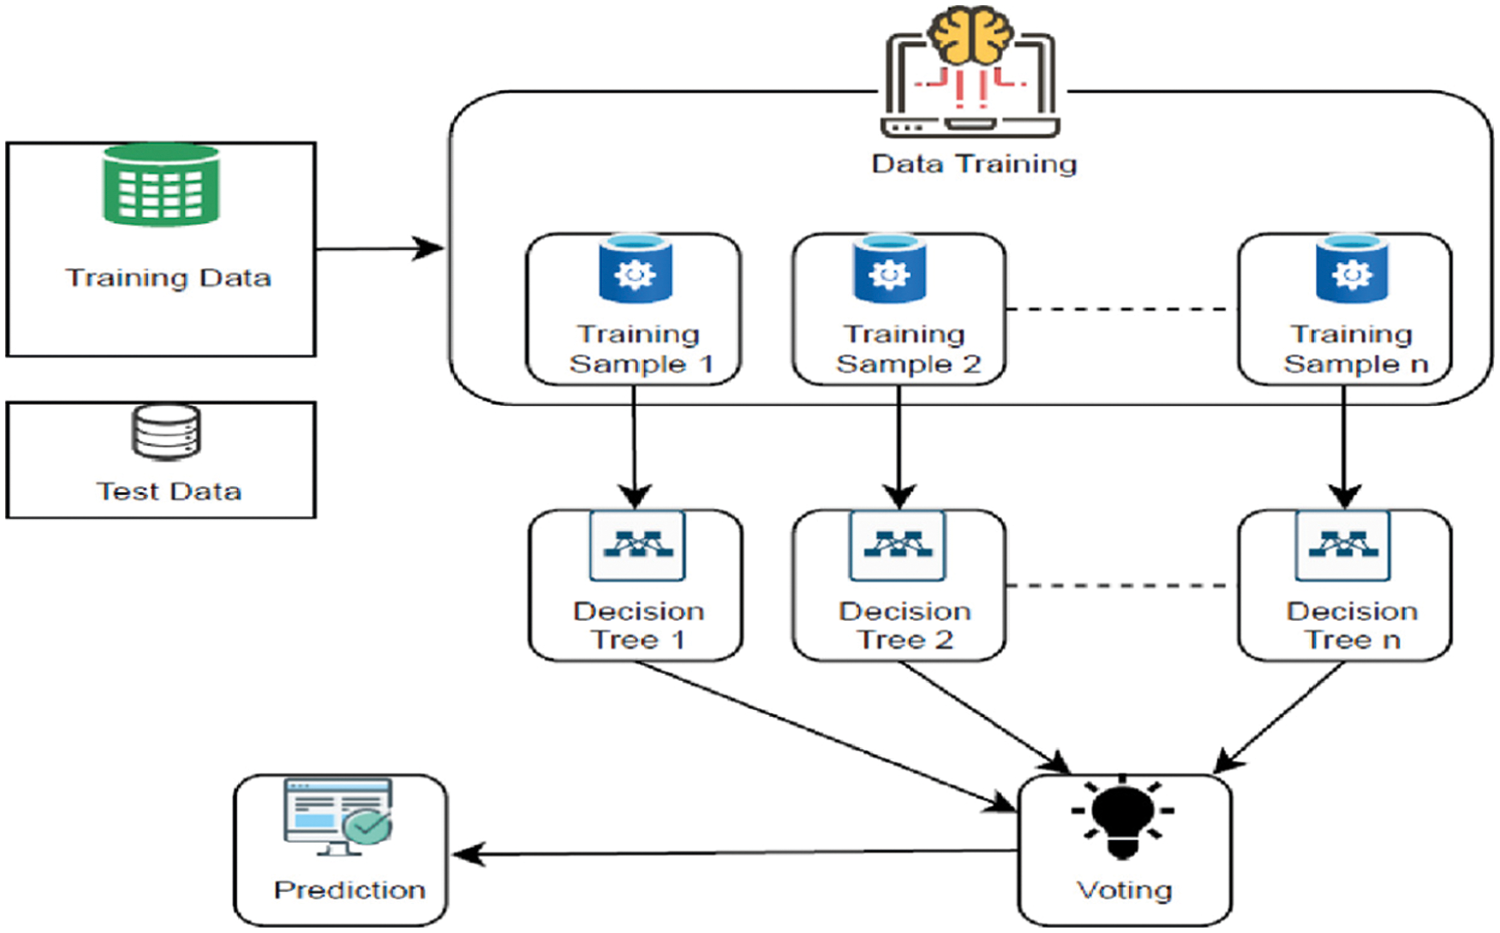
Figure 2: Diagram of random forest
K-Nearest Neighbor Classifier: The K-Nearest Neighbors method is based on the Supervised Learning approach and is one of the most basic Machine Learning algorithms. The K-NN method saves all available data and classifies a new data point based on its similarity to the existing data. This implies that fresh data may be quickly categorized into a well-defined category using the K-NN method. The KNN method calculates the shortest distance between the selected neighbors. To determine distances between existing data points and any new data point, the KNN employs the Euclidean distance equation [10]. Euclidean distance can be measured as follows:
Let’s say we have a new data point that must be placed in the appropriate category. Take a look at Fig. 3 presents the scenario very well.
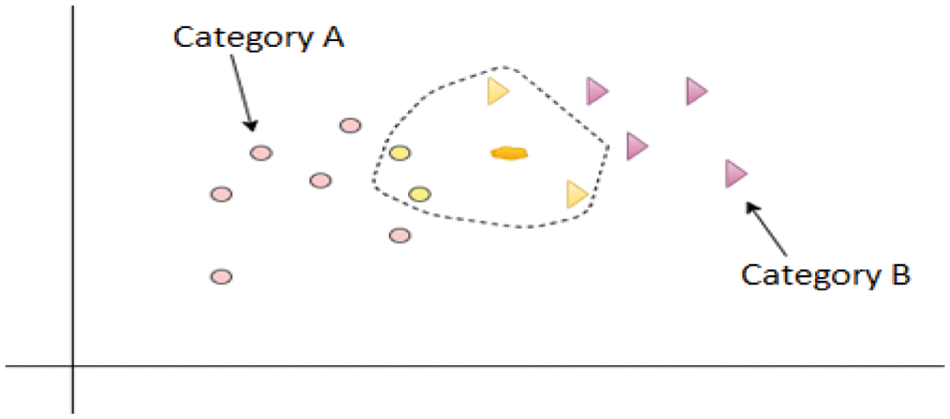
Figure 3: Diagram of KNN
Bernoulli Naive Bayes: For discrete data, Bernoulli Naive Bayes is employed, which is based on the Bernoulli distribution. Bernoulli Naive Bayes is distinguished by the fact that it only accepts binary values such as true or false, yes or no, success or failure, 0 or 1, and so on. Bernoulli Naive Bayes classification is used to classify text using the “bag of words” model. Scikit-learn module sklearn.naive bayes BernoulliNB will implement the Gaussian Nave Bayes technique. Consider ’p’ as the probability of success and q as the probability of failure, with q = 1 − p, because we’re working with binary integers [13]. With a random variable X, in the Bernoulli distribution can be represented as follows:
Here, x can only take one of two values: 0 or 1. The Bernoulli Naive Bayes Classifier has the following rule:
MLP Classifier: The term MLPClassifier stands for Multi-layer Perceptron Classifier, which is related to a Neural Network. Unlike other classification methods such as Support Vectors or Naive Bayes Classifier, MLPClassifier achieves classification using an underlying Neural Network. The perceptron is made up of a completely linked input layer and output layer. MLPs have the same input and output layers, however, as seen in Fig. 4, they can have several hidden layers between the above levels.
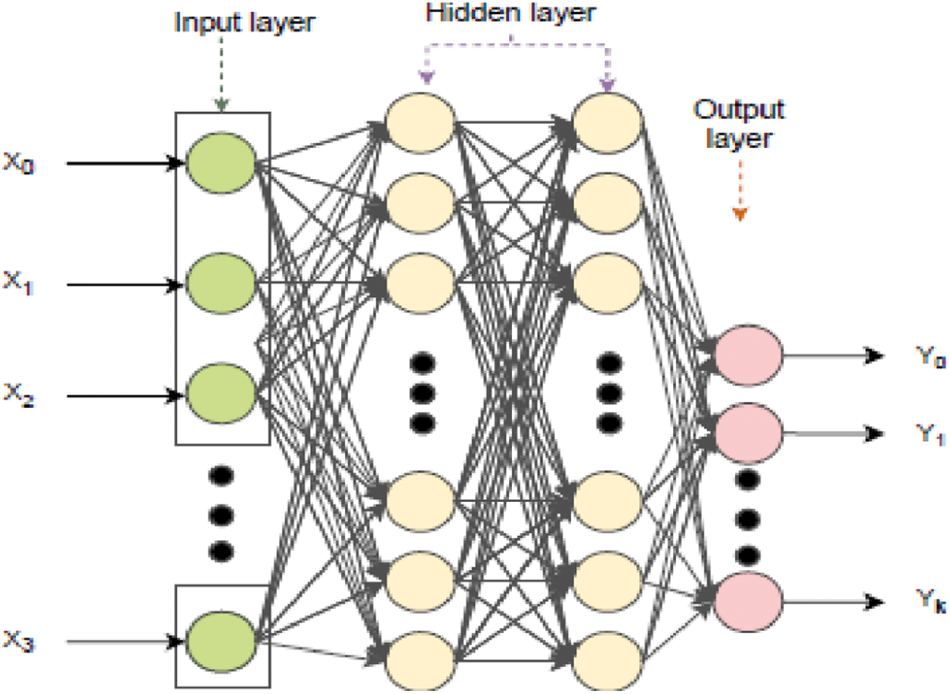
Figure 4: Network setup of MLP classifier
Adaboost Classifier Algorithm: Adaboost is a technique that is iterative. By merging numerous ma- licious classifications, the Adaboost classification creates a strong classification that allows you to obtain high precision, powerful classification. The core principle underlying Adaboost is the classifier weights and the data sample training for each iteration to guarantee that unexpected observations are predicted cor-rectly. If any machine learning method accepts weights on the training set, they may be utilized as a basic classification. In the following phases, Adaboost algorithm works:
1. Prevents collisions, considering their geometric models, between the M cooperative vehicles and
2. Prevent collisions with obstacles that are both static and moving.
3. Adaboost initially picks a random subset of training.
4. The Adaboost machine learning model is iteratively trained by picking the training set, depending on the precise prediction of last training.
5. It gives greater weight to incorrectly categorized observations, such that those observations have the high chance of categorization in the following iteration.
6. In any iteration, the weight is also assigned to the trained classifier according to the classifier accuracy. The more precise classification becomes high in weight.
7. This procedure iterate until the full training data is in place without errors or until the maximum number of estimators set has been achieved.
8. Classifying all learning algorithms, you have established by a “vote.”
Impact Learning: Impact learning is a supervised classification and linear or polynomial regression knowledge learn technique. It also helps to analyze competing data systems. This method is unusual to be able to learn the influence of independent characteristics from a contest. In other words, the impacts of the intrinsic rate of natural growth are trained (RNI) [28]. The following equation represents the RNI here:
The impact learning equation is shown below:
SVM Classifier: The “Support Vector Machine” (SVM) is a supervised machine learning method that may be applied to classification and regression problems. It is, however, mostly employed to solve categorization issues. The SVM algorithm’s objective is to find the optimal line or decision boundary for categorizing n-dimensional space into classes so that additional data points may be readily placed in the proper category in the future [29]. A hyperplane is the name for the optimum choice boundary.
Decision Tree: It’s a powerful forecasting tool that may be used in a variety of situations. Decision trees, in general, are an algorithmic approach for discovering different ways to split a data collection based on specific characteristics. It’s one of the most popular supervised learning techniques [30]. The aim is to develop a prototype that learns simple decision tree instructions and predicts the value of a target variable. It is ideal for knowledge discovery since it does not require any parameter adjustments. The Decision Node and the Leaf Node are the two nodes of a Decision tree. Leaf nodes are the result of those decisions and do not include any further branches, whereas Choice nodes are used to make any decision and have numerous branches [31].
The Platform utilized in the development of this application is 9.0, and the coding language is Java. This application’s design is finished in XML. To complete the coding and design we have used Android Studio. Fig. 5 explain the development process of this application.
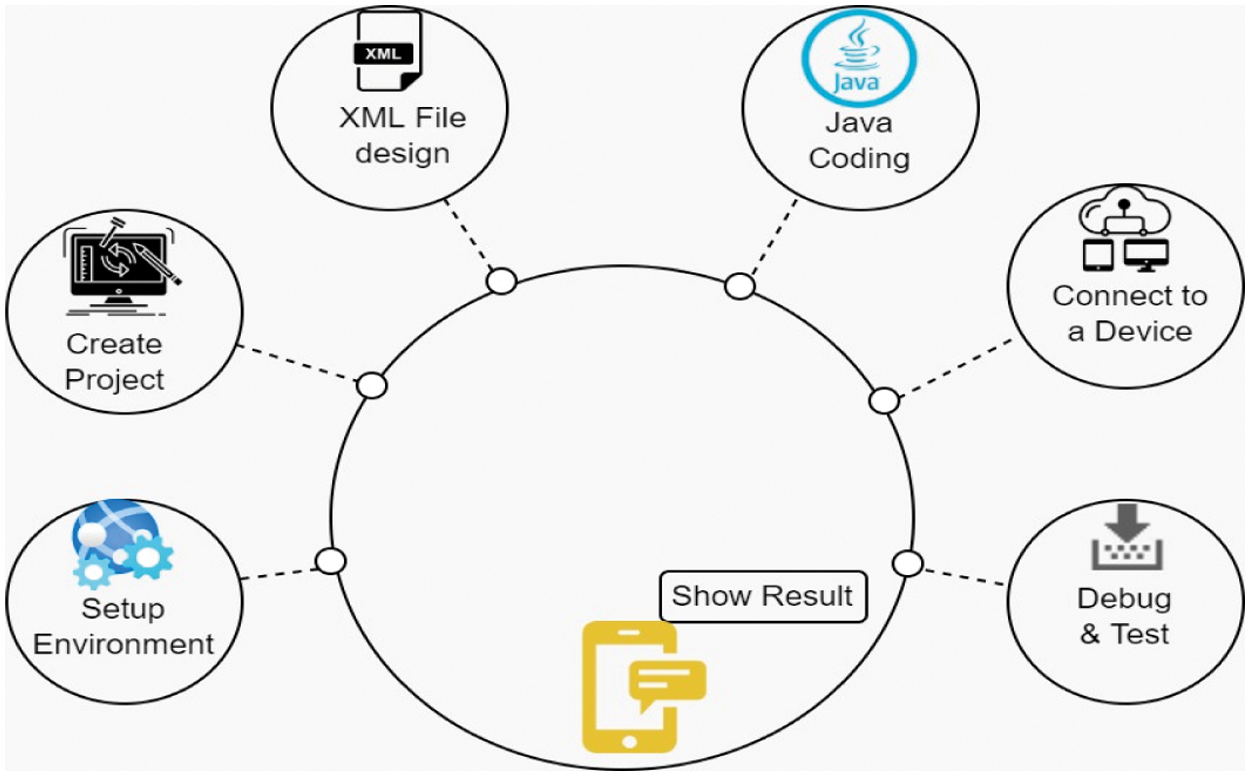
Figure 5: Android apps development steps of asthma prediction
To begin, we need to download Android Studio and install it together with the Android SDK AND ANDROID VIRTUAL DEVICE. We set the API level after installation [32]. After that, launch Android Studio and choose “Start a new Android Studio project” from the “Quick Start” menu, giving the app a name as well as the corporate domain. These parts will be combined to form a package name, such as com.companyname.appname. This is the ANDROID package file that you’ll be uploading to Google Play. Finally, we provide the location where we wish to save the file.
eXtensible Markup Language, or XML, is used to create Android layouts. XML is a markup language, similar to HTML (or Hypertext Markup Language). It was developed as a standard for data encoding in web-based applications. Unlike HTML, however, XML is case-sensitive, requires that each tag be correctly closed, and maintains white space. In Android XML, there are numerous layout options. We utilized linear layout as a result of this. We used the Radio group to generate numerous options. This radio group includes radio items. The question is written in Text view. We also utilized Edit text, which is a system that collects data from users.
Android apps are typically created with the JAVA programming language and the Android SDK (Soft- ware Development Kit). Simple, object-oriented, resilient, secure, and high-level are the core aims of JAVA. JVM (JAVA Virtual Machine) is used by JAVA applications, however Android has its own virtual machine called Dalvik Virtual Machine (DVM), which is designed for mobile devices [33]. Java is used to put what is designed in XML into action. Every coding is done in the onCreate function. Java utilized the unique ID that we assigned to each XML design to call it. We used ‘findviewbyid’ to find the ID.
First, the developer uses a USB cable to connect a device to the development workstation. On this device, open the Developer option and then allow USB debugging. The developer then clicks the application module in the project window in Android Studio and then clicks Run in the toolbar. Developer selects his own device in the Select Deployment Target box and then clicks the OK button. Android Studio runs the app and installs it on the connected device. Now the application is visible that the developer built on his own smartphone running [32].
Debugging is one of the key components of the everyday lives of a developer. Debugging enables developers to scan the apps variables, methods and how effectively the code works through every line of code. In big sections of code, it is simpler to discover tiny mistakes. To start debugging, we must first ensure that the device is configured and connected to the USB for debugging. Afterwards, the devices must be selected in the Device Choice box, and Android Studio launches this debugging program. Android Studio opens the debug tool automatically. We may enable it manually when we click Debug! at the bottom of Android Studio.
The final result is shown in the linked device if the coding and design are satisfactory. In this section, the user will get a number of fields that must be filled out in order to forecast asthma. This program will forecast asthma and deliver therapy based on data given by the user.
This section divides the several comprehensive experiments into subsections, each with its own set of results. We utilized eight machine learning algorithms to assess the dataset. Out of the 23 features gathered, 22 are considered input data and one is considered output data [34]. In sub-sections IV-A and IV-B, the findings for the ML model and the android application are described.
Extensive tests were carried out on the asthma dataset in order to find the optimal Decision Tree design for asthma prediction. To begin, the asthma illness dataset is pre-processed in Google Colab, and a 30% percentage split of the dataset is conducted as training and test sets [15]. Select the machine learning algorithms and build a classifier model for each algorithm based on the training data, then test it. On the basis of several measurements such as precision, accuracy, recall and F-measurement [35] for the particular data set, the results achieved demonstrate the performance of each classifier and best classifier. Accuracy is computed with the following Eq. (10).
Recall or sensitivity is expressed as a percentage of total relevant results classified properly by the algorithm which is express by Eq. (11).
The proportion of accurately identified occurrences or samples among those labeled as positives is measured by precision [36]. It is shown by Eq. (12).
The F1 score is calculated by taking the harmonic mean of accuracy and recall [37]. Eq. (13) represents the F1 score [38].
Here, True Positive (TP), False Positive (FP), True Negative (TN) and False Negative (FN) for the categorization of asthma illness severity, the prediction abilities of eight computational intelligence approaches were studied. The predictions of classifiers are shown in Tab. 3. For the categorization of asthma severity, the prediction abilities of eight computer intelligence approaches were investigated. A similar study was conducted in [15], in which they took eight aspects of asthma and only used four ML model for the comparison.
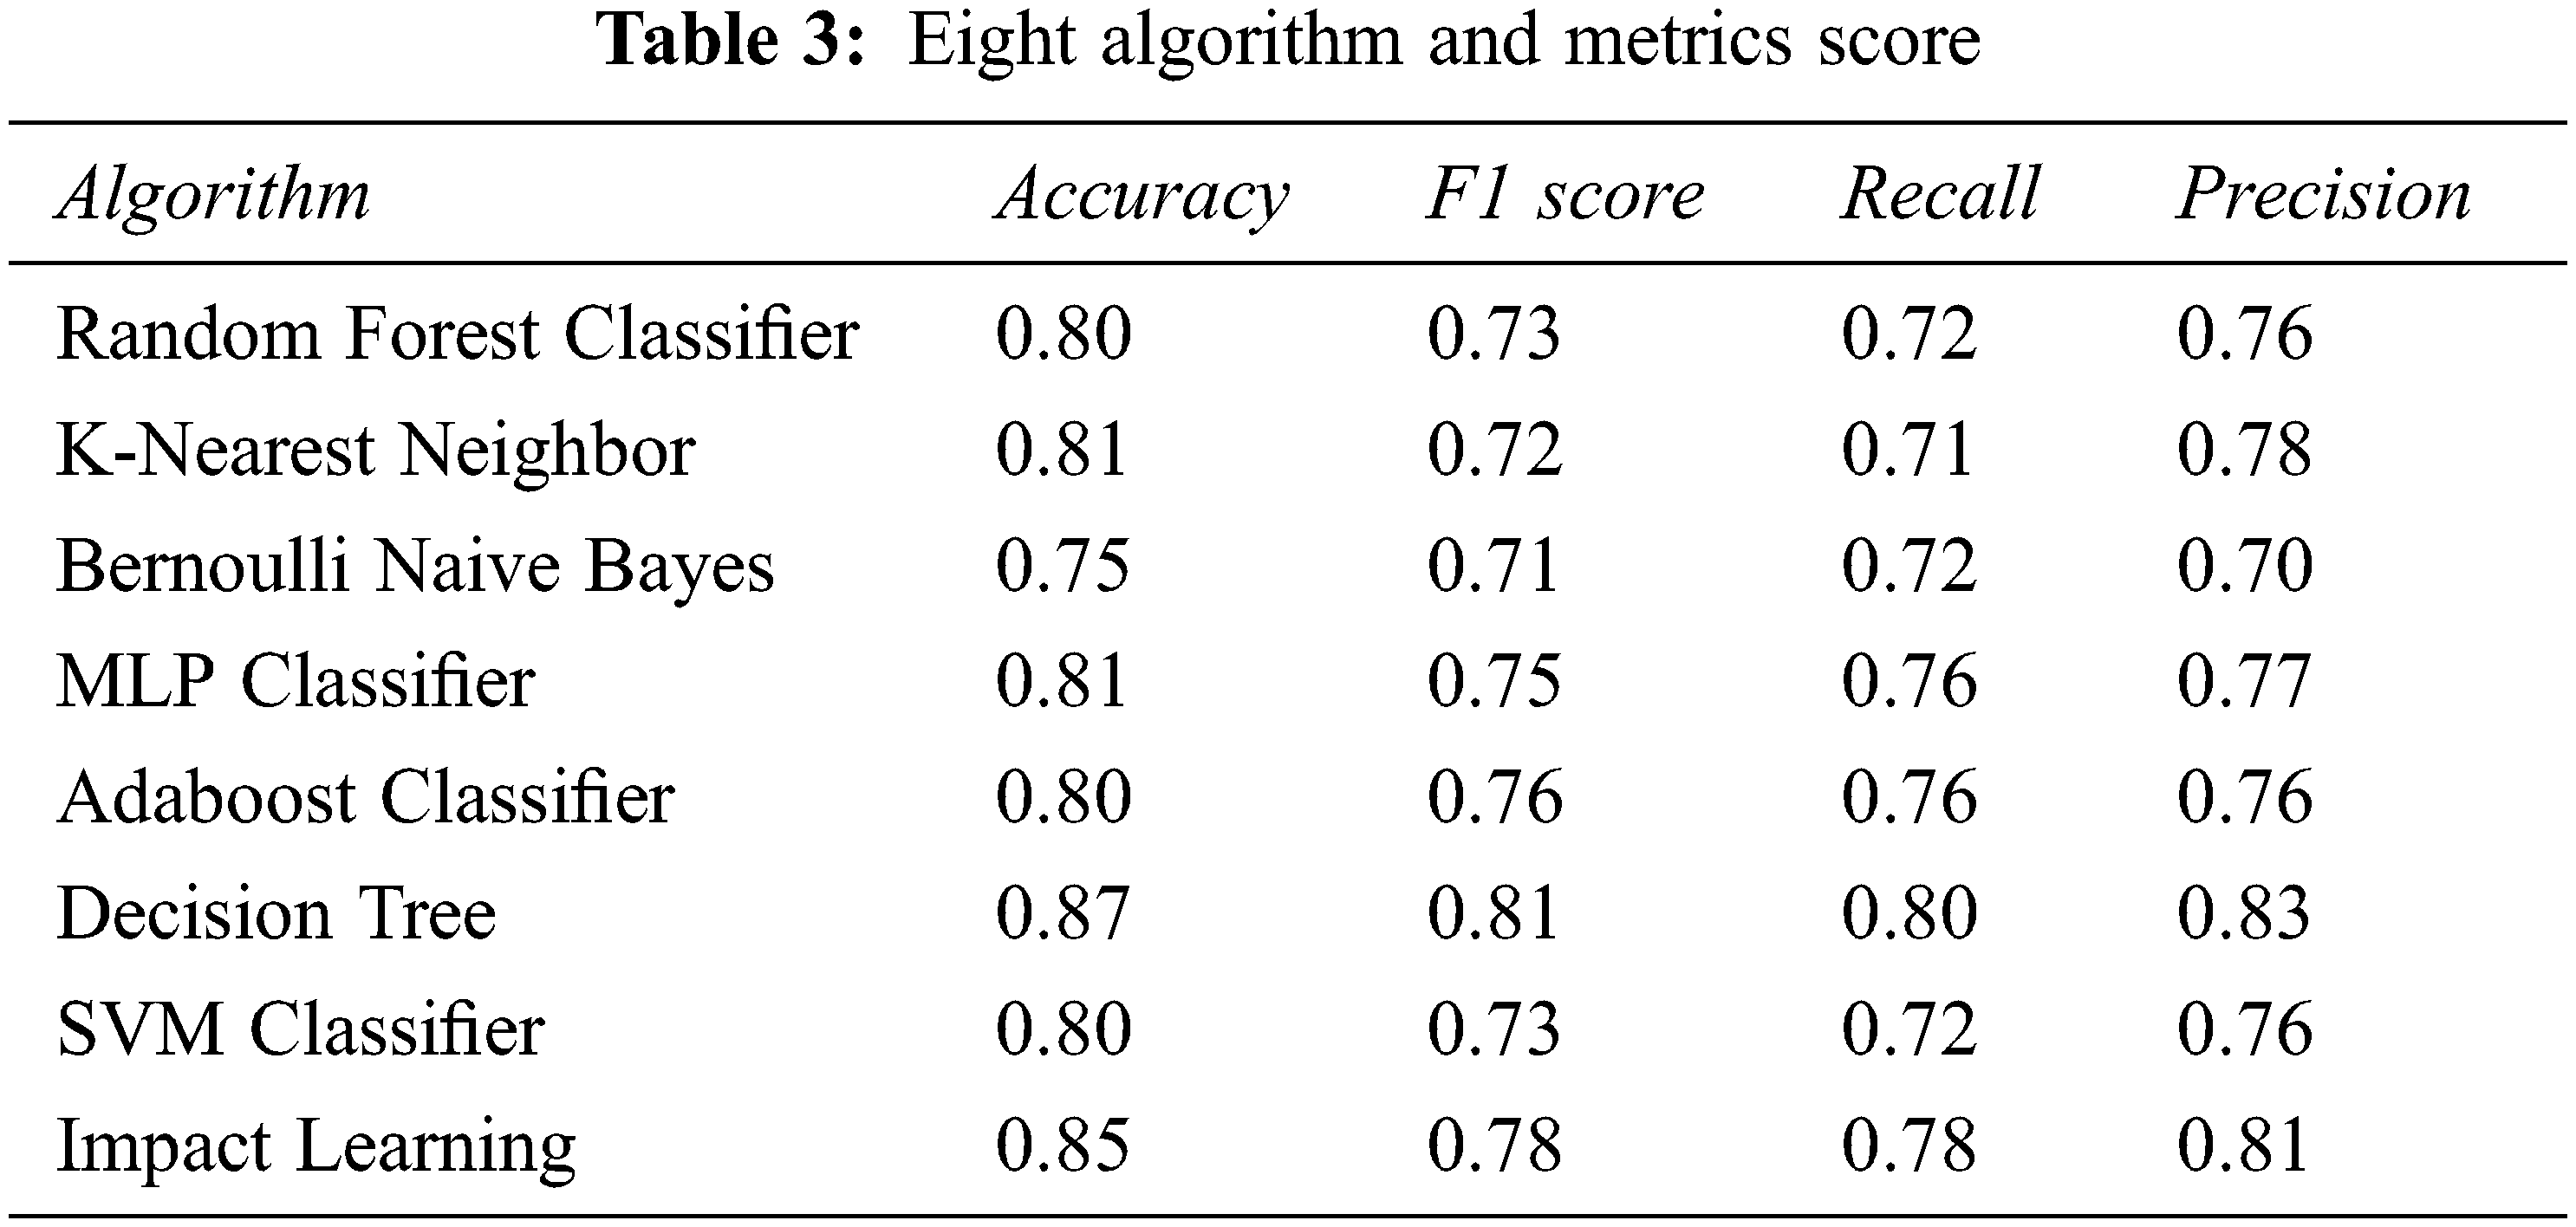
The accuracy, precision, recall, and F1 score performance measures of each algorithm were compared in Tab. 3. Using eight robust algorithms, we were able to achieve a high level of accuracy for all of these algorithms. Fig. 6 shows that the decision tree has the best accuracy, which is 87 percent. Impact learning has an accuracy of 85 percent, whereas both KNN and MLP classifiers have an accuracy of 81 percent. Random forest and Adaboost Classifier also have high accuracy, with an average of 80%. The Bernoulli nave Bayes classifier has a poor accuracy of 75%. We also have high accuracy for other confusion metrics including recall, precision, and F1 score. Decision tree has the highest F1 score and that is 83%, whereas Bernoulli Nave Bayes has the lowest. The F1 score is likewise high, with 78%, 76% and 75%.
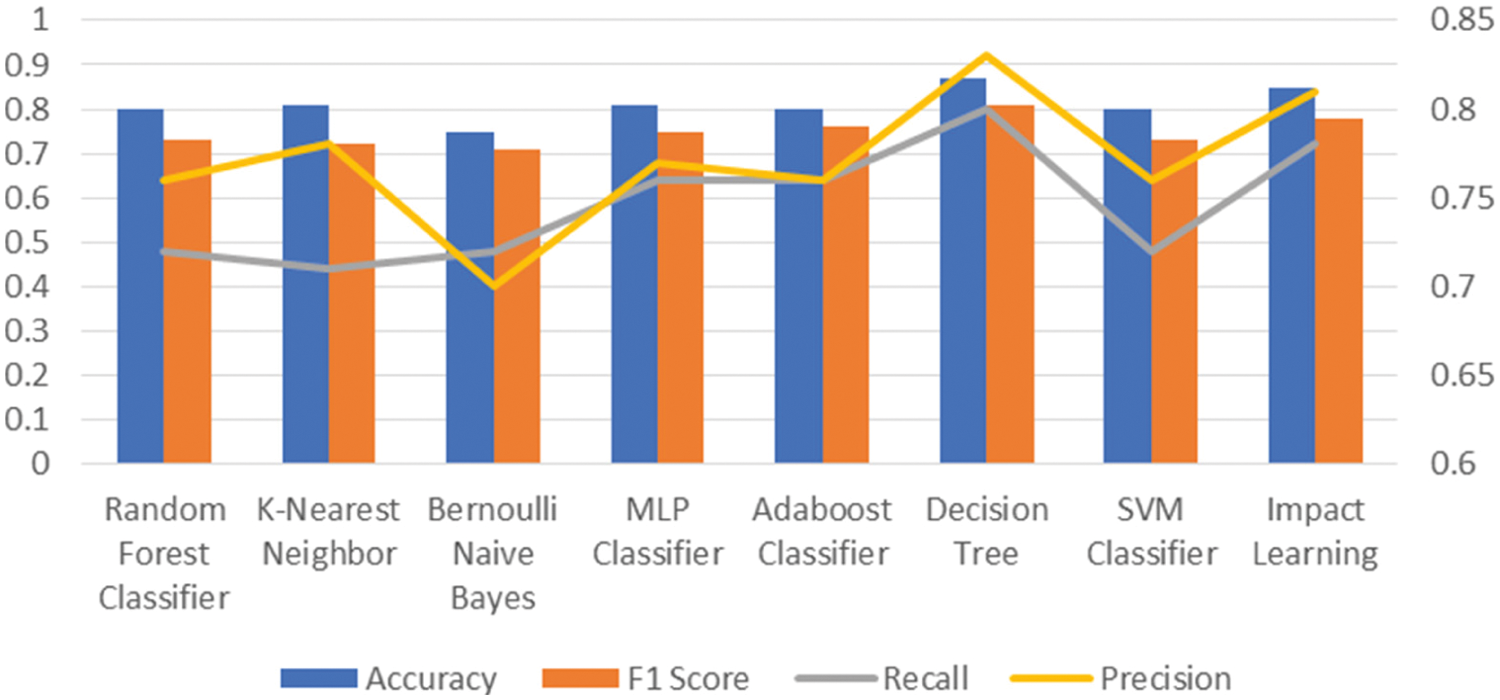
Figure 6: Comparison for Accuracy, F1 Score, Recall, and Precision between all implemented algorithms
Impact learning, Adaboost Classifier, and MLP Classifier, respectively. This score is less than 75% for the other three algorithms. For recall and accuracy, the situation is the same. The decision tree has the highest score, whereas Bernoulli Nave Bayes has the lowest. The graph is higher for Impact Learning, Adaboost Classifier, and MLP Classifier, and lower for the other three algorithms.
We divided all Asthma patients into four groups depending on their age using the data we gathered. According to Fig. 7a, the majority of the patients are between the ages of 16 and 30, and they are rather young. The figure is something around 63 percent. The research shown that the early age’s person has low ratio of asthma affection. The percentage is 7.5 percent, which is quite low. Asthma affects a large proportion of the population between the ages of 31 and 45. The statistic is 16.2 percent. The ratio is 13.8 percent for the age of 45 and 100. From the asthma data we gathered from social media and visits to the hospital, we discovered that a large percentage of asthma sufferers are men. Fig. 7b indicates that male asthma patients account for 53.3% of all cases, while female asthma patients account for 46.7%.
We offered one feature for family history during the data collecting period. This means that the persons in his family have a history of asthma. Fig. 7c shows that 65.3 percent of persons with Asthma had a family history of the disease. We discovered 34.7 percent of persons whose family never had Asthma before but are now suffering from it.
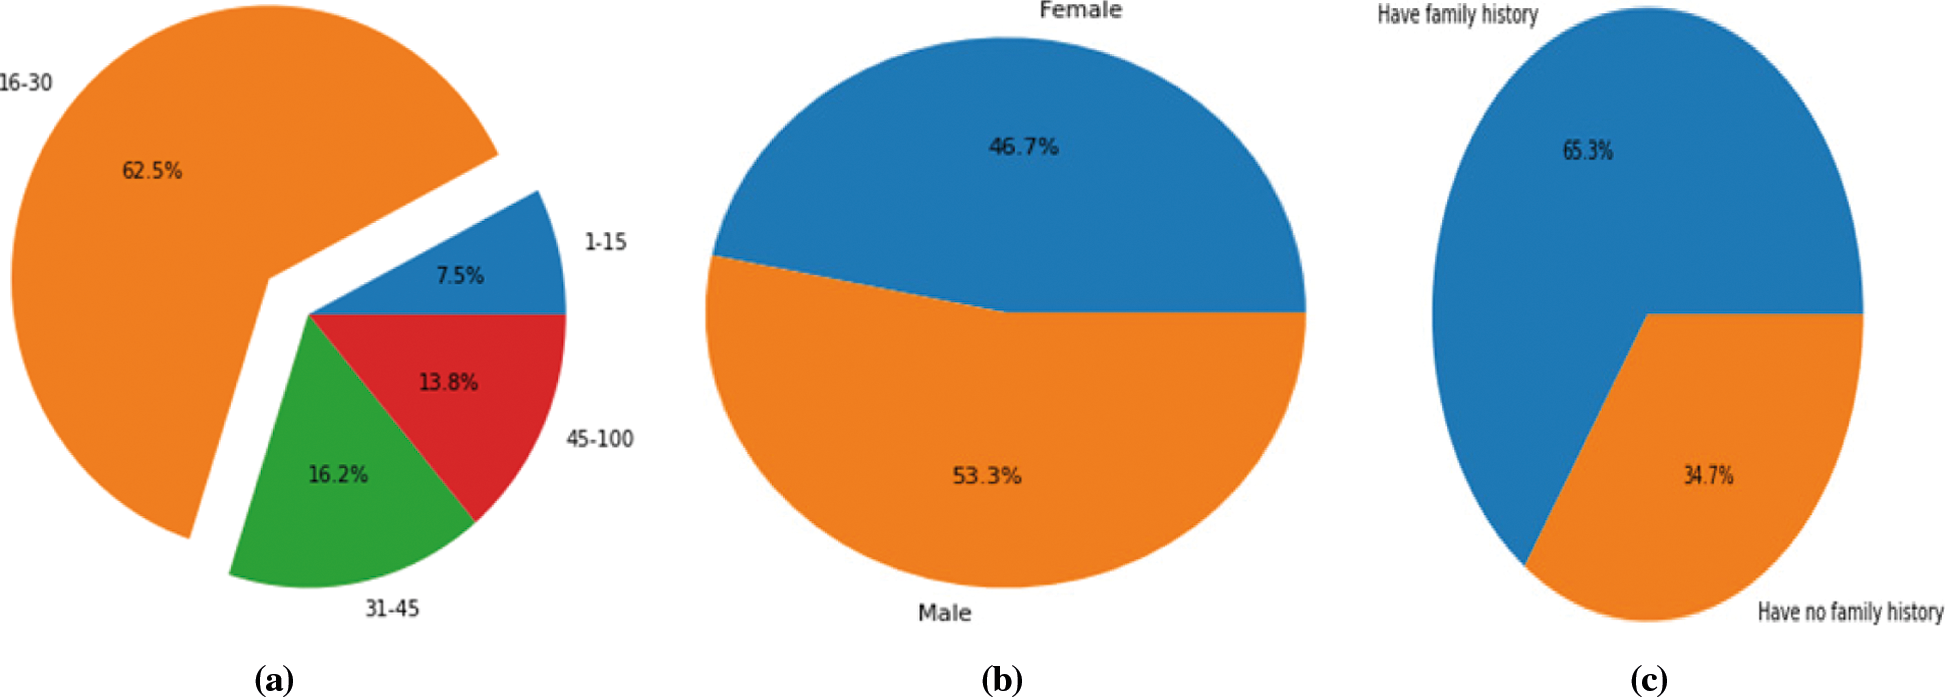
Figure 7: Comparison aspects the participants (a) Patient based on age (b) Patient based on gender (c) Patient based on family history
3.2 Android Application Development
Android apps employ Java core libraries and are built in the Java programming language [39]. We used TensorFlow to convert the prediction file, and TensorFlow created a file with the extension. tflite. TensorFlow is a machine learning software library that is free and open source. TensorFlow is a dataflow and differentiable programming-based symbolic math toolkit [40].
In Android Studio, we build a sample data Directory folder called assets to store the. tflite file. To execute the TensorFlow file, we add further dependencies. From Fig. 8a in here, have a Splash Screen ready before you launch this app. We created an XML file based on the Google Form. We are going to make twenty-two fields to collect data from the user. The majority of the fields are based on options. There is only one field in which the user must enter text, and that is the age. After filling out the information, the user must click the submit button.
Based on the information supplied, the result will indicate whether he suffers from asthma or not. If the person has asthma, the number will be 0; otherwise, it will be 1. The program will display the status You are asthma-free for non-patients what is displayed in Fig. 8b. We utilized AlertDialog to display this condition. Another android studio approach is the AlertDialog.
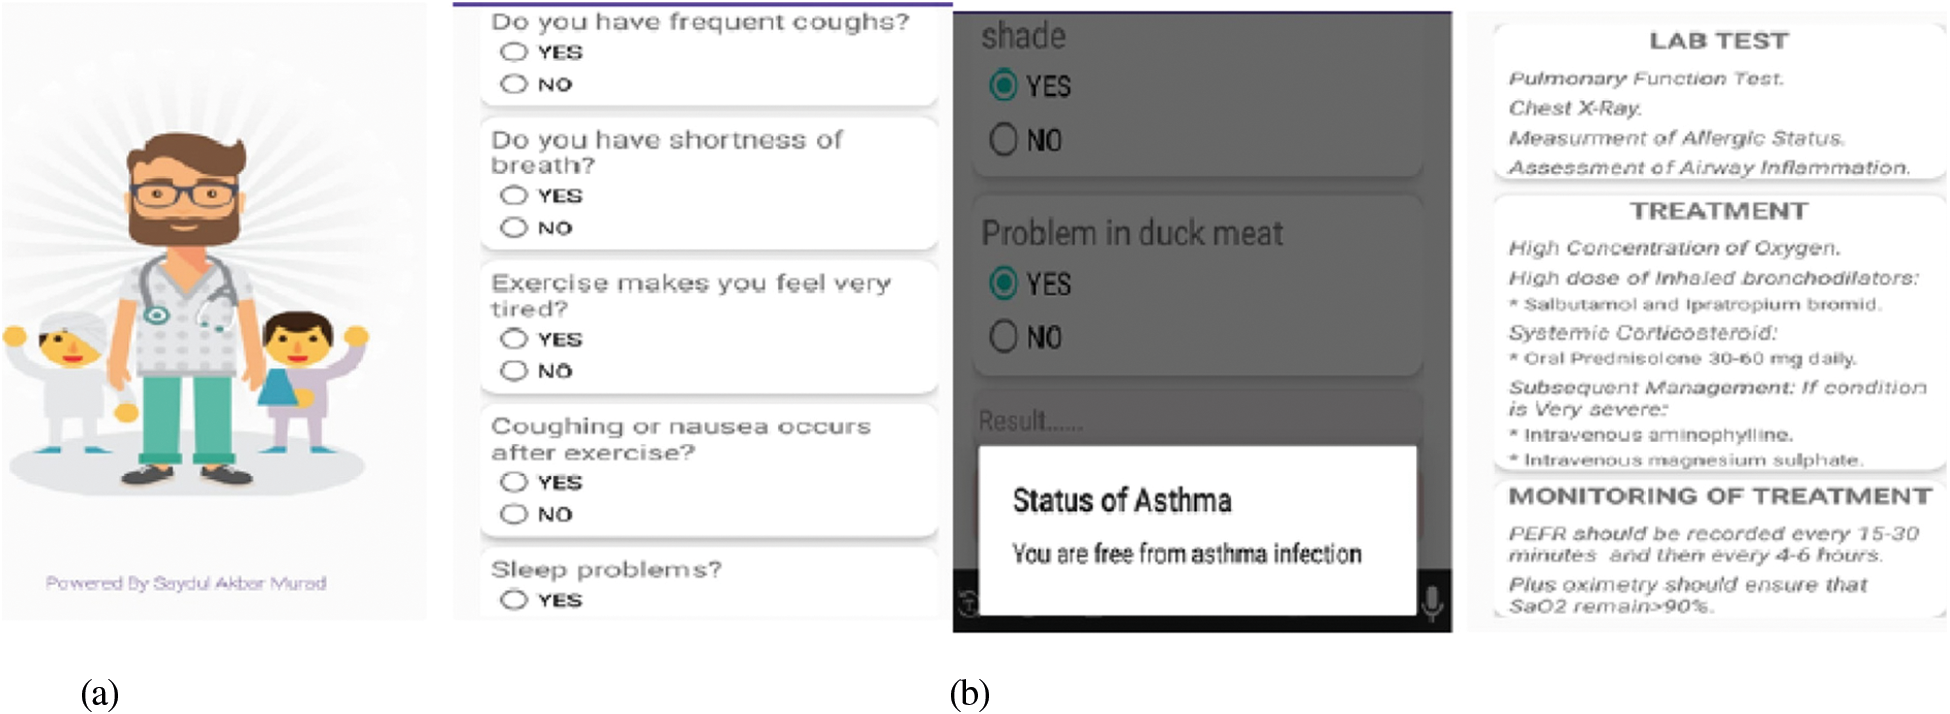
Figure 8: Android app screen output (a) screen of splash and data input (b) result screen for non patient and patient
If the user has asthma, this will redirect them to a different page. A single display will be found here. The user will receive three items in this section. The first is a LAB TEST. This section will suggest that you do a lab experiment. If the user discovers a significant issue in his lab test, he should seek advice from an expert doctor. If the user finds no serious issues, he can continue with our treatment. We have supplied some medicine for treatment. In [13], they also established one system with the assistance of IOT, which differs from our system to their system.
Identifying the raw data processing of asthma data will aid in the long-term saving of human life. Predicting asthma illness is difficult yet crucial in the medical sector. In this paper, based on a machine learning classifier and an Android application, we proposed an asthma risk prediction tool. We collected information about asthma illness using a Google form. The dataset was then subjected to eight machine learning algorithms. We obtained excellent accuracy for each algorithm. We then used Tensorflow to convert this prediction into an Android application. We utilized Android Studio to create our Android application. We developed an application using this technology, in which we gave treatment based on prediction. We went to doctor to test this system when we finished developing it. For this goal, we gathered data from a few patients and used our method to predict the outcome. We discovered that this method produced output and that the doctor’s prescriptions were similar, and the doctor was too satisfied about this system. The drawback of this application is that it requires the assistance of a doctor for treatment and report evaluation. However, we have a plan for this system in which we will offer therapy using AI and the diagnosis report will be evaluated by this system.
Funding Statement: This work was supported by Taif University Researchers Supporting Projects (TURSP). Under number (TURSP-2020/10), Taif University, Taif, Saudi Arabia.
Conflicts of Interest: The authors declare that they have no conflicts of interest to report regarding the present study.
1. WHO, Asthma, 2021. [Online]. Available: https://www.who.int/news-room/fact-sheets/detail/asthma. [Google Scholar]
2. M. A. Awal, M. S. Hossain, K. Debjit, N. Ahmed, R. D. N. Nemri et al., “An early detection of asthma using bomla detector,” IEEE Access, vol. 9, pp. 58403–58420, 2021. [Google Scholar]
3. O. Enilari and S. Sinha, “The global impact of asthma in adult populations,” Annals of Global Health, vol. 85, no. 1, pp. 622, 2019. [Google Scholar]
4. M. Z. Islam, M. M. Islam and A. Asraf, “A combined deep CNN-LSTM network for the detection of novel coronavirus (COVID-19) using X-ray images,” Informatics in Medicine Unlocked, vol. 20, pp. 100412, 2020. [Google Scholar]
5. M. M. Islam, F. Karray, R. Alhajj and J. Zeng, “A review on deep learning techniques for the diagnosis of novel coronavirus (COVID-19),” IEEE Access, vol. 9, pp. 30551–30572, 2021. [Google Scholar]
6. Y. Tong, A. I. Messinger and G. Luo, “Testing the generalizability of an automated method for explaining machine learning predictions on asthma patients asthma hospital visits to an academic healthcare system,” IEEE Access, vol. 8, pp. 195971–195979, 2020. [Google Scholar]
7. M. A. Rahim, M. M. Rahman, M. A. Rahman, A. J. M. Muzahid and S. F. Kamarulzaman, “A framework of iot-enabled vehicular noise intensity monitoring system for smart city,” in Int. Conf. on Innovative Technology, Engineering and Science, Pahang, Malaysia, pp. 194–205, 2020. [Google Scholar]
8. J. L. Harvey and S. A. P. Kumar, “Machine learning for predicting development of asthma in children,” in IEEE Symp. Series on Computational Intelligence (SSCI), Xiamen, China, pp. 596–603, 2019. [Google Scholar]
9. N. P. Tigga and S. Garg, “Prediction of type 2 diabetes using machine learning classification methods,” Procedia Computer Science, vol. 167, pp. 706–716, 2020. [Google Scholar]
10. S. A. Murad, Z. R. M. Azmi, Z. H. Hakami, N. J. Prottasha and M. Kowsher, “Computer-aided system for extending the performance of diabetes analysis and prediction,” in 7th Int. Conf. on Software Engineering and Computer Systems (ICSECS-2021), Pahang, Malaysia, pp. 465–470, 2021. [Google Scholar]
11. N. Sikder, M. Masud, A. K. Bairagi, A. S. M. Arif, A. A. Nahid et al., “Severity classification of diabetic retinopathy using an ensemble learning algorithm through analyzing retinal images,” Symmetry, vol. 13, no. 4, pp. 670, 2021. [Google Scholar]
12. A. Karim, M. A. Islam, P. Mishra, A. J. M. Muzahid, A. Yousuf et al., “Yeast and bacteria co-culture- based lipid production through bioremediation of palm oil mill effluent: A statistical optimization,” Biomass Conversion and Biorefinery, vol. 14, no. 2, pp. 1–12, 2021. [Google Scholar]
13. G. S. Bhat, N. Shankar, D. Kim, D. J. Song, S. Seo et al., “Machine learning-based asthma risk prediction using iot and smartphone applications,” IEEE Access, vol. 9, pp. 118708– 118715, 2021. [Google Scholar]
14. A. J. M. Muzahid, S. F. Kamarulzaman and M. A. Rahim, “Learning-based conceptual framework for threat assessment of multiple vehicle collision in autonomous driving,” in Emerging Technology in Computing, Communication and Electronics (ETCCE), Dhaka, Bangladesh, pp. 1–6, 2020. [Google Scholar]
15. W. Akbar, W. P. Wu, M. Faheem, M. A. Saleem, N. A. Golilarz et al., “Machine learning classifiers for asthma disease prediction: A practical illustration,” in 16th Int. Computer Conf. on Wavelet Active Media Technology and Information Processing, Chengdu, China, pp. 143–148, 2019. [Google Scholar]
16. M. M. Islam, H. Iqbal, M. R. Haque and M. K. Hasan, “Prediction of breast cancer using support vector machine and K-Nearest neighbors,” in 2017 IEEE Region 10 Humanitarian Technology Conf. (R10-HTC), Dhaka, Bangladesh, pp. 226–229, 2017. [Google Scholar]
17. M. M. Islam, M. R. Haque, H. Iqbal, M. M. Hasan, M. Hasan et al., “Breast cancer prediction: A comparative study using machine learning techniques,” SN Computer Science, vol. 1, no. 5, pp. 290, 2020. [Google Scholar]
18. M. K. Hasan, M. M. Islam and M. M. A. Hashem, “Mathematical model development to detect breast cancer using multigene genetic programming,” in 5th Int. Conf. on Informatics, Electronics and Vision (ICIEV), Dhaka, Bangladesh, pp. 574–557, 2016. [Google Scholar]
19. S. I. Ayon and M. M. Islam, “Diabetes prediction: A deep learning approach,” International Journal of Information Engineering and Electronic Business (IJIEEB), vol. 11, no. 2, pp. 21–27, 2019. [Google Scholar]
20. M. R. Haque, M. M. Islam, H. Iqbal, M. S. Reza and M. K. Hasan, “Performance evaluation of random forests and artificial neural networks for the classification of liver disorder,” in Int. Conf. on Computer, Communication, Chemical, Materials and Electronic Engineering, Rajshahi, Bangladesh, pp. 1–5, 2018. [Google Scholar]
21. S. I. Ayon, M. M. Islam and M. R. Hossain, “Coronary artery heart disease prediction: A comparative study of computational intelligence techniques,” IETE Journal of Research, Taylor & Francis, vol. 12, no. 2, pp. 1–20, 2020. [Google Scholar]
22. L. Luo, X. Yu, Z. Yong, C. Li and Y. Gu, “Design comorbidity portfolios to improve treatment cost prediction of asthma using machine learning,” IEEE Journal of Biomedical and Health Informatics, vol. 25, no. 6, pp. 2237–2247, 2020. [Google Scholar]
23. A. J. M. Muzahid, S. F. Kamarulzaman and M. A. Rahman, “Comparison of ppo and sac algorithms towards decision making strategies for collision avoidance among multiple autonomous vehicles,” in Int. Conf. on Software Engineering Computer Systems and 4th Int. Conf. on Computational Science and Information Management (ICSECS-ICOCSIM), Pahang, Malaysia, pp. 200–205, 2021. [Google Scholar]
24. K. Lisspersa, B. Stallberga, K. Larssonb, C. Jansonc, M. Muller et al., “Developing a short-term prediction model for asthma exacerbations from swedish primary care patientsa data using machine learning-based on the arctic study,” Respiratory Medicine, vol. 185, pp. 106483, 2021. [Google Scholar]
25. S. Mohan, C. Thirumalai and G. Srivastava, “Effective heart disease prediction using hybrid machine learning techniques,” IEEE Access, vol. 7, pp. 81542–81554, 2019. [Google Scholar]
26. L. C. Kiew, A. J. M. Muzahid and S. F. Kamarulzaman, “Vehicle route tracking system based on vehicle registration number recognition using template matching algorithm,” in Int. Conf. on Software Engineering Computer Systems and 4th Int. Conf. on Computational Science and Information Management (ICSECS-ICOCSIM), Pahang, Malaysia, pp. 249–254, 2021. [Google Scholar]
27. M. Masud, P. Singh, G. S. Gaba, A. Kaur, R. Alroobaea et al., “CROWD: Crow search and deep learning based feature extractor for classification of parkinson’s disease,” ACM Transactions on Internet Technology (TOIT), vol. 21, no. 3, pp. 1–18, 2021. [Google Scholar]
28. M. Kowsher, A. Tahabilder and S. A. Murad, “Impact-learning: A robust machine learning algorithm,” in Proc. of the 8th Int. Conf. on Computer and Communications Management (ICCCM’20), Singapore, pp. 9–13, 2020. [Google Scholar]
29. K. Tomita, R. Nagao, H. Touge, T. Ikeuchi, H. Sano et al., “Deep learning facilitates the diagnosis of adult asthma,” Allergology International, vol. 68, no. 4, pp. 456–461, 2019. [Google Scholar]
30. P. B. P. Reddy, M. P. K. Reddy, G. V. M. Reddy and K. M. Mehata, “Fake data analysis and detection using ensembled hybrid algorithm,” in 3rd Int. Conf. on Computing Methodologies and Communication (ICCMC), Erode, India, pp. 890–897, 2019. [Google Scholar]
31. A. Ali, A. M. B. Ata and N. K. Saleh, “Autoregression features for smart robotic wheelchair eeg-ica classification using a bagging model. Bahrain: Report, University of Bahrain, 2021. [Google Scholar]
32. A. Gupta, D. K. Panda and M. Pande, “Development of mobile application for laundry services using android studio,” International Journal of Applied Engineering Research, India, vol. 13, no. 12, pp. 10623–10626, 2018. [Google Scholar]
33. Abhi Android, “Android App Development Tutorial: Beginners Guide with Examples, Code and Tutorials”. India.[Online]. Available:https://abhiandroid.com/java/. [Accessed 2021]. [Google Scholar]
34. J. Xie and Q. Wang, “Benchmarking machine learning algorithms on blood glucose prediction for type I Diabetes in comparison with classical time-series models,” IEEE Transactions on Biomedical Engineering, vol. 67, no. 11, pp. 3101–3124, 2020. [Google Scholar]
35. A. U. Haq, J. P. Li, M. H. Memon, J. khan, A. Malik et al., “Feature selection based on l1-norm support vector machine and effective recognition system for parkinsonas disease using voice recordings,” IEEE Access, vol. 7, pp. 37718–37734, 2019. [Google Scholar]
36. Ahmed Fawzy Gad, Evaluating Deep Learning Models: The Confusion Matrix, Accuracy, Precision, and Recall. 2020. [Online]. Available: Precision | Definition, Precision Vs Accuracy, Recall, Formula and Example. https://byjus.com/maths/precision/. [Google Scholar]
37. C. K. Mutai, P. E. McSharry, I. Ngaruye and E. Musabanganji, “Use of machine learning techniques to identify HIV predictors for screening in sub-Saharan Africa,” BMC Medical Research Methodology, vol. 21, no. 1, pp. 1–11, 2021. [Google Scholar]
38. M. Masud, A. K. Bairagi, A. A. Nahid, N. Sikder, S. Rubaiee et al., “A pneumonia diagnosis scheme based on hybrid features extracted from chest radiographs using an ensemble learning algorithm,” Journal of Healthcare Engineering, vol. 21, no. 8862089, pp. 1–11, 2021. [Google Scholar]
39. Y. Tang, H. Wang, X. Zhan, X. Luo, Y. Zhou et al., “A systematical study on application performance management libraries for apps,” IEEE Transactions on Software Engineering, pp. 1, 2021. https://dx.doi.org/10.1109/TSE.2021.3077654. [Google Scholar]
40. N. Yadav and J. E. DeBello, “Recommended practices for python pedagogy in graduate data science courses,” in IEEE Frontiers in Education Conf. (FIE), Nebraska, Lincoln, USA, pp. 1–7, 2020. [Google Scholar]
 | This work is licensed under a Creative Commons Attribution 4.0 International License, which permits unrestricted use, distribution, and reproduction in any medium, provided the original work is properly cited. |