DOI:10.32604/iasc.2022.024757
| Intelligent Automation & Soft Computing DOI:10.32604/iasc.2022.024757 | |
| Article |
Modeling of Chaotic Political Optimizer for Crop Yield Prediction
1Department of Computer Science and Engineering, Sree Vidyanikethan Engineering College, Tirupati, 517102, India
2Department of Information Science and Engineering, M S Ramaiah Institute of Technology, Bangalore, 560054, India
3Department of Computer Science and Engineering, M S Ramaiah Institute of Technology, Bengaluru, 560054, India
4Department of Computer Science and Engineering, R.V.R & J.C College of Engineering, Guntur Andhra Pradesh, 522529, India
5Department of Electrical Engineering, Model Institute of Engineering and Technology, J&K, 181122, India
6Department of CSE, School of Engineering, Bennett University, Greater Noida, 201310, India
7Faculty of Engineering & Technology, Chhatrapati Shivaji Maharaj University, Navi Mumbai, 410206, India
*Corresponding Author: Gurram Sunitha. Email: gurramsunitha@gmail.com
Received: 30 October 2021; Accepted: 28 December 2021
Abstract: Crop yield is an extremely difficult trait identified using many factors like genotype, environment and their interaction. Accurate Crop Yield Prediction (CYP) necessitates the basic understanding of the functional relativity among yields and the collaborative factor. Disclosing such connection requires both wide-ranging datasets and an efficient model. The CYP is important to accomplish irrigation scheduling and assessing labor necessities for reaping and storing. Predicting yield using various kinds of irrigation is effective for optimizing resources, but CYP is a difficult process owing to the existence of distinct factors. Recently, Deep Learning (DL) approaches offer solutions to complicated data like weather parameters, maturity groups, genotype, etc. In this aspect, this paper presents an Automated Crop Yield Prediction utilizing Chaotic Political Optimizer with Deep Learning (ACYP-CPODL) model. The proposed ACYP-CPODL technique involves different processes namely pre-processing, prediction and parameter optimization. In addition, the hybrid Convolutional Neural Network (CNN) Long-Short Term Memory (LSTM) technique is designed for the prediction process. Moreover, the hyperparameter tuning of the CNN-LSTM approach is performed by the CPO algorithm. The proposed ACYP-CPODL technique has produced an effective result with an MSE of 0.031 and R2 Score of 0.936, whereas the BLSTM model has produced a near-optimal results. As a result, the proposed ACYP-CPODL method has proven to be an effective tool for predicting the crop yields. For validating the improved predictive performance of the ACYP-CPODL technique, a wide range of simulations take place on benchmark datasets and the comparative results highlighted the betterment of the ACYP-CPODL technique over the recent methods.
Keywords: Crop yield prediction; machine learning; deep learning; political optimizer; CNN-LSTM model; Automated Crop Yield Prediction utilizing Chaotic Political Optimizer with Deep Learning (ACYP-CPODL); Autoregressive Integrated Moving Average (ARIMA)
Crop Yield Prediction (CYP) is very important in global food productions. The policy making depends on precise forecasts of appropriate export and import decisions to reinforce the national food security [1]. Deep learning (DL) approach answers to complex data such as weather parameters, maturity groups, genotype and so on. Seed corporations must forecast the efficiency of novel hybrids in different environments in order to breed a good variety. Also, farmers and Growers consider yield prediction in making financial decisions [2]. The impact of genetic marker evaluated depends on communications with field management practices and environmental conditions. Several researchers focus on describing the phenotypes (like yield) as obvious functions of genotype (G), environment (E) and its relations (G×E). The most common and straightforward approach considers only the additive impacts of G and E and process its interaction as noise [3,4].
The common method to examine the G×E effects is to find the interactions and effects of mega environment instead of extra advanced environment modules. Also, the FA method could increase probability up to 6% if there is a complicated G×E pattern from the information. The linear mixed method has also been employed for studying the interactive and additive impacts of environments and individual genes [5]. In recent years, ML methods are employed for CYP, along with DT, multivariate regression, ANNs and association rule mining.
Conventional linear models like Autoregressive Integrated Moving Average (ARIMA) are employed for time series prediction issues [6]. For time series predictive task, DNN shows effective result to noisy input and have the capacity to estimate random non-linear function [7,8]. DL method could offer solution in the existence of complicated data including maturity groups and zones, genotype information and distinct weather variables.
This method could be very effective in learning the nonlinear dependencies among predicted yield and the multi-variate input data (cluster information, weather variables and maturity group). LSTM network is highly helpful for time series modelling as it could capture the long-term temporal dependency in difficult multivariate sequences [9]. LSTM model has demonstrated advanced results in many applications involving engineering systems, offline handwriting recognition and NLP. Also, LSTM method is efficiently utilized for multi-variate time series predictive tasks. LSTM based models are employed in corn yield prediction [10], however, this model lacks temporal resolution of everyday weather data and lacks interpretability that depends on geospatial information without field scale farming management.
This paper focuses on the design of an Automated Crop Yield Prediction using Chaotic Political Optimizer with Deep Learning (ACYP-CPODL) model. The proposed ACYP-CPODL technique involves different processes namely pre-processing, prediction and parameter optimization. In addition, the hybrid Convolutional Neural Network (CNN) Long-Short Term Memory (LSTM) model is designed to carry out the prediction process. The design of CPO algorithm for hyperparameter optimization of HCNN-LSTM model shows the novelty of the study. The performance validation of the ACYP-CPODL technique is carried out on benchmark dataset and the results are examined under varying aspects.
Shook et al. [11] utilized performance records from UST in North America for building an LSTM-RNN based method which leverages weekly weather parameters and pedigree relatedness measures to predict and dissect genotype respond in various environments. Shahhosseini et al. [12] examined both ML and crop modelling that enhances corn yield prediction in the US Corn Belt. The primary goal is to investigate a hybrid model (crop modelling and ML) for improved prediction, to explore the combination of hybrid method for precise prediction and establish the features from crop modelling that is highly efficient with ML for corn yield predictions. The 5 ML methods (LR, LASSO, LightGBM, RF and XGBoost) and 6 ensemble methods are developed for addressing the study problems.
In Abbas et al. [13], the entire possibility of this precision agriculture technology might be employed and advanced methods of data processing like ML models for extraction of valuable data to control the crop yield. In Shetty et al. [14], an MLP-NN model and RF regression methods are trained with the data gathered from four main crops grown in Karnataka district for which past yield data and weather data of thirty regions of Karnataka are gathered. Weather information consists of average, minimum and maximum values of pressure, temperature and humidity. Then, these two databases are preprocessed and merged to train these models. To evaluate the trained method, assessment metrics like MAE, MSE and RMSE were employed.
In Rajaram et al. [15], ML method was utilized for predicting four common yields that are mainly cultivated throughout India. When the crop yield site is precisely forecasted, the inputs like fertilizer might be variably employed based on the soil and crop. In this work, ML methods are employed for developing a trained method to recognize the pattern amongst data and it can be utilized in predicting the crops. Elavarasan et al. [16] described a new hybrid feature extraction process, i.e., a combination of the CFS and RFRFE architecture. The presented model focuses on identifying optimum subclasses of features from a group of groundwater, climate and soil features to construct a crop-yield prediction ML method with outstanding accuracy and performance. In Agarwal et al. [17], the presented method has been improved by employing DL methods and crop prediction. An accurate data is attained with respect to the number of soil ingredients required by their expenditures. This could provide a higher precision compared to the present methods. It analyses the provided information and assists the farmers in forecasting crops that in turn assist in gaining benefits. The soil and climatic situations of land are considered for predicting an appropriate yield.
Kang et al. [18] proposed a comprehensive analysis of county-level maize yield predictions in U.S. Midwest with six ML or statistical methods (Lasso, SVR, RF, XGBoost, LSTM and CNN) and a wider range of environment variables acquired from weather data, satellite observations, soil maps, crop progress reports. Obsie et al. [19] estimated the comparative significance of weather factors and bee species composition in adaptable wild blueberry agroecosystem. This aims to disclose how weather and bee species composition affects crops and to forecast optimum weather condition and attain optimal yields using ML models and computer simulation. The MLR, BDT, RF and XGBoost are estimated as prediction tools.
3 The Proposed ACYP-CPODL Model
In this study, an efficient ACYP-CPODL technique is derived for automated prediction of crop yield. The proposed ACYP-CPODL technique involves different processes. The detailed working of these processes is offered in the subsequent sections.
During this phase, the data has been pre-processed in 2 levels such as data alteration and data normalization. In the data alteration procedure, the input data from .xls format has been changed to .csv format. In addition, data normalization has been implemented with the min-max manner, in which the maximum and minimum values are considered with the available data. It proposes the normalization of samples to minimum value of zero and maximum value of one. It is given in Eq. (2).
3.2 HCNN-LSTM Based Prediction Process
The prediction process is carried out using (i) hybrid Convolutional Neural Network (CNN), (ii) Long-Short Term Memory (LSTM) model. During the prediction process, the HCNN-LSTM model receives the pre-processed data as input and generates the output. The presented CNN-LSTM technique has an input layer, 4 convolution layers, 1 pooling layer, 2 LSTM layers, 4 Fully Connected (FC) layers and softmax resultant layer. For multi-variate time series prediction tasks, the LSTM method was found to be an effective tool. For corn yield prediction, LSTM-based models are used, but this model lacks temporal resolution of everyday weather data and interpretability because it relies on geospatial data without field scale farming management.
Initially, the EEG signal information has been directly utilized as input for presented technique and the shape of input data is
where
Followed by, the convolutional and activations, 64 FMs with the size of
where
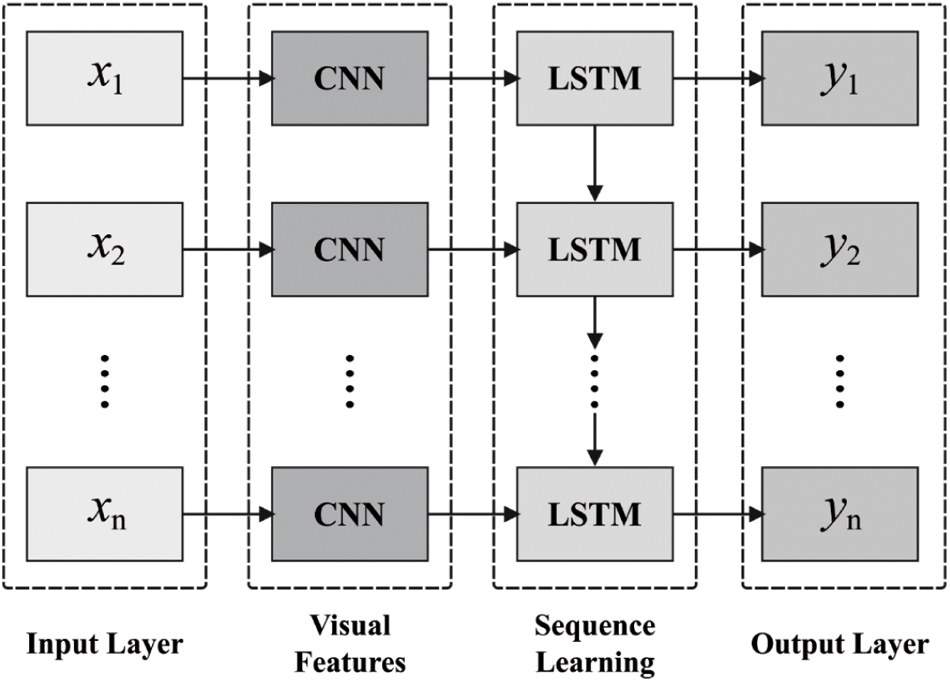
Figure 1: Structure of CNN-LSTM
It considerably minimizes the number of trained parameters from the presented technique and accelerating the trained procedures. The pooling function, 64 FMs by size of
Then the FM passing with every convolution layer, the reached 1024 FMs with size of
Next passing to the FC_Layl, the resultant features are fed into the LSTM layer that can prevent the long-term dependencies issue from the classical RNN. It is collaborating with everyone for preserving the preceding data and enhances the capability of learning helpful data in the EEG time series information. It contains 64 neurons from combined LSTM Layer1 and LSTM Layer2. Later, the features passing through the LSTM layers, the resultant features are later fed into 3 FC_Lays. At last, a softmax outcome layer presented a technique for last recognition. The comprehensive configuration of the presented technique has been used to predict the crop yield.
3.3 Design of CPO Based Hyperparameter Tuning
For optimally adjusting the hyperparameters involved in the HCNN-LSTM model, the CPO algorithm is utilized. Chaotic maps are combined and derived from the CPO algorithm to improve the efficiency of the PO algorithm. PO is stimulated using the western political process of optimization, involving two major concepts. The primary consideration is that every citizen aims to optimize the selective. Then, every party works to achieve many seats in the parliament. It includes 5 stages namely party formation and constituency allocation, election promotion, party transferring, interparty election and parliaEven. Though the author could describe the proposed model’s final achievements in the conclusion section, the resultant parameters are perfectly and appreciable. These processes are elaborated as follows.
The whole population undergoes separation to n political parties, as defined below.
The party includes n party members, as given below.
Every member in a party contains d dimension as defined in Eq. (7)
The solution can be the selective candidate [21]. Assume there are
Consider n members in every individual constituency, as given in Eq. (9).
The party leader is determined using the member with an optimal fitness in party, as given below.
Every party member can be represented using Eq. (11).
The dissimilar electorates are named as the members of parliament, as defined in Eq. (12).
At the time of selection promotions, Eqs. (13) and (14) are utilized to upgrade the locations of the significant solutions.
For managing both explorations and exploitation processes, party transferring is accepted. A dynamic variable λ is utilized that gets linearly reduced from 0 to 1 at the time of whole repetitive process. Every candidate is chosen based on the probability λ and swapped with the poorest member of an arbitrarily designated party, as defined in Eq. (15)
During the selection process, the vector can be obtained using Eq. (16)
For improving the efficiency of the PO algorithm, chaotic maps are integrated and derived from the CPO algorithm. Chaos defines a status or a state of higher disorder or confusion. The chaotic technique is a deterministic system which demonstrates random nature and a sensitive dependency on the initial condition. It is a familiar criterion in non-linear system, whose action is difficult and arbitrary [22,23]. It studied the nature of the system following deterministic laws, however, appears arbitrary and random. The chaotic parameters undergo every state in particular interval, based on the individual regularity with no iterativeness. Owing to ergodic and adaptive characteristics of the chaos variables, chaos searching has the higher capability. A chaotic map demonstrates a kind of chaotic nature. The generic logistic map can be defined by Eq. (17):
where
Figure 2: Flowchart of PO
Tab. 1, Figs. 3 and 4 provides the predictive result analysis of the ACYP-CPODL technique on tomato yield prediction. The results are examined under distinct batch sizes and runs. The results depicted that the ACYP-CPODL technique has resulted in an effective outcome with the minimum MSE and maximum R2 score values. For instance, under run-1 and BS = 16, the ACYP-CPODL technique has MSE and R2 scores of 0.017 and 0.991 respectively.

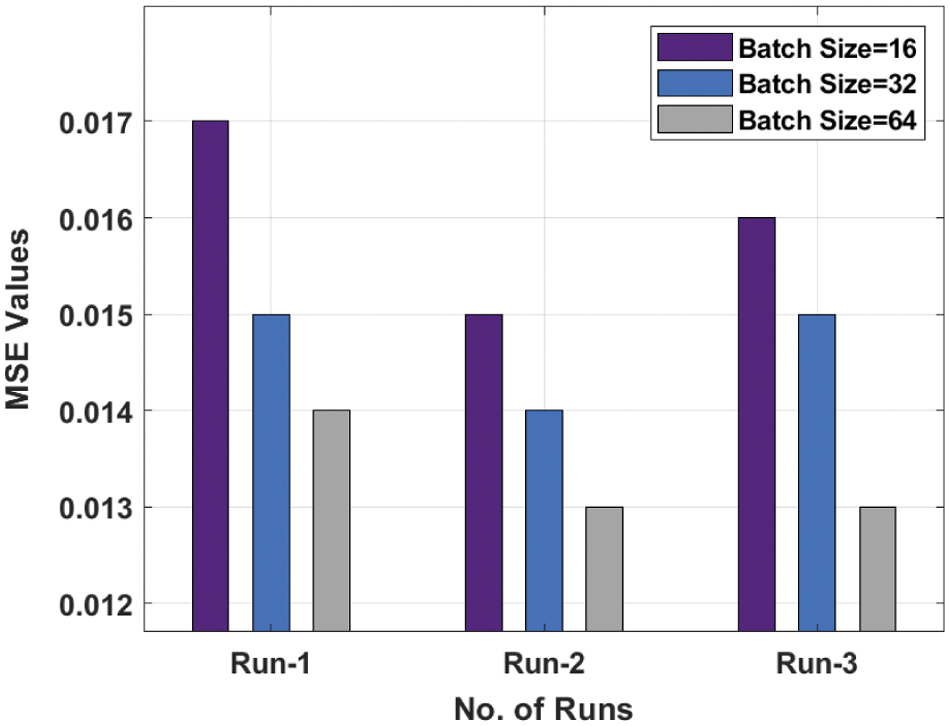
Figure 3: MSE analysis of ACYP-CPODL technique on tomato yield prediction
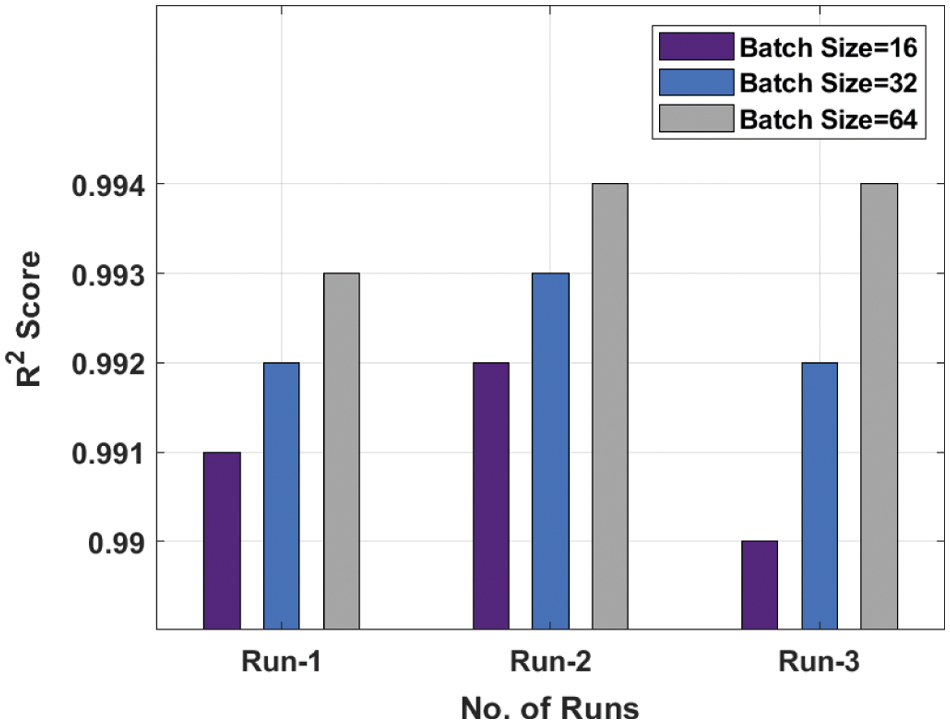
Figure 4: R2 score analysis of ACYP-CPODL technique on tomato yield prediction
Tab. 2, Figs. 5 and 6 offers the predictive result analysis of the ACYP-CPODL method on potato yield prediction. The outcomes are examined under different batch sizes and runs. It shows that the ACYP-CPODL approach has resulted in an effectual outcome with the minimal MSE and maximal R2 score values. For instance, under run-1 and BS = 16, the ACYP-CPODL method has an existing MSE and R2 scores of 0.036 and 0.931 respectively.

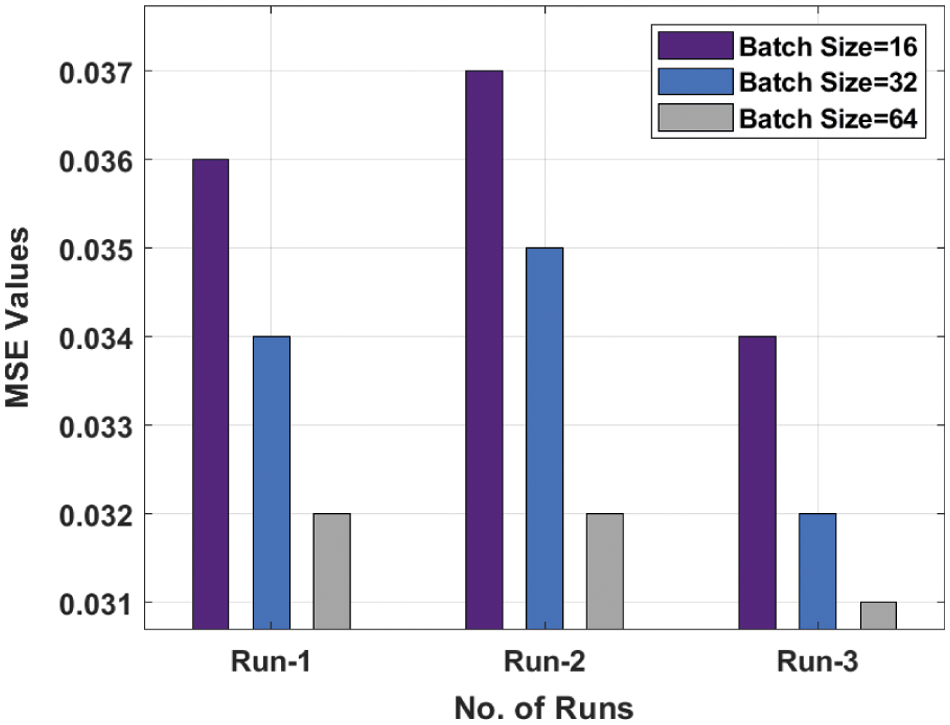
Figure 5: MSE analysis of ACYP-CPODL technique on potato yield prediction
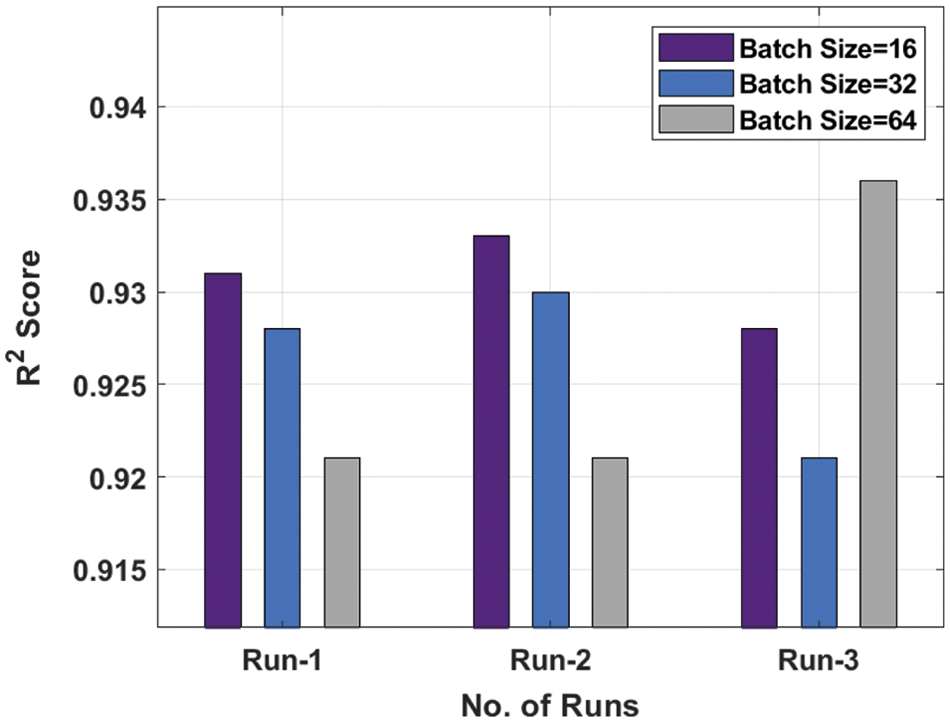
Figure 6: R2 analysis of ACYP-CPODL technique on potato yield prediction
Tab. 3 provides a comparative result analysis of the ACYP-CPODL with recent techniques in terms of different measures. Figs. 7 and 8 demonstrates the MSE and R2 score analysis of the ACYP-CPODL technique on the tomato yield prediction. The figure shows that the RF, MLP-3 layer, MLP-4 layer and MLP-5-layer techniques have obtained an ineffective outcome with the higher MSE and lower R2 Score values. Besides, the CNN-3 layer and CNN-2-layer models have attained slightly reduced MSE and certainly increased R2 Score values. Though the BLSTM model has an optimal outcome, the proposed ACYP-CPODL technique has the minimal MSE of 0.013 and R2 Score of 0.994.

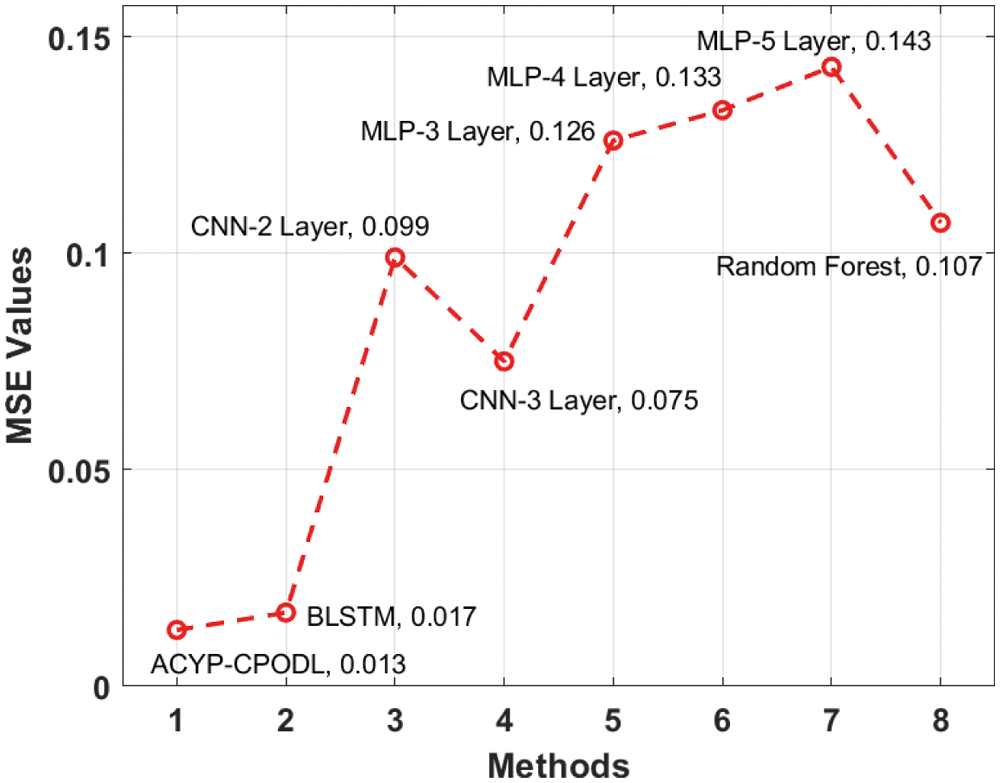
Figure 7: Comparative MSE analysis of ACYP-CPODL model on tomato yield prediction
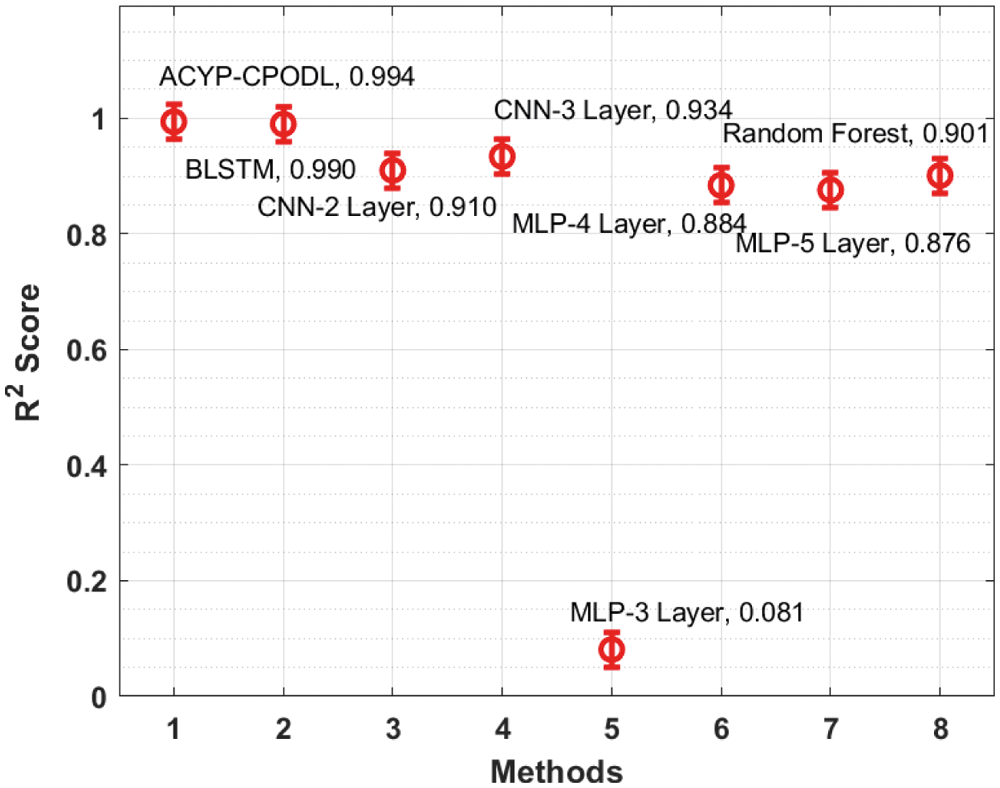
Figure 8: Comparative R2 analysis of ACYP-CPODL model on tomato yield prediction
Tab. 4 offers a comparative analysis of the ACYP-CPODL with state-of-art techniques in terms of various measures [24]. Figs. 9 and 10 shows the MSE and R2 score analysis of the ACYP-CPODL technique on potato yield prediction. The figure shows that the RF, MLP-3 layer, MLP-4 layer and MLP-5-layer systems have an ineffective outcome with the higher MSE and lower R2 Score values. Followed by the CNN-3 layer and CNN-2-layer approaches have attained a slightly reduced MSE and enhanced R2 Score values. Though the BLSTM model has an optimal outcome, the proposed ACYP-CPODL technique has obtained an effective and lesser MSE of 0.031 and R2 Score of 0.936.
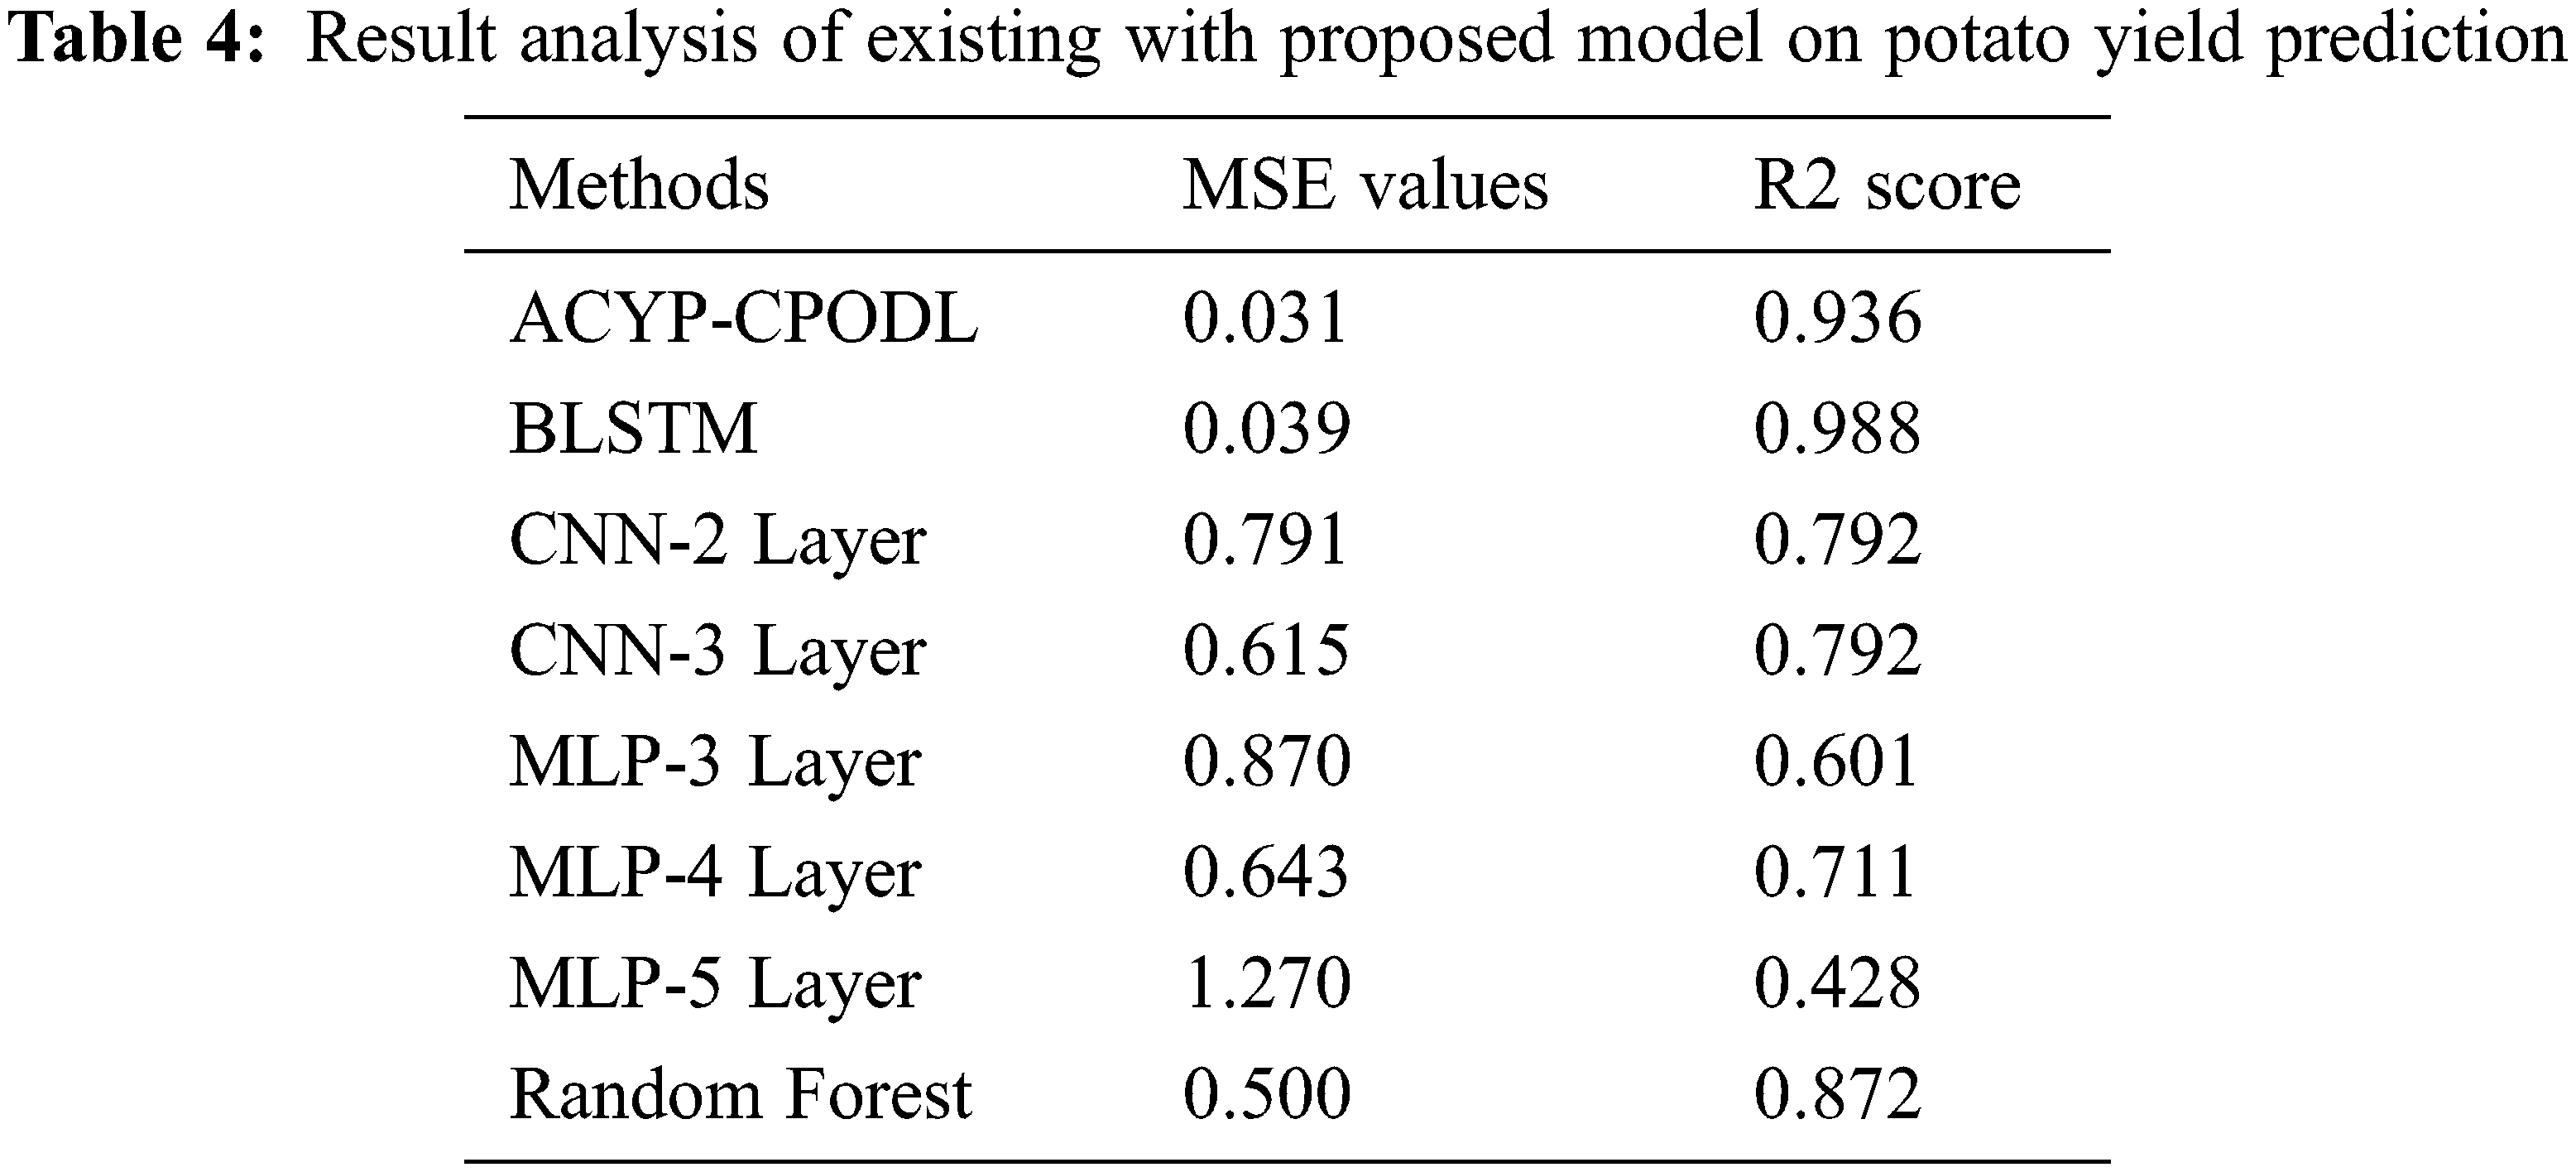
Figure 9: Comparative MSE analysis of ACYP-CPODL model on potato yield prediction
Figure 10: Comparative R2 analysis of ACYP-CPODL model on potato yield prediction
In this study, an efficient ACYP-CPODL technique is derived for automated prediction of crop yield. The proposed ACYP-CPODL technique involves different processes namely pre-processing, HCNN-LSTM based prediction and CPO based parameter optimization. The inclusion of CPO algorithm helps to optimally determine the hyperparameter involved in the HCNN-LSTM model and it results in an improved prediction performance. For investigating the ACYP-CPODL technique, a comprehensive experimental analysis is made using benchmark dataset and the comparative result highlights the betterment of the ACYP-CPODL technique over the recent methods. While the BLSTM model produced an optimal result, the proposed ACYP-CPODL technique has produced an effective result with an MSE of 0.031 and an R2 Score of 0.936. Therefore, the proposed ACYP-CPODL technique appears to be an effective tool to predict the crop yield. In future, the predictive outcome can be improved by designing fusion-based prediction models.
Funding Statement: The authors received no specific funding for this study.
Conflicts of Interest: The authors declare that they have no conflicts of interest to report regarding the present study.
1. S. Khaki and L. Wang, “Crop yield prediction using deep neural networks,” Frontiers in Plant Science, vol. 10, no. 2, pp. 621, 2019. [Google Scholar]
2. E. S. Madhan, S. Neelakandan and R. Annamalai, “A novel approach for vehicle type classification and speed prediction using deep learning,” Journal of Computational and Theoretical Nano Science, vol. 17, no. 5, pp. 2237–2242, 2020. [Google Scholar]
3. N. Heslot, D. Akdemir, M. E. Sorrells and J. L. Jannink, “Integrating environmental covariates and crop modeling into the genomic selection framework to predict genotype by environment interactions,” Theoretical and Applied Genetics, vol. 127, no. 2, pp. 463–480, 2020. [Google Scholar]
4. J. Burgueño, J. Crossa, P. L. Cornelius and R. C. Yang, “Using factor analytic models for joining environments and genotypes without crossover genotype× environment interaction,” Crop Science, vol. 48, no. 4, pp. 1291–1305, 2018. [Google Scholar]
5. S. Neelakandan and D. Paulraj, “An automated exploring and learning model for data prediction using balanced CA-SVM,” Journal of Ambient Intelligence and Humanized Computing, vol. 12, no. 5, pp. 4979–4990, 2021. [Google Scholar]
6. P. Mohan, M. Sundaram, S. Satpathy and S. Das, “An efficient technique for cloud storage using secured de-duplication algorithm,” Journal of Intelligent & Fuzzy Systems, vol. 42, no. 2, pp. 2969–2980, 2021. [Google Scholar]
7. S. Muthukumaran and R. Annamalai, “Implementing campus indoor location tracking system,” International Journal of Engineering and Computer Science, vol. 5, no. 5, pp. 16731–16735, 2016. [Google Scholar]
8. V. Sindu, “Comparative analysis among decision tree vs. naive bayes for prediction of weather prognostication,” Smart Intelligent Computing and Communication Technology, vol. 38, no. 1, pp. 94–100, 2021. [Google Scholar]
9. A. Ramanathan, S. Janarathanan and P. Mohan, “Accessing the data efficiently using prediction of dynamic data algorithm,” International Journal of Computer Applications, vol. 116, no. 22, pp. 39–42, 2015. [Google Scholar]
10. S. Satpathy, S. Debbarma, S. C. Sengupta and K. D. Bhattacaryya Bidyut, “Design a fpga, fuzzy based, insolent method for prediction of multi-diseases in rural area,” Journal of Intelligent & Fuzzy Systems, vol. 37, no. 5, pp. 7039–7046, 2019. [Google Scholar]
11. J. Shook, T. Gangopadhyay, L. Wu, B. Ganapathysubramanian, S. Sarkar et al., “Crop yield prediction integrating genotype and weather variables using deep learning,” Plos One, vol. 16, no. 6, pp. e0252402, 2016. [Google Scholar]
12. M. Shahhosseini, G. Hu, I. Huber and S. V. Archontoulis, “Coupling machine learning and crop modeling improves crop yield prediction in the US Corn Belt,” Scientific Reports, vol. 11, no. 1, pp. 1–15, 2021. [Google Scholar]
13. F. Abbas, H. Afzaal, A. Farooque and S. Tang, “Crop yield prediction through proximal sensing and machine learning algorithms,” Agronomy, vol. 10, no. 7, pp. 1046–1054, 2020. [Google Scholar]
14. S. A. Shetty, T. Padmashree, B. M. Sagar and N. K. Cauvery, “Performance analysis on machine learning algorithms with deep learning model for crop yield prediction,” in Data Intelligence and Cognitive Informatics, Algorithms for Intelligent Systems. Springer, Singapore, pp. 739–750, 2021. [Google Scholar]
15. P. V. Rajaraman and M. Prakash, “Deepreply - an automatic email reply system with unsupervised cloze translation and deep learning,” ICTACT Journal on Soft Computing, vol. 10, no. 3, pp. 2090–2095, 2020. [Google Scholar]
16. D. Elavarasan, P. M. Vincent, K. Srinivasan and C. Y. Chang, “A hybrid CFS filter and RF-RFE wrapper-based feature extraction for enhanced agricultural crop yield prediction modeling,” Agriculture, vol. 10, no. 9, pp. 400, 2020. [Google Scholar]
17. S. Agarwal and S. Tarar, “A Hybrid approach for crop yield prediction using machine learning and deep learning algorithms,” Journal of Physics: Conference Series, vol. 1714, no. 1, pp. 012012, 2021. [Google Scholar]
18. Y. Kang, M. Ozdogan, X. Zhu, Z. Ye, C. Hain et al., “Comparative assessment of environmental variables and machine learning algorithms for maize yield prediction in the US Midwest,” Environmental Research Letters, vol. 15, no. 6, pp. 064005, 2020. [Google Scholar]
19. E. Y. Obsie, H. Qu and F. Drummond, “Wild blueberry yield prediction using a combination of computer simulation and machine learning algorithms,” Computers and Electronics in Agriculture, vol. 178, no. xx, pp. 105778, 2021. [Google Scholar]
20. N. Subramani and D. Paulraj, “A gradient boosted decision tree-based sentiment classification of twitter data,” International Journal of Wavelets, Multiresolution and Information Processing, vol. 18, no. 4, pp. 1–21, 2020. [Google Scholar]
21. G. Manita and O. Korbaa, “Binary political optimizer for feature selection using gene expression data,” Computational Intelligence and Neuroscience, vol. 2020, no. 1, pp. 1–14, 2020. [Google Scholar]
22. S. Neelakandan, “Social media network owings to disruptions for effective learning,” Procedia Computer Science, vol. 172, no. 5, pp. 145–151, 2020. [Google Scholar]
23. H. M. Zawbaa, E. Emary and C. Grosan, “Feature selection via chaotic antlion optimization,” Plos One, vol. 11, no. 3, pp. e0150652, 2018. [Google Scholar]
24. K. Alibabaei, P. D. Gaspar and T. M. Lima, “Crop yield estimation using deep learning based on climate big data and irrigation scheduling,” Energies, vol. 14, no. 11, pp. 3004, 2021. [Google Scholar]
 | This work is licensed under a Creative Commons Attribution 4.0 International License, which permits unrestricted use, distribution, and reproduction in any medium, provided the original work is properly cited. |