DOI:10.32604/iasc.2022.026346
| Intelligent Automation & Soft Computing DOI:10.32604/iasc.2022.026346 | |
| Article |
Multilayer Functional Connectome Fingerprints: Individual Identification via Multimodal Convolutional Neural Network
1College of Electronic Engineering, Chengdu University of Information Technology, Chengdu, Sichuan, 610225, China
2School of Electronic and Electrical Engineering, University of Leeds, Leeds, LS29JT, United Kingdom
*Corresponding Author: Zhipeng Yang. Email: yangzp@cuit.edu.cn
Received: 22 December 2021; Accepted: 10 February 2022
Abstract: As a neural fingerprint, functional connectivity networks (FCNs) have been used to identify subjects from group. However, a number of studies have only paid attention to cerebral cortex when constructing the brain FCN. Other areas of the brain also play important roles in brain activities. It is widely accepted that the human brain is composed of many highly complex functional networks of cortex. Moreover, recent studies have confirmed correlations between signals of cortex and white matter (WM) bundles. Therefore, it is difficult to reflect the functional characteristics of the brain through a single-layer FCN. In this paper, a multilayer FCN involving both cerebral cortex and WM was proposed to characterize different levels of FCNs based on resting-state functional Magnetic Resonance Imaging (fMRI) data. The multilayer FCN is regarded as a neural fingerprint to realize individual identification and the individual variability of which is related to individual differences in fluid intelligence and gender. In addition, the proposed multilayer FCN has been learned by a multimodal convolutional neural network (CNN) algorithm to achieve individual identification. Compared with the existing FCN that only involves the cerebral cortex, the accuracy of individual recognition illustrates the effectiveness of our method. Meanwhile, the proposed multilayer FCN also achieves better results than the traditional single-layer FCN in gender classification and fluid intelligence prediction.
Keywords: Resting-state fMRI; fingerprint; functional connectivity; multilayer network
Functional connectivity networks (FCNs) based on blood-oxygenation-level-dependent (BOLD) functional Magnetic Resonance Imaging (fMRI) time series can reflect temporal correlation of activities between paired brain regions, which has been used for researching and analyzing the brain from the perspective of functional connectome. In recent years, many researchers have worked on regarding the FCN as a type of neural fingerprint to realize individual identification that distinguishes a specific individual from a group of subjects [1–3]. Most of them applied atlas which divides the whole cortical area into several regions-of-interest (ROIs) to extract the average fMRI signal and calculate FCNs by Pearson correlation between ROIs [4].
The cortical gray matter (GM) is the highest-level of the central nervous system, the activity of which is vital for the human brain’s functional organization. However, multiple areas of the brain are also involved in cognitive processes. Apart from GM, white matter (WM) contributes to information transmission among cortices, while subcortical areas, which relay and modulate information passing to different areas of the brain, act as information hubs of the nervous system. In recent years, an increasing number of researchers have suggested that fMRI signals in WM can reflect brain activities of neural fibers [5,6] and be used to construct FCNs between WM bundles and cortical areas [7]. Ding et al. studied the temporal correlation between WM and GM signals of resting state and found that the functional connection pattern between GM and WM regions showed the characteristics of regionalization [8]. Peer et al. found that the deep GM area of the human brain has a functional network similar to GM, and that the superficial WM area has a strong correlation with the WM functional network, which further reveals that there is indeed a functional interaction between WM and GM [9]. In addition, some clinical studies have observed that patients with some neuropsychiatric symptoms, as observed in Alzheimer’s disease, depression and schizophrenia, have a lower functional connection between GM and WM regions than normal individuals [10–12].
In addition, graph theory is widely applied to analyze the characteristics of FCNs [13–15]. Specifically, the ROIs in the brain are regarded as nodes in a graph, and the functional connectivity (FC) between ROIs represents edges. Strong node FC denotes a high level of instantaneous cofluctuation temporally correlated activity between paired ROIs. However, traditional graph theory is limited to connecting two nodes by one edge to capture pairwise information. It is well recognized that the human brain is a complex system that requires several ROIs to work together as a complex network. A low-level network may not be sufficient to uncover the topological and dynamic properties of the human brain. Compared with traditional graphs, the hypergraph method constructs connections among several nodes to characterize the high-order relations among ROIs. Moreover, neuroscience research has proven that a brain area interacts directly with some of the other brain areas during neural processes. These works indicated that the high-order relationship between brain regions is important not only for the pathological research of some diseases but also for the study of neuronal spiking, local field potentials, and cortical activities [16–18].
The classical paired ROIs’ FCN of cortical areas or WM-GM is a single-layer graph model of the brain organization. However, more than the complexity of one layer, the human brain is an extremely complex system with high time complexity and dimensional complexity. Some researchers have tried to use multi-level or multimodal brain network analysis methods to process fMRI signals for cognitive and behavioral studies [19,20]. It is very limited to reveal the physiological activities of the brain through a single layer in GM space. Static representation should be extended by adding more dimensions to former a higher level graph, such as time or space [21]. Pedersen et al. attempted to explain the physiological activities of the brain through temporal multilayer networks [22].
Inspired by the idea of a multilayer network, this paper explores how to construct a spatial multilayer network called a multilayer FCN to model a complex system with WM and GM. Both traditional graphs and hypergraphs [13] are used in the construction of this multilayer network. With the development of deep learning in recent years, some research on fMRI signals has been completed with neural networks, such as clinical disease diagnosis based on fMRI signals [23–26]. In this work, with a novel multilayer FCN, a multimodal convolutional neural network (CNN) algorithm is employed to extract the features of each layer of the network and fuse all the features to finally realize individual recognition. The performance of the proposed multilayer FCN model has been analyzed in individual recognition and its performance on behavioral prediction. The experimental results show that the multilayer FCN we propose achieves higher accuracy than the traditional FCN built only on the cerebral cortex.
The major contributions of this work are three-fold:
• The multilayer FCN construct method based on the fMRI data, in which the FCN between the layers is hierarchically related to extract multilayer features of the physiological process.
• This is the first study to employ WM fMRI data to construct FCNs for individual identification which provided an important opportunity to advance the understanding of brain fingerprints.
• This paper utilizes a multimodal deep learning algorithm to extract fused multilayer features and experiments show that these features can achieve better individual identification.
This section mainly introduces main methods and data used in the construction of the multilayer FCN and individual identification. The data and preprocessing process are introduced in Section 2.1. The construction method of the multilayer FCN is described in Sections 2.2 and 2.3, of which Section 2.2 contains the construction details of the three-layer maps in the multilayer FCN and Section 2.3 introduces the hypergraph algorithm involved in the first layer of the multilayer FCN. Finally, the multimodal CNN used in the part of experiment is reported in Section 2.4.
The data used in this work comes from the Human Connectome Project (HCP) database [27]. Data of the 1200 Subjects Release (S1200) includes behavioral and 3 T MR imaging data from 1206 healthy young adult participants collected in 2012–2015, with the following parameters: repetition time (TR) = 720 ms, time echo (TE) = 33.1 ms, flip angle (FA) = 52°, resolution = 2.0 mm, matrix = 104 × 90 . The resting-state functional magnetic resonance imaging (rs-fMRI) data of 100 subjects were random collected and used in this work. Each subject has two resting-state sessions and each resting-state session has 1200 frames of 864 s total duration. The data of collection interval between rest1 and rest2 is one day and one of them was used for training and another one for testing. Preprocessed data of the HCP minimal preprocessing pipeline were used in this work, which included gradient distortion correction, head motion correction, image distortion correction, spatial normalization to standard Montreal Neurological Institute (MNI), and intensity normalization [27]. Besides these steps, we also regressed out the head motion and cerebrospinal fluid (CSF) signal and applied a bandpass filter (0.01–0.1 Hz) to reduce noise.
In our proposed method, an atlas with 90 ROIs was applied to divide the cerebral cortex into 14 GM networks, and each GM network contained several subregions [28]. In addition, the WM was divided into 48 bundles [29]. Moreover, another atlas with 333 GM ROIs [30] was used to construct a signal-layer FCN based on classical Pearson correlation coefficient, since some works indicated that FCNs generated by atlases with more ROIs tend to achieve better performance in individual recognition [3]. Two atlases were used in individual identification to substantiate the reliability of this statement and test the sensitivity of our recognition results.
2.2 Multilayer Network Construction
Many studies have shown that the human brain performs a specific function by working cooperatively in multiple brain areas [15]. Therefore, considering that the brain is composed of many complex functional networks and integrally modeling physiological processes, a three-layer FCN of multiple brain regions is constructed based on fMRI data. These three-layer networks are not independent but are closely connected between each layer. This suggests that the view of the whole brain contributes to the functional process. The specific construction methods are as follows.
In the first layer, a sparse linear regression algorithm is used to obtain a hypergraph of 14 functional networks of the cerebral cortex and this algorithm will be introduced in detail in Section 2.3. Through this algorithm, an incidence matrix H is constructed with a size of 14 × 14, which includes 14 hyperedges and 14 nodes. There are 14 nodes, which represent 14 GM networks and 14 hyperedges, which are constructed by setting each node respectively as a central node. The row vector (a hyperedge) in the incidence matrix H represents the high-order association between a certain GM functional network and the 13 other networks in brain activities. The 14 GM networks are constructed in the same way, so there are 14 row vectors in the incidence matrix H, which is used as the Layer 1 map, as shown in Fig. 1a.
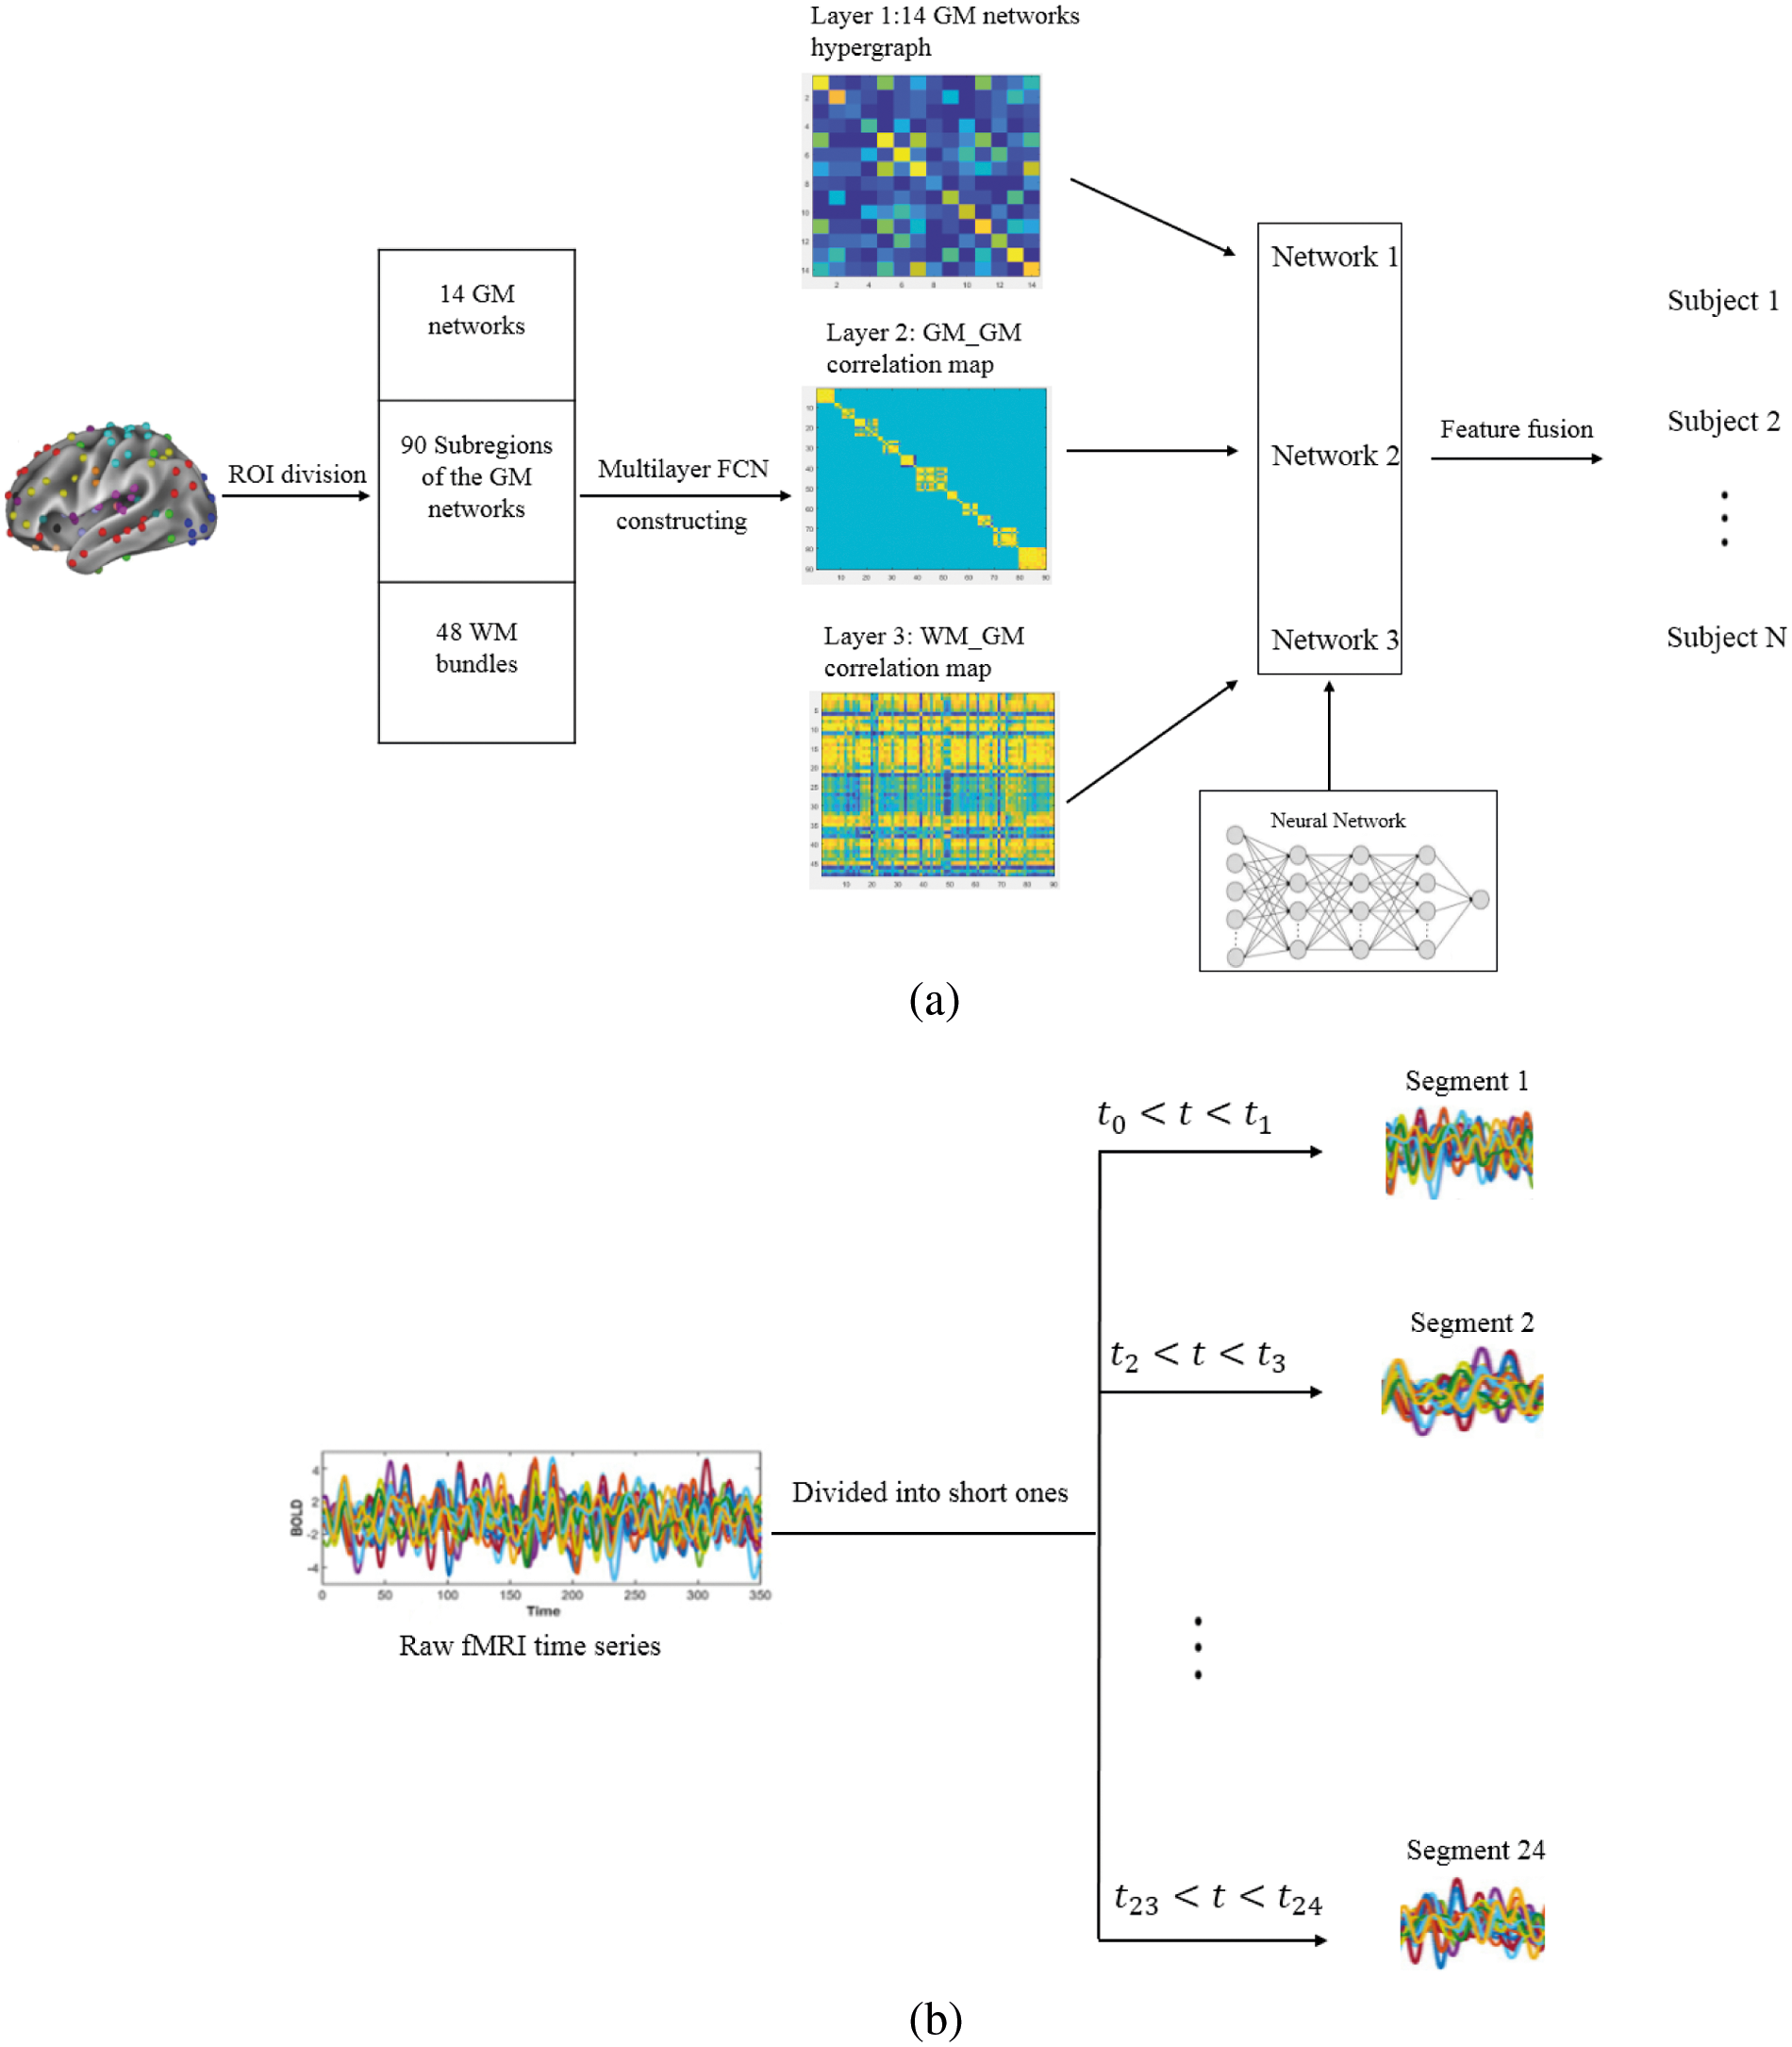
Figure 1: (a) An overview of the construction method of the multilayer FCN (Layer 1: GM networks hypergraph, Layer 2: GM_GM correlation map, Layer 3: WM_GM correlation map). A multimodal CNN (including three networks. Network 1: input map size is 14 × 14, 2 convolutional layers with 3 × 3, 196 output features; Network 2: input map size is 90 × 90, 4 convolutional layers with 5 × 5, 32400 output features; Network 3: input map size is 48 × 90, 3 convolutional layers with 3 × 3, 1080 output features) is applied to learn the three-layer FCN of each individual and realize individual identification. (b) 24 segments of the raw fMRI time series
In the second layer, each GM network in the first layer is divided into subregions, and the 14 GM networks obtain a total of 90 ROIs. We calculated the correlation map based on the subregions of each GM network separately. For example, the first GM network is the anterior salience network, which contains 7 ROIs. For every two ROIs, we calculate the Pearson correlation coefficient and use a 7 × 7 matrix to place 49 paired correlation coefficients. Finally, to obtain a square matrix, including all the correlation maps of each GM network’s subregions, 14 FC matrices corresponding to 14 GM networks are connected diagonally to form a large matrix as the second-layer map. Since the map of the second layer has values only in the area along the diagonal, the rest of the areas are zero, so the map of Layer 2 shown in Fig. 1a, is empty except for the area along the diagonal.
In the third layer, because the overall WM is divided into 48 bundles, a correlation map is calculated based on 90 subregions of each GM network and 48 WM bundles. Each WM bundle is functionally connected to 90 GM ROIs through the Pearson correlation coefficient. Finally, a correlation map with a size of 48 × 90 is obtained as the layer 3 map shown Fig. 1a.
Usually, a hypergraph is represented by G = (V, E, W), where V is a set of vertices, {v1,
The sparse linear regression algorithm (i.e., Lasso) is applied to calculate the hypergraph incidence matrix. For N GM networks, N hyperedges are constructed, each of which is centered on one of the N GM networks. The algorithm for constructing a hyperedge is as follows [13]:
where xi is the average fMRI time series of the i-th GM network, Ai = (x1,…, xi−1, xi+1,…, xN) is the set of other N − 1 networks except for the i-th network, αi is the coefficient vector representing the sparse linear relationship between the i-th network and other N − 1 networks and λ is a regularization parameter that can control the sparsity of the solution. A total of 14 GM networks are involved in the specific calculations. For example, when the first network is regarded as the central node, xi represents the fMRI signal corresponding to the first network, denoted as x1, and Ai is a matrix composed of the signals represented by 13 networks except x1 (from x2 to x14 in the order of subscripts, the network corresponding to each subscript is the same in each hyperedge), denoted as A1. In addition, α1, which is obtained by Eq. (2), contains 13 high-order correlation coefficients from the 2nd to the 14th network with the first network. Each network does the same above operations and finally 14 different αi vectors are obtained. On this basis, it must be noted that when each network is used as the central node, the coefficient of its corresponding position is set to 0. For example, if the first network is used as the central node to calculate α1, an element 0 is inserted at its first index position to obtain a 14-dimensional vector as the first hyperedge. The purpose of inserting element 0 in each vector αi is to make the coefficients of the hyperedge vector of each central node correspond to the same network at the same index position. Therefore, 14 high-order correlation coefficient vectors correspond to 14 hyperedges. Then, these 14 vectors are arranged in rows to obtain the 14 × 14 incidence matrix H.
Considering that the brain is composed of many complex functional networks and models physiological processes integrally, a three-layer FCN is constructed based on the fMRI data of multiple brain regions. These three layers are not independent but are closely connected between each layer, which suggests that the view of the whole brain contributes to the functional process.
The basic composition of a neural network includes an input layer, a hidden layer, and an output layer. The characteristic of CNN is that the hidden layer is divided into a convolutional layer and a pooling layer. The convolutional layer extracts the local area feature by shifting the convolution kernel block by block on the original image. This approach strengthens the continuity of picture information so that neural networks can better capture the overall characteristics of the map instead of focusing on a single pixel.
The main steps of training a CNN model are as follows:
1). Input-layer: a(0) is the set of input image pixels.
2). Forward propagation:
3). Back propagation:
4). Parameter update:
In addition, different loss functions are used for the classification and regression of the output features of CNN. The loss function in classification is:
The loss function in the regression is:
where n represents the number of classification categories and m represents the number of features for regression prediction.
A three-layer map is constructed from the fMRI data of each individual. A multimodal CNN algorithm is employed to make these three-layer maps simultaneously participate in the identification process. As shown in Fig. 1a, the CNN extracts the feature map of the input image through a two-dimensional convolution, reduces the dimensionality of the feature map through downsampling, and extracts the most representative feature vector through repeated convolution and dimensionality reduction operations. Finally, these features are fused through the fully connected layer, and feature classification is performed through the classifier to achieve individual identification.
Fig. 2 shows the summary statistics for the individual recognition accuracy of the proposed method and a classical FCN with only one layer. To capture the dynamic process of the resting state, all 1200 frames of each subject were divided into 24 temporal segments without overlap [2], and this process is displayed in Fig. 1b. From this process, more data samples can be obtained so that machine learning has more training volume. We adopt the idea of voting to ensure the stability of the algorithm. The highest voting probability of 24 detections is set as the final recognition result. Following the experimental protocol of Finn et al., rest1 sessions of 100 subjects are used for training and rest2 sessions of each subject are used for testing to recognize individuals. As the blue bars shows in Fig. 2a, the individual identification accuracy of the proposed method achieves 84% for 50 subjects. Under the same experimental conditions, the accuracy achieved by using a single-layer FCN with 333 ROIs is 72%. It can be readily appreciated that the proposed multilayer FCN significantly outperform the competing methods. In addition, the orange bars show the results of one segment of two methods. From these data, we can see that the classical one-layer FCN using the 333-ROI mask has a higher accuracy without a dynamic process; however, the final individual identification accuracy is lower than our proposed method. This result shows that the prediction consistency of the individual samples using the mask with more ROIs is relatively high.
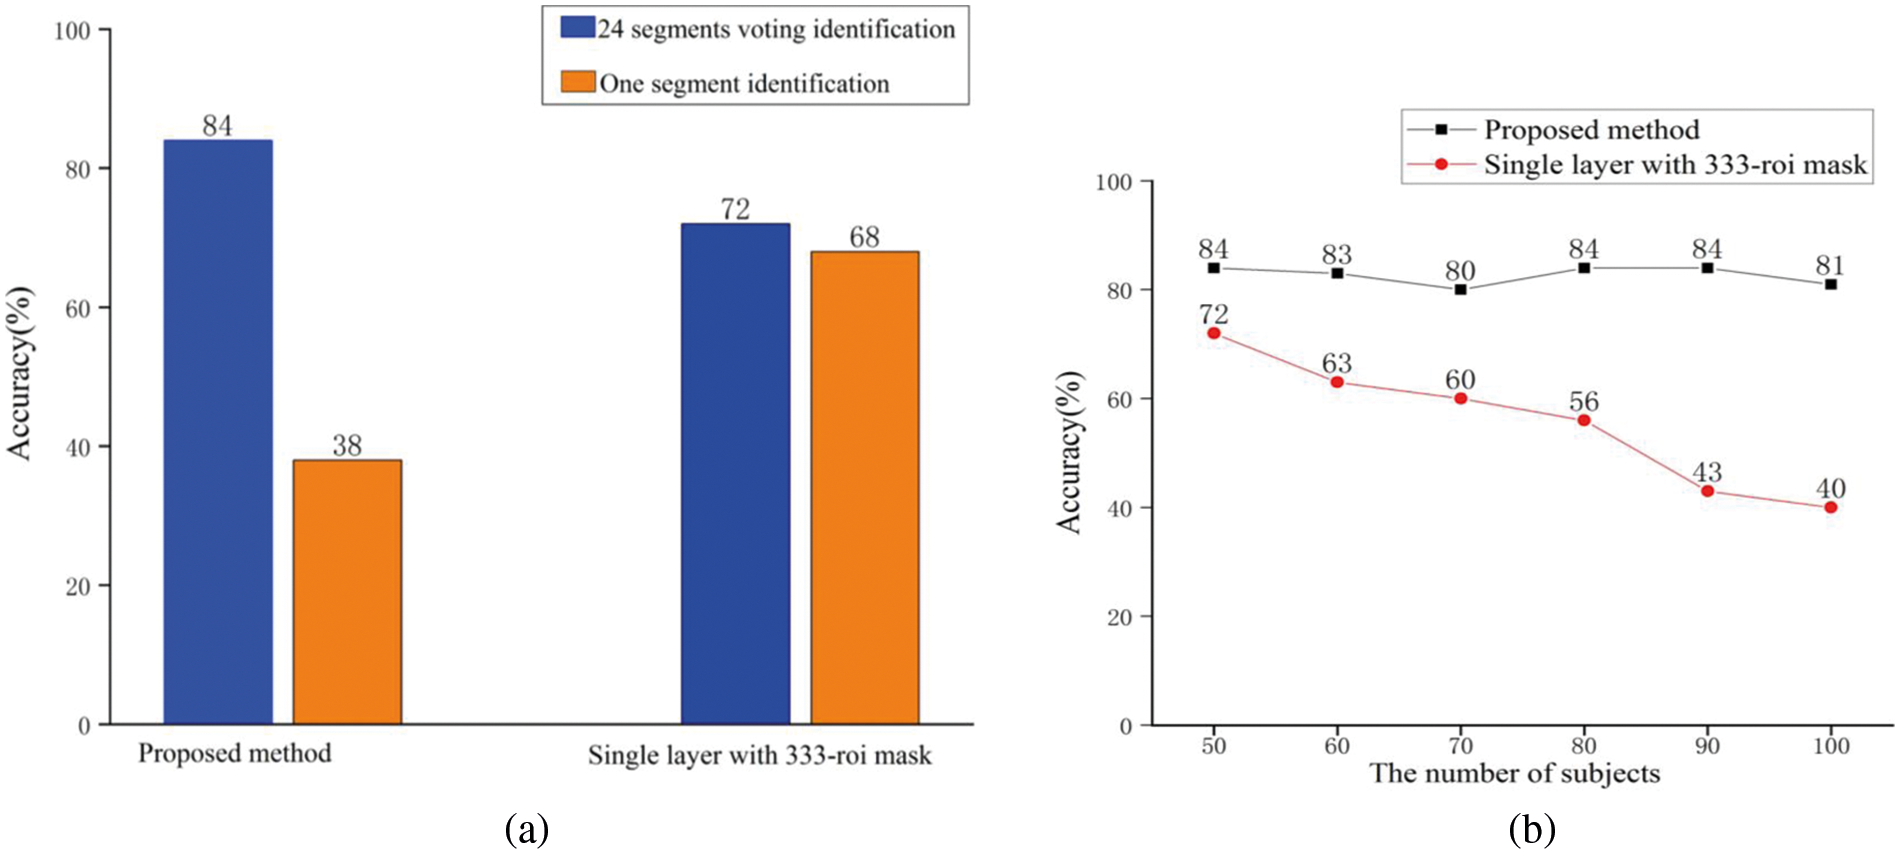
Figure 2: (a) The individual identification accuracy of 50 subjects for the multilayer FCN and classical single-layer FCN (the single-layer FCN is constructed with 333 ROIs templates). The blue bars represent the result of 24 dynamic segments voting identification accuracy, and the orange bars represent the result without voting. (b) Test of identification accuracy with the number of subjects gradually increases. The black line represents the method we proposed, and the red line represents the method using the 333 ROIs mask
Typically, the difficulty of individual identification increases as an increasing number of subjects are involved in testing, which may also lead to a decline in the identification accuracy. Therefore, in Fig. 2b, under the same experimental conditions, we compared the performance of the two methods on the accuracy of individual identification when the number of individuals gradually increases. It can be seen from the figure that the identification accuracy of the proposed method declines slightly as the number of individuals increases, but the overall trend is stable. However, as the number of individuals increases, the recognition accuracy of the method based on the 333-ROI mask drops significantly.
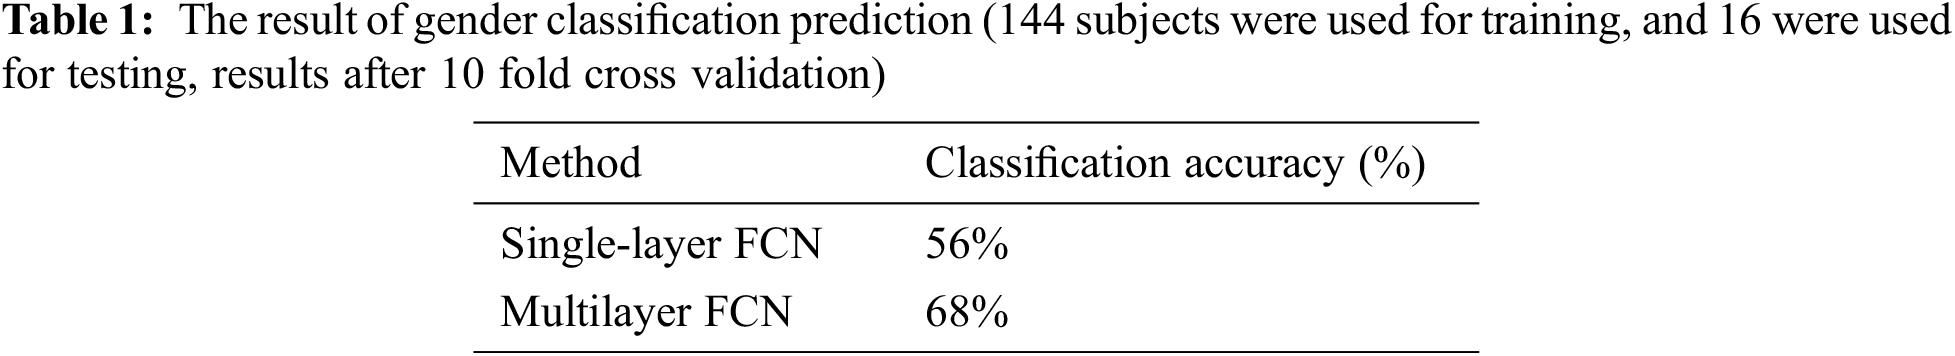
Many researchers hope that the individual differences in the brain function explicate the differences in individual behavior and cognitive performance (such as intelligence, gender, and age) [3,31]. Tab. 1 shows the comparison of the results of gender classification through a multilayer network and a single second-layer network (FCNs constructed from GM). The results of the multilayer network are better than those of the single GM network, which shows that the multilayer network is better than the single GM network in predicting individual gender.
3.3 Discriminative Functional Networks and ROIs
Every area in the atlas does not contribute equally to individual identification. This section aims to identify key hyperedges and functional connections that play a significant role in individual identification from the whole multilayer network. The CNN assigns corresponding weights to each pixel in the map when performing the feature extraction step. This weight is constantly adjusted during the training process, and pixels with larger final weights represent their significant role in individual recognition. Fig. 3 shows three weight maps of each layer extracted in the proposed multilayer FCN. Three maps are thresholded and just show the top 20% hyperedges and connections with larger weights. These three weight maps show the functional connection of the ROIs and GM networks that play an important role in individual recognition.
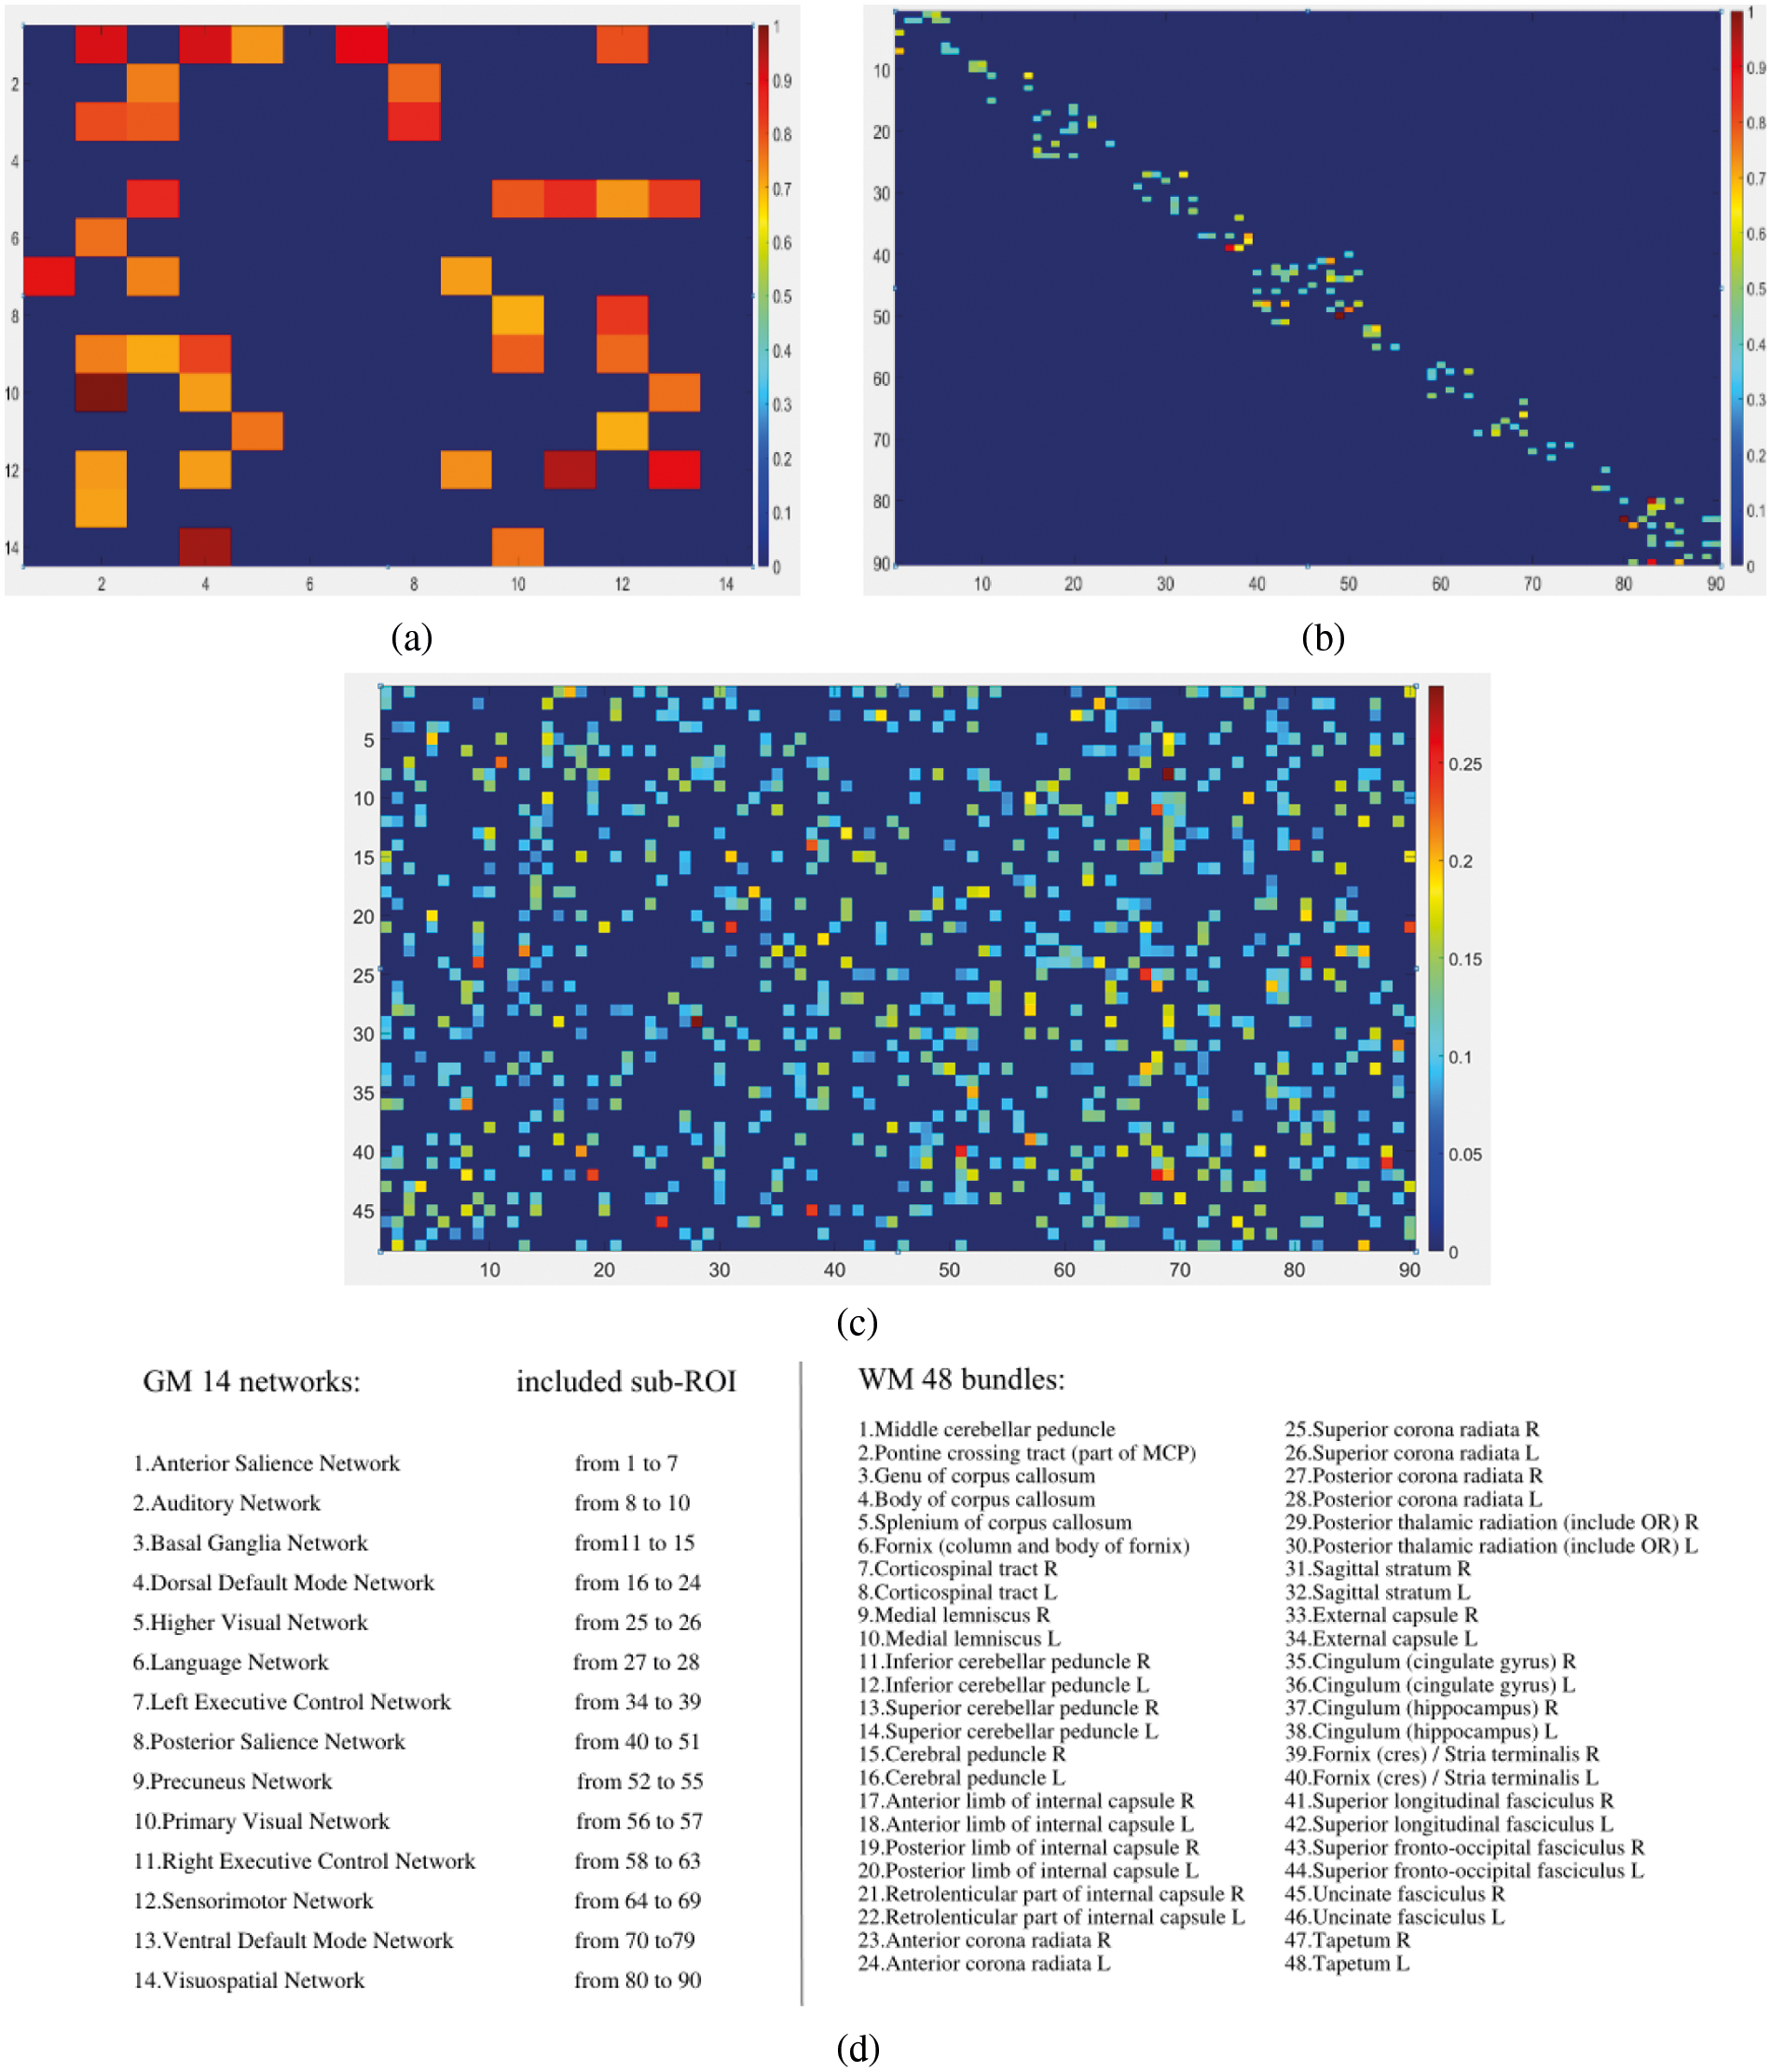
Figure 3: The three input layers’ weight maps assigned by CNN when performing feature extraction step that show the top 20% hyperedges and connections with larger weights. (a) The weight map of the first layer (hypergraph constructed by GM 14 networks. (b) The weight map of the second layer (GM-GM layer). (c) The weight map of the third layer (GM-WM layer). (d) The left: the labels and names of 14 GM networks, the labels of each GM network's sub-ROI; the right: the labels and names of 48 WM bundles
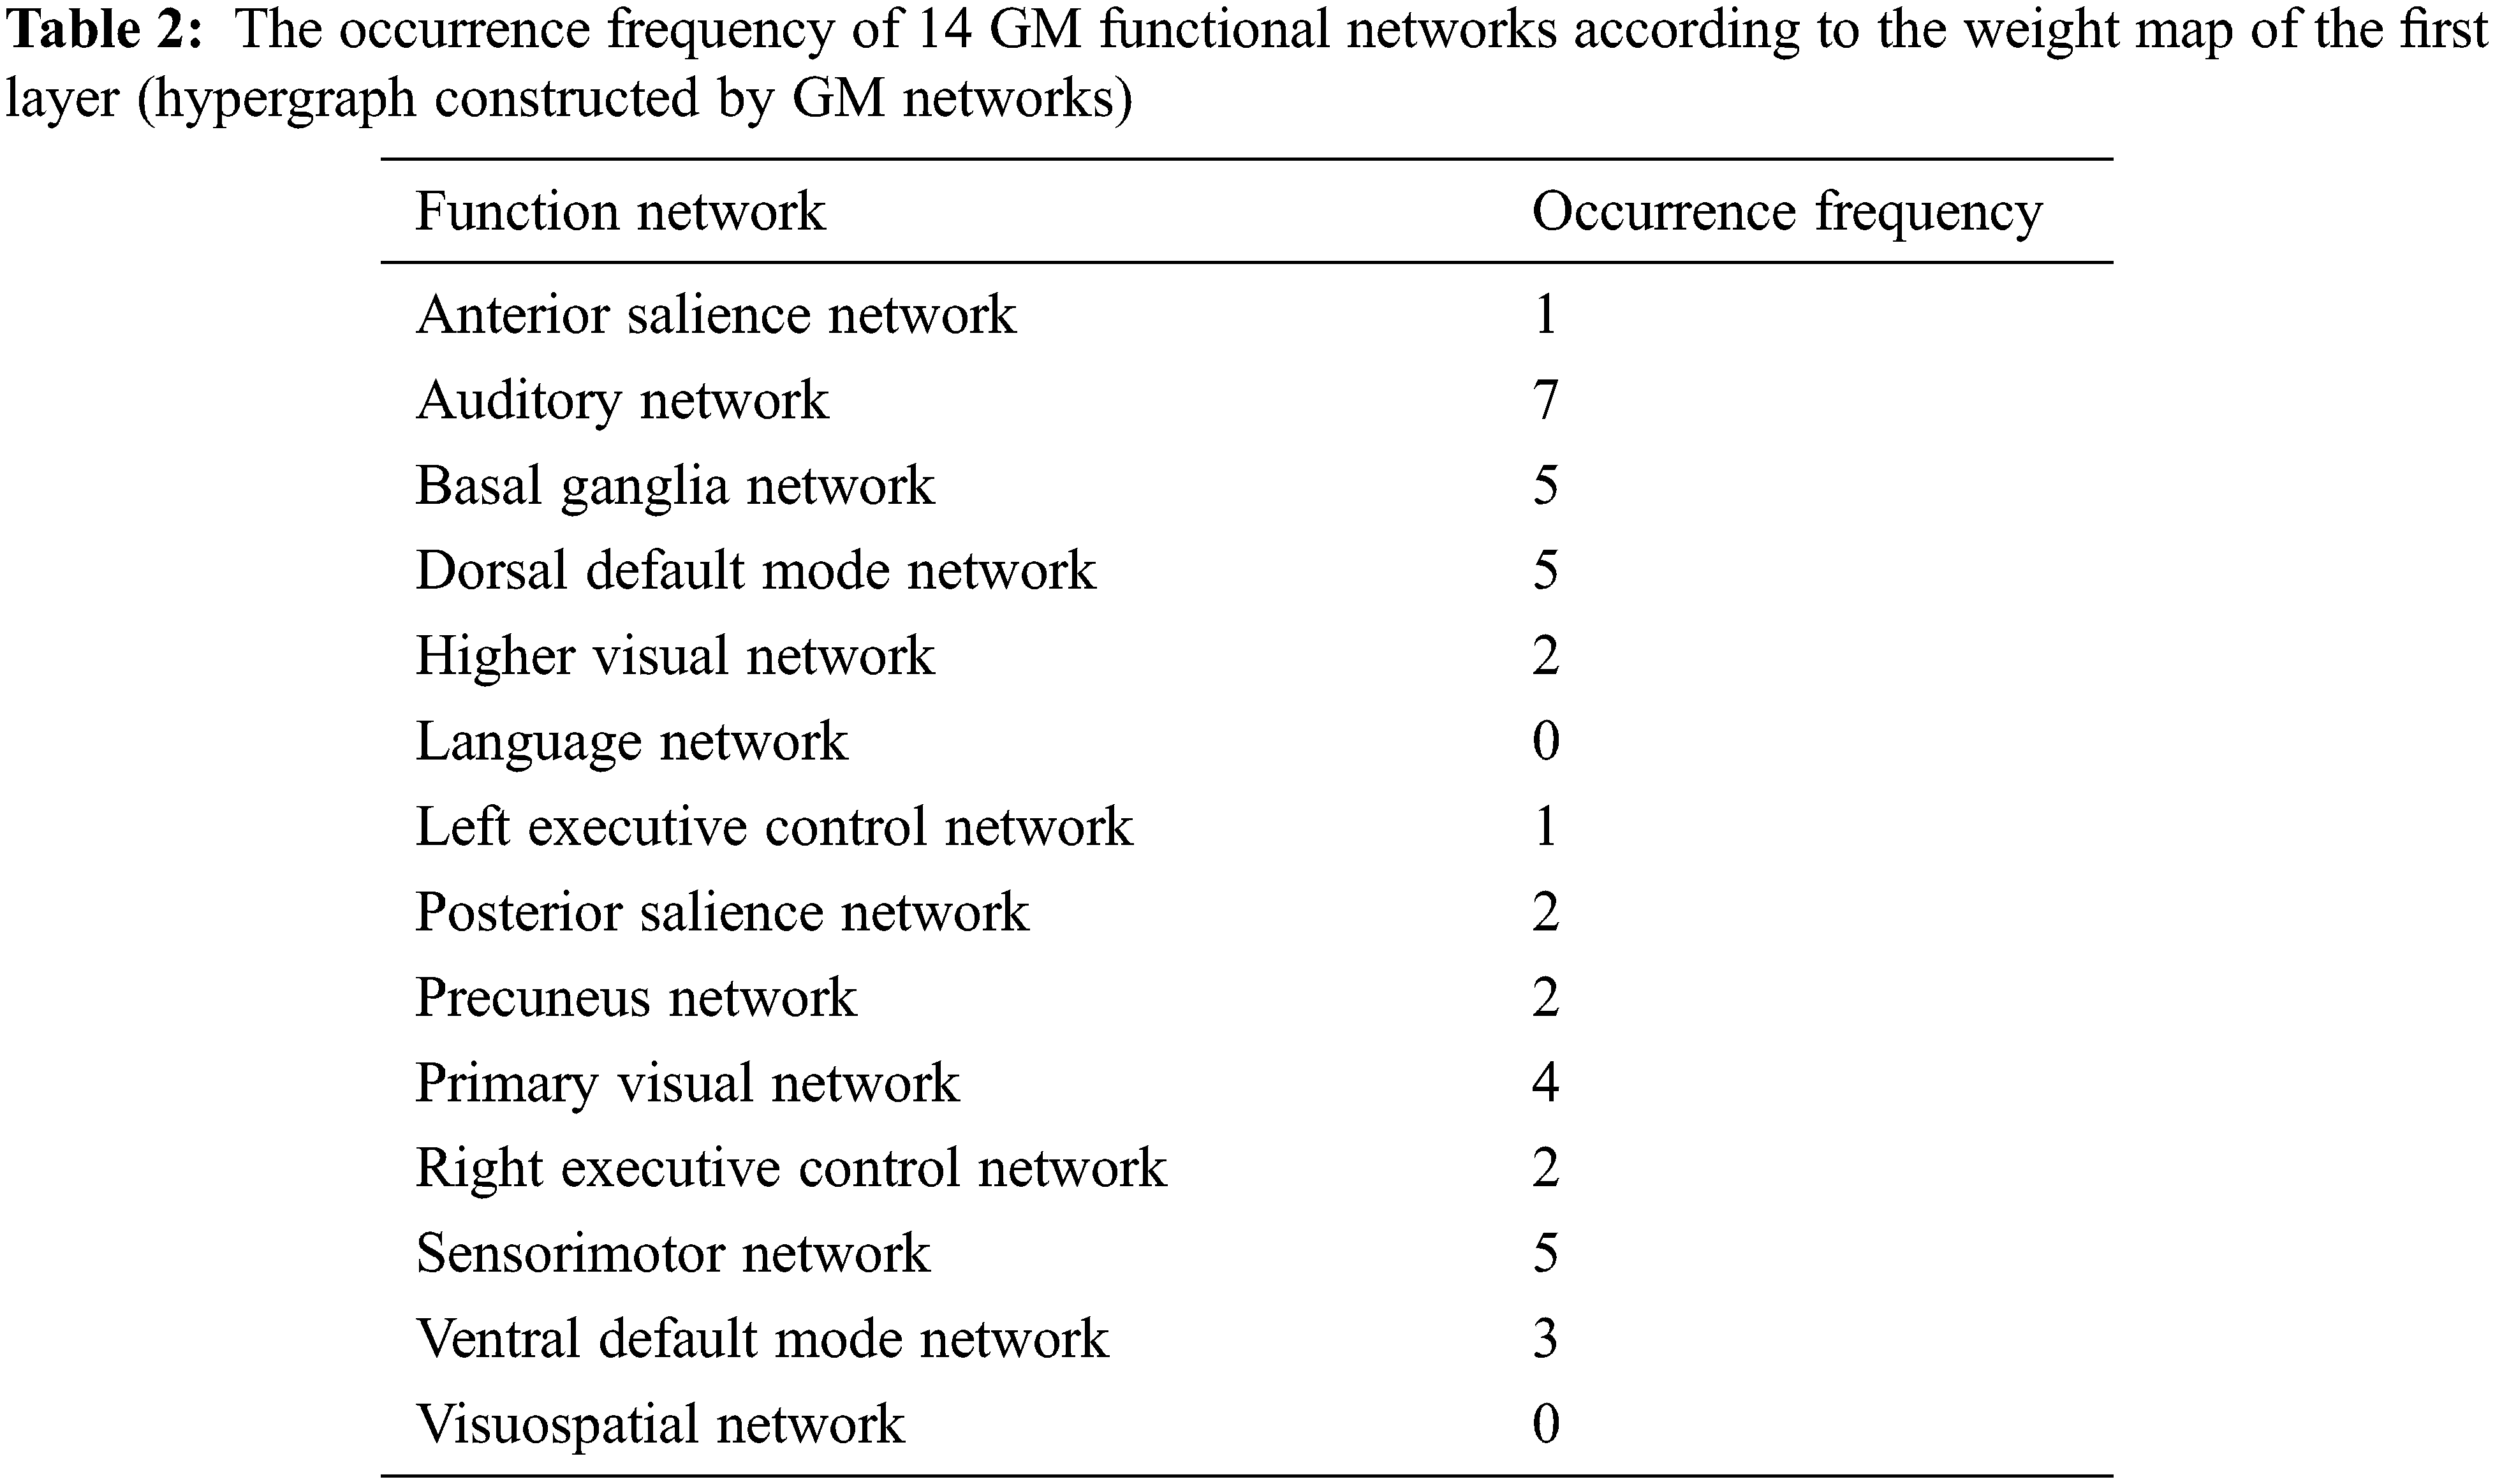
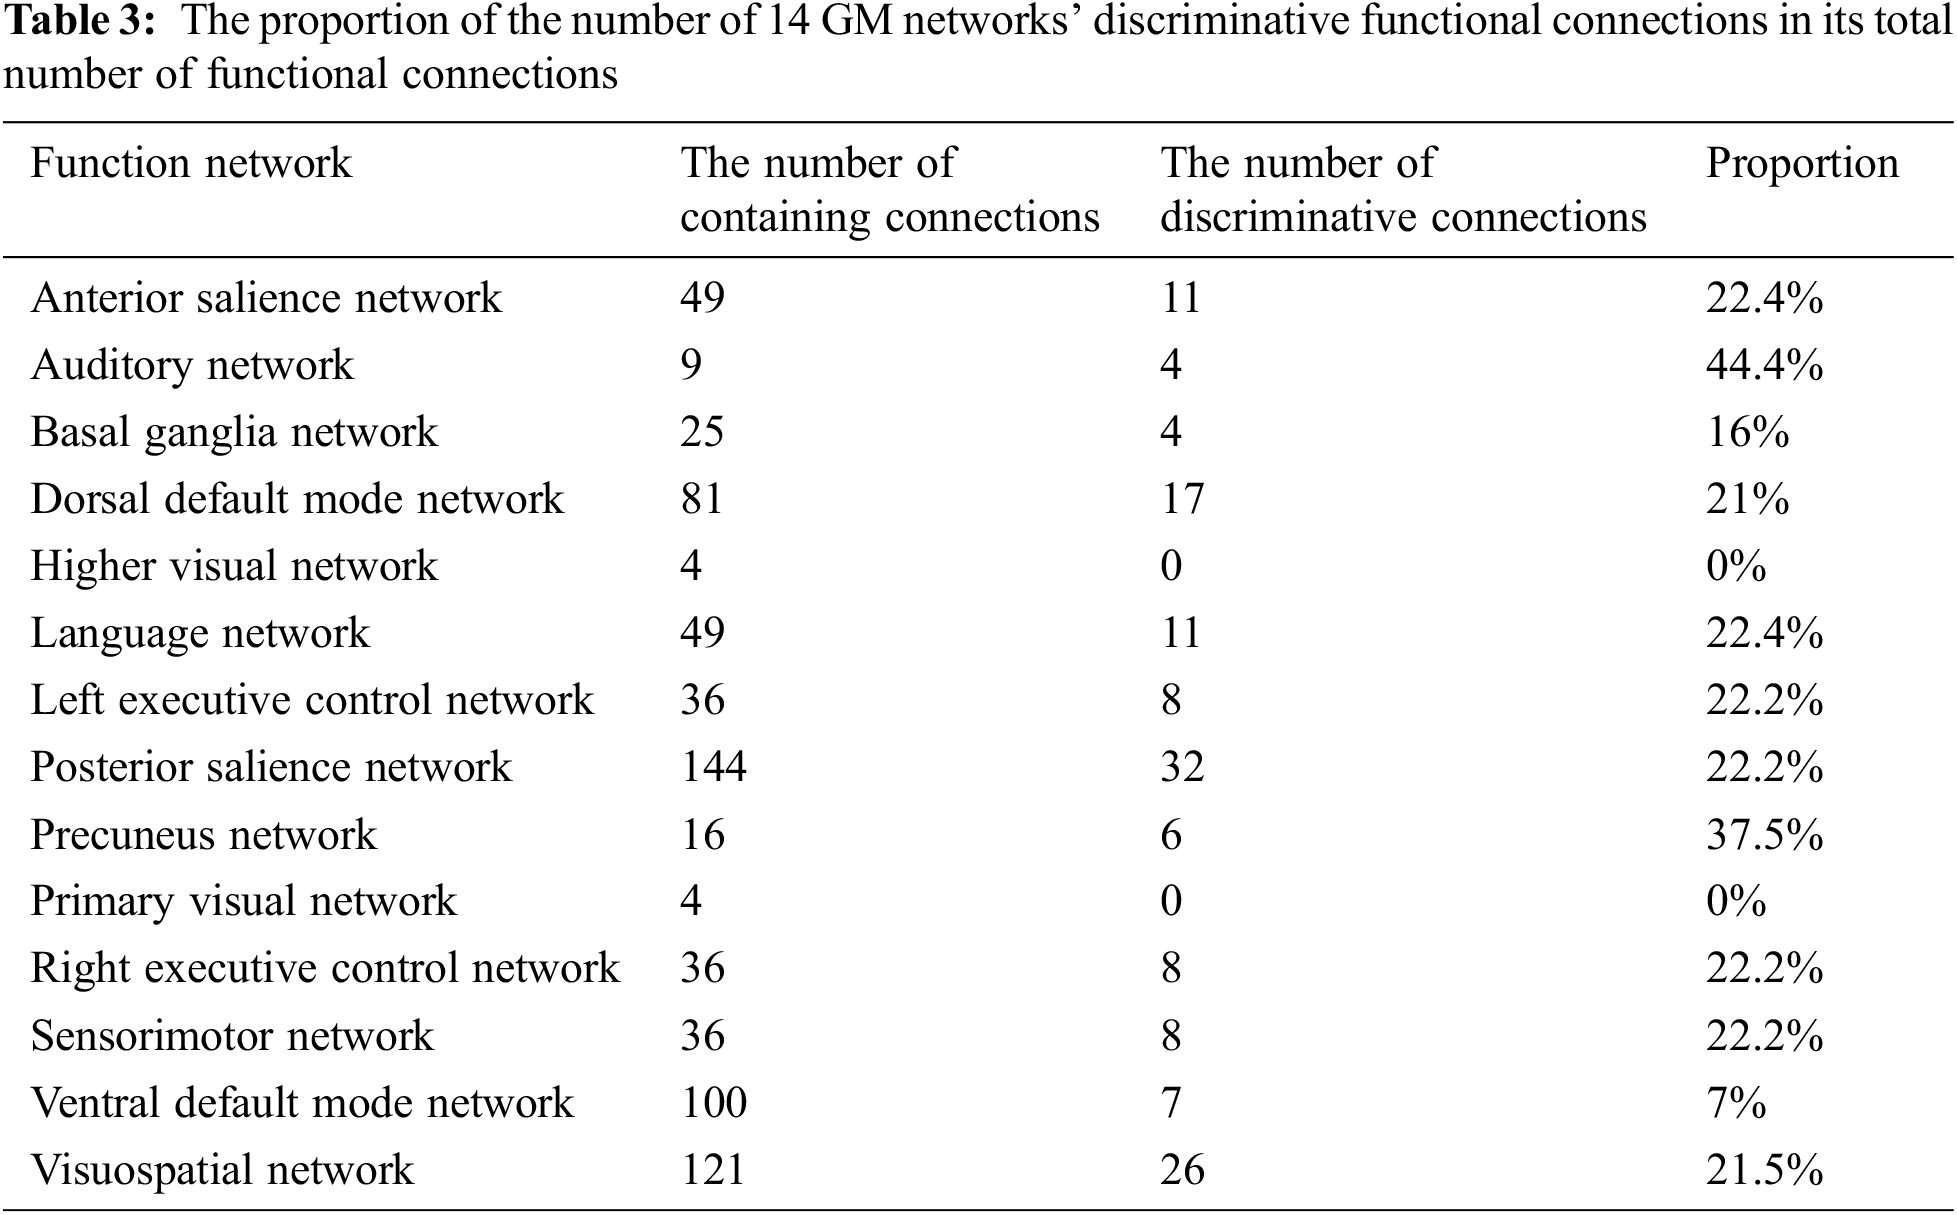
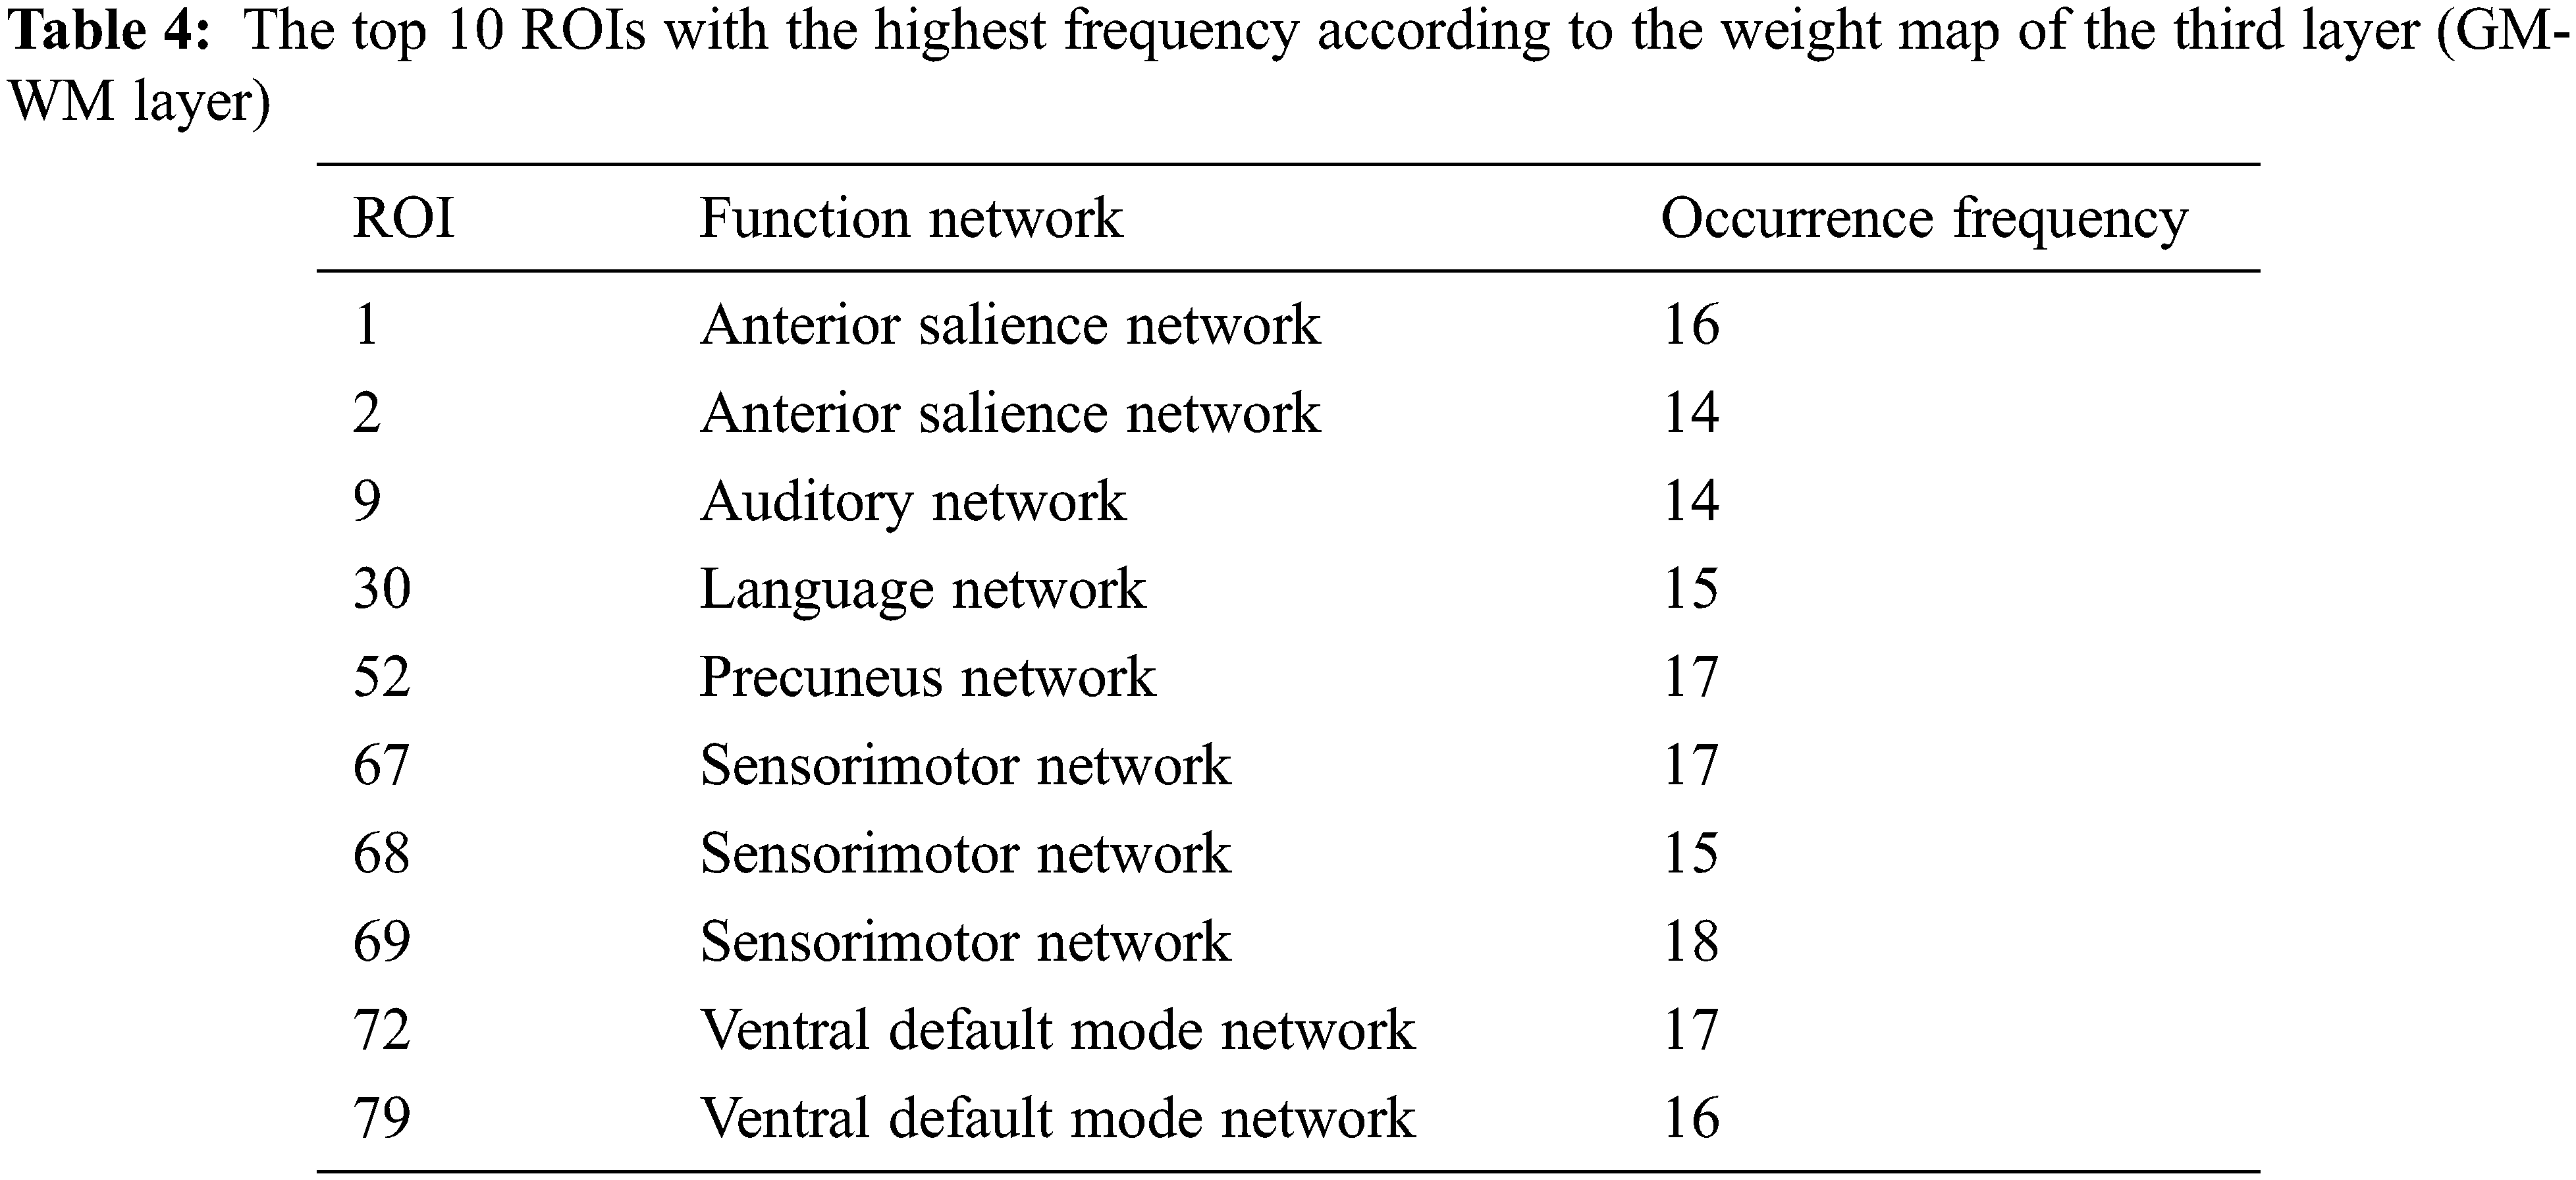
Tab. 2 shows the occurrence frequency of 14 GM functional networks according to the weight map of the first layer (hypergraph constructed by GM networks). The auditory network, basal ganglia network, dorsal default mode network and sensorimotor network are the top four networks. Tab. 3 shows the number of functional connections contained in each GM network according to the weight map of the second layer (GM-GM layer). Meanwhile, the proportion of the number of each network’s discriminative functional connections in its total number of functional connections is regarded as an index to compare the discriminability of each network. The auditory network is found to be the most prominent network in the second layer. Tab. 4 shows the top 10 ROIs with the highest frequency according to the weight map of the third layer (GM-WM layer), and three of them belong to the sensorimotor network that corresponds with the results of Tab. 2. It is worth noting that the auditory network is the most discriminative functional network according to the results of Tabs. 2 and 3, and one of the top 10 discriminative ROIs with the highest occurrence frequency belongs to the auditory network shown in Tab. 4.
This section shows the performance of our proposed method on individual fluid intelligence prediction. The HCP dataset provides the performance scores of each individual on the three intelligence tests (PMAT24_A_CR, PMAT24_A_SI, and PMAT24_A_RTCR) [27]. These three scores were integrated into one comprehensive score that serves as the individual’s fluid intelligence parameters through dimensionality reduction by PCA. Data from 160 subjects are used in this experiment, of which 100 are used for training and 60 are used for testing. As shown in Fig. 4a, the correlation between the predicted data and real data of 60 subjects is analyzed by linear regression. As a comparison, a signal-layer FCN that only involves 90 GM regions is extracted separately for experimentation. Fig. 4b shows the linear regression of fluid intelligence parameters of the same 60 subjects as Fig. 4a. Comparing Fig. 4a with Fig. 4b, the performance of the multilayer FCN in intelligence prediction is better than that of the single-layer FCN (the second layer in the multilayer FCN).
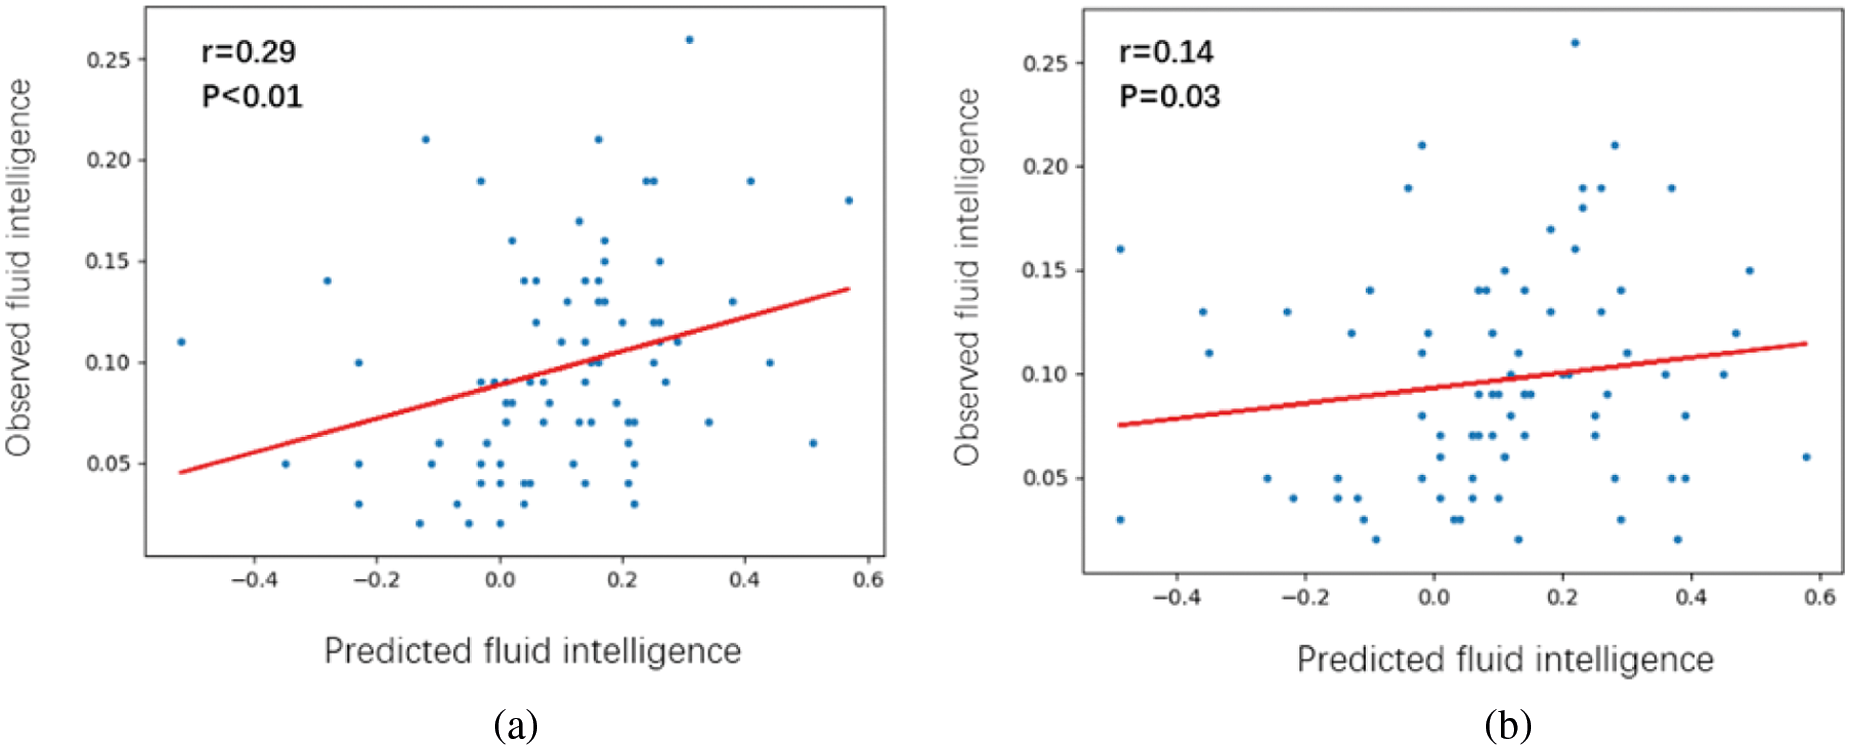
Figure 4: Linear regression between observed fluid intelligence and predicted fluid intelligence scores. (a) For the multilayer FCN. (b) For the single-layer FCN (GM-GM layer)
3.5 Long Interval Retest Performance
Some researchers have stated that a major concern of fMRI data is the test-retest reliability. Even if fMRI data are collected from the brain of the same person, the similarity of collected data may be low due to the long time interval between scans [32,33]. As mentioned earlier, training and test data used in individual identification are collected by individuals at two different scans, but the interval between two scans is only one day. A reliable method should have a high individual recognition accuracy not only when using data with a short collection time interval but also when the time interval is longer. Therefore, in this section, the purpose of this experiment is to emphasize the performance of individual recognition when the data collection interval is more than one month.
The retest data of some subjects provided by the HCP are used to perform this experiment. There is a long time interval between the collection time between retest data and the previously used rest1 or rest2 data, while rest1 and rest2 are only one day apart [27]. The three types of data (rest1, rest2 and retest data) from 20 subjects were used for the experiment. The results of the experiment are shown in Fig. 5. Three groups (rest1-rest2, rest1-retest, and rest2-retest) were combined as training and test sets to obtain the accuracy of individual identification. Different groups of training and test sets show stable final individual recognition accuracy. This result proves that the length of the data collection interval does not make a negative influence in the proposed method when performing individual identification.
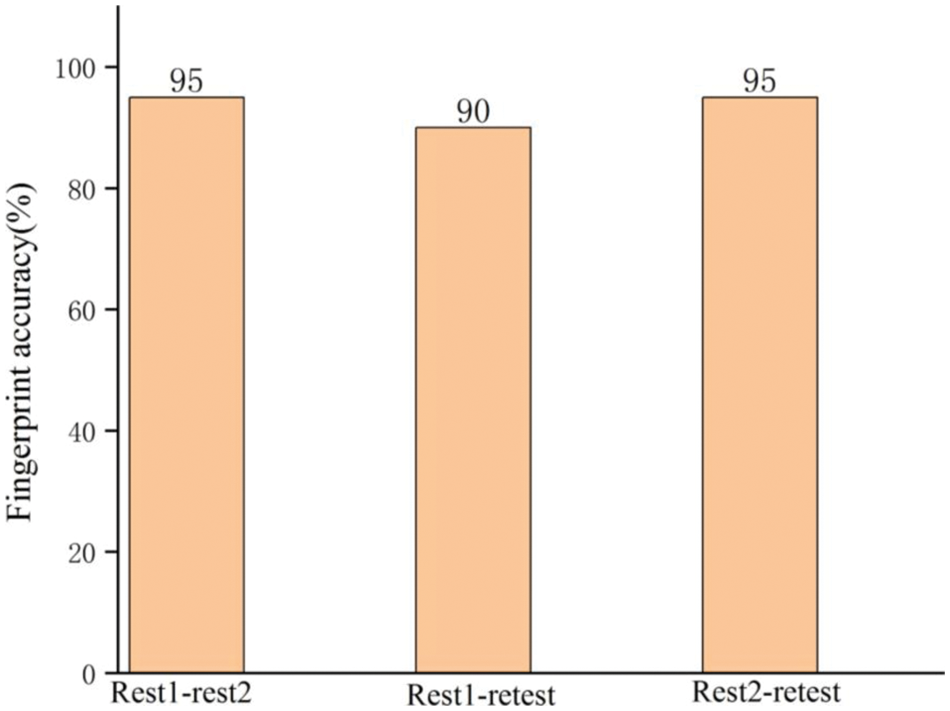
Figure 5: Individual identification performance for data with a long collection time interval between training and test data, which is compared to data with a short time interval (short time interval (one day): rest1-rest2; long time interval (more than a month): rest1-retest and rest2-retest)
4.1 The Construction Method of the Multilayer FCN in Individual Identification
This work investigates individual difference that are identified through fMRI signals in the physiological activities of different individuals and evaluate the differences in individual cognition. Since the human brain is an extremely complex system with high time and dimensional complexity, the multilayer network can better model cognitive information processing and learning mechanisms of the brain compared with the single-layer network. Therefore, the multilayer network is designed to use three levels of GM and WM to learn individual functional structures in the resting-state FCN. The first layer is a hypergraph constructed by 14 gray networks to characterize the high-order relation among gray matter networks. The second layer, a correlation map based on subregions of each gray matter network, aims to reflect local functional interactions between regions of each functional network. In the third layer, a correlation map between WM and GM reflects the function of white matter for transmitting information for gray matter networks. The proposed multilayer network provides a novel method of integrating connection features of the whole brain and shows that combining GM and WM leads to improved prediction performance over the GM network alone. It also suggests that the function of WM contributes to individual cognition differences in addition to the difference in WM anatomical structure.
This is the first time that multiple functional interaction patterns in the brain have been constructed as a multilayer network. Meanwhile, this is the first attempt to show that identifying individuals can benefit from the incorporation of information from fMRI signals in WM. Moreover, the individual variability of the whole brain multilayer FCN is related to individual differences in fluid intelligence and gender. Moreover, the individual differences in the FCN remain stable across months to years.
4.2 The Relationship Between Individual Identifiable Information and Behavioral Differences
The unique and reliable individual multilayer FCN difference was obtained by the multimodal CNN from a group of subjects. This difference is used as a preliminary analysis of the relationship between an individual identity and behavior to predict their gender and intelligence using the features extracted in brain fingerprints. Fan et al. showed that dynamic FC features of gray matter regions were strongly associated with individual intelligence and sex [34]. In contrast, the work of gender classification and fluid intelligence regression in this paper suggests that FC between WM and GM may have a certain role in individual differences in fluid intelligence and gender. However, whether the difference between individual brain fingerprints and cognition comes from the development of the physiological structure of the brain requires comprehensive analysis using more data and cognitive quantitative parameters.
According to the gender classification and fluid intelligence regression experimental results in Sections 3.2 and 3.4, the multilayer FCN has better performance than the single-layer GM FCN (the second layer in the multilayer FCN). However, the linear regression correlation between our fluid intelligence prediction data and real data is not better than other experiments. This may be caused by the limited 160 subjects for training and testing in our regression prediction experiment while other researchers mostly used the data of approximately 1000 cases. However, under the same experimental conditions, our method obtained a higher linear correlation than the classical single-layer FCN.
4.3 The Role of Auditory and Sensorimotor Networks in the Cognitive Process
According to the experimental results in Section 3.3, auditory and sensorimotor are two major GM functional networks that play the most critical role in the identification of individuals, which is consistent with two frontoparietal networks identified by Finn et al. [1]. First, listening and language are important sensory functions possessed by humans and animals and are the basic approach to perceiving and obtaining information about the natural environment. The sounds emitted by humans in language communication enter the ears and are then received, transformed, conducted, comprehensively processed by the auditory system and finally understood in multiple cortical areas [35]. At the same time, the auditory network also involves a large amount of information. Some articles have been devoted to studying the information flow of the auditory network. The motor and somatosensory functional networks are produced to control our movement in the external environment. Cognitive neuroscience has discovered that the sensorimotor brain regions used to control our bodies are involved in the perception of other people’s behaviors, feelings, and emotions. There is a certain mapping between the sensory and sensory performance of actions, feelings, and emotions in the brain [36]. These results suggest that the coupling between auditory and motor networks may be the most important part of the large-scale coordination of the brain activity and cognitive process.
4.4 Future Directions for the Construction of Multilayer FCNs and Multimodal CNNs
In this work, the three levels in the multilayer FCN are: the hypergraph constructed by 14 GM networks, the correlation map of the subregions of each GM network, and the correlation map between the GM and the WM. The experimental results in Section 3.1 show that the performance of multilayer FCN in individual recognition is better than that of the single-layer GM FCN. However, there is still great improvement potential for multilayer FCNs. Other areas of the brain that play an important role in the cognitive process or functional connections at different levels to be involved in the construction of multilayer networks may be discovered in the future. For example, subcortical area has recently been used in the study of many clinical cases, and it may play an important role in cognitive processes. However, due to the failure to establish a suitable functional connection, it has not been applied in the construction of our multilayer FCN. On the other hand, when constructing a multilayer network for different levels of FCNs, it is necessary to consider the temporal and spatial correlations among different levels, as well as the different importance in cognitive processes of the brain. Due to the lack of relevant research support, studies have not considered these factors in practice.
In addition, individual identification is realized through a machine learning algorithm called multimodal CNN, which can simultaneously extract features from three layers and then fuse the extracted features. However, the importance of different layers in the multilayer FCN is distinct in individual identification. This multimodal CNN only performs a simple fusion of the features extracted from the different atlases, which makes the different layers equally important to the final individual recognition result. Therefore, a machine learning approach that takes differences at different levels of a multilayer network into account, such as the feature pyramid networks used for object detection, may yield better results [37]. In this way, the accuracy of individual identification may be further improved.
In this paper, brain regions involved in cortical and neuropathways are exploited to construct a multilayer FCN, yielding higher and stable individual recognition across months comparing with the FCN fingerprint that only involves GM. Besides, it can be found that using a template that divides more ROI is not the best way to improve the accuracy of individual identification. These findings suggest that comprehensive network connectivity of the whole brain need to be considered for evaluation of the brain. In summary, the multilayer network has a higher degree of explanation for the complex human brain system, which is significant for explaining individual behavioral differences.
Funding Statement: This work was funded by National Natural Science Foundation of China (Grant No. 81901828).
Conflicts of Interest: The authors declare that they have no conflicts of interest to report regarding the present study.
1. E. S. Finn, X. Shen, D. Scheinost, M. D. Rosenberg, J. Huang et al., “Functional connectome fingerprinting: Identifying individuals using patterns of brain connectivity,” Nature Neuroscience, vol. 18, no. 11, pp. 1664–1671, 2015. [Google Scholar]
2. S. Chen and X. Hu, “Individual identification using the functional brain fingerprint detected by the recurrent neural network,” Brain Connectivity, vol. 8, no. 4, pp. 197–204, 2018. [Google Scholar]
3. S. Mansour, Y. Tian, B. T. T. Yeo, V. Cropley and A. Zalesky, “High-resolution connectomic fingerprints: Mapping neural identity and behaviour,” NeuroImage, vol. 229, Article ID 117695, pp. 1–15, 2021. [Google Scholar]
4. B. Cai, G. Zhang, A. Zhang, L. Xiao, W. Hu et al., “Functional connectome fingerprinting: Identifying individuals and predicting cognitive functions via autoencoder,” Human Brain Mapping, vol. 42, pp. 2691–2705, 2021. [Google Scholar]
5. Z. Yang, X. Li, J. Zhou, X. Wu and Z. Ding, “Functional clustering of whole brain white matter fibers,” Journal of Neuroscience Methods, vol. 335, Article ID 108626, pp. 1–10, 2020. [Google Scholar]
6. J. Wang, Z. Yang, M. Zhang, Y. Shan and D. Rong, “Disrupted functional connectivity and activity in the white matter of the sensorimotor system in patients with pontine strokes,” Journal of Magnetic Resonance Imaging, vol. 49, no. 2, pp. 478–486, 2019. [Google Scholar]
7. D. Abramian, M. Larsson, A. Eklund, I. Aganj, C. F. Westin et al., “Diffusion-informed spatial smoothing of fMRI data in white matter using spectral graph filters,” NeuroImage, vol. 237, Article ID 118095, pp. 1–17, 2021. [Google Scholar]
8. Z. Ding, Y. Huang, S. K. Bailey, Y. Gao, L. E. Cutting et al., “Detection of synchronous brain activity in white matter tracts at rest and under functional loading,” Proceedings of the National Academy of Sciences, vol. 115, no. 3, pp. 595–600, 2018. [Google Scholar]
9. M. Peer, M. Nitzan, A. S. Bick, N. Levin and S. Arzy, “Evidence for functional networks within the human brain’s white matter,” the Journal of Neuroscience, vol. 37, no. 27, pp. 6394–6407, 2017. [Google Scholar]
10. J. Zhao, X. Ding, Y. Du, X. Wang and G. Men, “Functional connectivity between white matter and gray matter based on fMRI for Alzheimer’s disease classification,” Brain and Behavior, vol. 9, no. 10, Article ID e01407, pp. 1–8, 2019. [Google Scholar]
11. C. Yang, W. Zhang, L. Yao, N. Liu, C. Shah et al., “Functional alterations of white matter in chronic never-treated and treated schizophrenia patients,” Journal of Magnetic Resonance Imaging, vol. 52, no. 3, pp. 752–763, 2020. [Google Scholar]
12. Y. Zhang, Y. Kong, X. Liu, H. Gao, Y. Yin et al., “Desynchronized functional activities between brain white and gray matter in major depression disorder,” Journal of Magnetic Resonance Imaging, vol. 53, no. 5, pp. 1375–1386, 2020. [Google Scholar]
13. L. Xiao, J. Wang, P. H. Kassani, Y. Zhang, Y. Bai et al., “Multi-hypergraph learning based brain functional connectivity analysis in fMRI data,” IEEE Transactions on Medical Imaging, vol. 39, no. 5, pp. 1746–1758, 2020. [Google Scholar]
14. W. Shao, Y. Peng, C. Zu and M. Wang, “Hypergraph based multi-task feature selection for multimodal classification of Alzheimer’s disease,” Computerized Medical Imaging and Graphics, vol. 80, Article ID 101663, pp. 1–10, 2020. [Google Scholar]
15. H. Guo, L. Yao, Y. Xu, Y. Jin, J. Xiang et al., “Resting-state brain functional hyper-network construction based on elastic net and group lasso methods,” Frontiers in Neuroinformatics, vol. 12, pp. 1–18, 2018. [Google Scholar]
16. F. Montani, R. A. A. Ince, R. Senatore, E. Arabzadeh, W. E. Diamond et al., “The impact of high-order interactions on the rate of synchronous discharge and information transmission in somatosensory cortex,” Philosophical Transactions of the Royal Society A, vol. 367, no. 1901, pp. 3297–3310, 2009. [Google Scholar]
17. I. E. Ohiorhenuan, F. Mechler, K. P. Purpura, A. M. Schmid, Q. Hu et al., “Sparse coding and high-order correlations in fine-scale cortical networks,” Nature, vol. 466, no.7306, pp. 617–621, 2010. [Google Scholar]
18. S. Yu, H. Yang, H. Nakahara, G. S. Santos and D. Nikolic, “Higher-order interactions characterized in cortical activity,” The Journal of Neuroscience, vol. 31, no. 48, pp. 17514–17526, 2011. [Google Scholar]
19. V. Michel, E. Eger, C. Keribin and B. Thirion, “Multiclass sparse Bayesian regression for fMRI-based prediction,” International Journal of Biomedical Imaging, vol. 2011, Article ID 350838, pp. 1–13, 2011. [Google Scholar]
20. A. Mahmoudi, S. Takerkart, F. Regragui, D. Boussaoud and A. Brovelli, “Multivoxel pattern analysis for fMRI data: A review,” Computational and Mathematical Methods in Medicine, vol. 2012, Article ID 961257, pp. 1–14, 2012. [Google Scholar]
21. U. Braun, A. Schaefer, R. F. Betzel, H. Tost, A. Meyer-Lindenberg et al., “From maps to multi-dimensional network mechanisms of mental disorders,” Neuron, vol. 91, no. 1, pp. 14–31, 2018. [Google Scholar]
22. M. Pedersen, A. Zalesky, A. Omidvarnia and G. D. Jackson, “Multilayer network switching rate predicts brain performance,” Proceedings of the National Academy of Sciences, vol. 115, no. 52, pp. 13376–13381, 2018. [Google Scholar]
23. S. Liu, J. Li and X. Li, “Brain MRI patient identification based on capsule network,” Journal of Internet of Things, vol. 2, no. 4, pp. 135–144, 2020. [Google Scholar]
24. T. Jeslin and J. A. Linsely, “Agwo-cnn classification for computer-assisted diagnosis of brain tumors,” Computers, Materials & Continua, vol. 71, no. 1, pp. 171–182, 2022. [Google Scholar]
25. R. Rajaragavi and S. P. Rajan, “Optimized u-net segmentation and hybrid res-net for brain tumor mri images classification,” Intelligent Automation & Soft Computing, vol. 32, no. 1, pp. 1–14, 2022. [Google Scholar]
26. R. Muthaiyan and D. M. Malleswaran, “An automated brain image analysis system for brain cancer using shearlets,” Computer Systems Science and Engineering, vol. 40, no. 1, pp. 299–312, 2022. [Google Scholar]
27. D. C. V. Essen, S. M. Smith, D. M. Barch, T. E. J. Behrens, E. Yacoub et al., “The WU-Minn human connectome project: An overview,” Neuroimage, vol. 80, pp. 62–79, 2013. [Google Scholar]
28. W. R. Shirer, S. Ryali, E. Rykhlevskaia, V. Menon and M. D. Greicius, “Decoding subject-driven cognitive states with whole-brain connectivity patterns,” Cerebral Cortex, vol. 22, no. 1, pp. 158–165, 2012. [Google Scholar]
29. S. Mori, K. Oishi, H. Jiang, L. Jiang, X. Li et al., “Stereotaxic white matter atlas based on diffusion tensor imaging in an ICBM template,” Neuroimage, vol. 40, no. 2, pp. 570–582, 2008. [Google Scholar]
30. E. M. Gordon, T. O. Laumann, B. Adeyemo, J. F. Huckins, W. M. Kelley et al., “Generation and evaluation of a cortical area parcellation from resting-state correlations,” Cerebral Cortex, vol. 26, no. 1, pp. 288–303, 2016. [Google Scholar]
31. J. Wang, L. Xiao, T. W. Wilson, J. M. Stephen, V. D. Calhoun et al., “Examining brain maturation during adolescence using graph laplacian learning based Fourier transform,” Journal of Neuroscience Methods, vol. 338, Article ID 108649, pp. 1–12, 2020. [Google Scholar]
32. E. E. Chen and S. L. Small, “Test–retest reliability in fMRI of language: Group and task effects,” Brain and Language, vol. 102, no. 2, pp. 176–185, 2007. [Google Scholar]
33. A. Taxali, M. Angstadt, S. Rutherford and C. Sripada, “Boost in test–retest reliability in resting state fMRI with predictive modeling,” Cerebral Cortex, vol. 31, no. 6, pp. 2822–2833, 2021. [Google Scholar]
34. L. Fan, J. Su, J. Qin, D. Hu and H. Shen, “A deep network model on dynamic functional connectivity with applications to gender classification and intelligence prediction,” Frontiers in Neuroscience, vol. 14, no. 881, pp. 1–14, 2020. [Google Scholar]
35. T. A. Hackett, “Information flow in the auditory cortical network,” Hearing Research, vol. 271, no. 1–2, pp. 133–146, 2011. [Google Scholar]
36. R. P. Dhond, C. Yeh, K. Park, N. Kettner and V. Napadow, “Acupuncture modulates resting state connectivity in default and sensorimotor brain networks,” Pain, vol. 136, no. 3, pp. 407–418, 2008. [Google Scholar]
37. T. Y. Lin, P. Dollar, R. Girshick, K. He, B. Hariharan et al., “Feature pyramid networks for object detection,” in Proc. of the IEEE Conf. on Computer Vision and Pattern Recognition, Honolulu, HI, USA, pp. 2117–2125, 2017. [Google Scholar]
 | This work is licensed under a Creative Commons Attribution 4.0 International License, which permits unrestricted use, distribution, and reproduction in any medium, provided the original work is properly cited. |