DOI:10.32604/iasc.2022.023331
| Intelligent Automation & Soft Computing DOI:10.32604/iasc.2022.023331 | |
| Article |
Total Cross Tied-Inverted Triangle View Configuration for PV System Power Enhancement
1Department of EEE, Anna University, Chennai, Tamilnadu, 600025, India
2Department of EEE, V. V. College of Engineering, Tirunelveli, Tamil Nadu, 627657, India
*Corresponding Author: P. Rajesh. Email: rajeshpjournals@gmail.com
Received: 03 September 2021; Accepted: 02 November 2021
Abstract: Electricity can be generated from a photovoltaic cell depending on the amount of solar radiation received from the solar system. But due to some factors such as partial shade conditions, as the thickness of the shade increases, the peak power output from the solar photovoltaic system decreases. Photovoltaic cells can be connected in parallel and in series to generate the required voltage and power. Peak power can be obtained even under shade conditions using the appropriate configuration of solar cells. A novel configuration as Total Cross Tied-Inverted Triangle View (TCT-ITV) is developed in the research by augmenting the Total Cross Tied configuration with Inverted Triangle configuration. The above system is simulated in MATLAB/SIMULINK and the performance of the system is extensively studied. Experiments have been performed under a different shading structure with the proposed TCT-ITV and compared with the existing topologies available in the literatures such as S, SP and TCT configuration, SuDoKu, magic square view topologies. It is evident from the results that the generated power using the proposed configuration increases by 7.89%, thus proving to be more efficient than the existing schemes. It can be claimed that the proposed topology performs better under large wide shaded conditions and hence used in various applications.
Keywords: Inverted triangle view; solar irradiance; partial shading; photovoltaic system
Conventional source of energy on the basis of petroleum, charcoal, and gasoline have shown to be vastly efficient factors of economical growth [1]. Protection of electrical energy is necessary, so far the huge price and inadequate resources of fossil sources, along with the demand to decrease discharge of green-house gas, have made recoverable sources appealing in universal energy built economy. The capacity for these energy sources is massive since they know how to, in theory, proportionally go beyond the universal requirement of energy [2]. Along with the renewable sources of energy, the function of solar resources of energy has been growing drastically in current days because of increasing requirement of energy with least ecological effect.
The major concern in utilizing solar resources is its non-uniform properties, which varies with temperature and solar irradiation [3,4]. The properties become more complicated, if the whole solar panel does not obtain regular irradiation, as in moderately cloudy [5–7] circumstances. Typically, mechanical and electrical monitoring is employed to produce the peak power [8] from solar modules [9]. The mismatching factor is produced by partial shaded condition in electrical tracking [10–12]. Partial shading is the main reason for mismatch leakages that can decrease significantly the power production of solar PV devices. Furthermore, when a PV cell gets shadowed it turns in to corresponding to resistance that absorbs the power produced by its adjacent cell. The consumed power is transformed to thermal energy that rises the temperature and harms the cell [13].
The partial shading creates losses in power output. Various arrangements like series array, parallel array, series parallel (SP) array, TCT array, bridge-linked (BL) array, honey–comb (HC) array are comparable for their losses, cause of shunt resistance, peak power, bypass diodes and also for different sizes of panels beneath partial shading. It is noticed that the TCT configuration prevails all configurations by generating highest 4% rise in the solar panel power production [14]. A SuDoKu method was accessible to assemble the physical task of solar modules in a Total Cross Tied solar module arrangement that enhanced energy production about 3.6%, greater than the TCT arrangement. The disadvantage of this technique is an ineffectual allotment of shading and, complexity is worried in the pattern of SuDoKu technique therefore the PV panels are familiar among the vertically located arrays. It consists of a numerous limitation; also the number of modules permitted in the similar and vertical position has to be equal [15]. The limitations and difficulty of SDK pattern were reduced by the Magic Square View (MSV) pattern of solar panels Beneath PSCs; this pattern enhances the allocation of shade effect along the solar device. Moreover, there is an improvement in power of 6.38% by means of MSV technique compare to SDK pattern [16]
The major contributions of the proposed research work are listed below,
• To enhance the power efficiency and peak power can also be obtained even under shading conditions using appropriate configuration of solar cells. The Total Cross Tied configuration with Inverted Triangle View (TCT-ITV) technique is proposed. Total Cross Tied (TCT) configuration is a commonly used now-a-days because it provides maximum power even under shaded condition [17–19].
• In the proposed system, TCT-ITV configuration is proposed to regulate the location of PV cells and to increase the solar energy production beneath diverse PSCs by simulating 9 × 9 PV cell.
• Beneath Partial shading conditions, the projected configuration ITV increment the allocation of shaded collision over the solar PV array system. The solar cells [20–26] are organized based on the TCT connection and novel ITV partial shading technique is implemented.
• The performance of the system had been evaluated and the results were presented. The highlights of the proposed research are displayed systematically as follows:
Segment 2 describes the equivalent circuit of PV cell, its parameters and various connections established in solar PV module and its electric characteristics. Segment 3 describes the parameters used in solar PV module. Segment 4 displays the proposed method, its modeling and technique employed for partial shading. Segment 5 displays the simulation results, discussions and comparisons. Segment 6 provides the conclusion of the paper.
PV modules use the solar light energy to generate electricity using PV effect. The PV cell generates direct electrical power from sun that can be used as energy devices or for charging purposes.
2.1 Electrical Model of Photovoltaic Cell
Like a corresponding device-based structure is mostly employed for MPPT techniques. The corresponding structure of the common device comprise of a photon current, a diode, a resistance which is connected in parallel exhibiting a leakage current, resistance connected in series defining an interior resistor to the flow of electrons, is expressed in Fig. 1.
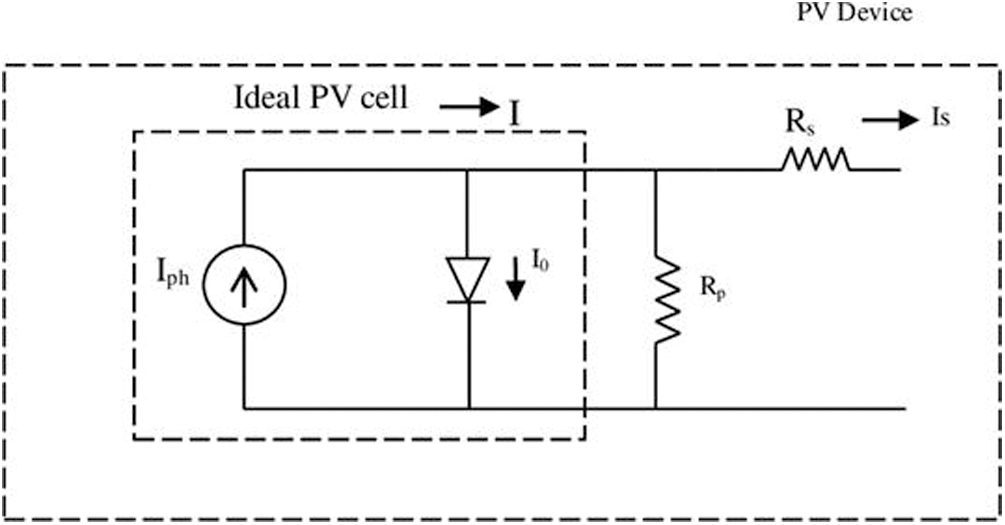
Figure 1: Electrical equivalent model of PV cell
The V-I characteristics equation of a PV cell is given by
where,
Iph is a current produced by light,
Is is the current of cell saturation,
TC = operating temperature of a cell,
A = ideal factor, Rsh = shunt resistor, Rs = series resistor
The photo electric current mostly based on the PV irradiance and operating temperature of a cell,
where,
Isc = short circuit current of a cell at 25°C, 1 kW/m2
KI = temperature coefficient of short circuit current of a cell
TRef = reference temperature of a cell
2.2 Series and Series-Parallel Connected PV Topology
To produce higher voltages and currents, the cells are linked in series and parallel arrangement. Manufacturing, material, compositional requirement constraints limit the quantity of cells that can be combined in these designs. On the other hand, a pure parallel PV configuration has group of single solar cells tied up horizontally and several such strings are connected in parallel forming a parallel PV module as expressed in Fig. 2. The operation of the PV panel relies upon temperature, analysis of PV panel in addition to shading over the panel.
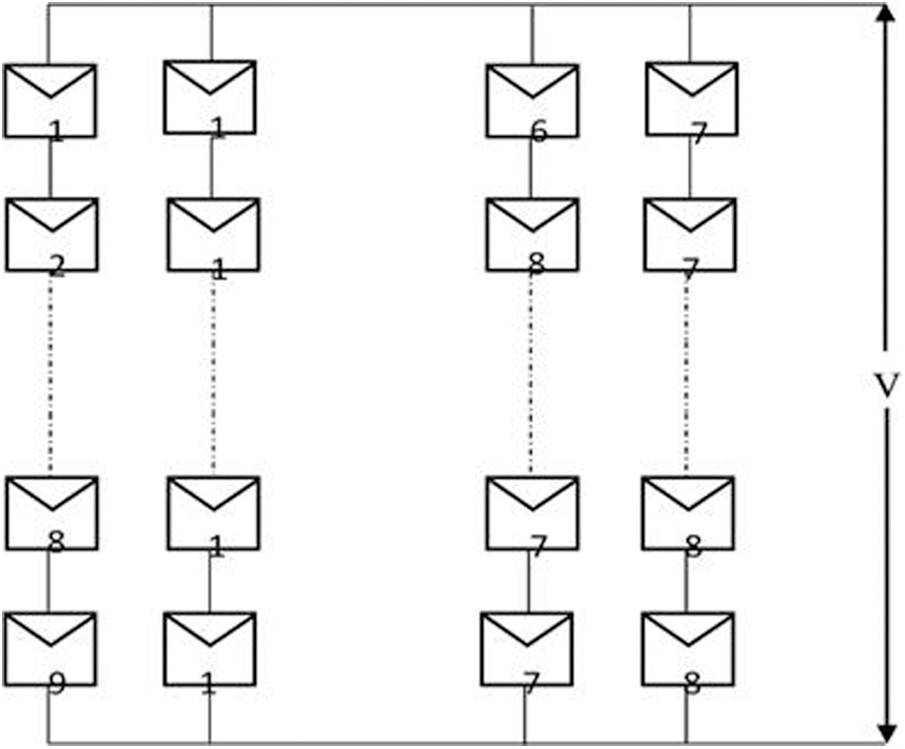
Figure 2: Series parallel connected PV
The power output from single photovoltaic cells is moderately little (approximately 0.5 W). Photovoltaic cells are linked in parallel and series it can produce necessary voltage and power. The modules are sorted by the smallest assembly design and to produce DC power. It can be mentioned before, and then the smallest amount is obtainable from producer. Modules are combined together into panels. These panels to be related mutually expand the whole array.
The characteristic of the output voltage in PV system could be obtained as,
where
Ns-Number of series cell
IPV-PV cell output current
Beneath partial shading conditions, TCT arrangement need to mathematically examine to find out how these conditions influence output characteristics curves. The parameters at standard test conditions, while the current and voltage of PV module are at Maximum Power Point for specific irradiance and temperature conditions.
Fig. 3 displays the TCT connection, modeling and the technique used in TCT is ITV configuration. The position of the module in the row does not determine the current of a row of PV modules in TCT connections. From Eq. (9) the current of a PV which has M parallel modules and voltage is obtained as below:
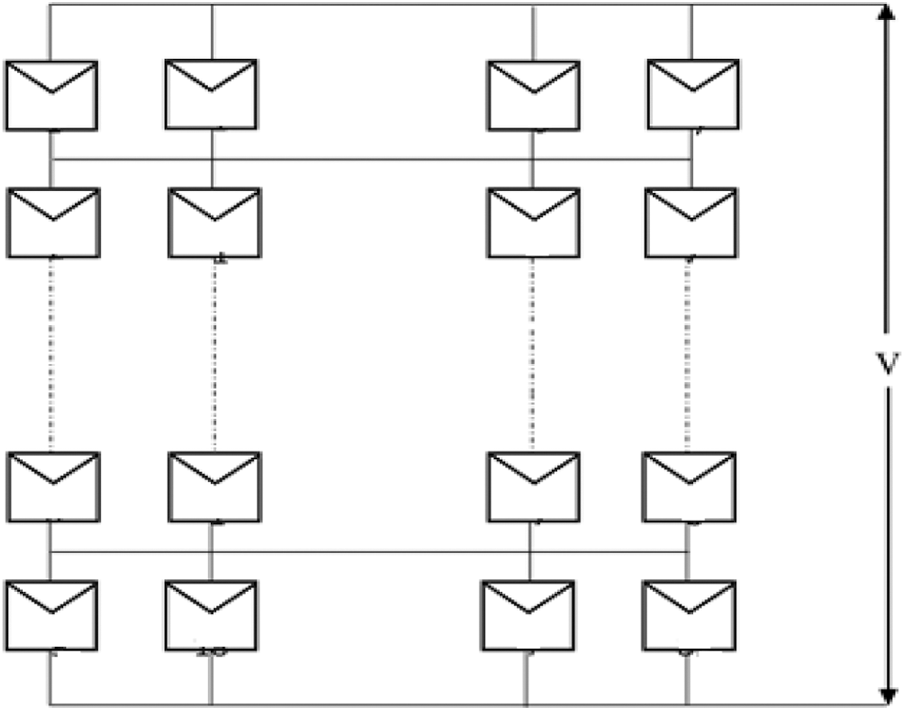
Figure 3: TCT configuration
In Eqs. (10) and (11) the module parameters are represented by ir and ieq. The row current is created by each row voltage.
SuDoKu is a logical related numerical array puzzle. This model consists of 9 3 × 3 matrix and every column, every row, and one of the 9 3 × 3 sub networks which compile the network comprises whole numbers from one to nine. The pattern of SuDoKu puzzle is shown in Fig. 4. The starting number in each loop declares the digit of rows and the next number denotes the column of 9 × 9 panel.
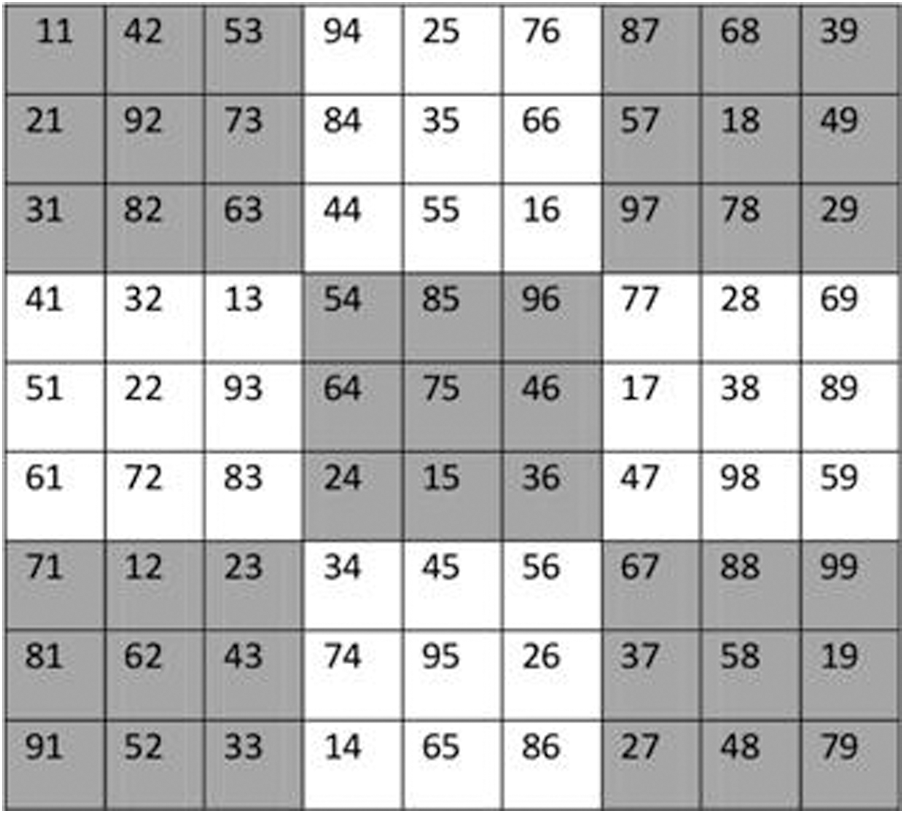
Figure 4: The SDK pattern
The solar array, third row and nine column is physically moved to the starting row nine column but the solar array link remains in the 9th row. Therefore, the physical locations of the Photo Voltaic arrays are accustomed devoid of varying the electrical links in the solar panel. Because of the electrical connection do not swap the electric formulas V and I remain identical as the Total Cross Tied arrangement.
An order(n = 9) of Magic Square View is a method of
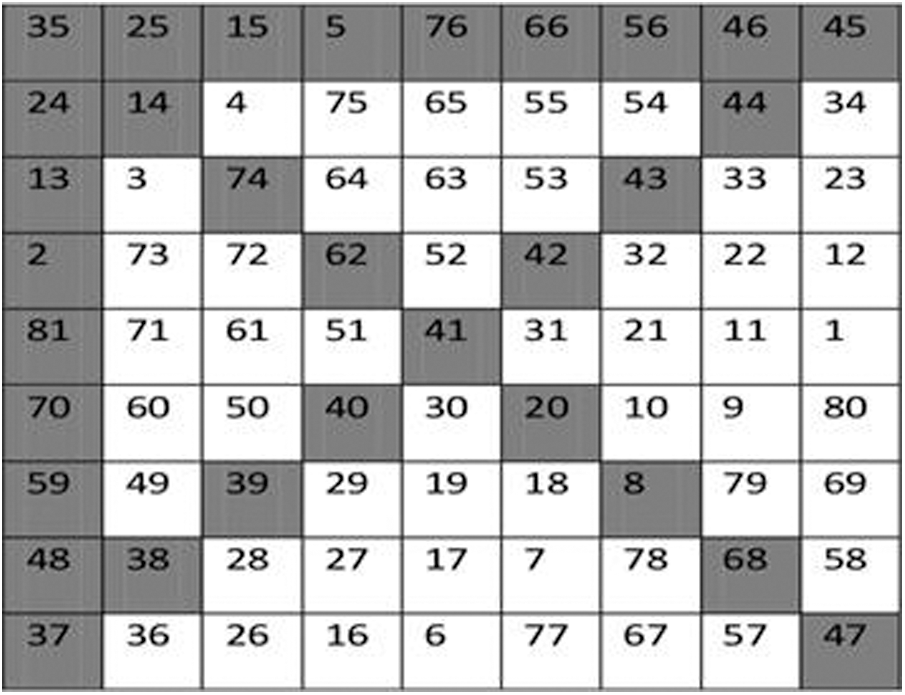
Figure 5: The MSV pattern
The location of succeeding digit is determined by decreasing row digit of the preceding number by 1 and increasing the column digit of the preceding number by 1. In the same way, if the computed location of column turns in to n, it will enfold nearly to 0. If the MS previously consists of a digit at the computed location, computed column location will be decreased to 2, and the computed row location will be increased to 1.
3 Methodology of Inverted Triangle View Configuration
The suggested ITV technique assigns the numbers of module reasonably for several numbers of PV modules. The electric circuit is similar but positions of the module vary with respect to the specified proportions of the solar panel.
It is a 90-degree triangle of natural numbers acquired by refilling the rows by using successive numbers, beginning from 1. Series number of row and quantity of component in the row are identical, i.e., first row has one component, and next one has two, and so on. The sum of nth row is equal to n (n2 + 1)/2 as displayed in Fig. 6. In this method, the component of first row is 1 and the second row has 2 and 3 as its part. The next row consists of 4, 5 and 6, and the numbers keep on in this model considerably.
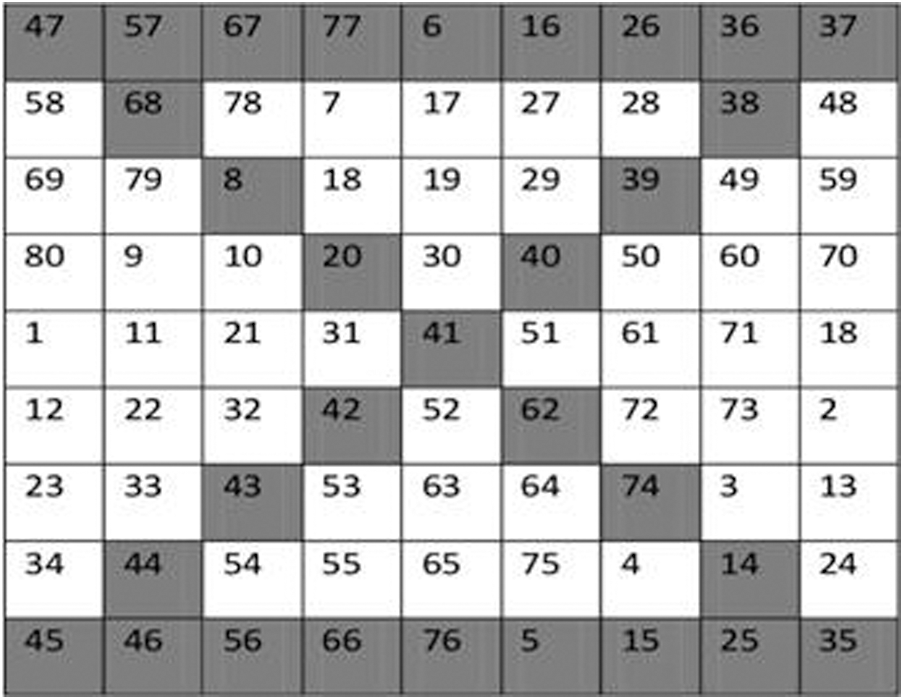
Figure 6: Proposed TCT-ITV configurations
The proposed PV module is formed by connecting 9 * 9 solar cells in which they are arranged in series as well as in parallel and the entire module is total cross tied connection. It looks rather easy, and the ploy used in the inverted triangle algorithm and Fig. 7 displays the flowchart accessible below. The total cross tied connection configuration, Inverted triangle technique is employed to achieve better output results when compared to other partial shading conditions employed till date.
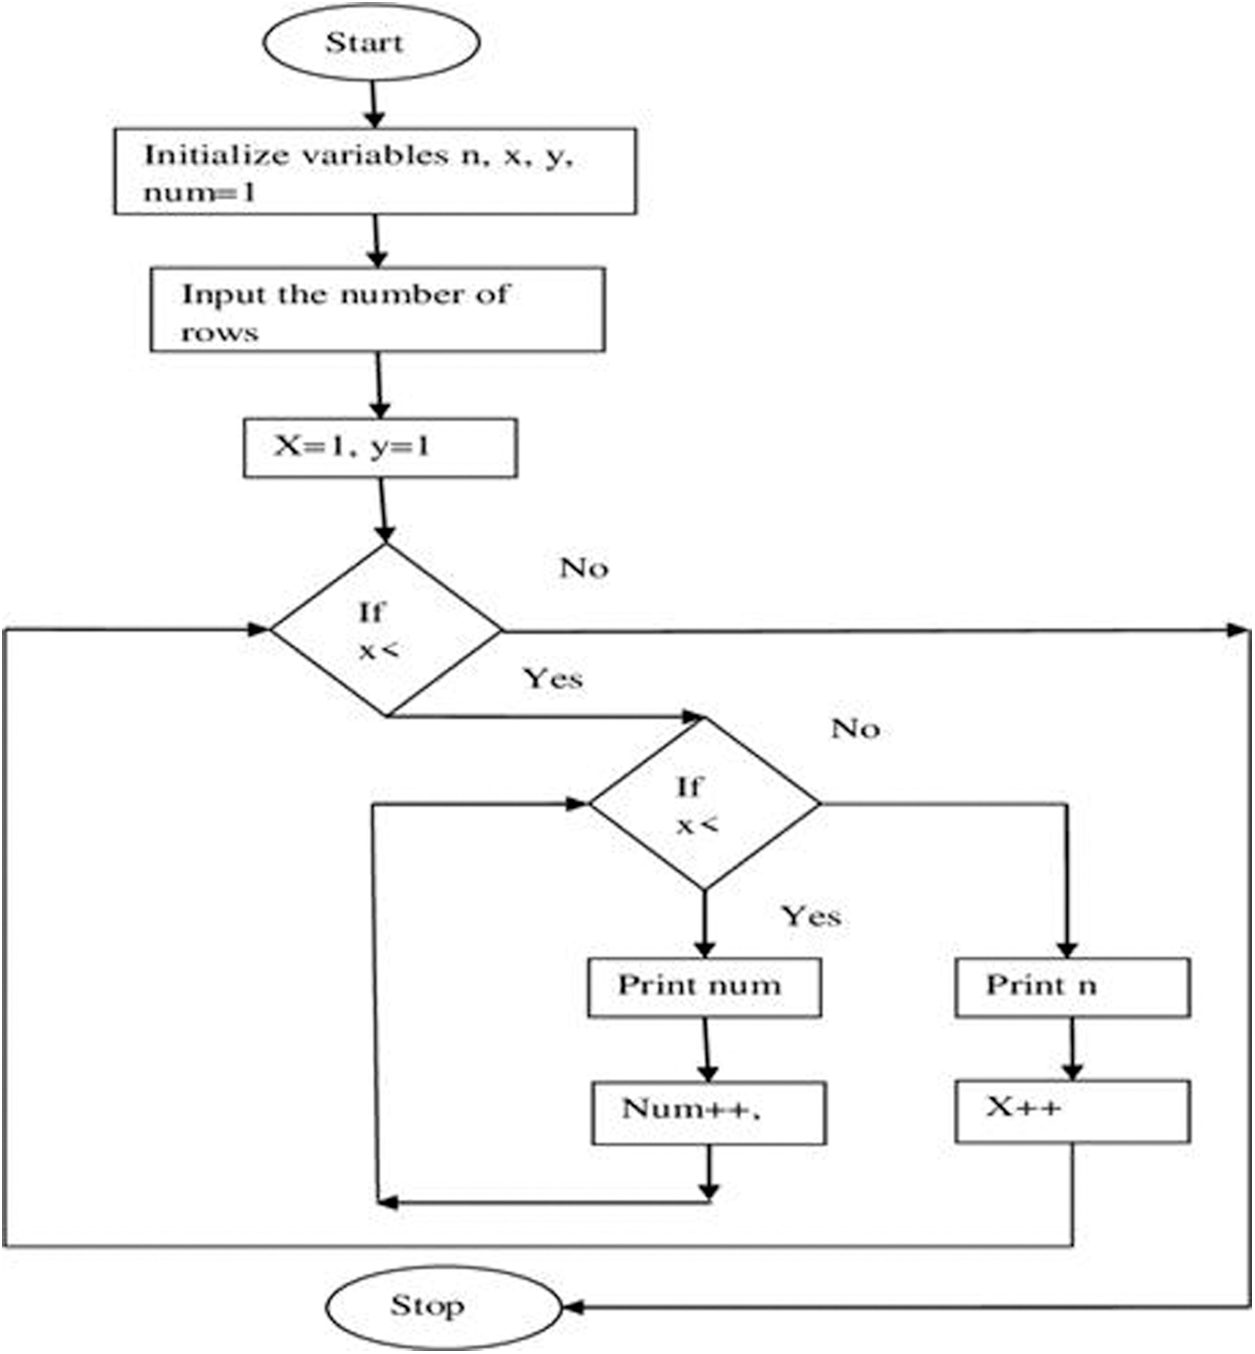
Figure 7: Algorithm and flowchart for TCT-ITV configuration
The inverted triangle technique is applied from third row to the eighth row in the entire module. The algorithm used in flowchart in displayed in Fig. 7. After providing the input to the system the process or the steps employed is formatted to a standard format and it is utilized, At last the inverted triangle is achieved in the system and it is tested and so better output is achieved. The concept employed behind flowchart in Fig. 7. The inverted triangle itself is a developing technique. In this paper, an ITV collection amplified with series parallel and series arrangements are suggested to vary the position of solar cells to improve the solar energy production. Beneath partial shading condition (PSC) the projected method augment the dispersion of shading consequence all the way through the solar module. Thus, the proposed method enables to minimize the shading of the panels and spread the shading over the whole array. Thus, the ITV pattern improves the power production under partial shading conditions and decreases the power losses when compared to other configurations.
4 Simulation Results and Discussion
A 9 × 9 solar panel is interconnected in Total Cross Tied configuration and submitted to Large Wide shaded arrangement to estimate the operation of the proposed TCT-ITV method. The simulation is done for SDK, MSV and ITV-TCT pattern by MATLAB/Simulink environment. The outputs acquired are compared with MSV, SDK for the given shaded arrangement.
A solar panel is separated into 5 various sets as per the irradiance level. First set gets an irradiance of 900 W/
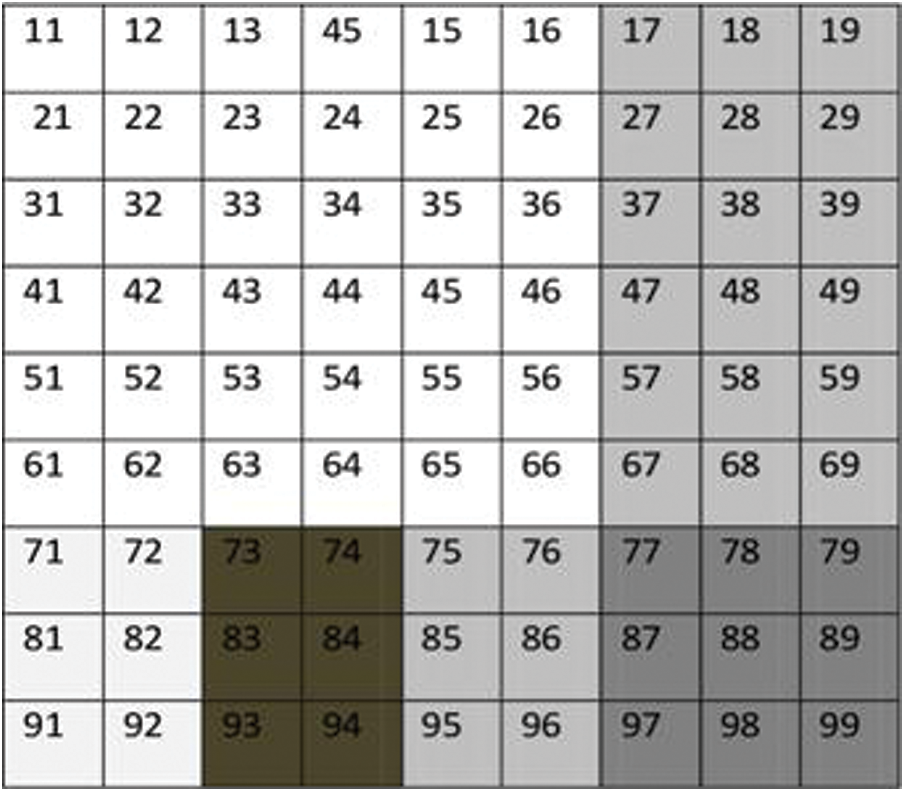
Figure 8: Long wide pattern using conventional TCT configuration
A solar Panel with 5 several sets based on the irradiance level is taken in to account. The first set acquires an irradiance of 900W/
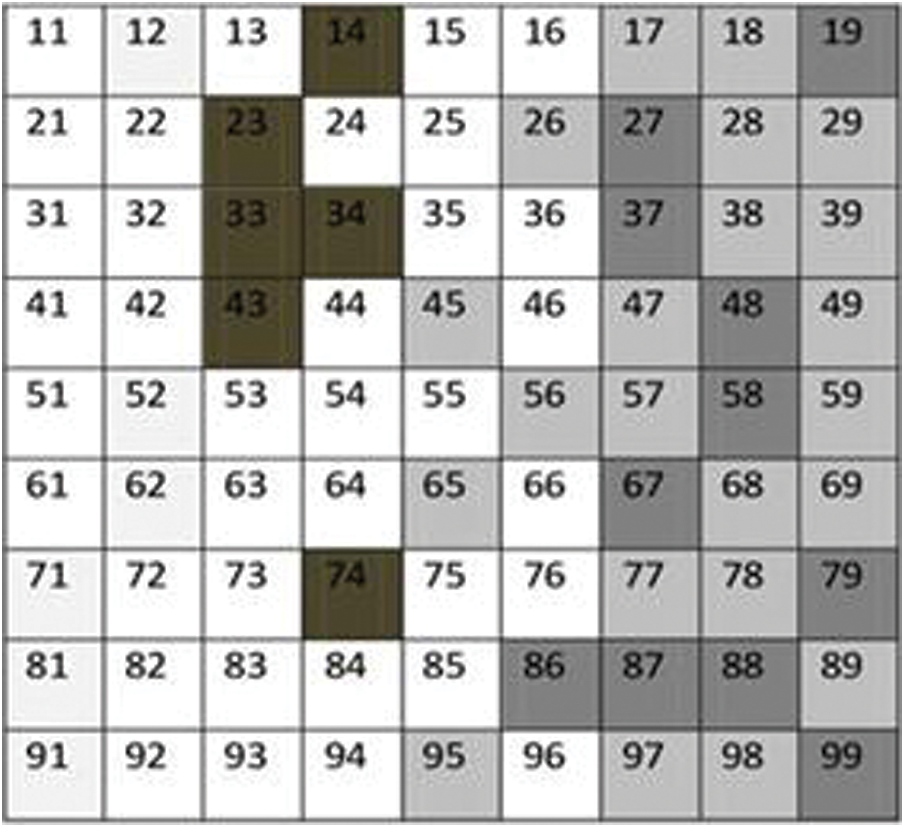
Figure 9: Shade dispersion using SDK scheme
4.3 Proposed ITV-TCT Configuration
The proposed technique is proven by the same 9 × 9 PV panel that is exposed to the considered shaded arrangement. The Shade dispersion using proposed ITV-TCT is shown in Fig. 10. The current in the nine rows are estimated below.
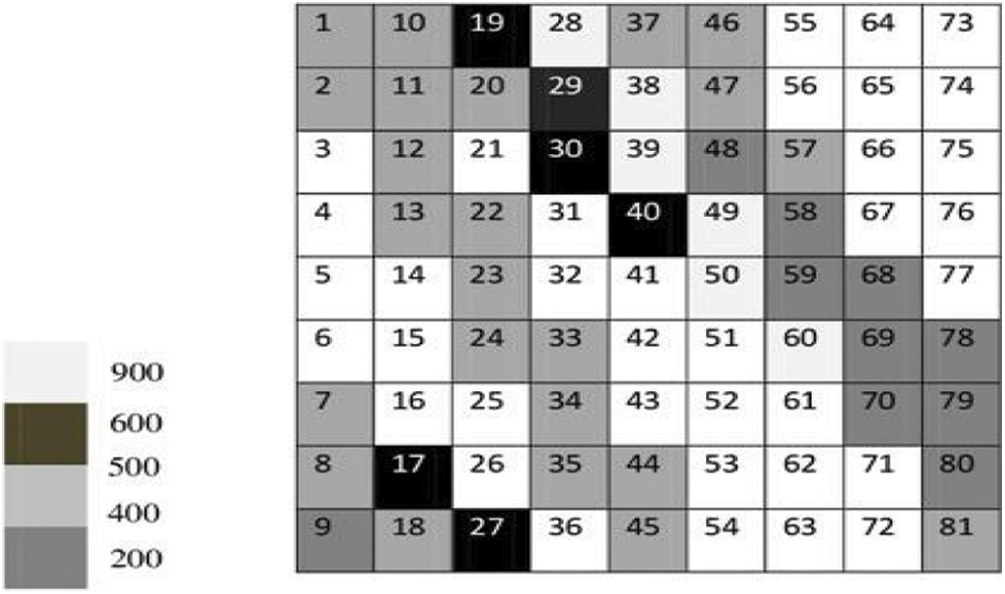
Figure 10: Shade dispersion using proposed ITV-TCT
An uneven shadow pattern appears in photovoltaic systems. From 81 modules, 30 modules are shaded. The shade model consists of twelve modules with 700 W/m2, fourteen modules with 400 W/m2 and four modules with 200 W/m2 at standard temperature. It is realized from Tab. 1 that for the S-ITV configuration local peak powers at 1428 W. The LP point corresponding to the lowest peak power of 1428 W is 137.9 V, 5.63 A. For this LP point, the PV system gives the maximum power of 3872 W and hence the LP point of the string is the GP point of the PV system. For the SP-ITV configuration local peak powers at 1476 W. The LP point corresponding to the lowest peak power of 1476 W is 136.7 V, 5.63 A. For this LP point, the PV system gives the maximum power of 3877 W and hence the LP point of the string is the GP point of the PV system. Fig. 11 shows the PV characteristics of S-ITV and SP-ITV.
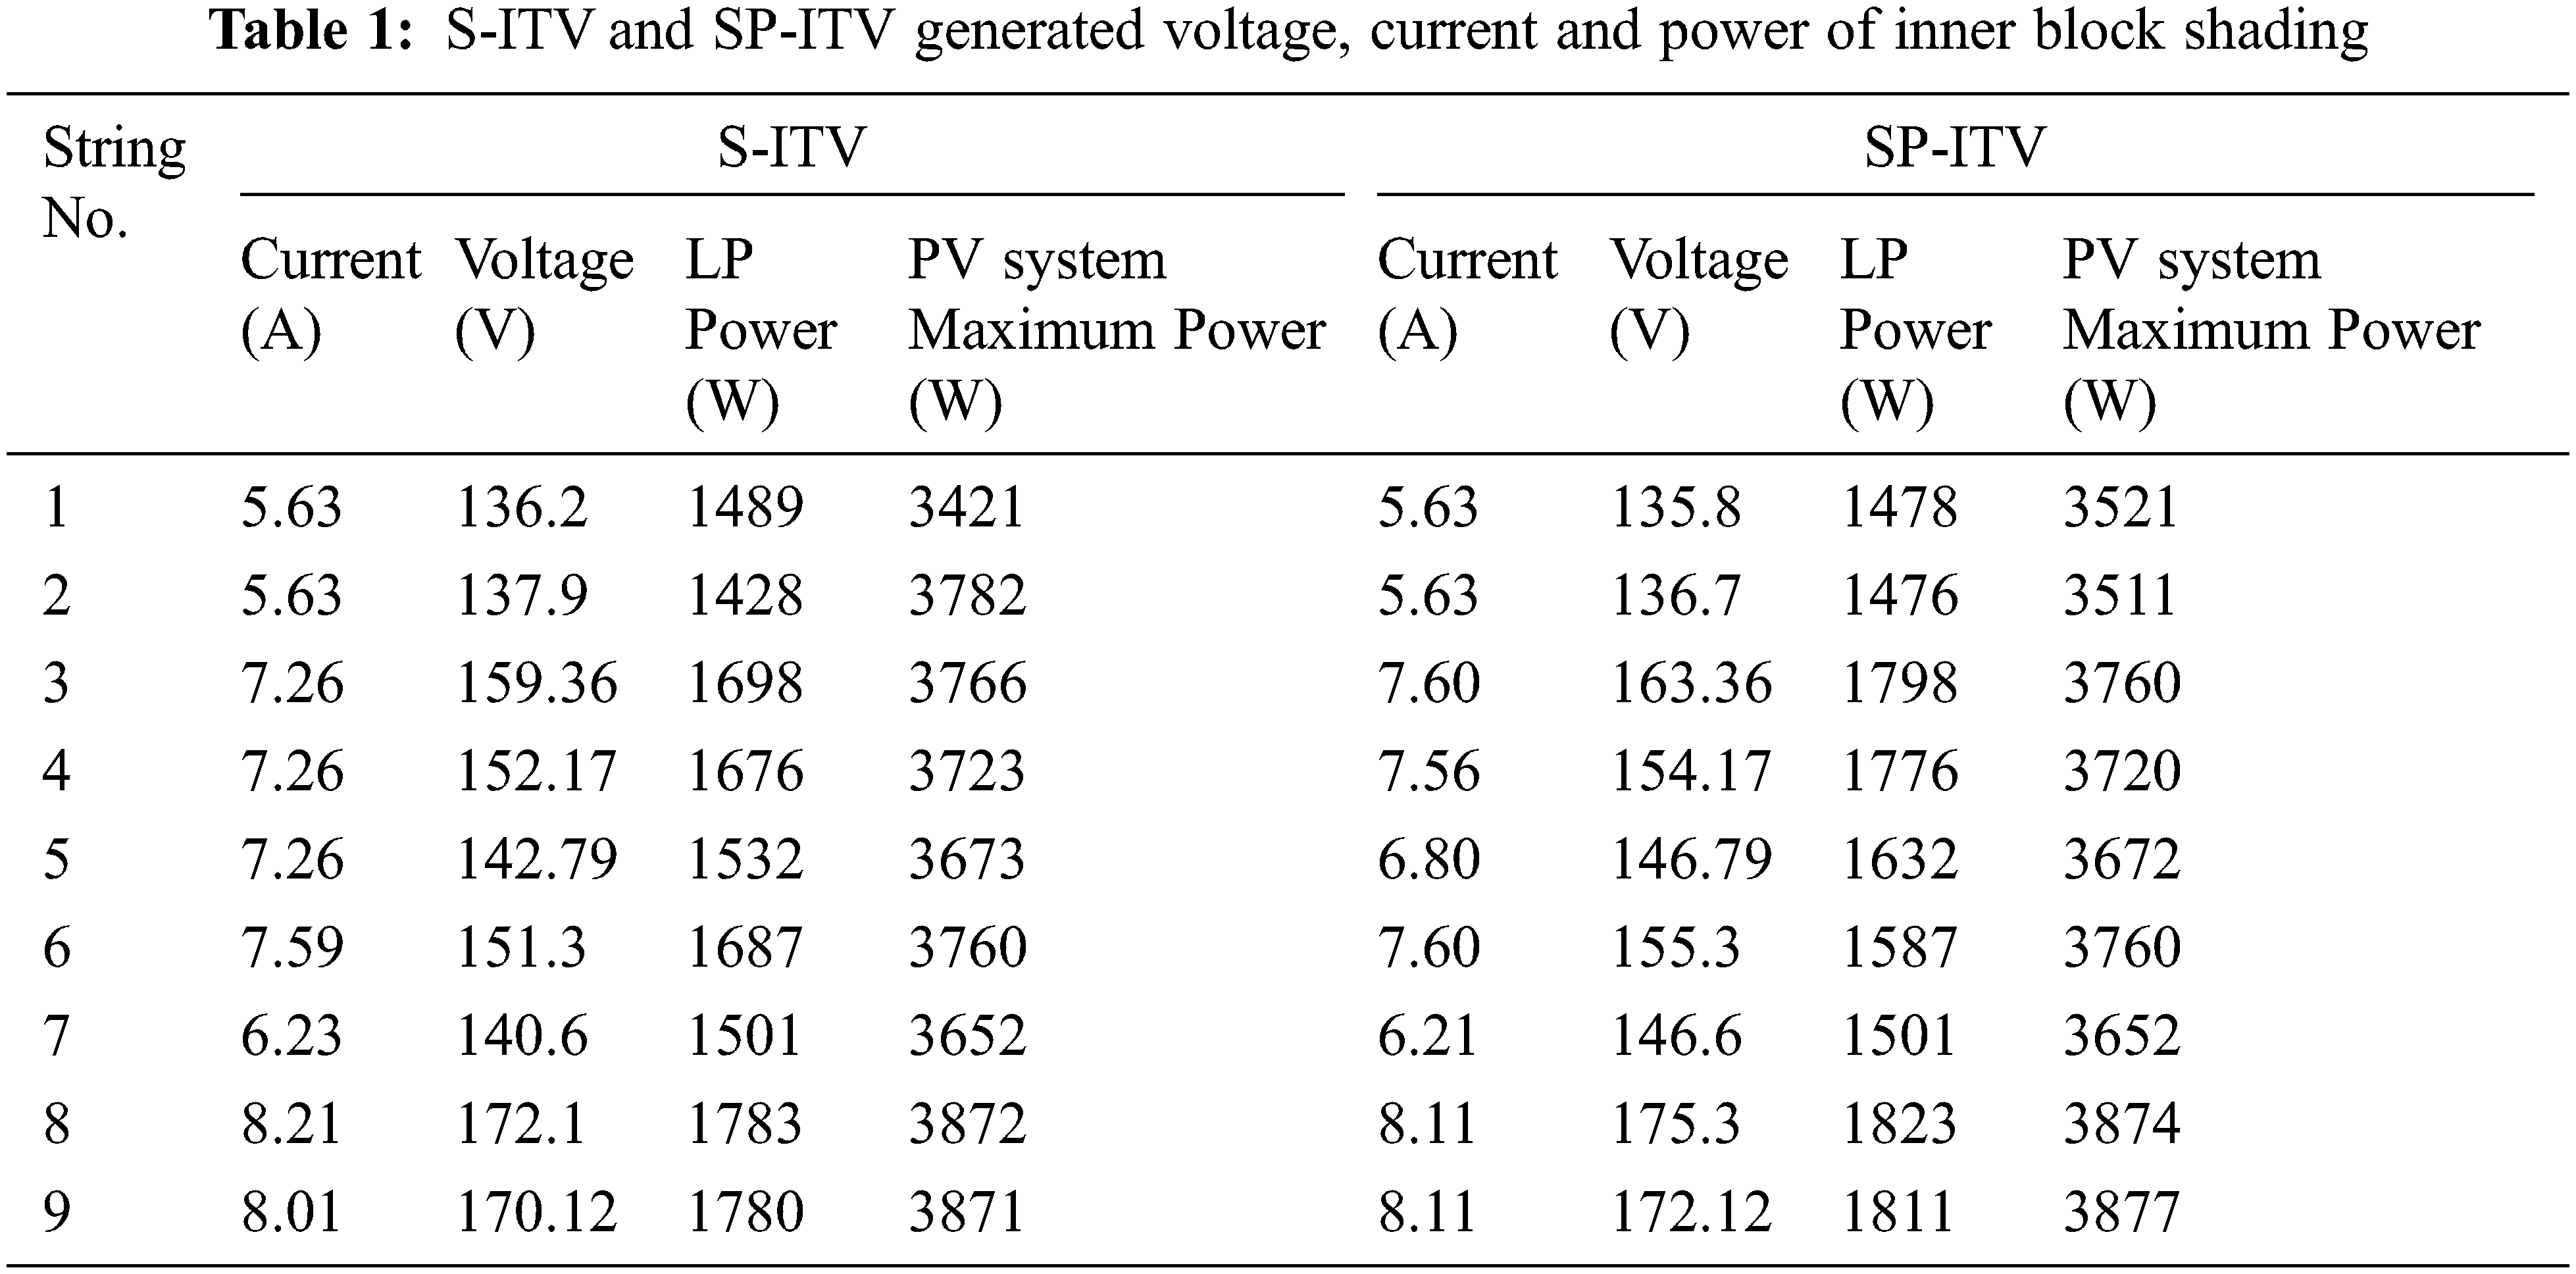
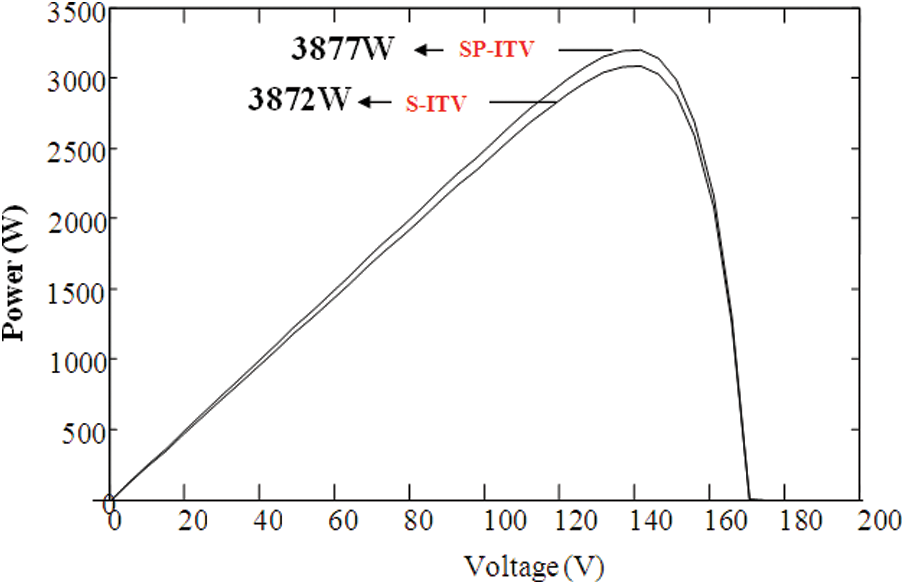
Figure 11: PV characteristics of S-ITV and SP-ITV
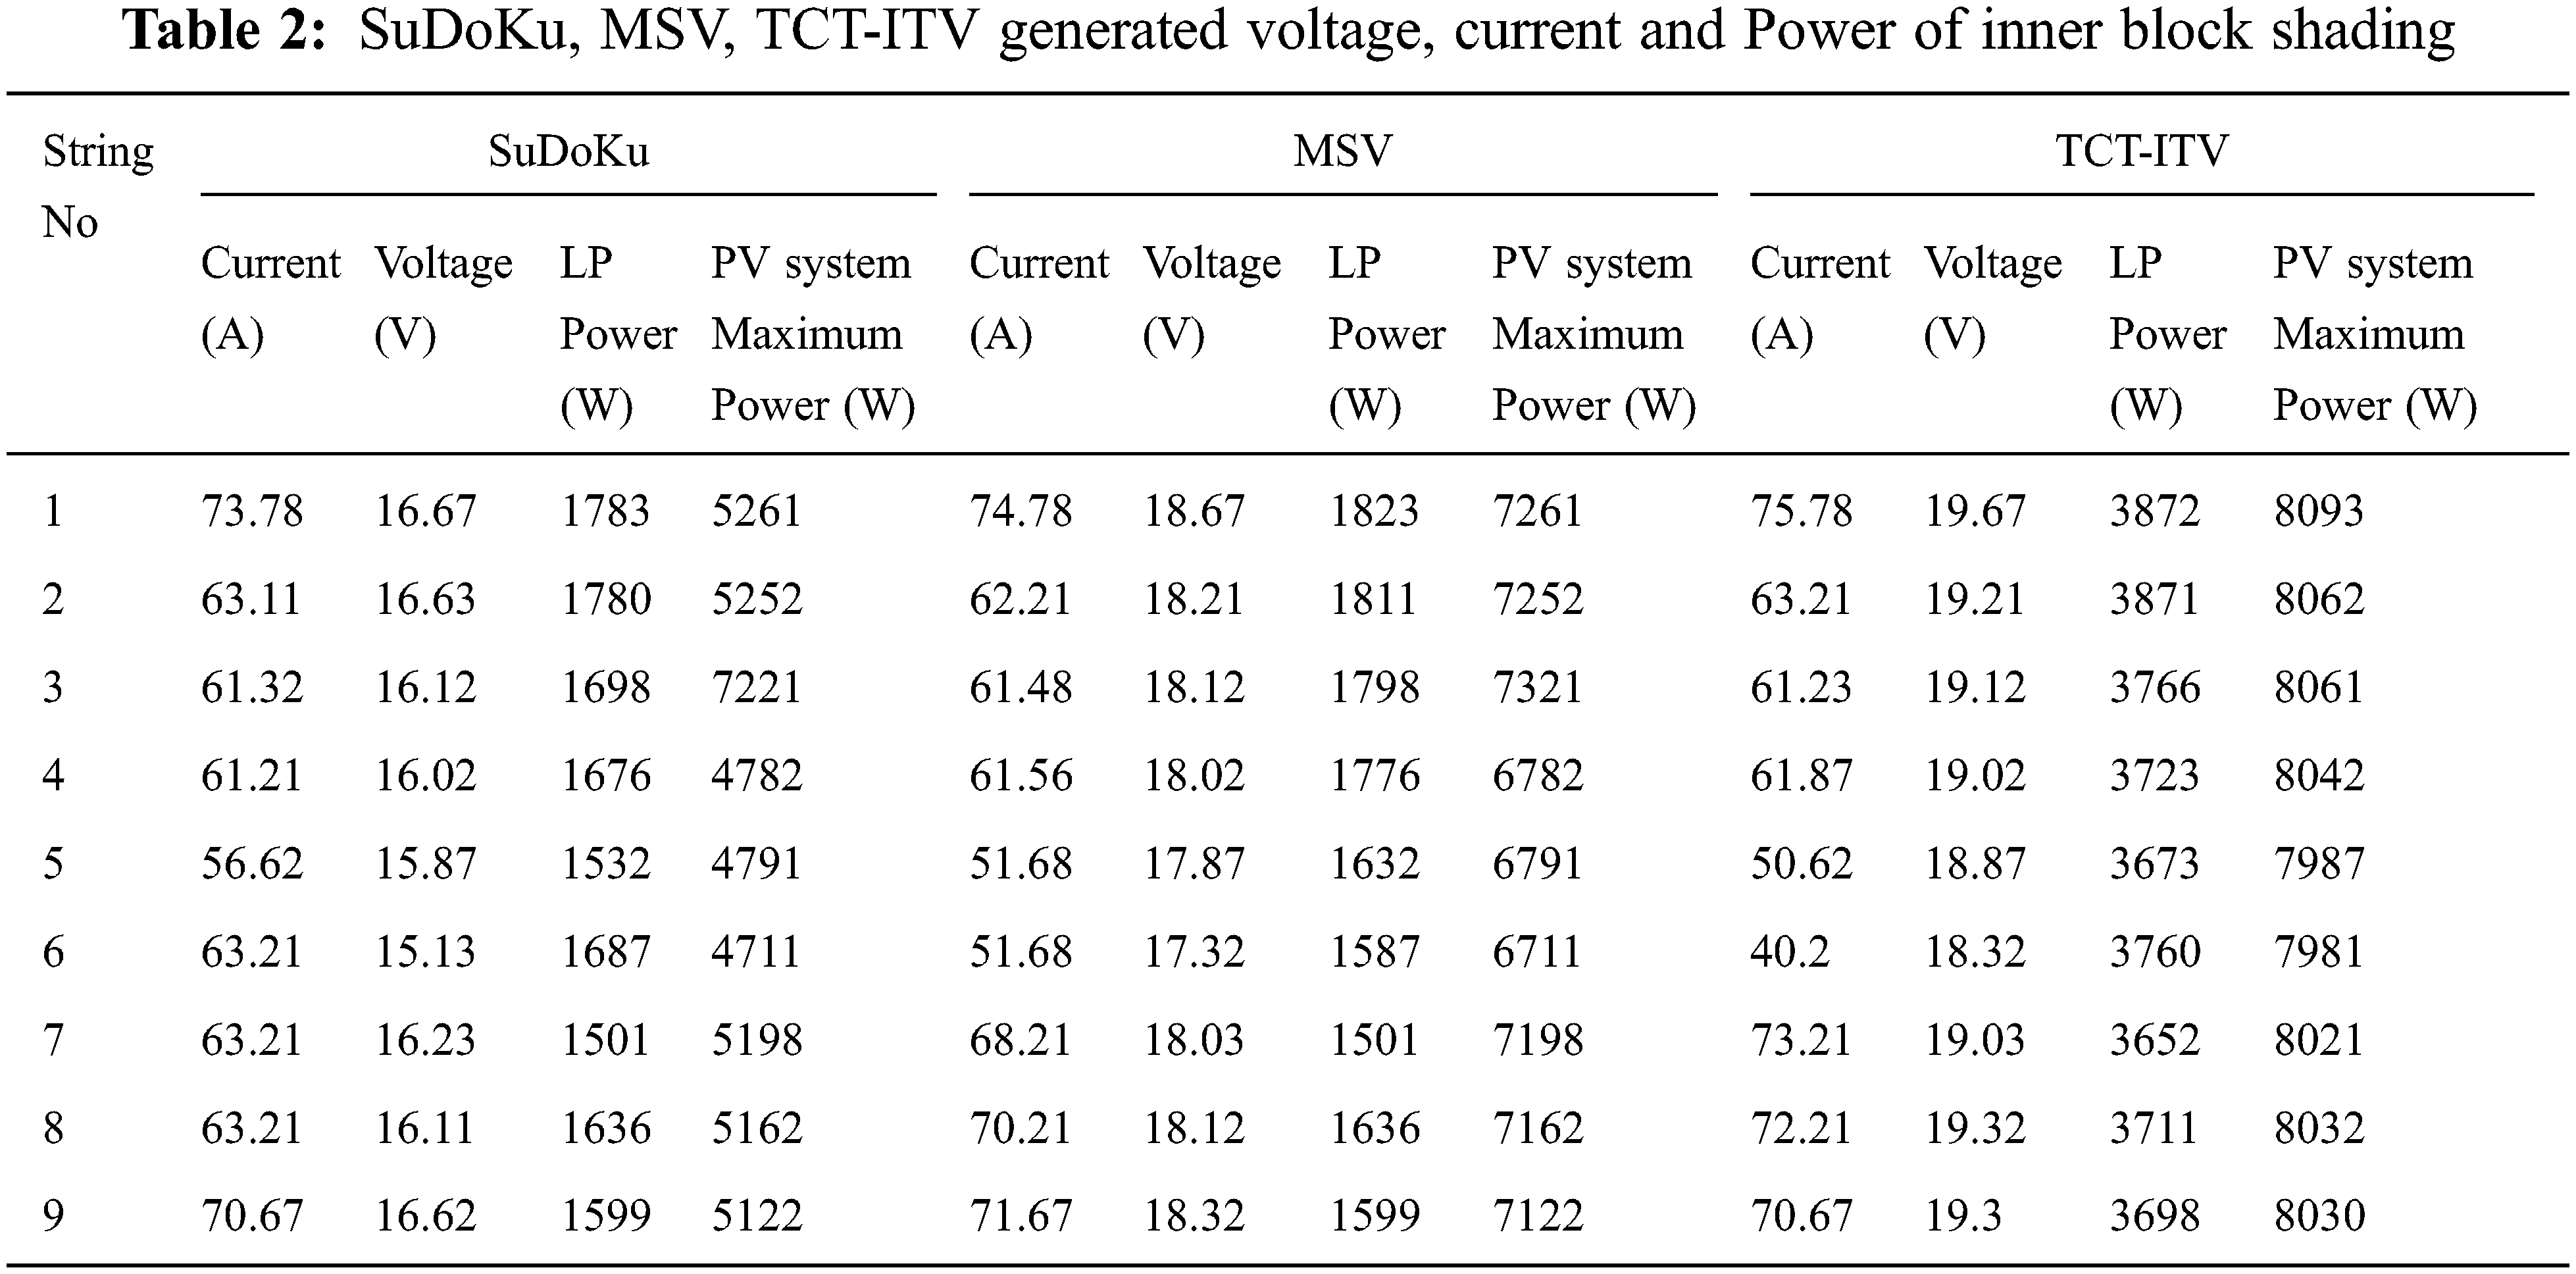
For the configuration of SuDoKu is shown in Fig. 12a. In Fig. 12a, the current generated in each character string is described at this point. Ir6, Ir7 and Ir8 receive STC radiation. Therefore, the current generated is Ir6 = Ir6 = Ir8 = 63. The MSV configuration is shown in Fig. 12b. In Fig. 12b, the electricity generated in each string is described at this point. Ir5 = Ir6 receiving STC radiation. Therefore, the current generated is Ir5 = Ir6 = 51.68 A. For the TCT-ITV configuration shown in Fig. 12c, the currents generated in each string will be described at this stage. Ir5 = Ir6 receiving STC radiation. Therefore, the current generated is Ir5 = Ir6 = 51.68 A. From Tab. 2 it can be seen that the local peak power for the SuDoKu configuration is 1501 W. The LP point, which corresponds to the lowest peak power of 1501 W, is 16.23 V, 63.21 A. For this LP point, the PV system states a maximum power of 8093 W, and therefore the LP point is from the GP point string of the PV system. Fig. 13 shows the PV characteristics of SuDoKu, MSV and TCT-ITV. TCT-ITV proved to be the best. It is clear that the TCT-ITV model increases energy production from photovoltaic systems.
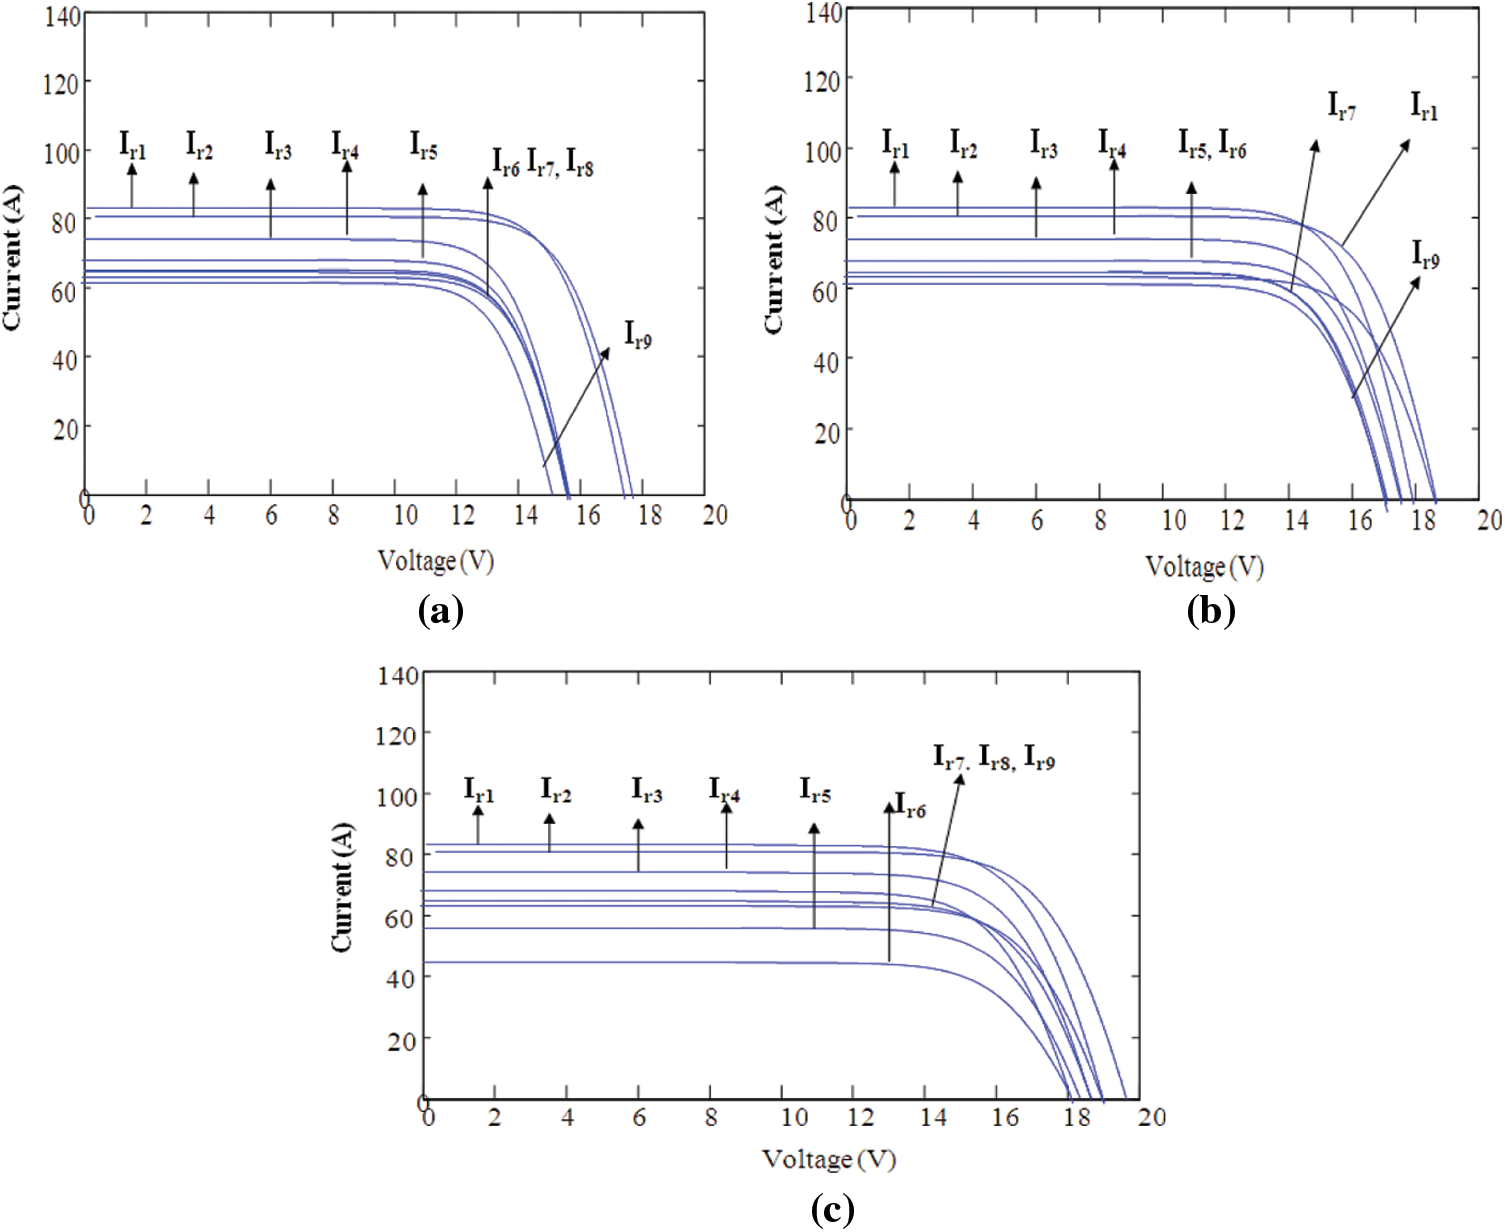
Figure 12: (a) SuDoKu (b) MSV and (c) TCT-ITV configurations
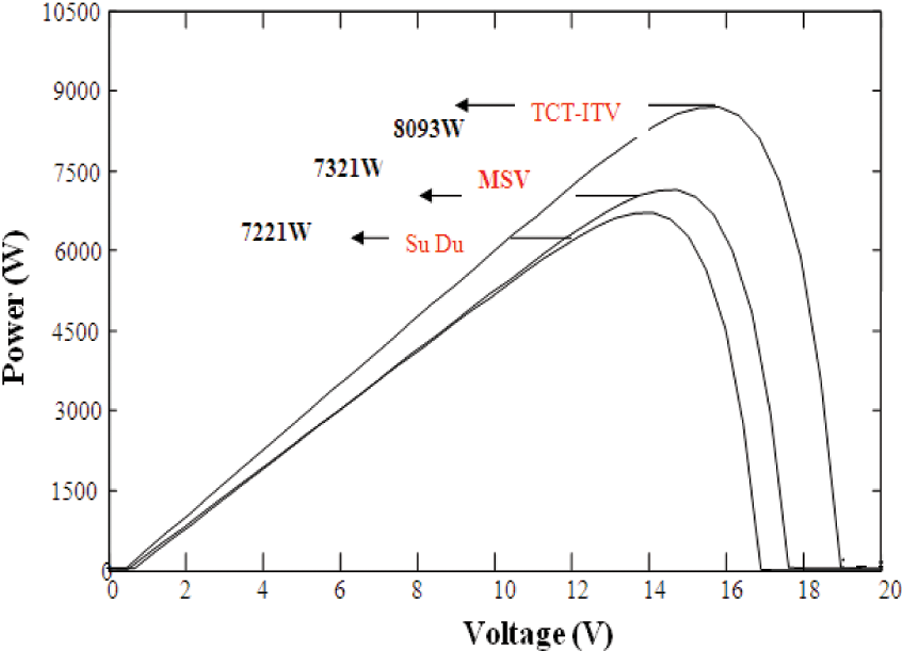
Figure 13: PV characteristics of SuDoKu, MSV and TCT-ITV
For the local SP-ITV peak power configuration at 1501 W. The LP point, which corresponds to the lowest peak power of 1501 W, is 146.6 V, 7.60 A. The PV system provides a maximum output for this LP point of 7331 W, and therefore the LP point of the string is the GP point of the PV system.
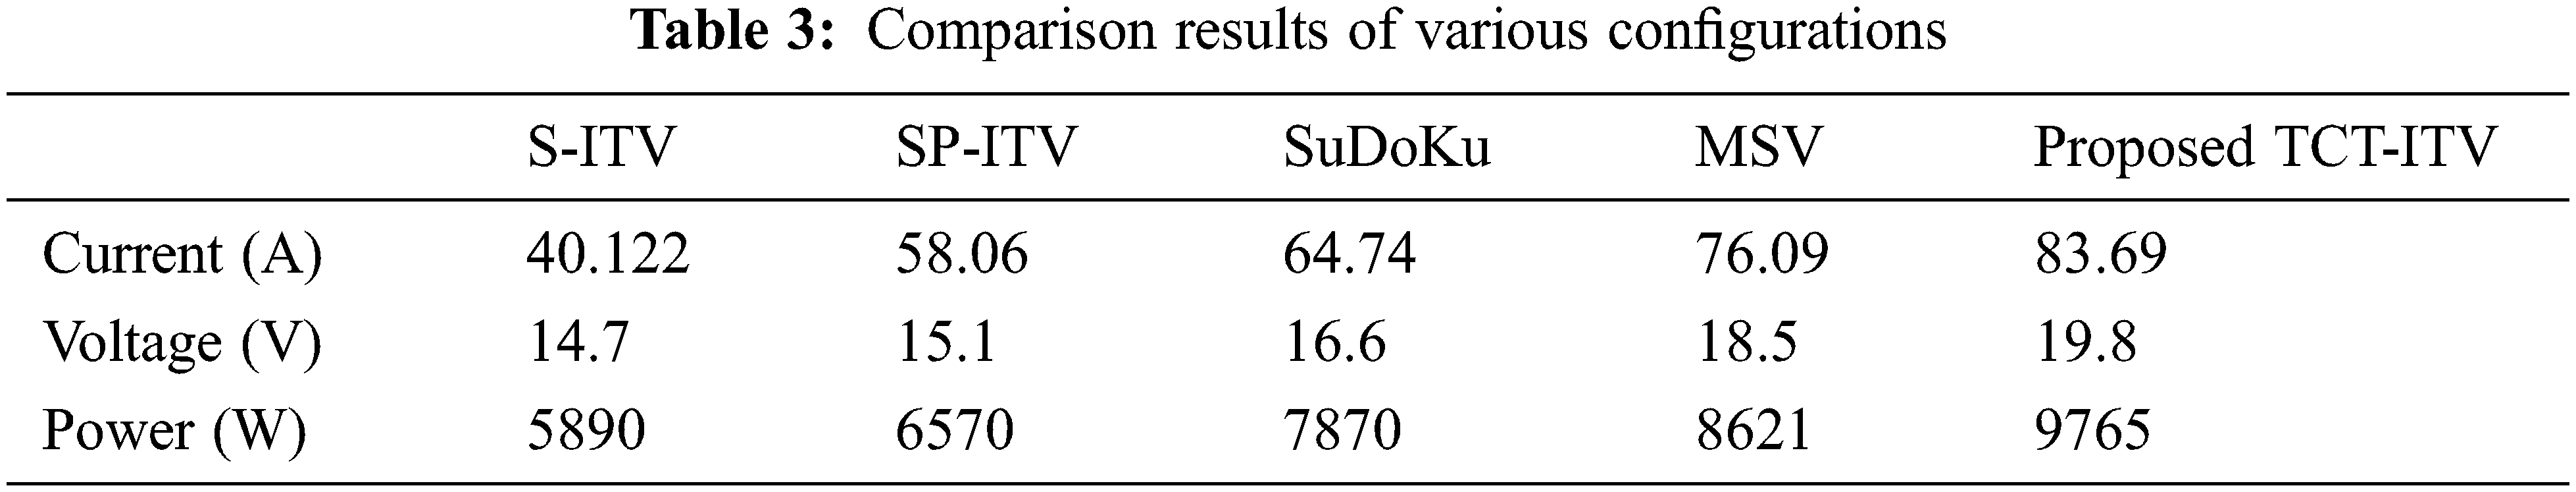
Tab. 3 provides the current, voltage and power of the proposed system with conventional configuration. It is observed that the proposed configuration provides more output than the other conventional configuration.
Figs. 14 and 15 displays the output voltage and current due to various irradiations for different connections. The Proposed Inverted Triangle configuration provides more output results than the conventional configuration. Fig. 16 shows the power relations of Proposed and conventional methods.
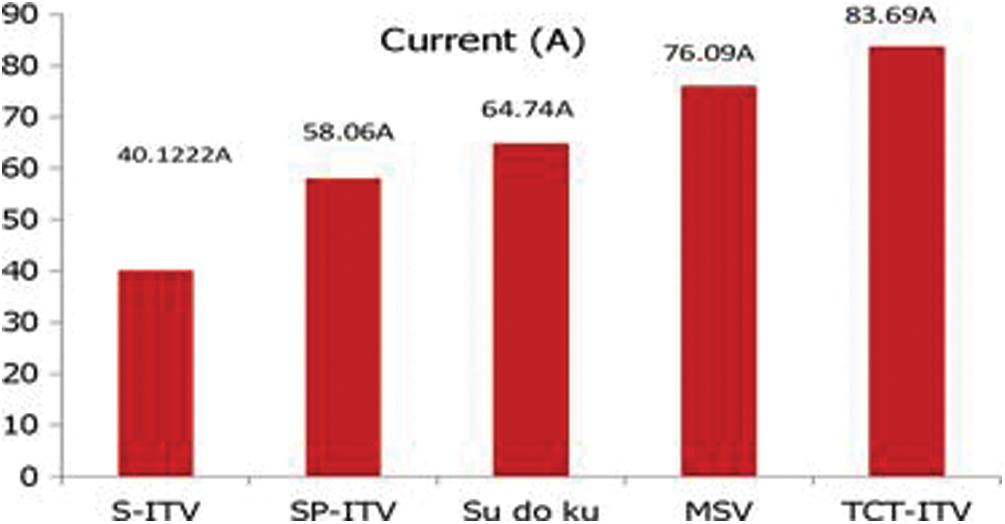
Figure 14: Current output due to various configurations
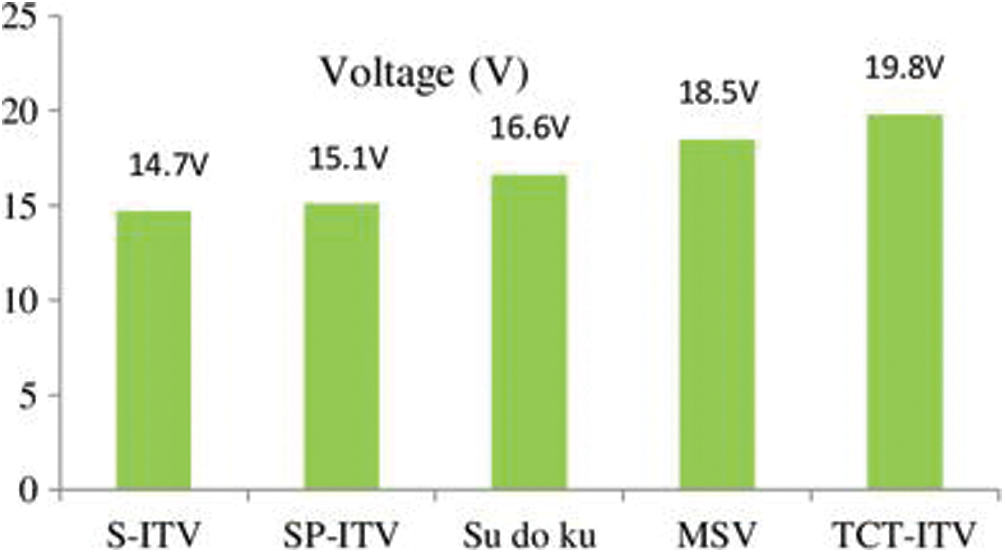
Figure 15: Voltage output due to various configurations
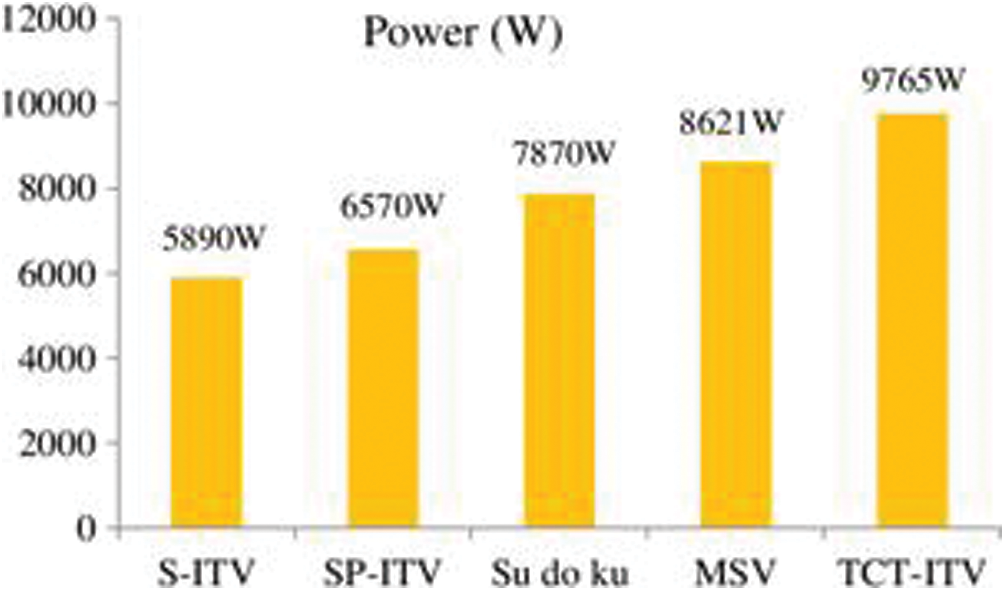
Figure 16: Power output due to various configurations
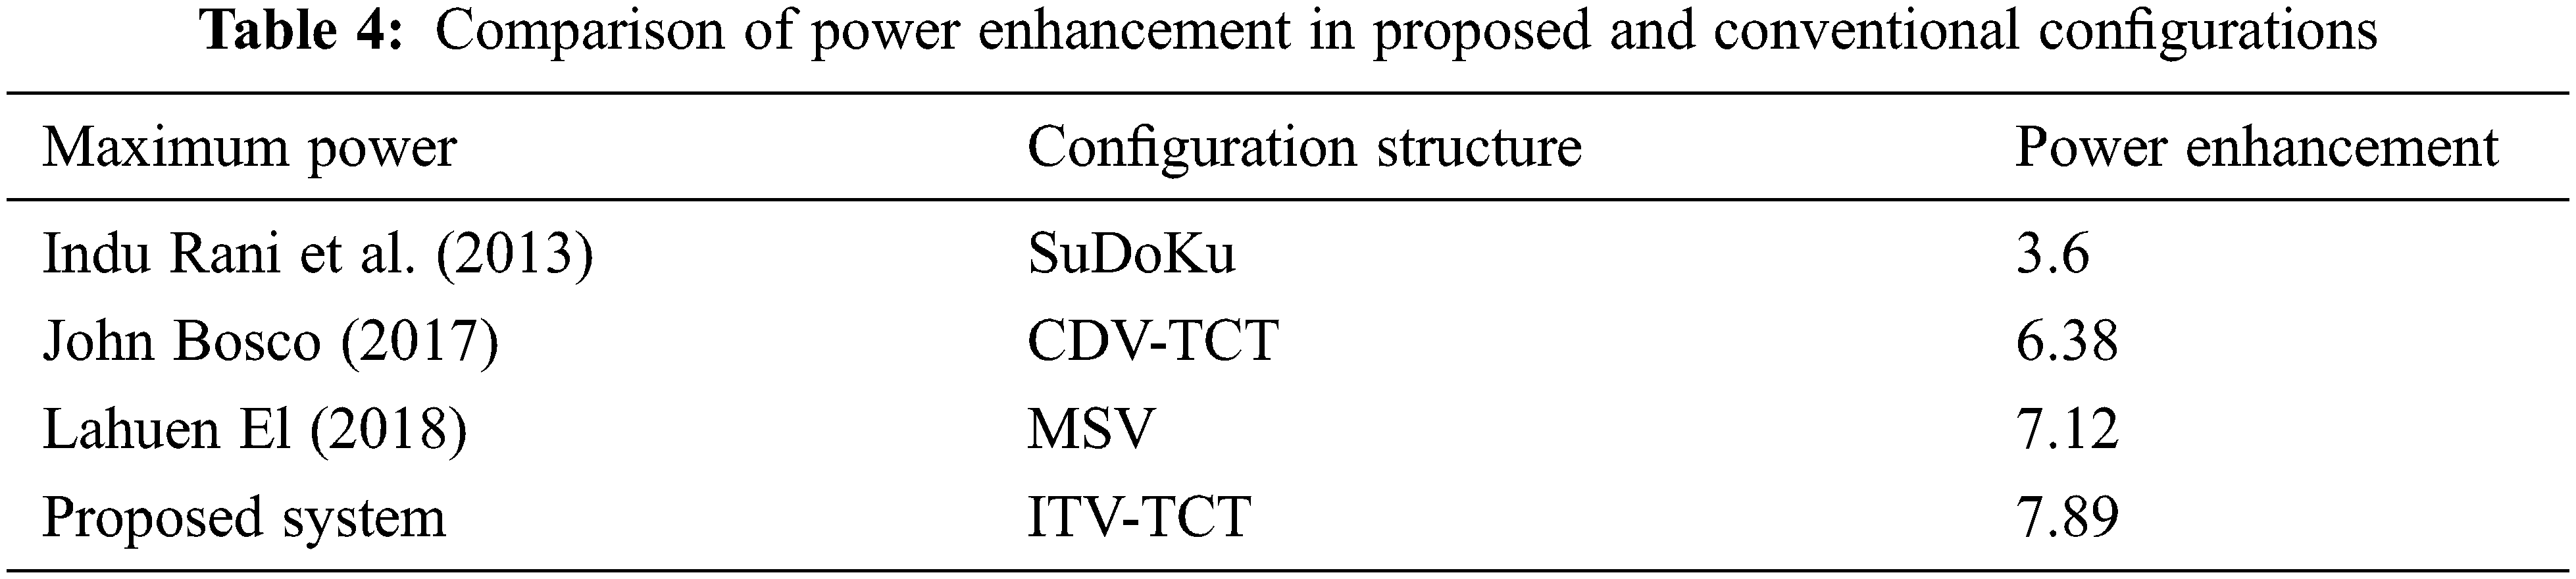
It is observed that by the TCT-ITV configuration, the PV system maximum power generation is 66,000 watts, which is higher than that of the TCT configuration. It can be seen in Tab. 4, the proposed ITV-TCT configuration has higher power enhancement than the conventional configurations such as SDK, CDV and MSV.
The simulation of 9 × 9 solar PV modules under various shading patterns with degrees of shading are performed based on Matlab/Simulink. The three standard configurations of solar PV array consisting of series(s), series-parallel (SP) and total cross-tied (TCT), recently developed SuDoKu, magic square view configuration are studied. This paper proposes ITV configuration for the arrangement of PV modules in a PV array which exhibits an improvement in PV power generation under partially shaded. The ITV configuration spreads the effect of shading over the entire PV modules and decreases the mismatch losses of modules thereby improving the produced PV power. The performance of the system is analyzed, and it is proved that the proposed technique allows better results as compared to conventional schemes. It is observed that by the TCT-ITV configuration, the PV system maximum power generation is 66,000 watts, which is higher than that of the existing topologies available in the literatures such as S, SP and TCT configuration.
Acknowledgement: The authors with a deep sense of gratitude would thank the supervisor for his guidance and constant support rendered during this research.
Funding Statement:The authors received no specific funding for this study.
Conflicts of Interest: The authors declare that they have no conflicts of interest to report regarding the present study.
1. V. Buyanov, “BP: Statistical review of world energy,” Economic Policy, vol. 4, pp. 38–55, 2011. [Google Scholar]
2. O. Ellabban, H. A. Rub and F. Blaabjerg, “Renewable energy resources: Current status, future prospects and their enabling technology,” Renewable and Sustainable Energy Reviews, vol. 39, no. 8, pp. 748–764, 2014. [Google Scholar]
3. A. Appathurai and P. Deepa, “Design for reliablity: A novel counter matrix code for FPGA based quality applications,” in Proc. Asia Symp. on Quality Electronic Design, IEEE, Kula Lumpur, Malaysia, pp. 56–61, 2015. [Google Scholar]
4. G. Prathiba, M. Santhi and A. Ahilan, “Design and implementation of reliable flash ADC for microwave applications,” Microelectronics Reliability, vol. 88, pp. 91–97, 2018. [Google Scholar]
5. H. Patel and V. Agarwal, “MATLAB-based modeling to study the effects of partial shading on PV array characteristics,” IEEE Transactions on Energy Conversion, vol. 23, no. 1, pp. 302–310, 2008. [Google Scholar]
6. S. Seme, G. Stumberge and J. Vorsic, “Maximum efficiency trajectories of a two-axis sun tracking system determined considering tracking system consumption,” IEEE Transactions on Power Electronics, vol. 26, no. 4, pp. 1280–1290, 2011. [Google Scholar]
7. E. Karatepe, M. Boztepe and M. Colak, “Development of a suitable model for characterizing photovoltaic arrays with shaded solar cells,” Solar Energy, vol. 81, no. 8, pp. 977–992, 2007. [Google Scholar]
8. F. Belhachat and C. Larbes, “Modeling, analysis and comparison of solar photovoltaic array configurations under partial shading conditions,” Solar Energy, vol. 120, no. 4, pp. 399–418, 2015. [Google Scholar]
9. R. Ramaprabha and B. L. Mathur, “A comprehensive review and analysis of solar photovoltaic array configurations under partial shaded conditions,” International Journal of Photoenergy, vol. 1, no. 6, pp. 232–229, 2012. [Google Scholar]
10. I. Rani, G. S. Ilango and C. Nagamani, “Enhanced power generation from PV array under partial shading conditions by shade dispersion using SuDoKu configuration,” IEEE Transactions on Sustainable Energy, vol. 4, no. 3, pp. 594–601, 2013. [Google Scholar]
11. L. E. Iysaouy, M. Lahbabi and A. Oumnad, “A novel magic square view topology of a PV system under partial shading condition,” Energy Procedia, vol. 157, pp. 1182–1190, 2019. [Google Scholar]
12. P. Manganiello, M. Balato and M. Vitelli, “A survey on mismatching and aging of PV modules: The closed loop,” IEEE Transactions on Industrial Electronics, vol. 62, no. 11, pp. 7276–7286, 2015. [Google Scholar]
13. K. Pandey, M. S. Hossain, V. V. Tyagi, N. A. Rahim, A. Jeyraj et al., “Novel approaches and recent developments on potential applications of phase change materials in solar energy,” Renewable and Sustainable Energy Reviews, vol. 82, no. Part A, pp. 281–323, 2018. [Google Scholar]
14. G. Ozoegwu, C. A. Mgbemene and P. A. Ozor, “The status of solar energy integration and policy in Nigeria,” Renewable and Sustainable Energy Reviews, vol. 70, no. 4, pp. 457–471, 2017. [Google Scholar]
15. E. Kabir, P. Kumar, S. Kumar, A. A. Adelodun and K. H. Kim, “Solar energy: Potential and future prospects,” Renewable and Sustainable Energy Reviews, vol. 82, no. 74, pp. 894–900, 2018. [Google Scholar]
16. N. Kannan and D. Vakeesan, “Solar energy for future world: A review,” Renewable and Sustainable Energy Reviews, vol. 62, no. 1, pp. 1092–1105, 2016. [Google Scholar]
17. Mermoud and T. Lejeune, “Partial shadings on PV arrays: By-pass diode benefits analysis,” in Proc. European Photovoltaic Solar Energy Conf., Valencia, Spain, pp. 1–5, 2010. [Google Scholar]
18. T. Tubniyom, W. Jaideaw, R. Chatthaworn, A. Suksri and T. Wongwuttanasatian, “Effect of partial shading patterns and degrees of shading on total cross-tied (TCT) photovoltaic array configuration,” Energy Procedia, vol. 153, no. 2, pp. 35–41, 2018. [Google Scholar]
19. S. Mohammadnejad, A. Khalafi and S. M. Ahmadi, “Mathematical analysis of total-cross-tied photovoltaic array under partial shading condition and its comparison with other configurations,” Solar Energy, vol. 133, no. 7, pp. 501–511, 2016. [Google Scholar]
20. Sivasankari and A. Ahilan, “Smart energy harvesting for intelligent railway condition monitoring system,” Journal of Electrical Engineering, vol. 19, no. 2, pp. 17, 2019. [Google Scholar]
21. G. Sagar, D. Pathak, P. Gaur and V. Jain, “A Su Do Ku puzzle-based shade dispersion for maximum power enhancement of partially shaded hybrid bridge-link-total-cross-tied PV array,” Solar Energy, vol. 204, no. 3, pp. 161–180, 2020. [Google Scholar]
22. A. Fathy, “Butterfly optimization algorithm-based methodology for enhancing the shaded photovoltaic array extracted power via reconfiguration process,” Energy Conversion and Management, vol. 220, no. 1, pp. 113115, 2020. [Google Scholar]
23. P. Verma, R. Garg and P. Mahajan, “Asymmetrical interval type-2 fuzzy logic control based MPPT tuning for PV system under partial shading condition,” ISA Transactions, vol. 100, no. 2, pp. 251–263, 2020. [Google Scholar]
24. S. Anjum, V. Mukherjee and G. Mehta, “Maximum power generation from novel triangular-shaped PV array configurations under partial shading conditions,” Journal of Energy Engineering, vol. 147, no. 5, pp. 4021033, 2021. [Google Scholar]
25. A. A. Desai and S. Mikkili, “Novel hybrid PV Configurations to enhance the output power and efficiency by minimizing the number of peaks and mismatching loss,” IETE Journal of Research, vol. 3, pp. 1–19, 2021. [Google Scholar]
26. R. Aringhoff, G. Brakmann, M. Geyer and S. Teske, “Concentrated solar thermal power-now,” in Greenpeace, ESTIA, Solar PACES Brochure, 1st ed., vol. 1. Georg, Netherlands: Research Gate, pp. 15–64, 2004. [Google Scholar]
 | This work is licensed under a Creative Commons Attribution 4.0 International License, which permits unrestricted use, distribution, and reproduction in any medium, provided the original work is properly cited. |