DOI:10.32604/iasc.2022.024142

| Intelligent Automation & Soft Computing DOI:10.32604/iasc.2022.024142 |  |
| Article |
An Enhanced Re-Ranking Model for Person Re-Identification
Department of Computer Science and Engineering, School of Computing, SRM Institute of Science and Technology, Potheri, Kattankulathur, 603203, Tamil Nadu, India
*Corresponding Author: Jayavarthini Chockalingam. Email: jayavarc@srmist.edu.in
Received: 06 October 2021; Accepted: 22 November 2021
Abstract: Presently, Person Re-IDentification (PRe-ID) acts as a vital part of real time video surveillance to ensure the rising need for public safety. Resolving the PRe-ID problem includes the process of matching observations of persons among distinct camera views. Earlier models consider PRe-ID as a unique object retrieval issue and determine the retrieval results mainly based on the unidirectional matching among the probe and gallery images. But the accurate matching might not be present in the top-k ranking results owing to the appearance modifications caused by the difference in illumination, pose, viewpoint, and occlusion. For addressing these issues, a new Hyper-parameter Optimized Deep Learning (DL) approach with Expanded Neighborhood Distance Reranking (HPO-DLDN) model is proposed for PRe-ID. The proposed HPO-DLDN involves different processes for PRe-ID, such as feature extraction, similarity measurement, and feature re-ranking. The HPO-DLDN model uses a Adam optimizer with Densely Connected Convolutional Networks (DenseNet169) model as a feature extractor. Additionally, Euclidean distance-based similarity measurement is employed to determine the resemblance between the probe and gallery images. Finally, the HPO-DLDN model incorporated ENDR model to re-rank the outcome of the person-reidentification along with Mahalanobis distance. An extensive experimental analysis is carried out on CUHK01 benchmark dataset and the obtained results verified the effective performance of the HPO-DLDN model in different aspects.
Keywords: Person re-identification; deep learning; optimization; similarity measurement; re-ranking process; DenseNet
Person Re-Identification (PRe-ID) aims to recognize a person to be actually explored in views that are generated by several non-overlapping cameras covering a wider region [1]. A person’s existence could be acquired by matching the required person in various perceptions of the camera. Actually, when a pedestrian vanishes from the view of a camera and again appears in field of view of alternate camera, then PRe-ID process must be applied to find the pedestrian. Thus, PRe-ID finds useful in common applications and is highly challenging because of the numerous deviations in pedestrians present in various images and video clippings. In recent times, PRe-ID process depends upon artificial datasets. In order to accelerate a monitoring task in common applications, pedestrian images are captured by numerous cameras in various positions. Then, manual or automated image labelling process takes place to mark the pedestrians present in the images. Traditional and common datasets isolate pedestrians from the image, which means that the PRe-ID is classified as 2 major phases namely, feature extraction and metric learning.
In PRe-ID, a probe image of the required person is fed to the system. Then, the relevant pictures of probe are obtained from various gallery image datasets. Next, the quantification of learning model is performed and the identical images of probe are generated. Since, extraction of useful and applicable features tends to enhance the PRe-ID task, feature extraction is one of the essential PRe-ID processes. Users could be prone to sudden changes in background. A person is investigated by diverse points of camera view. For instance, [2] applied symmetric data among the images of pedestrians, in order to overcome the camera perspective modifications. [3] projected the scheme of shape and appearance context to make spatial distribution of human body elements that, have conserved maximum differentiability, since the pedestrians are organized randomly. [4] concatenated gait and crowd context details for defining the pedestrian characteristics. Even though the features are complicated for disturbances in a pedestrian, only some features have exhibited considerable efficiency when compared with pedestrian matching. For sample, few characteristics are better in differentiating pedestrians whereas others are highly effective for perspective modifications. Hence, the features have to be considered randomly in pedestrian detection. Methods like ranking as well as distance metric learning were projected to show the significance of various features as well as weight Feature Selection (FS).
In recent times, eminent level semantic features like hair and dressing style were used for computing effective PRe-ID process. When compared with alternate features, the high-level parameters are discrete and match the prediction process. Various attribute learning models were deployed for extracting high-level attributes. [5] developed face parameters for PRe-ID and applied pedestrian variables to create the attribute transfer module. Then semantic information is generated for pedestrian implication.
Deep Learning (DL) is a well-known and proficient method used for extracting high-level semantic features, with modern advancements for gaining best function in PRe-ID. For instance, the efficiency of deep modules is reliant on, (i) transparent capability of a model to be maximized by deeper network structure, which deals with the modifications present in the pedestrian image, brightness, background, and additional factors in the posture; and (ii) the probe is abstracted with extremely semantic feature definition. Developers have concentrated on PRe-ID process in recent times as it is considered to be important in public safety screening as well as warning methods. Therefore, developing interpretable person PRe-ID models is essential for end users. Basically, surveillance systems are operated independently with no human contribution for predicting the existence of pedestrians from cameras placed in streets which is also emanated with limitations of capturing location, minimum resolution, and huge scale lighting modifications. Unlike, it is highly applicable for pedestrians matching when compared with wearing and carrying process. Furthermore, the concatenation of deep features and metric learning helps in learning whether the unified approach is capable of certain domains and enhances the degree of security on detection made by a machine.
The function of feature transformation is limited if the complexity of developed model becomes impossible for dynamic scenarios. Hence, distance metric learning is employed for resolving the issues of feature matching. The major objective of Metric Learning (ML) is to identify best distance metric during the process of learning sample distribution where the features of similar pedestrian in various scenarios are same and character margin of diverse pedestrians are enhanced. Classical distance metric frameworks like Large Margin Nearest Neighbor (LMNN) as well as Information Theoretic Metric Learning (ITML) cannot be applied in real-time applications because of the requirement for massive data as well as prolonged optimization iterations. Currently, some of the productive approaches like Keep-it-simple-and-straightforward metric learning (KISSME), probability relative distance comparison, relaxed pairwise learned metric, and Ranking by support vector machine (RankSVM) were employed. Though the above approaches are efficient in identification task, it is still suffering from issues. Distance metric learning and tiny sample sizes are constant with clear challenge in PRe-ID.
Since the person re-identification (Pre-ID) is a tedious task due to the variation in appearance caused by the differences in illumination, pose, viewpoint, and occlusion, A new deep learning (DL) with an expanded neighborhood distance reranking (HPO-DLDN) model is presented for PRe-ID. The proposed HPO-DLDN model performs PRe-ID by the use of different processes namely feature extraction, similarity measurement, and feature re-ranking. The HPO-DLDN model uses a Densely Connected Convolutional Networks (DenseNet169) model for feature extraction to extract robust discriminant features from the probe and gallery image. Furthermore, Euclidean distance-based similarity measurement is employed to determine the resemblance between the probe and gallery images. Lastly, the HPO-DLDN model incorporated ENDR model to re-rank the outcome of the person-reidentification along with Mahalanobis distance. Extensive set of simulation analysis was carried out to highlight the goodness of the proposed HPO-DLDN model.
This section reviews recent works carried out on the process of Pre-ID. Fan et al. employed Convolutional Neural Network (CNN) for computing feature extraction to cluster the unlabeled features [6], and consequently fine-tune the limited scalable information closer to cluster center. Wang et al. applied DL mechanism with no labels from other viewpoints [7]. It aims to transfer the identify variables to the feature space of unlabeled pedestrians. Supervised neural networks are considered to be the mainstream model used in feature extraction of PRe-ID. The unsupervised learning methods are weaker when compared with supervised learning approach for PRe-ID since, the inadequately labeled data derivatives and capability to perceive data from context-aware identity, that has few changes in pedestrian appearance. Pedestrian-reliant detectors are enhanced with better accuracy, require massive annotation process.
Specifically, supervised neural networks are significant for [8] presented by AlexNet scheme which does not apply the unsupervised pre-training, rather than adding rectified linear units (ReLU) activation functions as well as graphical processing units (GPU) to eliminate overfitting issues. It is classified into 3 major classes like extraction of useful features based on pedestrian appearance, enhancing the network infrastructure for feature extraction; and changing the loss function of NN. Mostly, the above defines schemes are reliant on CNN, whereas some other models are dependent on Recurrent Neural Network (RNN). Varior et al. implied a scheme on the basis of Long Short-Term Memory system (LSTM) [9], which applied contextual data for frequent process in image regions to gain hierarchical pedestrian characteristics.
A CNN based multi scale context aware network (MSCAN) approach was proposed by [10]. Additionally, the advancements were developed in deep feature extraction system. Xiao et al. introduced a domain-based dropout framework for sensitivity of neurons to various data applications [11]. A reliable distance-based learning approach was proposed for diverse pedestrian directions [12]. A layer to CNN system was created for estimating the cross-input variations [13]. It captured relationship among input images reliant on intermediate-layer features of probe image.
The working process of HPO-DLDN model is demonstrated in Fig. 1. As depicted in the figure, initially, the DenseNet-169 model-based feature extraction process is carried out to determine the useful set of feature vectors of the probe image and gallery images. The similarity measure is taken between the query vectors and gallery vectors using Euclidean distance. Initial ranking and re-ranking process is done by the ENDR model with Mahalanobis distance. Finally, the images with top

Figure 1: Workflow of the proposed HPO-DLDN model
3.1 DenseNet Based Feature Extraction
Once the input probe images are fed into the HPO-DLDN model, the foremost step of feature extraction process is executed to determine the actual feature vectors. Actually, CNN models are evolved from DL method. It is applied for PRe-ID process. Firstly, CNNs are applied for Re-ID and rank the images collected from gallery either as true or false. CNNs are effective in image classification that classifies the relevant images according to the given input image. Moreover, image tensor has been convolved using collection of
The individual matrix

Figure 2: CNN structure
In order to reduce the computational multifaceted behavior, CNNs apply pooling layers which is useful in reducing the size of final layer from input with one layer. Diverse pooling strategies are employed to reduce the output at the time of preserving essential properties. Also, the prominently used pooling methods are max-pooling in which huge scale activation is selected as a pooling window.
The CNN is executed as differential model which applies backpropagation (BP) method obtained from sigmoid (Eq. (2)), or (ReLU (Eq. (3)) activation functions. Finally, the consequent layer is comprised of single node with sigmoid activation function to find the actual person from diverse nodes for a single class. Softmax activation function is used in multi-class issues (as depicted in Eq. (4)).
Here, Adam optimizer is applied. It is a Stochastic Gradient Descent (SGD) model which applies the 2 primary moments of gradient (
where
DenseNet is one of the familiar DL architectures commonly used for object detection as shown in Fig. 3. In DenseNet, every layer receives extra inputs from every previous layer and passed it to the individual feature map to every succeeding layer. The layers are received as collective knowledge from every preceding layer. As the layers receive feature map as input from the earlier layers, the network could become thin and compact. In this study, the DenseNet-169 model is utilized. Fig. 4 illustrates the layers in DenseNet-169 model.

Figure 3: Different architectures of DenseNet
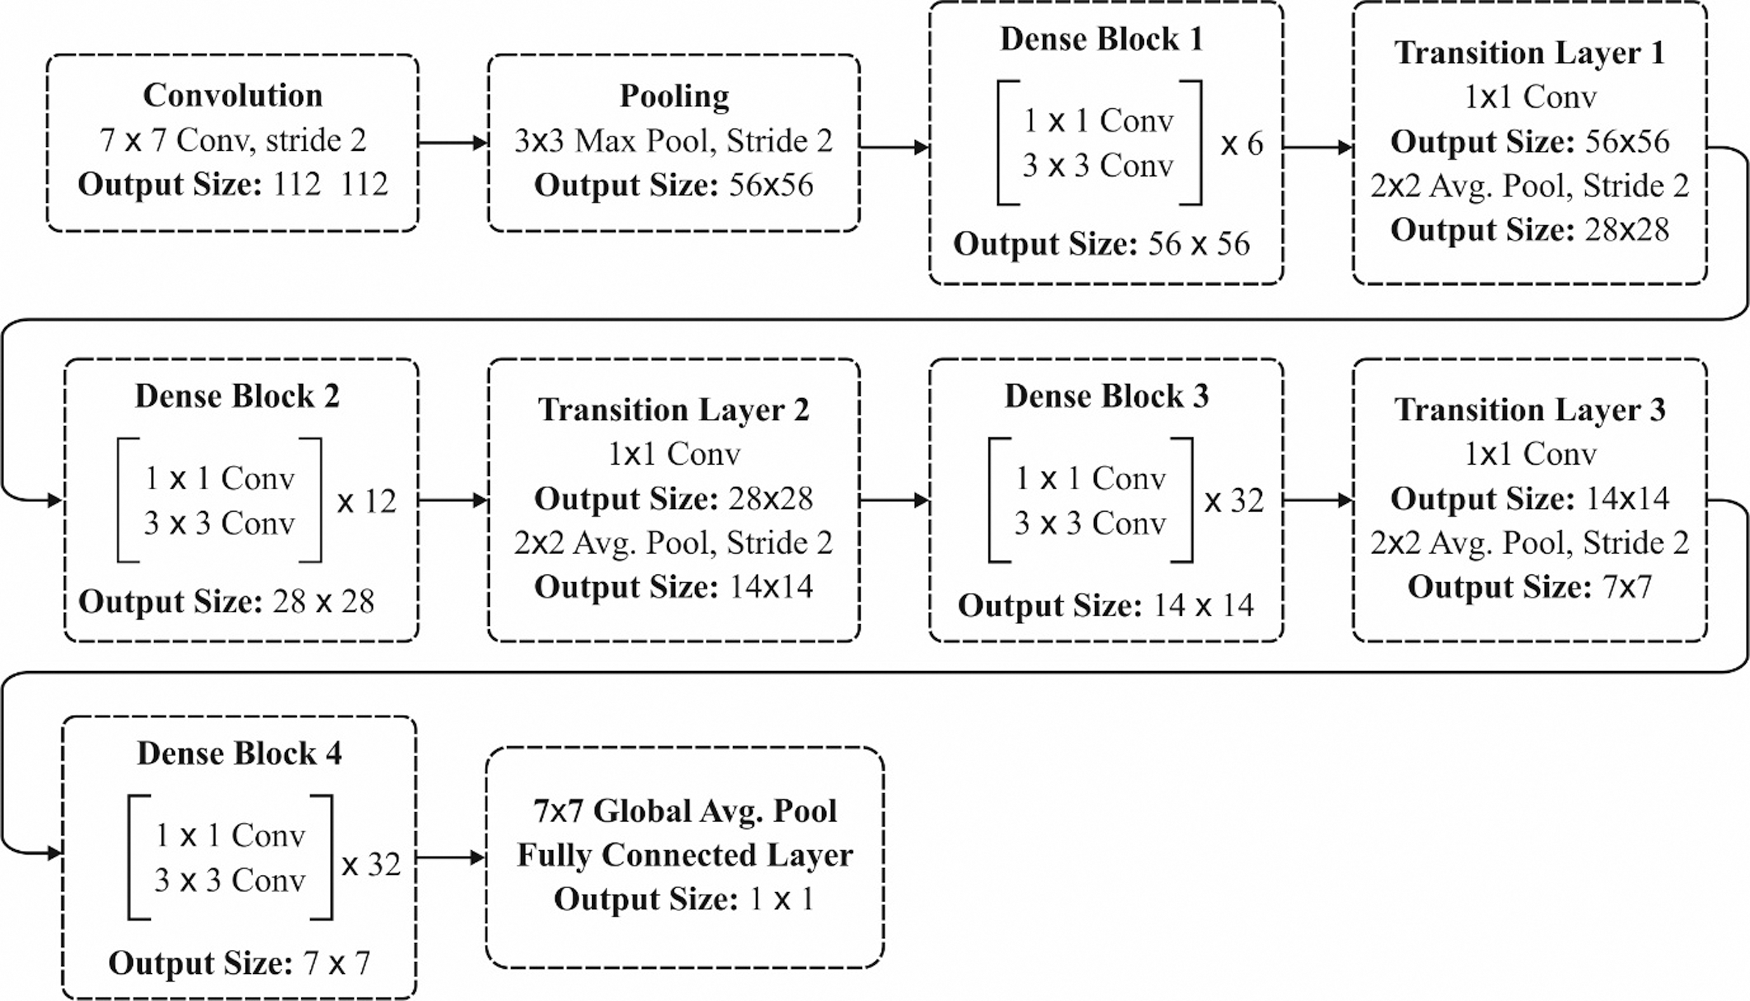
Figure 4: Layers in DenseNet-169 model
Next to the feature extraction process, Euclidean distance base similarity measurement approach is applied to determine the highly relevant images from the gallery. Euclidean distance is one of the intuitive metrics used to show the distance value. Assume a dataset X, with
By means of vector process, Eq. (9) is formulated as,
In the PRe-ID process, the estimation model of Euclidean distance shows robust execution. Therefore, Euclidean distance considers every dimension uniformly. Various features among the samples are distinct [15]. The features are classified as primary and unknown. Few unseen features of interference can be removed from metric learning.
3.3 ENDR Based Re-ranking Process
At this stage, the re-ranking process gets executed by the execution of the ENDR model. Usually, actual distance from two images
In Eq. (11),
In Expanded neighborhoods distance,
In general, once the initial ranking list
Lastly, END distance of image pair
where
Here, final distance in re-ranking is accomplished. The initial distance of last re-ranking, collects the Mahalanobis distance and pass to calculate END distance:
where
Mahalanobis distance metric refers the identification of person from the collective gallery. Assume the pair of feature vector as
where,
The performance of the proposed HPO-DLDN model has been validated against CUHK01 dataset [17]. It comprises images of 3884 persons took from 971 characters correspondingly. All the identities include two samples for every camera dimension. Few sample images from the dataset are illustrated in Figs. 5–7.
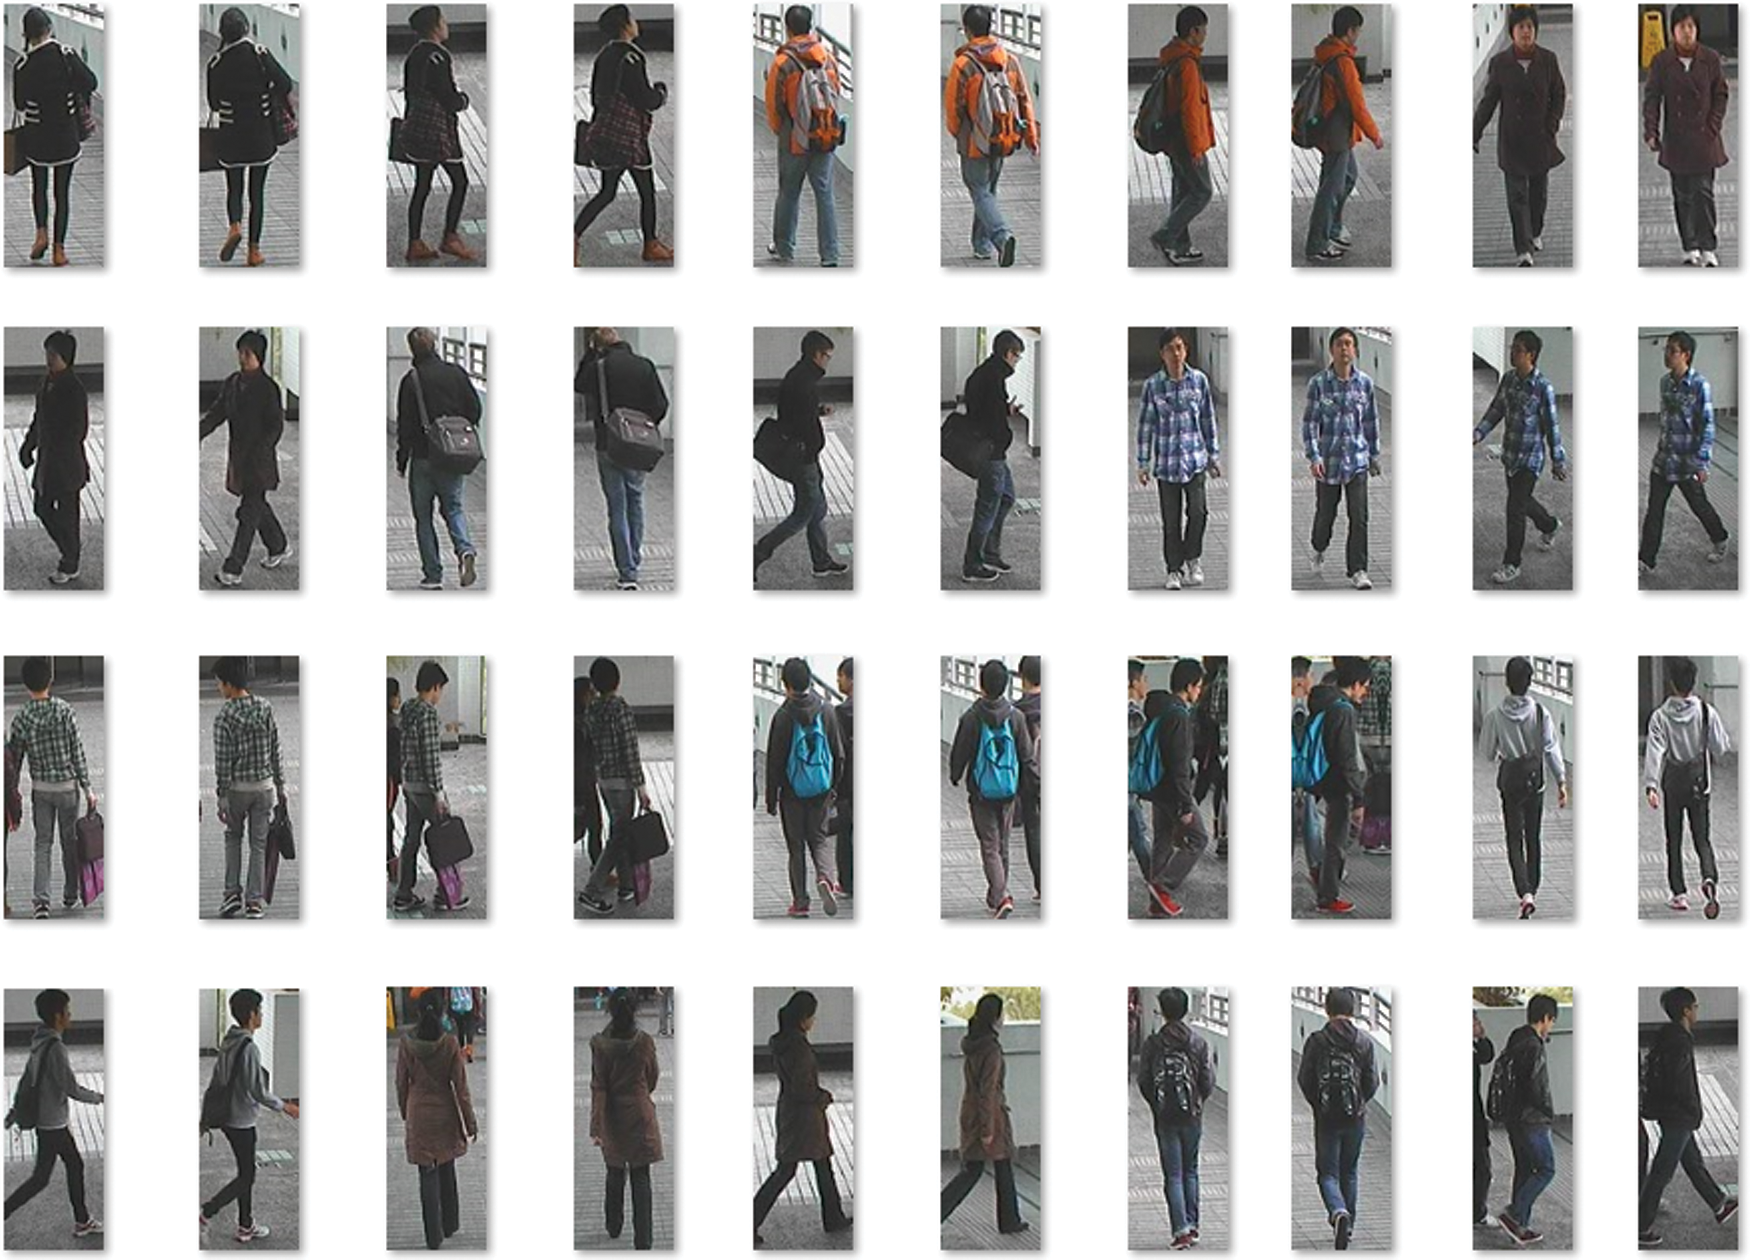
Figure 5: Sample images
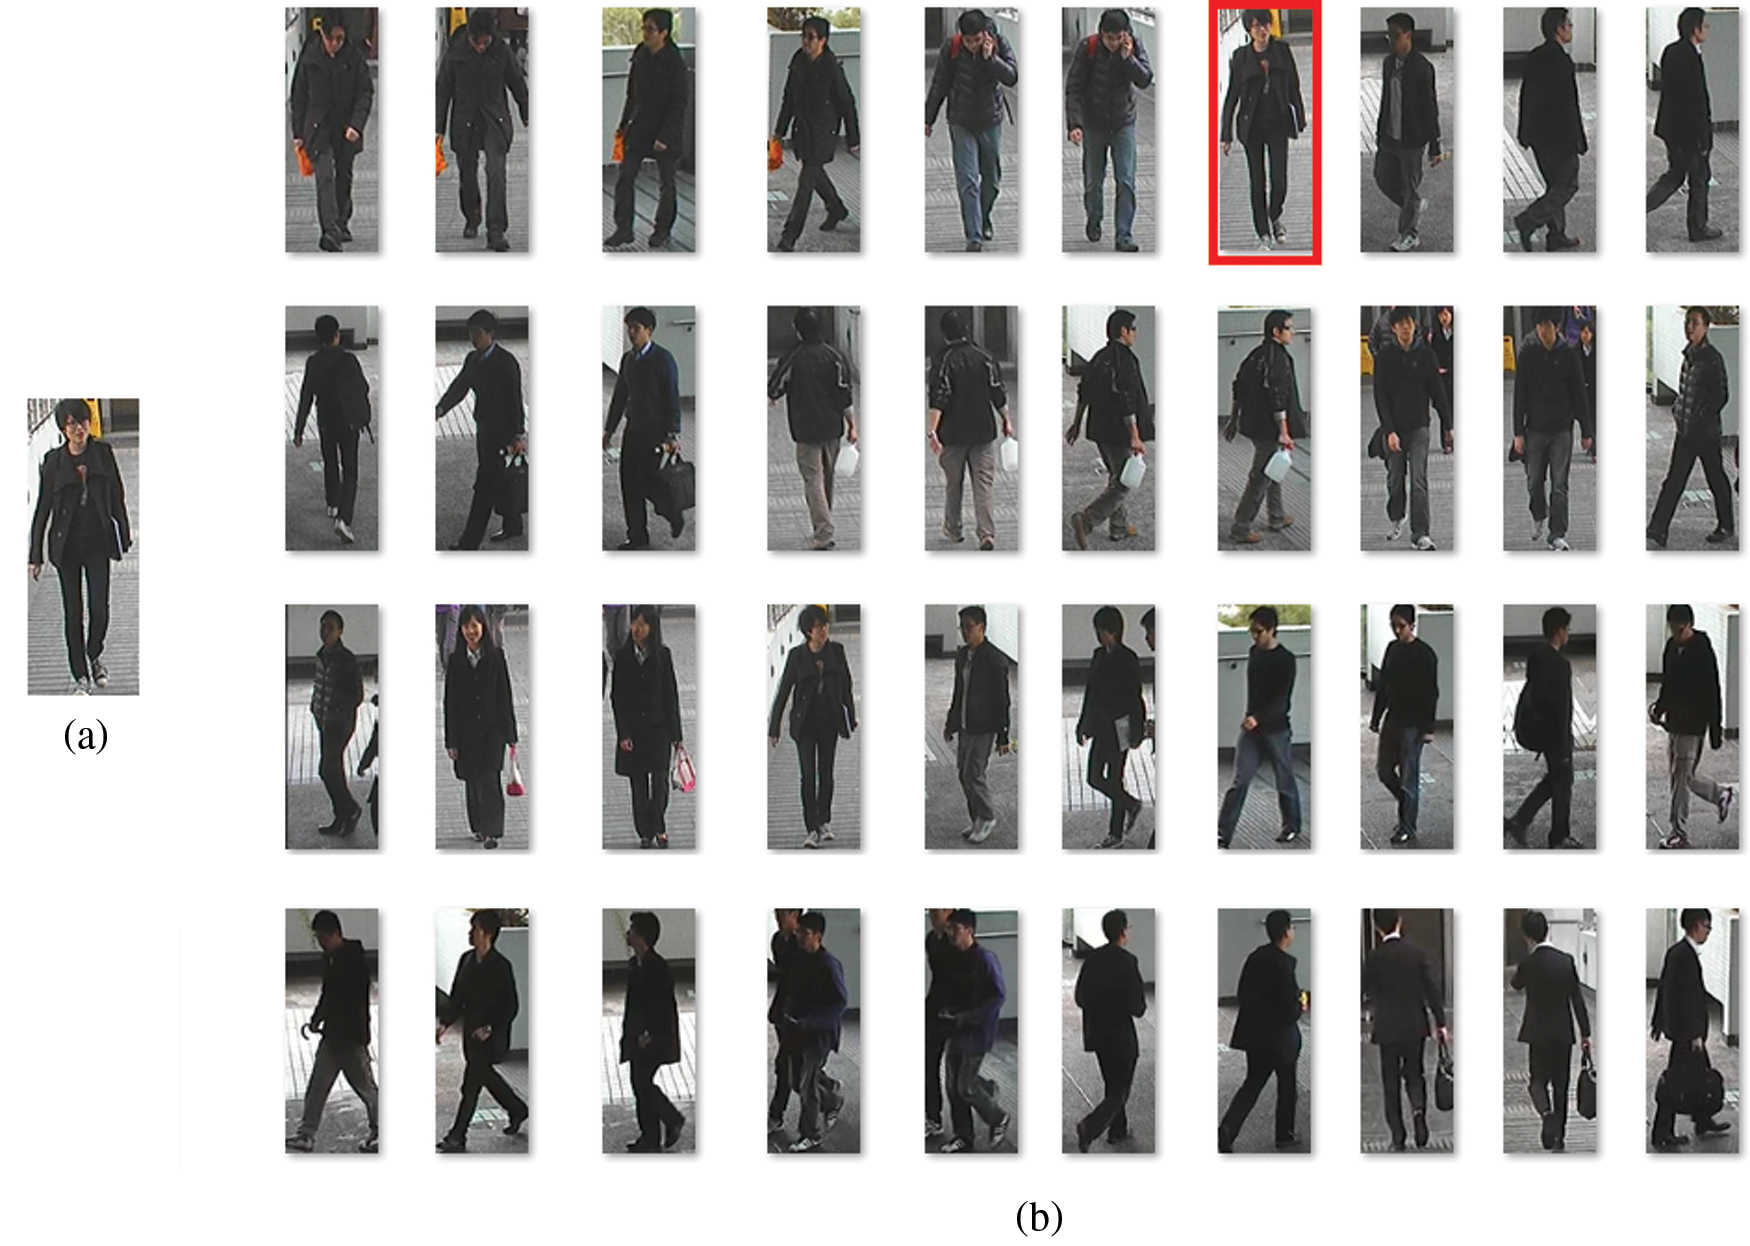
Figure 6: Sample probe and initial ranked list (a) Probe (b) Initial ranked list
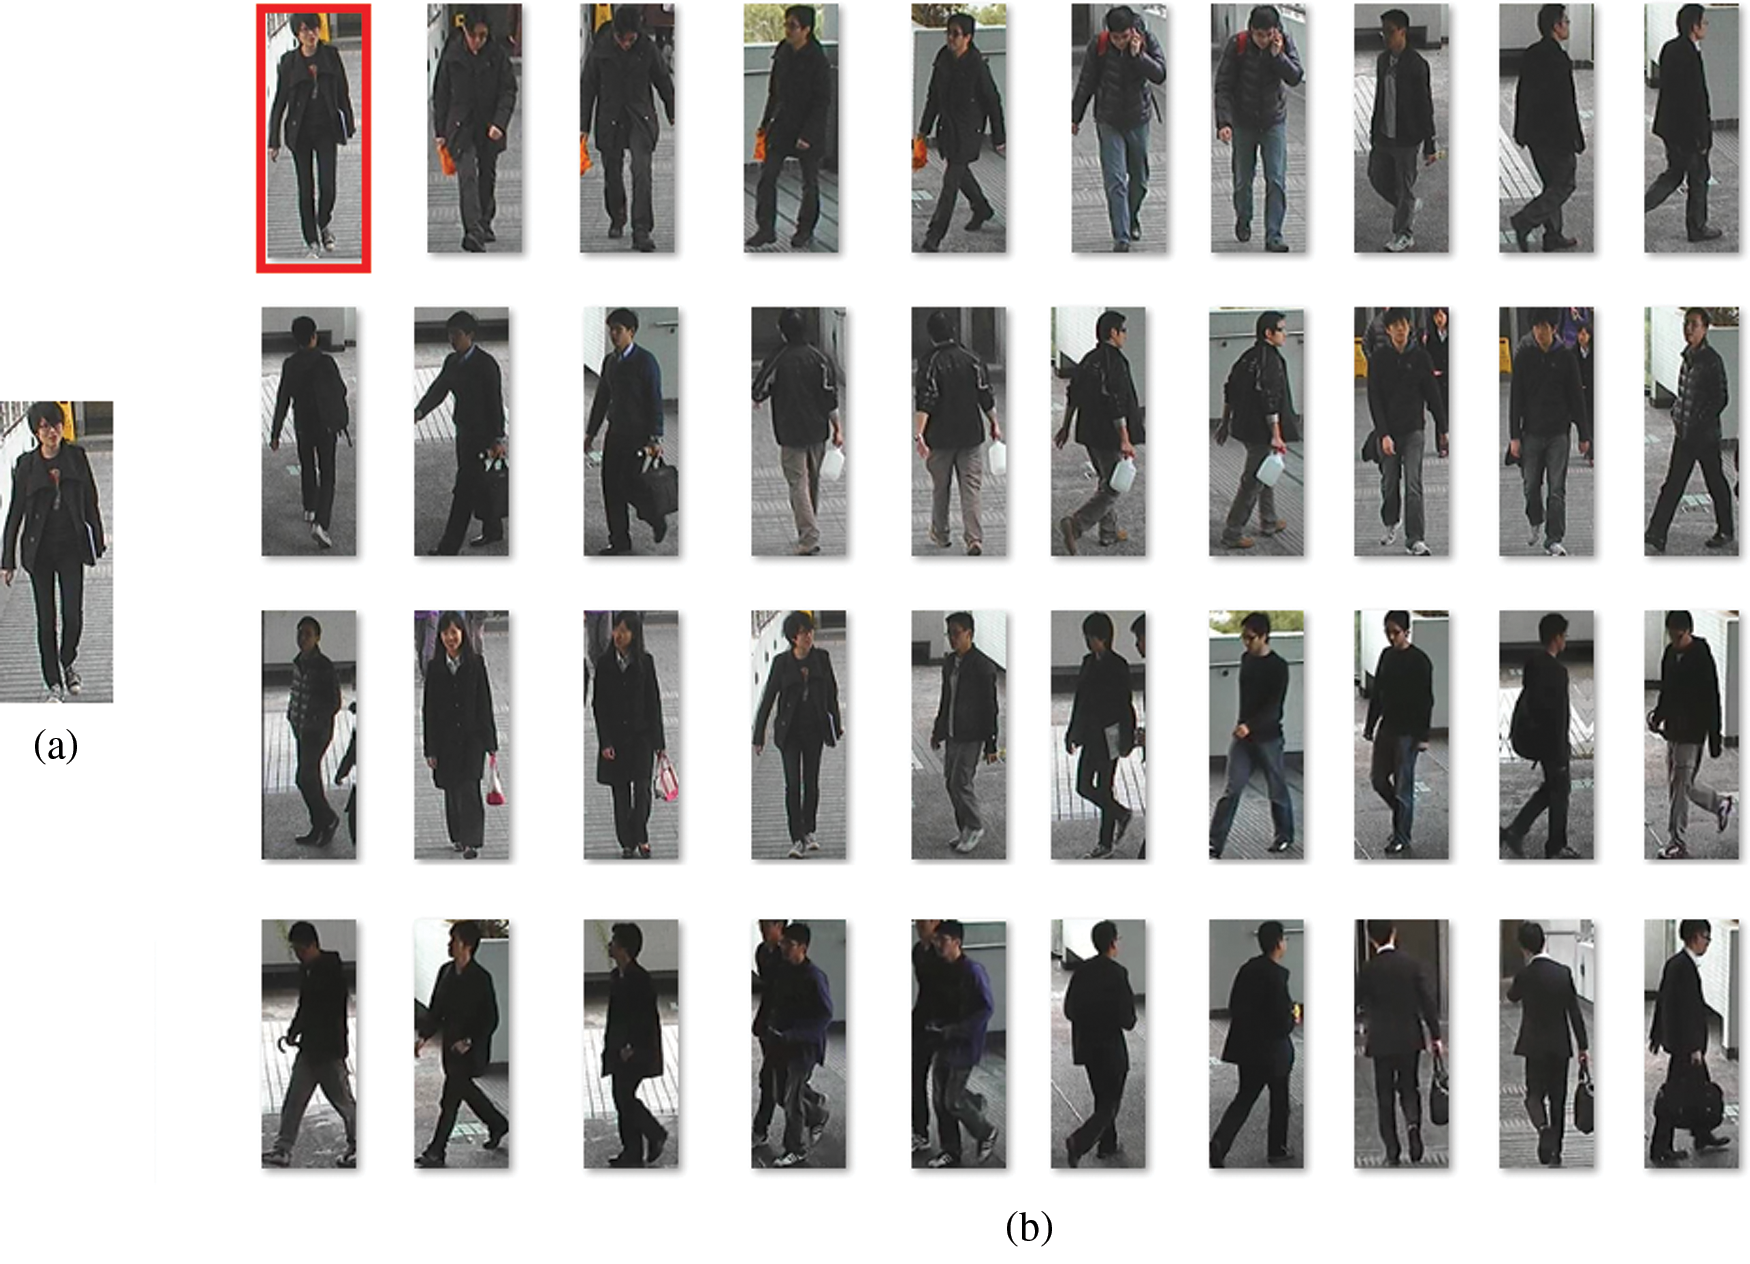
Figure 7: Sample probe and re-ranked list (a) Probe (b) Re-ranked list
Tab. 1 and Fig. 8 depict the analysis of the results achieved by the HPO-DLDN model under varying number of ranks [18]. Ranked accuracy metric is used for comparison. Rank 1 accuracy is calculated as the percentage of number of times the top most matched image is the same as ground truth image. Rank 5 accuracy is calculated as the percentage of number of times the matched image is the same as ground truth image and appear in the top 5 of matched results. Rank 10 accuracy is calculated as the percentage of number of times the matched image is the same as ground truth image and appear in the top 10 of matched results. Rank 20 accuracy is calculated as the percentage of number of times the matched image is the same as ground truth image and appear in the top 20 of matched results.
On determining the results under rank-1, the MCC model has shown poor performance by offering the least accuracy of 12%. At the same time, the ITML and Adaboost models depicted slightly better outcomes over the MCC with the closer accuracy values of 21.67% and 22.79% respectively. Followed by, the Xing’s and LMNN models have demonstrated higher accuracy values over the earlier models with the accuracy of 23.18% and 23.7% respectively. Besides, L1-Norm and PRDC models demonstrated moderate accuracy of 26.73% and 32.6%. Ahmed et al. has shown an accuracy of 65%. These models failed to outperform the proposed HPO-DLDN model which has a maximum accuracy of 90.23%. On determining the results under rank-5, the MCC model shows poor performance by offering a minimum accuracy of 33.66%. Simultaneously, the ITML and Adaboost methods have showcased moderate outcomes over the MCC with the closer accuracy values of 41.8% and 44.41% respectively. Then, the Xing’s and LMNN models illustrated considerable accuracy values over the earlier models with the accuracy of 45.24% and 45.42% respectively. On the other hand, the L1-Norm models and PRDC showcased better accuracy of 54.55% and 49.04%. Ahmed et al. has shown an accuracy of 87.94%. The above techniques failed to perform well than the proposed HPO-DLDN model which has gained a maximum accuracy of 92.18%.

Similarly, on determining the results under rank-10, the MCC method shows poor performance by offering the least accuracy of 47.96%. Meantime, the ITML and Adaboost models depicted slightly better outcomes over the MCC with the closer accuracy values of 55.12% and 57.16% respectively. The Xing’s and LMNN models demonstrated somewhat higher accuracy values over the earlier models with the accuracy of 56.9% and 57.32% correspondingly. Next, the PRDC and L1-Norm approaches illustrated an acceptable accuracy of 65.89% and 60.32%. Though the Ahmed et al. model exhibited maximum accuracy values of 93.12%, it failed to outperform the proposed HPO-DLDN model which has achieved a maximum accuracy of 94.97%.
Likewise, on computing the results under rank-20, the MCC technique showed inferior performance by offering the least accuracy of 67%. The Adaboost and ITML approaches demonstrated somewhat higher accuracy values over the previous models with the accuracy of 70.55% and 71.31% respectively. Meanwhile, the LMNN and Xing’s models depicted slightly better outcomes with identical accuracy values of 70.92% and 70.46% respectively. Besides, the PRDC and L1-Norm models showcased reasonable accuracy of 78.30% and 72.07%. Though the Ahmed et al. model exhibited maximum accuracy values of 97.20% at Rank 20, it failed to outperform the proposed HPO-DLDN model which has obtained a maximum accuracy of 90.23% at Rank 1 itself.
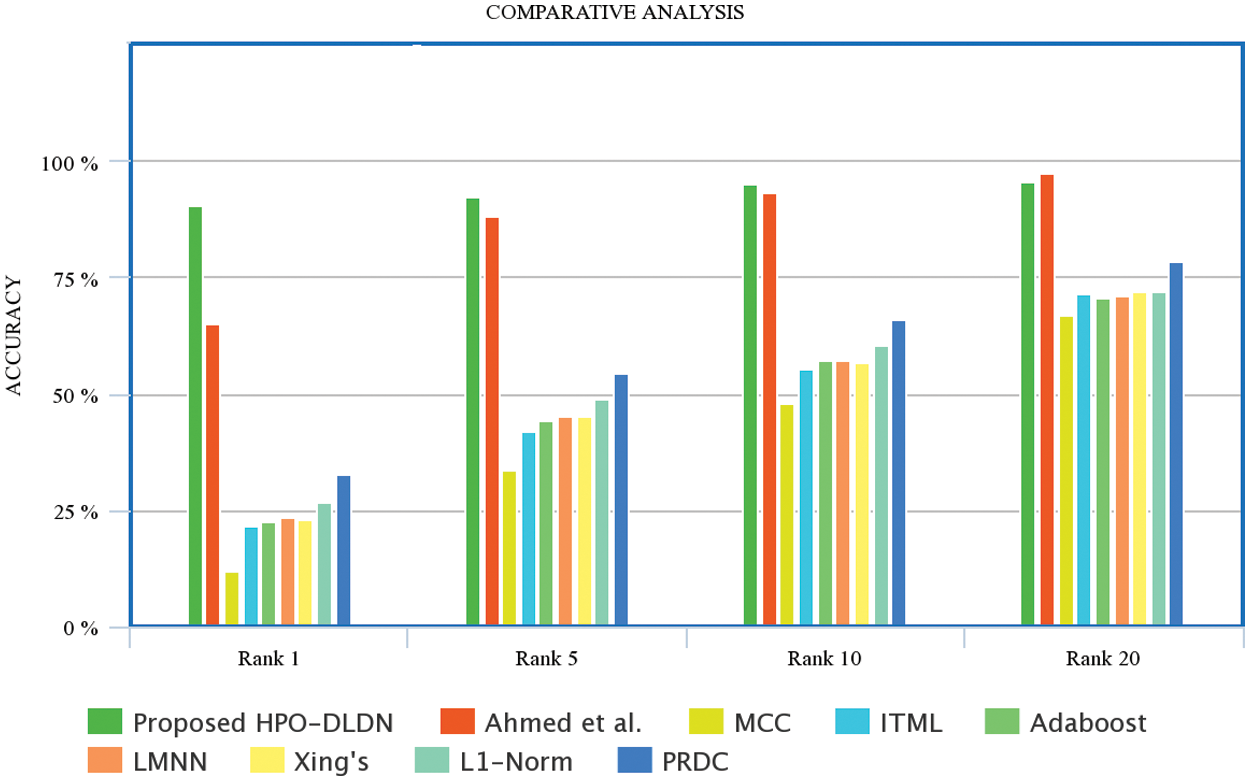
Figure 8: Result analysis of HPO-DLDN model
Tab. 2 shows the comparative analysis of the results achieved by the HPO-DLDN model under Rank-1 and mean average precision (mAP) [19]. Fig. 9 demonstrated that the result obtained by HPO-DLDN model under rank-1, the LOMO + XQDA model has shown poor performance by offering the least accuracy of 49.7%.

At the same time, the LOMO + XQDA + k-RE and IDE (C) models depicted slightly better outcomes over the LOMO + XQDA with the closer accuracy values of 50% and 57% respectively. The IDE (C) + k-RE and IDE (C) + XQDA + k-RE models demonstrated somewhat higher accuracy values over the earlier models with the accuracy of 57.2% and 61.6% respectively. Besides, IDE (C) + XQDA model demonstrated moderate accuracy of 61.7%. Though the Inceptionv3+KISSME and ResNet50+KISSME models exhibited higher accuracy values of 86.91% and 87.47%, it failed to outperform the proposed HPO-DLDN model which has obtained a maximum accuracy of 89.74%.
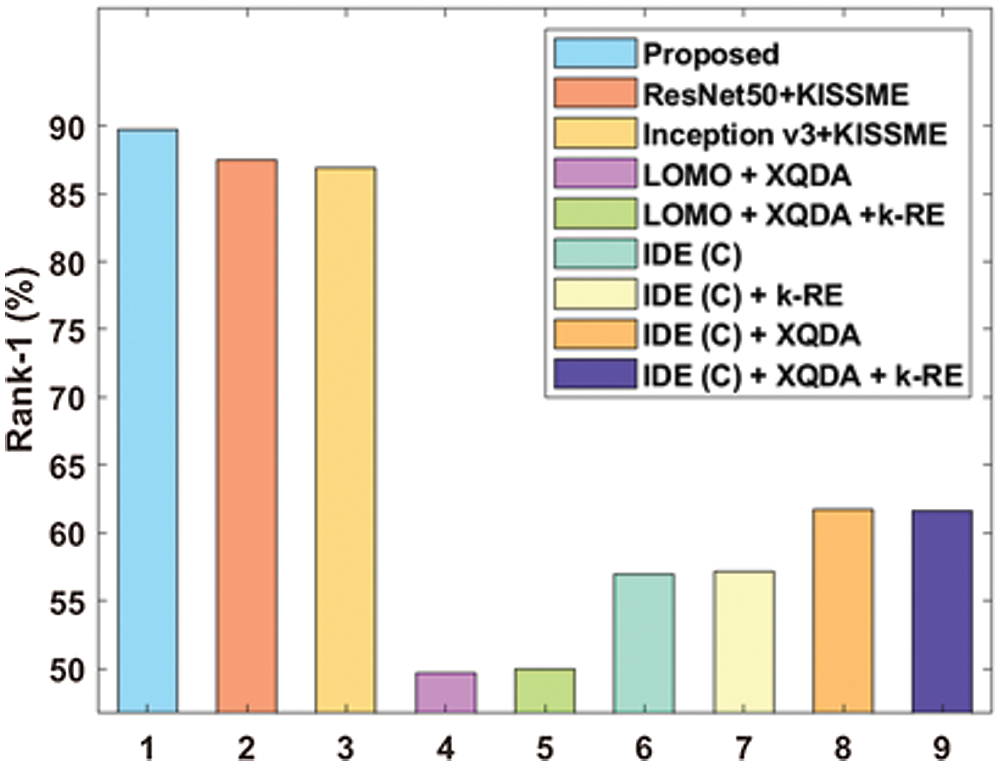
Figure 9: Comparative analysis of HPO-DLDN model under rank-1
Fig. 10 illustrated that the result attained by HPO-DLDN method under mAP, the LOMO + XQDA model depicted inferior performance by providing minimum mAP of 56.4%. At the same time, the LOMO + XQDA + k-RE and IDE (C) schemes demonstrated moderate outcome over the LOMO + XQDA with the closer mAP values of 56.8% and 63.1% respectively. The IDE (C) + k-RE model exhibited reasonable mAP values over the earlier models with the mAP of 63.2%. Besides, IDE (C) + XQDA and IDE (C) + XQDA + k-RE models depicted considerable and identical mAP of 67.6%. Though, it failed to outperform the proposed HPO-DLDN model which gained a maximum mAP of 94.32%.
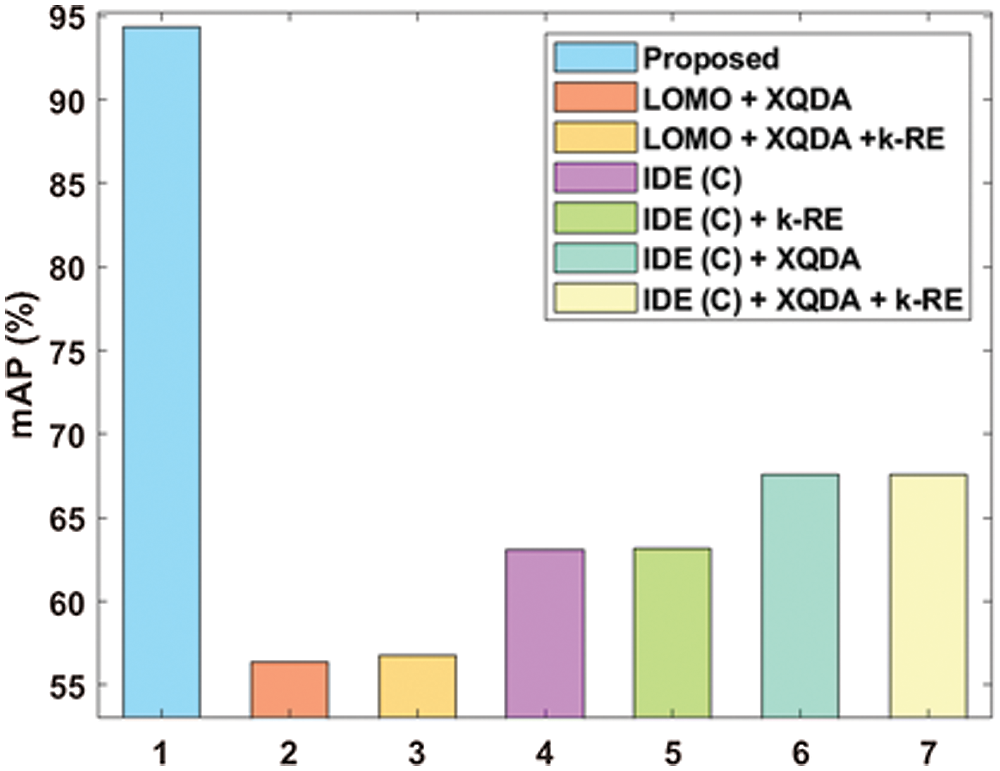
Figure 10: Comparative analysis of HPO-DLDN model under mAP
A novel HPO-DLDN model for PRe-ID is introduced to solve person re-identification problem. The proposed HPO-DLDN involves different processes for PRe-ID, such as DenseNet-169 based feature extraction, Euclidean distance-based similarity measurement, and ENDR based feature re-ranking. Firstly, the DenseNet-169 model-based feature extraction process is used to compute the useful set of feature vectors of the probe image and gallery images. Similarity is computed between the query vectors and gallery vectors using Euclidean distance. Initial ranking and re-ranking process is done by the ENDR model with Mahalanobis distance. Finally, the images with top
Funding Statement: The authors received no specific funding for this study.
Conflicts of Interest: The authors declare that they have no conflicts of interest to report regarding the present study.
1. S. Karanam, M. Gou, Z. Wu, A. Rates-Borras, O. Camps et al., “A systematic evaluation and benchmark for person re-identification: Features, metrics, and datasets,” IEEE Transactions on Pattern Analysis and Machine Intelligence, vol. 41, no. 3, pp. 523–536, 2019. [Google Scholar]
2. M. Farenzena, L. Bazzani, A. Perina, V. Murino and M. Cristani, “Person re-identification by symmetry-driven accumulation of local features,” in Proc. of the IEEE Computer Society Conf. on Computer Vision and Pattern Recognition, pp. 2360–2367, 2010. [Google Scholar]
3. X. Wang, G. Doretto, T. Sebastian, J. Rittscher and P. Tu, “Shape and appearance context modeling,” in IEEE 11th Int. Conf. on Computer Vision, pp. 1–8, 2007. [Google Scholar]
4. L. Wei, Y. Tian, Y. Wang and T. Huang, “Swiss-system based cascade ranking for gait-based person re-identification,” in Twenty-Ninth AAAI Conf. on Artificial Intelligence, pp. 1882–1888, 2015. [Google Scholar]
5. D. A. Vaquero, R. S. Feris, D. Tran, L. Brown, A. Hampapur et al., “Attribute-based people search in surveillance environments,” in IEEE Workshop on Applications of Computer Vision (WACV), pp. 1–8, 2009. [Google Scholar]
6. H. Fan, L. Zheng, C. Yan and Y. Yang, “Unsupervised person re-identification: Clustering and fine-tuning,” ACM Transactions on Multimedia Computing, Communications, and Applications (TOMM), vol. 14, no. 4, pp. 1–18, 2018. [Google Scholar]
7. J. Wang, X. Zhu, S. Gong and W. Li, “Transferable joint attribute-identity deep learning for unsupervised person re-identification,” in Proc of the IEEE Conf. on Computer Vision and Pattern Recognition, pp. 2275–2284, 2018. [Google Scholar]
8. A. Krizhevsky, I. Sutskever and G. E. Hinton, “ImageNet classification with deep convolutional neural networks,” in Advances in Neural Information Processing Systems, pp. 1097–1105, 2012. [Google Scholar]
9. R. R. Varior, B. Shuai, J. Lu, D. Xu and G. Wang, “A siamese long short-term memory architecture for human re-identification,” in European Conf. on Computer Vision, pp. 135–153, 2016. [Google Scholar]
10. D. Li, X. Chen, Z. Zhang and K. Huang, “Learning deep context-aware features over body and latent parts for person re-identification,” in Proc. of the IEEE Conf. on Computer Vision and Pattern Recognition, pp. 384–393, 2017. [Google Scholar]
11. T. Xiao, H. Li, W. Ouyang and X. Wang, “Learning deep feature representations with domain guided dropout for person re-identification,” in Proc. of the IEEE Conf. on Computer Vision and Pattern Recognition, pp. 1249–1258, 2016. [Google Scholar]
12. W. Li, R. Zhao, T. Xiao and X. Wang, “DeepreID: Deep filter pairing neural network for person re-identification,” in Proc. of the IEEE Conf. on Computer Vision and Pattern Recognition, pp. 152–159, 1936, 2014. [Google Scholar]
13. H. Bay, A. Ess, T. Tuytelaars and L. V. Gool, “Speededup robust features (SURF),” Computer Vision and Image Understanding, vol. 110, no. 3, pp. 346–359, 2008. [Google Scholar]
14. K. Kowsari, R. Sali, L. Ehsan, W. Adorno, A. Ali et al., “HMIC: Hierarchical medical image classification, a deep learning approach,” Information, vol. 11, no. 6, pp. 318–338, 2020. [Google Scholar]
15. W. Wu, D. Tao, H. Li, Z. Yang and J. Cheng, “Deep features for person re-identification on metric learning,” Pattern Recognition, vol. 110, no. 2013, pp. 107424–107436, 2020. [Google Scholar]
16. J. Lv, Z. Li, K. Nai, Y. Chen and J. Yuan, “Person re-identification with expanded neighborhoods distance re-ranking,” Image and Vision Computing, vol. 95, no. 5, pp. 103875–103883, 2020. [Google Scholar]
17. CUHK person re-identification datasets.https://www.ee.cuhk.edu.hk/~xgwang/CUHK_identification.html. [Google Scholar]
18. Y. Hu, D. Yi, S. Liao, Z. Lei and S. Z. Li, “Cross dataset person re-identification,” in Asian Conf. on Computer Vision, pp. 650–664, 2014. [Google Scholar]
19. Z. Zhong, L. Zheng, D. Cao and S. Li, “Re-ranking person re-identification with k-reciprocal encoding,” in Proc. of the IEEE Conf. on Computer Vision and Pattern Recognition, pp. 1318–1327, 2017. [Google Scholar]
 | This work is licensed under a Creative Commons Attribution 4.0 International License, which permits unrestricted use, distribution, and reproduction in any medium, provided the original work is properly cited. |