DOI:10.32604/iasc.2022.023446
| Intelligent Automation & Soft Computing DOI:10.32604/iasc.2022.023446 | |
| Article |
Interactive Human Interface for ERP Component Extraction from Gifted Children
1University of Tunis, ENSIT, SIME Laboratory, Taha Hussein Street, 1008, Tunis, Tunisia
2University of Tunis El Manar, ISTMT, LR13ES07, LRBTM, Tunis, 1006, Tunisia
3Laboratory of Computers, Signals and Systems I3S, UMR 7271 CNRS, Sophia-Antipolis, 06900, France
4Functional Exploration Service of the Nervous System (EFSN), CHU Pasteur, Nice, 06000, France
5Laboratory Bases, Corpus, Language (BCL), UMR 7320, UCA, Nice, 6357, France
*Corresponding Author: Amine Ben Slama. Email: amineslama1@gmail.com
Received: 08 September 2021; Accepted: 10 November 2021
Abstract: In the last century, scientists started to give importance to gifted children (GC) and to understand their behavior. Since then, research has pursued the various categories of these children and their early diagnosis in order to find the best control of their skills. Therefore, most researchers focus on recent advances in electroencephalogram (EEG) and cognitive events. The event-related brain potentials (ERPs) technique is generally used in the cognitive neuroscience process. However, it is still a challenge to extract these potentials from a few trials of electroencephalogram (EEG) data. The N400 ERP component is an important part of the studies of cerebral science and clinical neuropsychology. In this ongoing study, a new experimentation protocol and human tablet interactive equipment were assigned to analyze the brain activity. A combination of two techniques the Integral Shape Averaging (ISA) and Integral Shape Averaging applied on belated window (ISA-BW) was built to extract the semantic component from a single trial and to enhance the signal-to-noise ratio (S/N). The results obtained were compared with the most used method in the medical field Grand Average (GA). In addition, a statistical study was performed on a database for accurate characterization of children using feature reduction. The experimental results show the efficiency of the suggested approach which manifests the discriminant statistical feature extraction (J = 2.032) from ERP component dataset that can contribute to the recognition of GC. The proposed method is reinforced by a pilot device processed by an electrical engineer to improve the protocol simulation. The experimental procedure proves that the present approach is very interesting and helpful for improving the identification of such gifted children.
Keywords: Gifted children (GC); event-related brain potentials (ERPs); integral shape averaging (ISA); human tablet interactive equipment; grand average (GA); features reduction; pilot device
Identifying gifted children (GC) is a motivating task that is currently growing considerably. This field touches both neurologists and psychiatrists in analyzing children behavior and their neurological response. Indeed, several works were proposed to identify (GC) and to show their performance in various fields such as reasoning, memory and executive tests [1].
Normally, to evaluate the intelligence of a child, a specific intelligent quotient (IQ) test is taken. This criterion is classical but fundamental in the decision of neuropsychologists to assess the precocity of children when the value is superior to 130 [2]. The Wechsler Intelligence Scale of Children (WISC-V) is an intelligence test for children that have the greatest scientific legality. It allows obtaining complete and precise cognitive profile with different levels of cognitive intelligence: The Working Memory Index, the Processing Speed Index and the Verbal Comprehension Index. In this respect, Steinkuehler et al. [3] denote the special abilities and aptitudes, correlated with the right hemisphere, which characterize GC. As shown in Tab. 1, the right hemisphere is more advanced than the left one.

Generally speaking, although the IQ attained from the WISC-V is fixed in a borderline zone, the approval of the validity of the giftedness in a child is blurred and even ambiguous. In fact, this ambiguity has triggered scientists to seek another alternative based on the correlation between giftedness and its impact on cognitive activity. There are several methods that give information on the brain processing like the magnetic resonance imaging method (MRI), the functional magnetic resonance imaging method (fMRI), electroencephalography (EEG) and, more specifically, the event-related potentials (ERPs). It is worth noting that event-related potential is deeply used in cerebral researches. It highlights the brain activity through the intellectual tasks [6].
N400 is an endogenous component of event-related potentials (ERPs). This response has an important role in studying cognitive science and clinical neuropsychology diseases such as disturbances, Schizophrenia and Alzheimer [7–9]. It can mainly be evoked by diverse stimuli including words presented by pictures or voices. Kutas et al. [10,11] show that N400 is associated with semantic anomalies. This wave appears on the ERP brainstem at 200∼300 ms after visual or auditory stimuli and peaks in a negative deflection that occurs at 400 ms Lau et al. [12]. This essential response highlights the capabilities in language assessment. It transmits the capacity of the patient in the semantic process [13]. The N400 component is controlled by an immediate context such as a word a couple of words, or an image. Hence, the correct extraction of N400 waveform from EEG signals is important.
N170 is a response that reproduces the neural processing (NP) of expressions, familiar objects or words. Moreover, the N170 component is controlled by estimating the error means [14]. Once N170 potentials evoked by images and compared to those elicited by other visual stimuli, the former reveals a negative peak between the intervals 130–200 ms after stimulus presentation. This component appears in the regions of occipito-temporal electrode positions and can be modulated by top-down influences from prefrontal cortex [15].
Due to the presence of spontaneous EEG activities and ocular artifacts, not only the amplitude of the two N400 and N170 components is very low, but also their S/N is very poor. The classical method Grand Average (GA) used to improve the feature extracted and the shape of N400 or N170 is to subtract the averaged consistent trials from the averaged inconsistent sweeps. This method involves a long time of experiment to record enough trials of EEG data from multiple subjects (John et al. 1978) [16] and depends on background activity (the S/N). As a consequence, the practical clinical research for individual patients can be very exhausting and even annoying especially if the patient was a child. Therefore, it is a challenge to be able to extract the N400 waveform from a few trials of EEG data from patients. In this regard, several filtering techniques are proposed to remove the presented noise such as Independent Component Analysis (ICA) [17–19], Moving average (MA) [20], Matching pursuit (MP) [21]. Independent component analysis and matching pursuit are proven techniques for electroencephalographic signal processing. However, they are not suitable for the proposed examination with stimulation. On the one hand, it is not feasible because it requires the attachment of several additional electrodes on children who have difficulty with tolerating them easily. On the other, it requires a precise knowledge of the evoked potential signals, which is not currently the case.
This study is part of a continuous process of the cognitive and neurophysiological particularities in intellectual precocity project. A survey was then launched on signal processing methods to study their electrophysiological correlates. This further work is evidently a complementary and exclusive version of the study initiated by the team in January 2021 of “A new approach to detect N400 event-related potentials in gifted children”. Earlier in this paper, we introduced ISA method to extract the N400 response. Here follows, we give more details on the recording of the data using the digital tablet and we compare it with the new version of ISA-BW. A characterization study based on the extraction of statistical attributes is also suggested to improve the identification of GC.
The automatic detection of ERP responses, with the wavelet transformation method [22], has been realized from the recordings that are supposed to be extracted from a realistic study model since the data are provided from pathological cases under the conditions of intra-operative recording. In fact, this is a major drawback in the absence of normative data (i.e., without having a perfect model) and, hence, would require the laboratory to have a generator that delivers a signal composed of noise and a normal signal of excellent quality, and to modulate the usual parameters of a conventional ERP device (gain, Signal-to-noise ratio S/N). The majority of the proposed approaches represent an interesting process for the ERPs recognition and using features characterization (the amplitude, latency, and topography of the resulting positive and negative deflections) but not in their exact shape. It depends on the relative sizes of the ERP, their type and the background activity. In this work, we propose an efficient approach to obtain ERP by avoiding the averaging multiple temporal segments from the ongoing EEG. However, extracting ERP shapes remains a problematic area that still persists due to included overlapping noise of the EEG in which it is embedded. Indeed, few studies have considered this problem which is a major necessity especially in investigating the neural correlation of cognitive process in perception, emotion, and memory. Therefore, we have used two promising approaches that tackle this issue in order to evidently improve GC characterization. All of the stages in the proposed methodology are helpful for averaging segments that do not have the same each time-locked and the same class of event [23].
This work evolved through four phases. Firstly, we collected the cohorts (neuropsychological and orthophonic assessment): The database collection process. Secondly, we stimulated two different types of innovative protocols for the cognitive ERPs involving an interactive framework (tablet). Thirdly, we proposed two methods using ISA and ISA-BW to provide a real ERP waveform with consistent features. Finally, we opted for a characterization stage using the Linear discriminant analysis (LDA) method.
This paper is organized as follows: The first section presents the introduction while Section 2, outlines the proposed methodology (Fig. 1) as well as the stimuli recording and the data acquisition. In Section 3, we report the experimental results and discussions. Our conclusions and proposals are drawn in the final section.
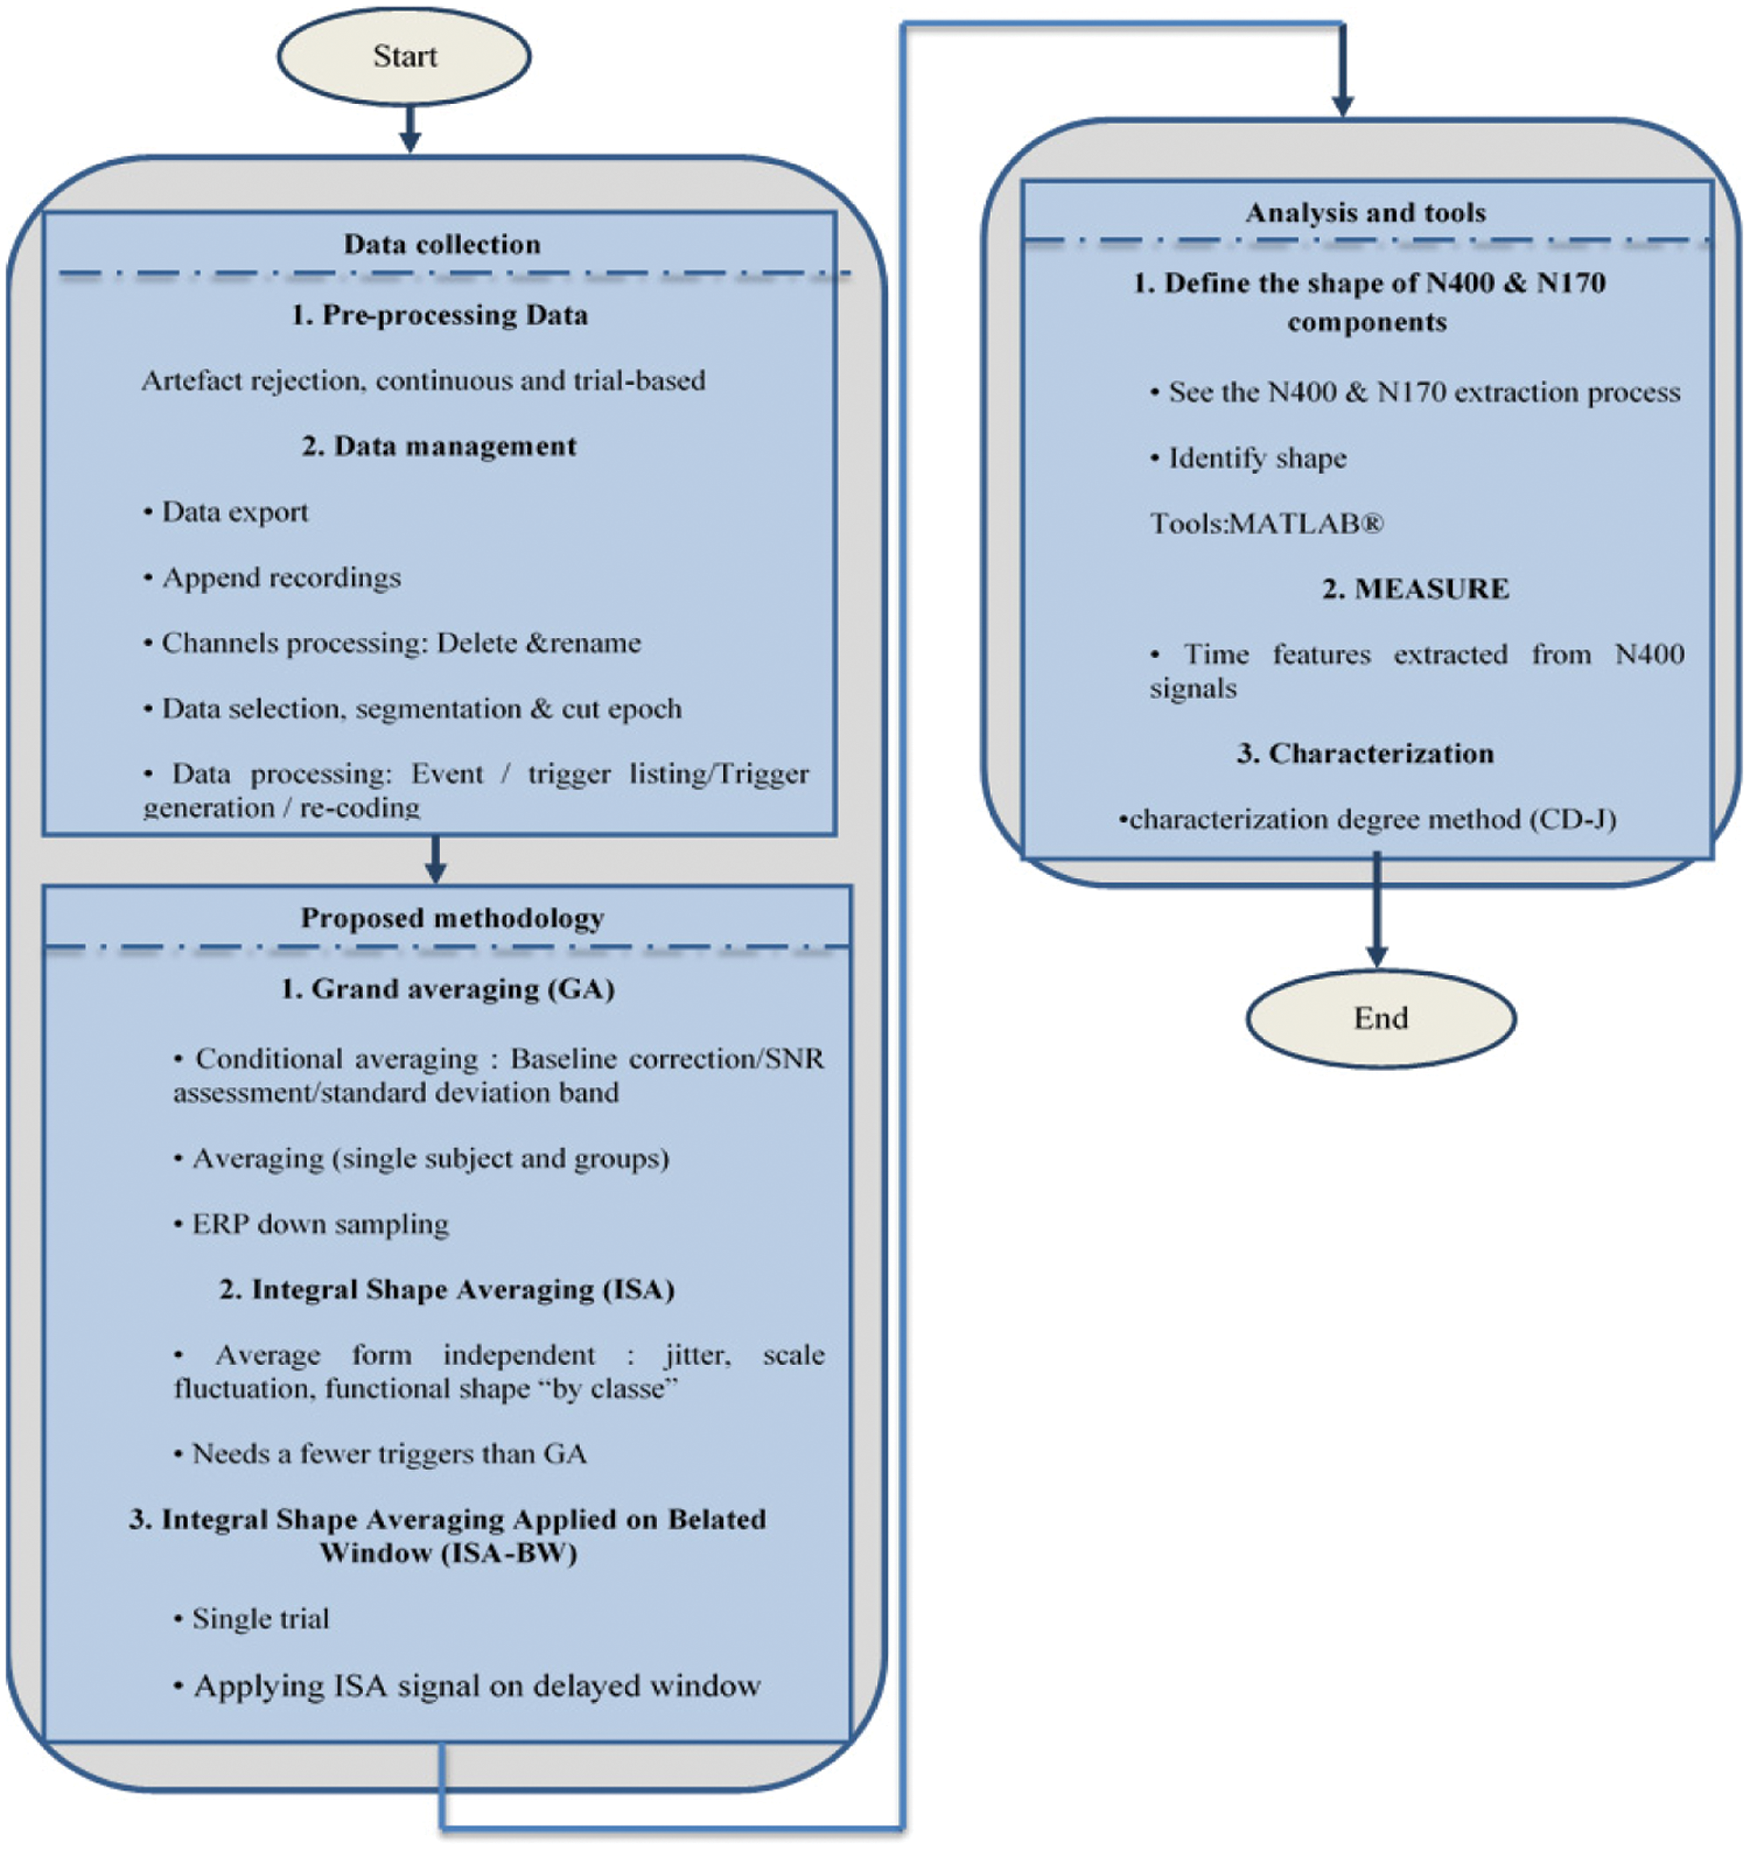
Figure 1: Flow chart of methodology research
In this work, we work with fifteen members (10 GC, 5 non-GC), all of them have an average age of 9.06 ± 1.2 years (between 8 and 10 years old) and are right-handers. They have different levels of education. All the participants are volunteers. Their parents have signed a consent to participate in the course experiment that was approved by the CERNI local ethics committee. The participants were native speakers of French, had normal vision and no reported neurological disorders. All had intelligence quotients (IQs) between 125 and 135, as given by the Wechsler test which is The Intelligence Scale for Children (WISC). It is worth mentioning here that some of the data related to the participants were discarded due to technical problems or excessive levels of noise in the ERP signal.
The stimuli described below are supported by the BCL and CHU Nice team under the supervision of a specialist in neuropsychology. Some of them remain confidential until the end of the project. The stimuli were based on the French language [24,25], all of which were recorded under the same paired and unrelated conditions, but were different in their pairing. There is a difference in the ERP or pupillary measurements resulting from low-level perception differences between conditions within each of the two experimental tests. All tools and construction equipment used in the experimental system are shown in Fig. 2.
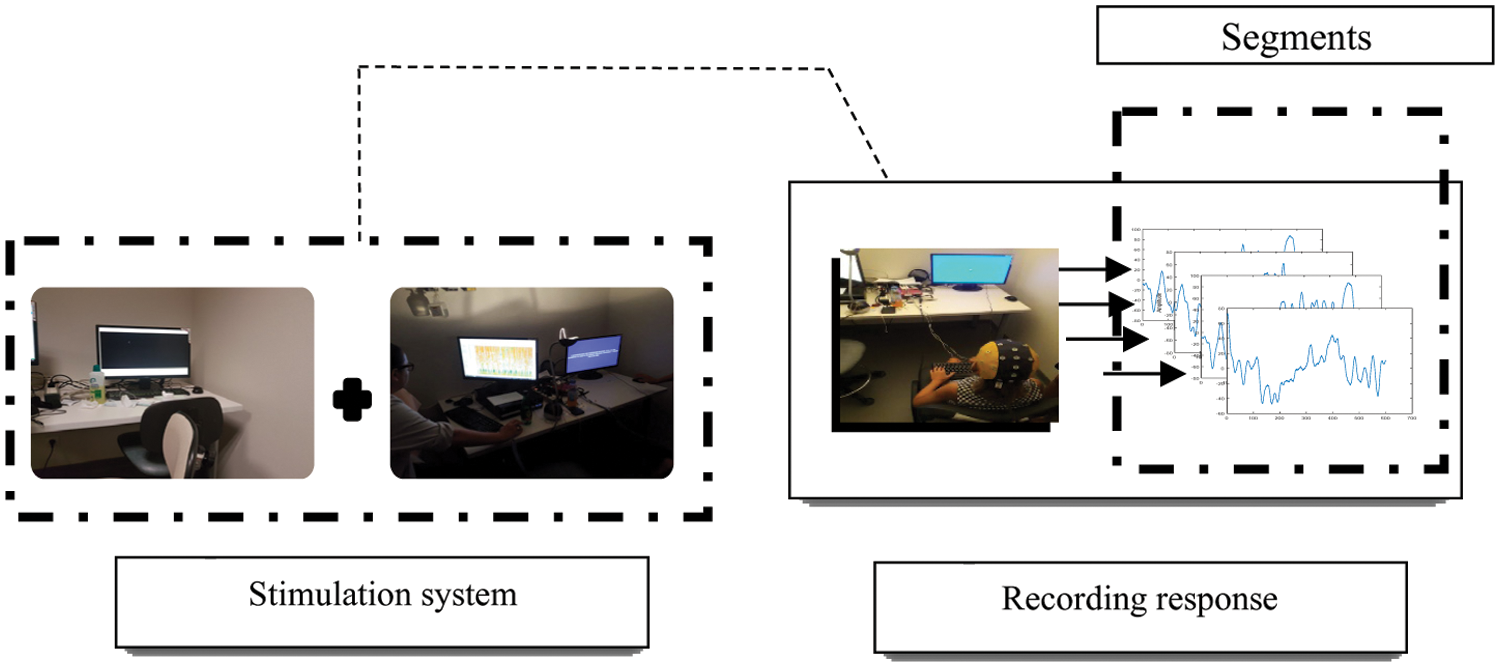
Figure 2: Setting up the experiment
2.2.1 Orthographic Method (N170)
The experiment was programmed on the E-Prime 3.0® software and composed of 5 blocks. Each block contained 42 attempts with a two-minute break that was systematically given to the child between each block (that presented a reset for child's eyes). Each test started with a grid presented in the center of the screen for 200 ms, in one of three colors (green, yellow or red) on a gray background. Then, a texture noise mask appeared for 50 ms after an interval of 700 ms, a target stimulus (from one of the five categories) was presented in the middle of the screen in one of the previously mentioned colors on a gray background during 200 ms. After an additional 600 ms interval, a question mark appeared in the middle of the screen until the participant gave his/her answer. Each trial ends with the appearance of the following symbol ( ) in the center of the screen for 2000 ms, allowing the participant to blink or move his/her eyes (see Fig. 3 for an example of the conducted test).
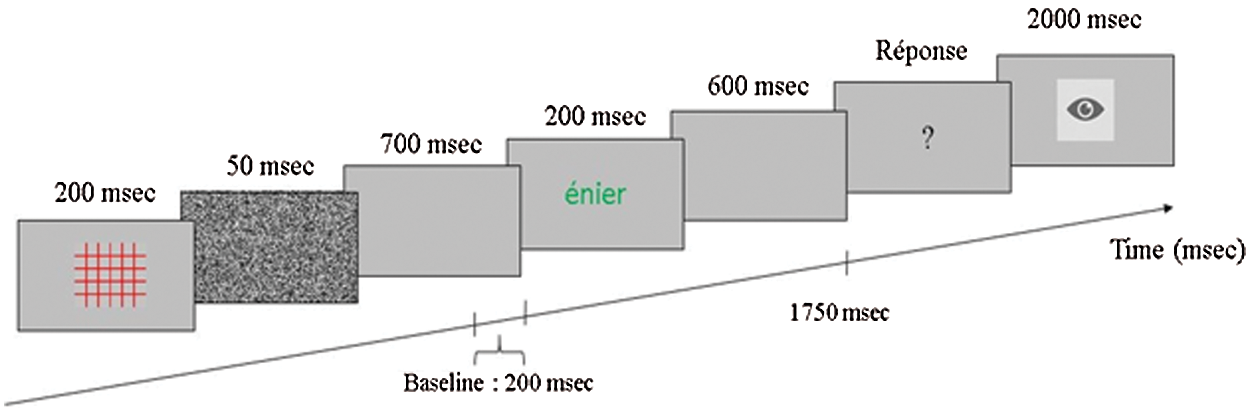
Figure 3: Protocol of the conducting test to obtain N170
The order of appearance of stimuli is randomized. We collected the evoked potentials, in particular the N170 component, sensitive to low-level word processing (before lexical access), in order to compare its amplitude, shape, and latency according to the type of stimuli, its location and the group of children.
For this experiment, the protocol needs 240 pairs of words and the answers were recorded via EPrime 3.0®. The stimuli were presented in the center of the screen (central presentation condition) or at an offset of 4° to the right visual field/left hemisphere (RVF-LH condition) or to the left visual field/right hemisphere (LVF-RH condition) from the central attachment point to the center of the word. The test, as illustrated in Fig. 4, started with the appearance of a cross fixed in the center, for 2000 ms and the child had to fix with concentration. The first word (W1) is presented for 185 ms. After an interval of 65 ms, the second word (W2) is presented for 185 ms, followed by an interval of 815 ms, then the third control word for 250 ms.
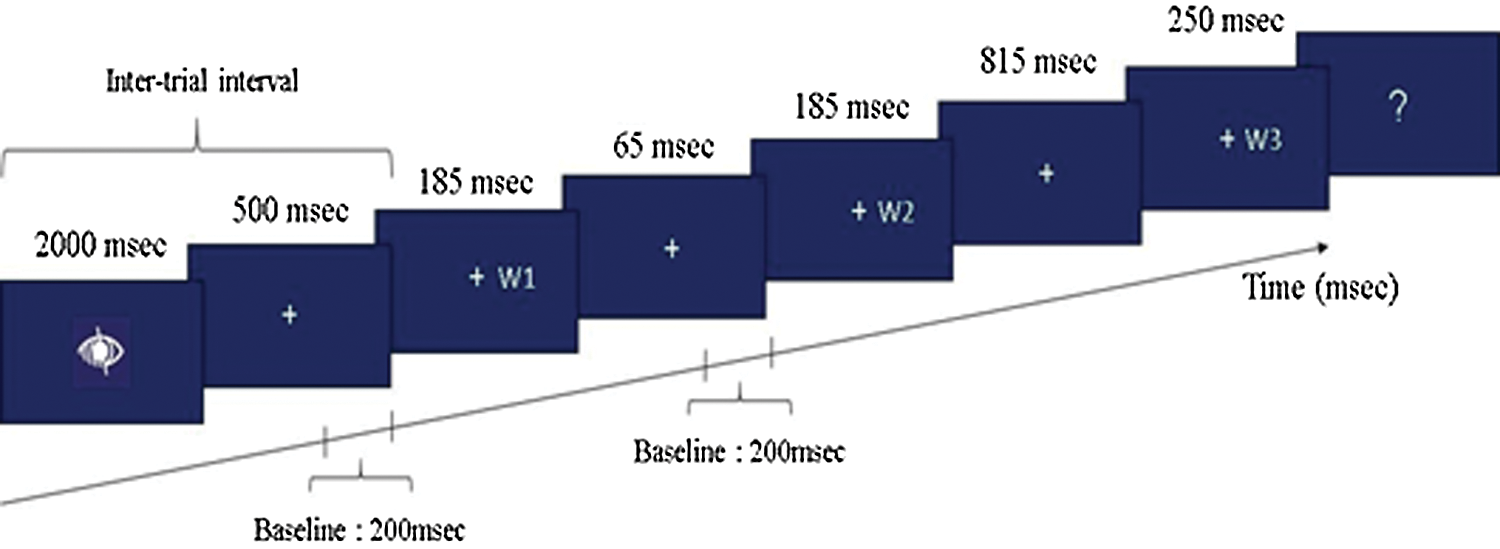
Figure 4: Protocol of a trial with right field of view presentation of semantic method (N400)
The test ended with the presentation of a question mark. Each test presented two words from the same pair (W1 and W2) consecutively, followed by a third control word which was, in half of the tests, a repetition of W1 or W2 and finally, a question mark. It is worth noting that this primer can also be “a word or a non-word”, and a “pseudo word”. Finally, while the target stimulus was presented on the screen, the GC indicated the response on a computer keyboard by pressing a key button.
2.3 Data Acquisition Applying Innovative Interactive Framework
As research based on ERPs, like dysorthographia, has only studied reading, our proposed protocol aims to fill in this gap and integrate the writing process as well so that both skills are combined and treated together at the two following levels. The reading process uses the visual word form area in left visual cortex extra striated median (i.e., in left ventral occipital-temporal junction Peterson, Fox, Snyder et Raichle, 1990) [26]. Meanwhile, the writing process uses the graphemic/motor frontal area, a subpart of left superior premotor cortex close to Exner's area Diez Roux et al. [27]. In this proposed work the ERPs were recorded in 3 packaging materials phases as illustrated in the Fig. 5.
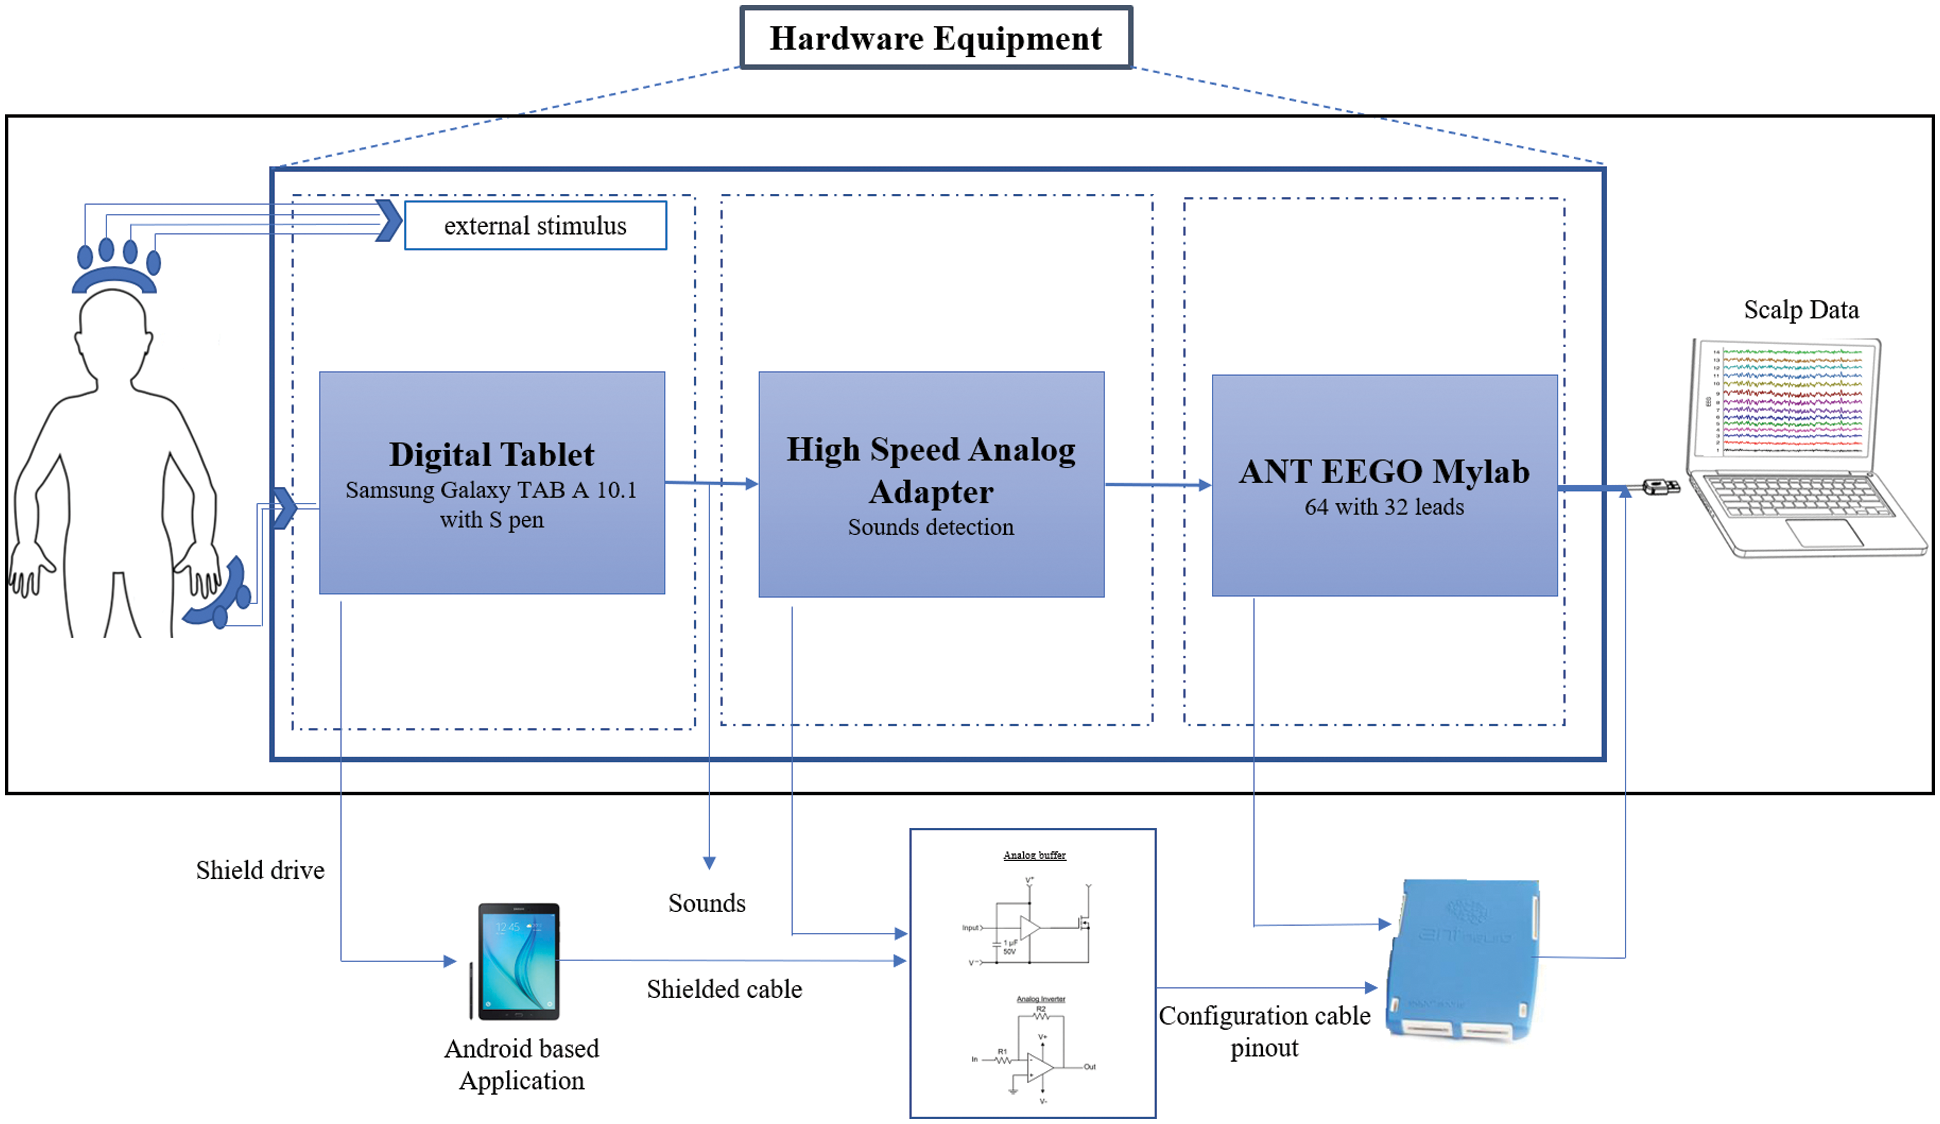
Figure 5: Interactive framework
The sounds were generated as triggers for synchronization with EEG. ERPs were recorded at 16 kHz DC, with band-pass filtered between 0.1 and 30 Hz from 32 Ag/AgCl electrodes placed according to the 10–20 convention. Eye movements were recorded via vertical and horizontal electrooculogram channels and impedances were kept below 20 kΩ. Other recordings were filtered off-line with a zero-phase shift low-pass filter of 30 Hz and then re-referenced to the average of the left and right mastoids. Eye-blinks were corrected and the remaining artifacts were removed using the artifact rejection procedure from (eego™ mylab, Inc.). Epochs ranged from −100 to 850 ms relative to the onset of the target stimulus and were baseline corrected in reference to (a 100 ms pre-stimulus interval, and filtered low pass at 10 Hz also using eego™ mylab) pre-stimulus activity. The writing process for GC was maintained by human tablet interface which is a developed Android application embedded in a Samsung Galaxy Tab A tablet with S pen. It is an android application for EEG experiments. The application is advanced in 3 steps as seen in Fig. 6: Generation of sounds as triggers for synchronization with EEG, data storage on file and a replay function.
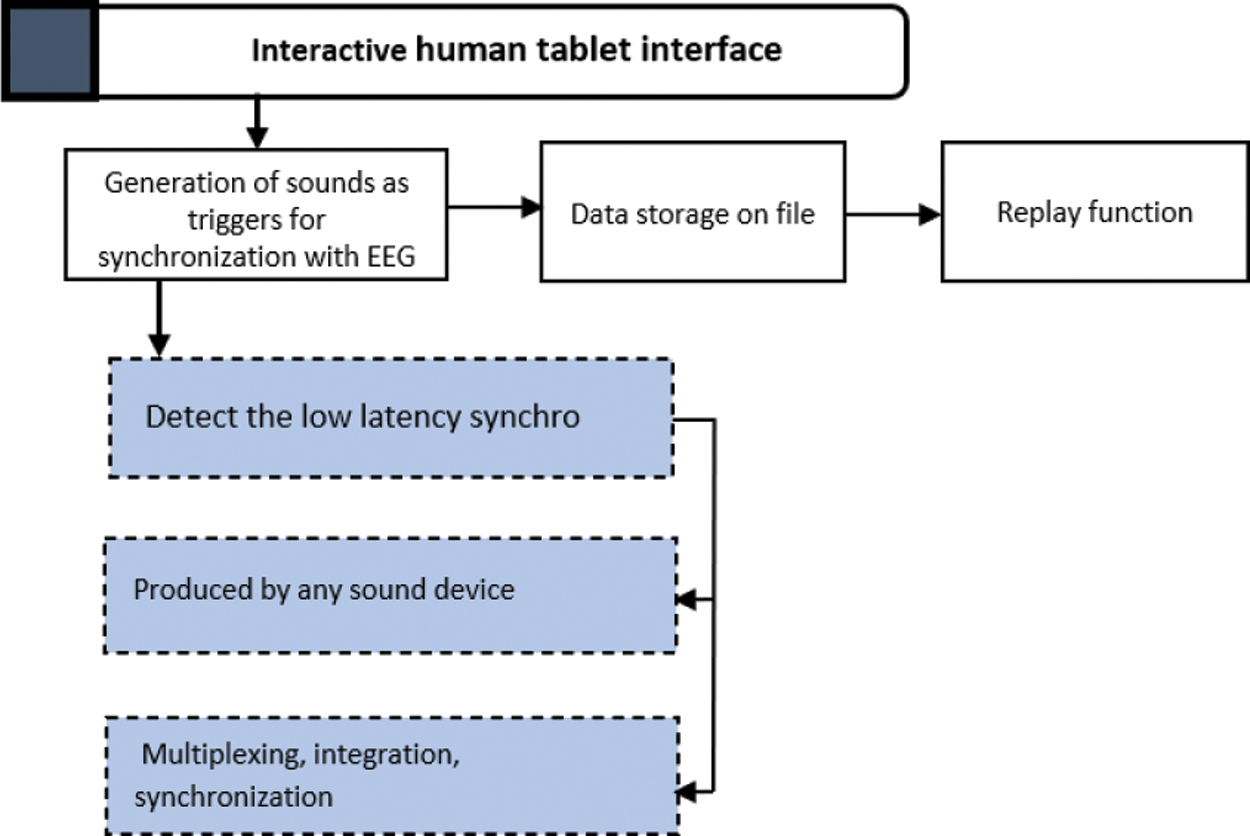
Figure 6: Human tablet interface
When the electrodes were placed on the scalp, the changes in EEG brain activity were recorded. Since EEGs had low amplitudes, (on the order of 100 μv), the analogue signals were amplified and then converted into digital signals. Each realized stimulus, such as sound, light, etc., caused variations in the potential. However, these ERPs were very small compared to the basic electrical activity (of the order of 10 μV). In order to extract a useful and meaningful response, it was necessary to synchronize and to average a large number of trial sequences from the EEG recording under the same experimental conditions and for stimuli of the same type as shown in Fig. 7. This method, called the GA, is the most widespread and the most used by surgeons in the clinical field [28,29].
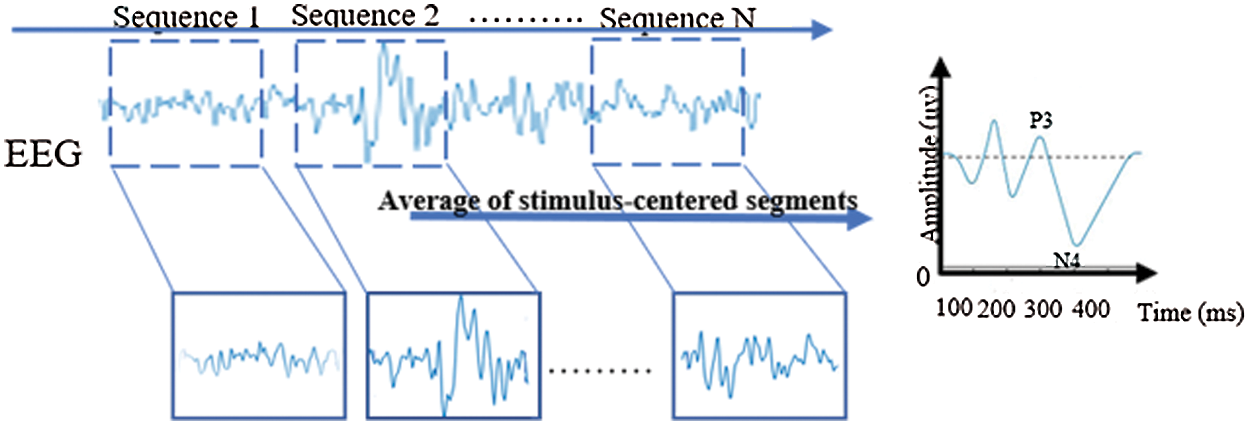
Figure 7: Grand average of N trials goes from 1 to 50
This averaging technique is optimal when all the averaged signals are of the same shape with a perfect alignment, i.e., no jitter, and also no time scaling factor. In fact, due to physiology, random time shift and time scale fluctuations are often present which modify the common shape as detailed in [30]. As a consequence, ERPs responses were swamped in the noise and compared with the EEG, as a background effect, that decreases the amplitude which is already low. It was discovered that this processing method was not optimal on event related potentials, such as N400 and N170, because these latter were responses of great variability in time and form. Here, two methods are proposed (see Fig. 8) with the aim of improving the detection and extraction of N400 and N170 responses.
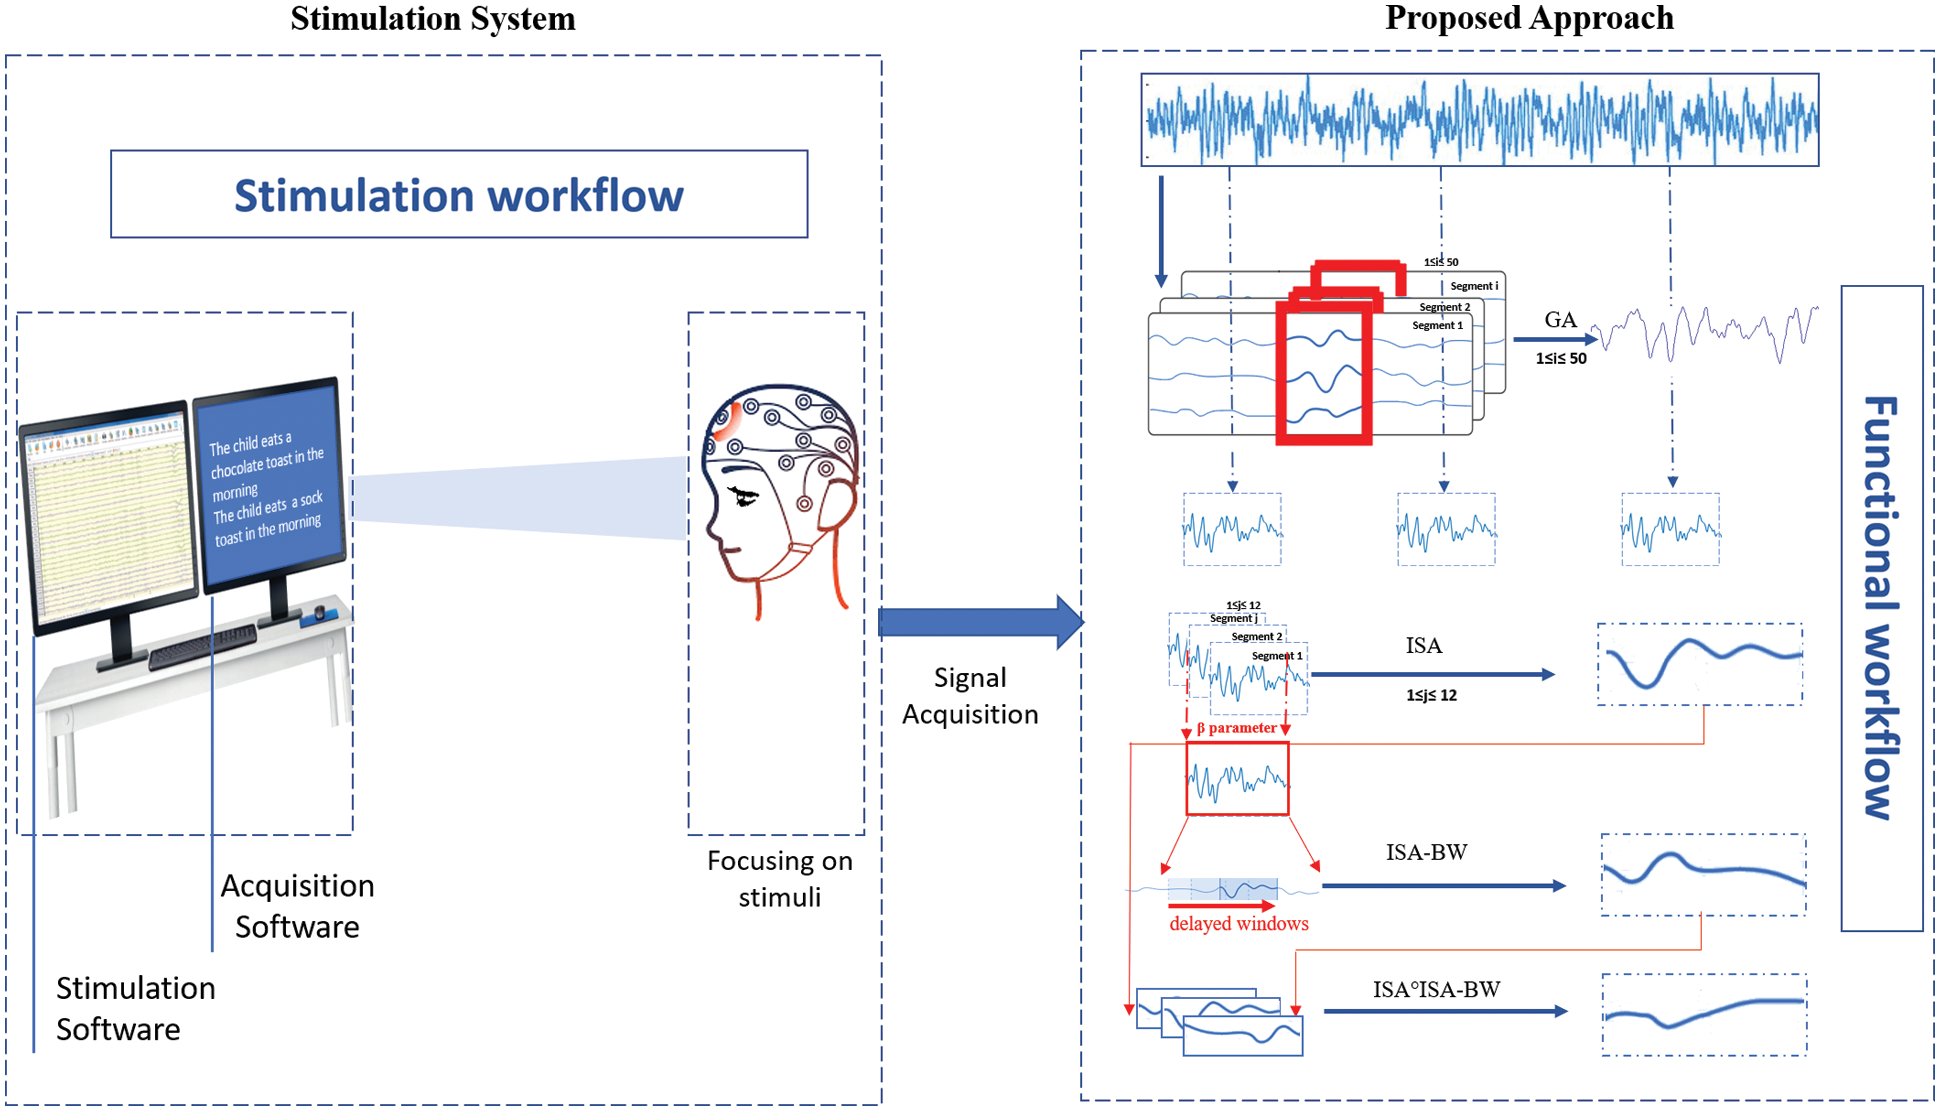
Figure 8: Diagram describing the proposed method
2.4.1 Integral Shape Averaging (ISA)
As mentioned in the literature, the method of Integral Shape Averaging (ISA) technique was selected as a powerful procedure using an average of a sequence of positive shapes based on the normalized integral tool, which was proved by the experimental results. In the case of a poor SNR criterion result, the increasing number or the averaged signals appeared. This task commonly appears when the stimulus presentation is repetitive as the sensory named EPs (e.g., visual EPs). However, in order to improve the accuracy of our results we should focus on the event related potentials (ERPs). Some methods investigate N400 evoked by the brain when the semantic incongruity is detected. It should be noted that the stimulus phenomena must be different in all trials. For further application in different situations, our method is proposed in order to ensure an artificial multiplication number of averaged signals. Therefore, to solve our problematic, a method with less sensitivity to variations in the latency and the time scale is needed in order to obtain an optimal average shape of signals. More details about the ISA technique are found in [31,32].
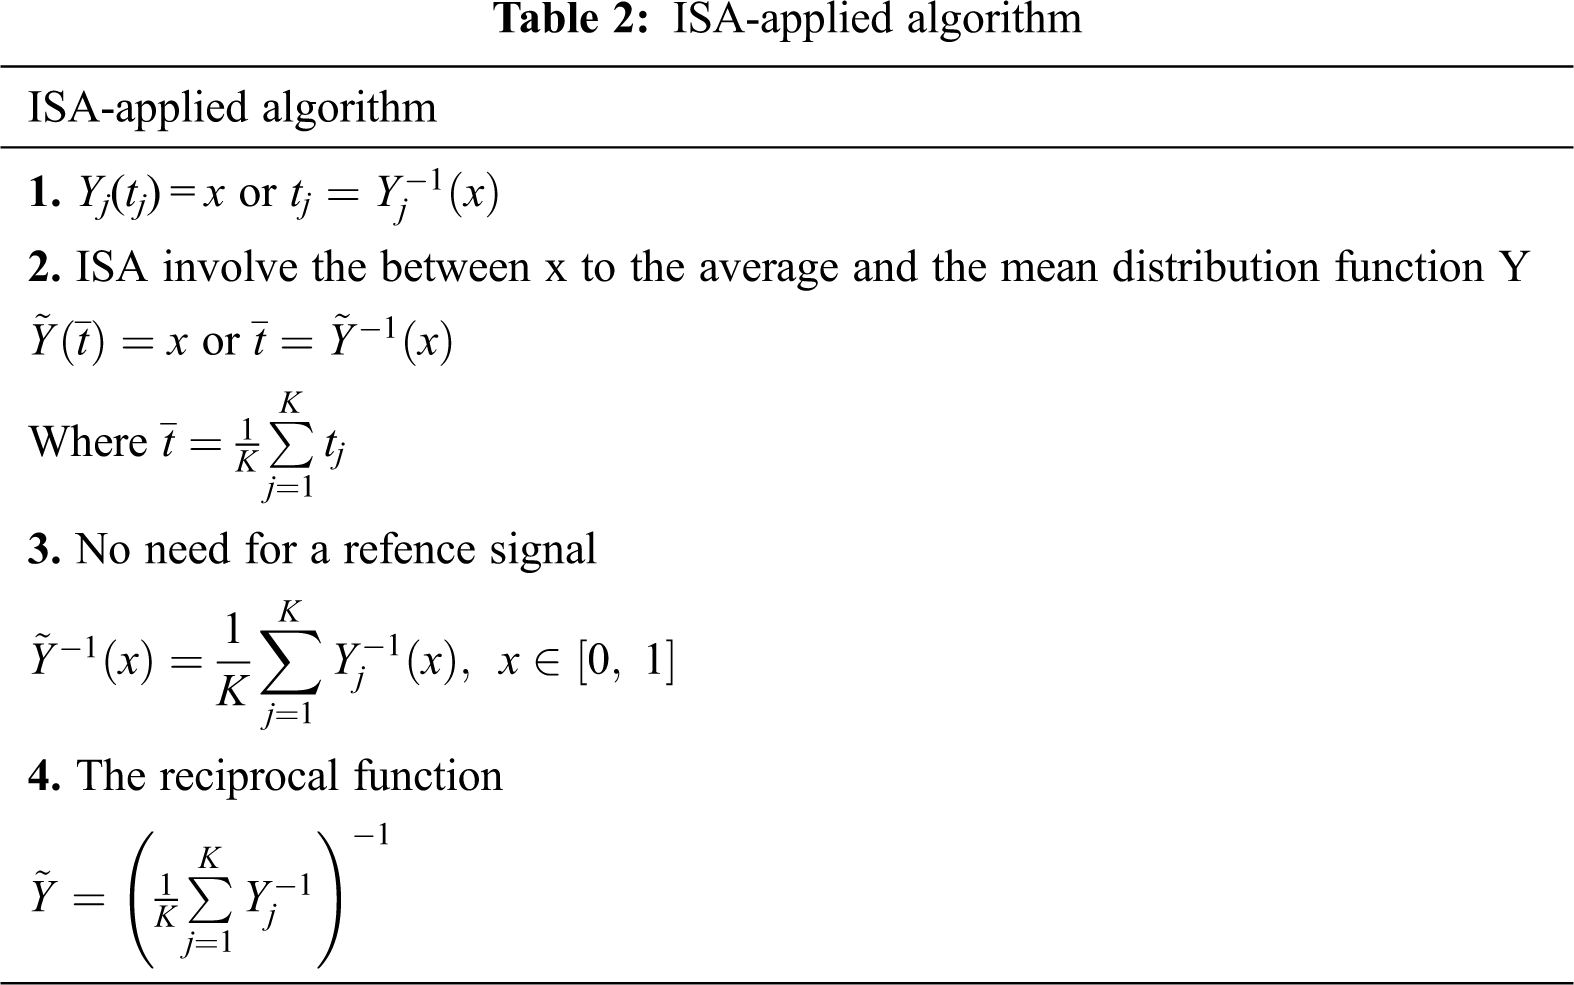
The ISA technique (see Tab. 2) provides an accurate estimation of the shape with an increased rate of the Signal to Noise Ratio (S/N) due to the integration characterization. In the rest of this section, we need to present some parameters. K presents the number of strictly positive signals, Yj(t) presents the analyzed signal, Yj(t) presents the cumulative distribution function, and j is the index of the positive signal and assigned a value from 1 to K. We consider the Yj(t) as a non-noisy signal, normalized by the integral. And the Yj(t) is a probability density function with cumulative distribution function. Every x, 0 < x < 1 there is one and only one value tj.
2.4.2 Integral Shape Averaging Applied on Belated Window (ISA-BW)
The Integral Shape Averaging applied on belated window (ISA-BW) technique is a new version of the ISA technique. The main advantage of this technique is its ability to use only one recording of a positive non-noisy signal. Applying the ISA on delayed windows that contain a signal can give a good estimation of this signal. Thus, we supposed x(t) and y(t) are current positive signals with a fixed support; x and y have the same shape if and only linked by Eq. (1) or with its equivalent formula (2).
Here, C was the offset. The variant C was supposed to be zero after detracting a mean baseline. N presented the number of the positive data with equal shape signals fixed in zero-mean noise, through the arbitrary fluctuations of their time occurrences. The heights and their widths were defined in Eq. (3):
aj, kj and dj were independent random variables. The other variables A, D, K and nj(t) were a sequence of n(t).
The variable t was sampled in M in equidistant values ti, per step h, i = 1 to M, chief to the equation system (4)
The signal yi(t) had a limited support. All of them are boarded by two intervals included in the time interval [0, T]. As there was a difficulty in determining the exact support in every single segment, we assumed a larger interval [E1, E2]. E1 and E2 are indicated by the arrows on the time axis:
With noise, the equation would be
ISA was functional on positive signals. The positive part w(t) of k(t) was defined in (7):
In order to present efficient results, we sorted the segmented windows to extract the best one and choose the most suitable trial that can be used in ISA and ISA-BW applications. In the literature, there are many tools used to select the suitable window length. In this work, the window length selection task was achieved based on criterion quoted below. The β criterion represents the correlation between two epochs; it is called the correlation coefficient [33]. This criterion provides many advantages over other criteria presented in the literature. First, this criterion is characterized by its ability to detect the degradation trends. Second, it takes into account the correspondence of the signal. Also, it is robust over noise. β was computed as follows
In this proposed study, we investigated the β parameter in order to evaluate the effect of the chosen the single trial. Therefore, we calculated β for all segments and selected the most suitable one. The choice of suitable epochs presented a sensitive task. The optimal window length value was the minimum window length value at which the criteria were at maximum.
The software program used to analyze the ERP data was eeprobe™. This software is a complete package used for adding considerable details to study event-related brain activity with high-resolution. The eeprobe™ software is designed to suit the high standards of neuroscience research. It is a powerful process that can analyze a large data and handle ERP data containing any number of channels, at any sampling rate as well. It is flexible for processing a single subject and a grouped data and integrates all the necessary steps for data processing and procedure such as averaging, visualization and statistical analysis. In addition to this, the process with eeprobe™ supports MATLAB®, the most advanced software for the computing process proposed in this paper. The analysis data format packages are provided and performed through the libeep interface functions. It allows reading and writing RIFF format CNT/AVR-files.
In the following section, the proposed method is checked on the real ERP signal. The data are 12 recordings evoked by stimuli dedicated to the N400 and N170 components. Experiment results (Fig. 9) illustrated the analysis of responses of electrodes and the grand average of the 12 trials C3, C4, O1, O2, F7, F8, P7 and P8 from a 32-electrode device. After computing the ISA-BW signal for each trial, using 122 consecutive windows, we present their averaging for electrodes P7 and P8 (Fig. 10). The evoked related events which appear after each stimulation are at the same condition and same latency. If their realizations are evoked on different random jitter, the efficiency of the averaging signal will be affected systematically. The obtained signals are different in form and structure. Usually, for such signals, we set the period variability or warping problem. For more exploration of the characteristic of the ISA and ISA-BW technique, we compare N400 and N170 responses extracted from GA, ISA and ISA-BW on a different series of segments as shown in Figs. 11 and 12. We can see that the estimations of N400 are very similar. This could be foreseen since electrodes P7 and P8 have symmetric positions on the scalp.
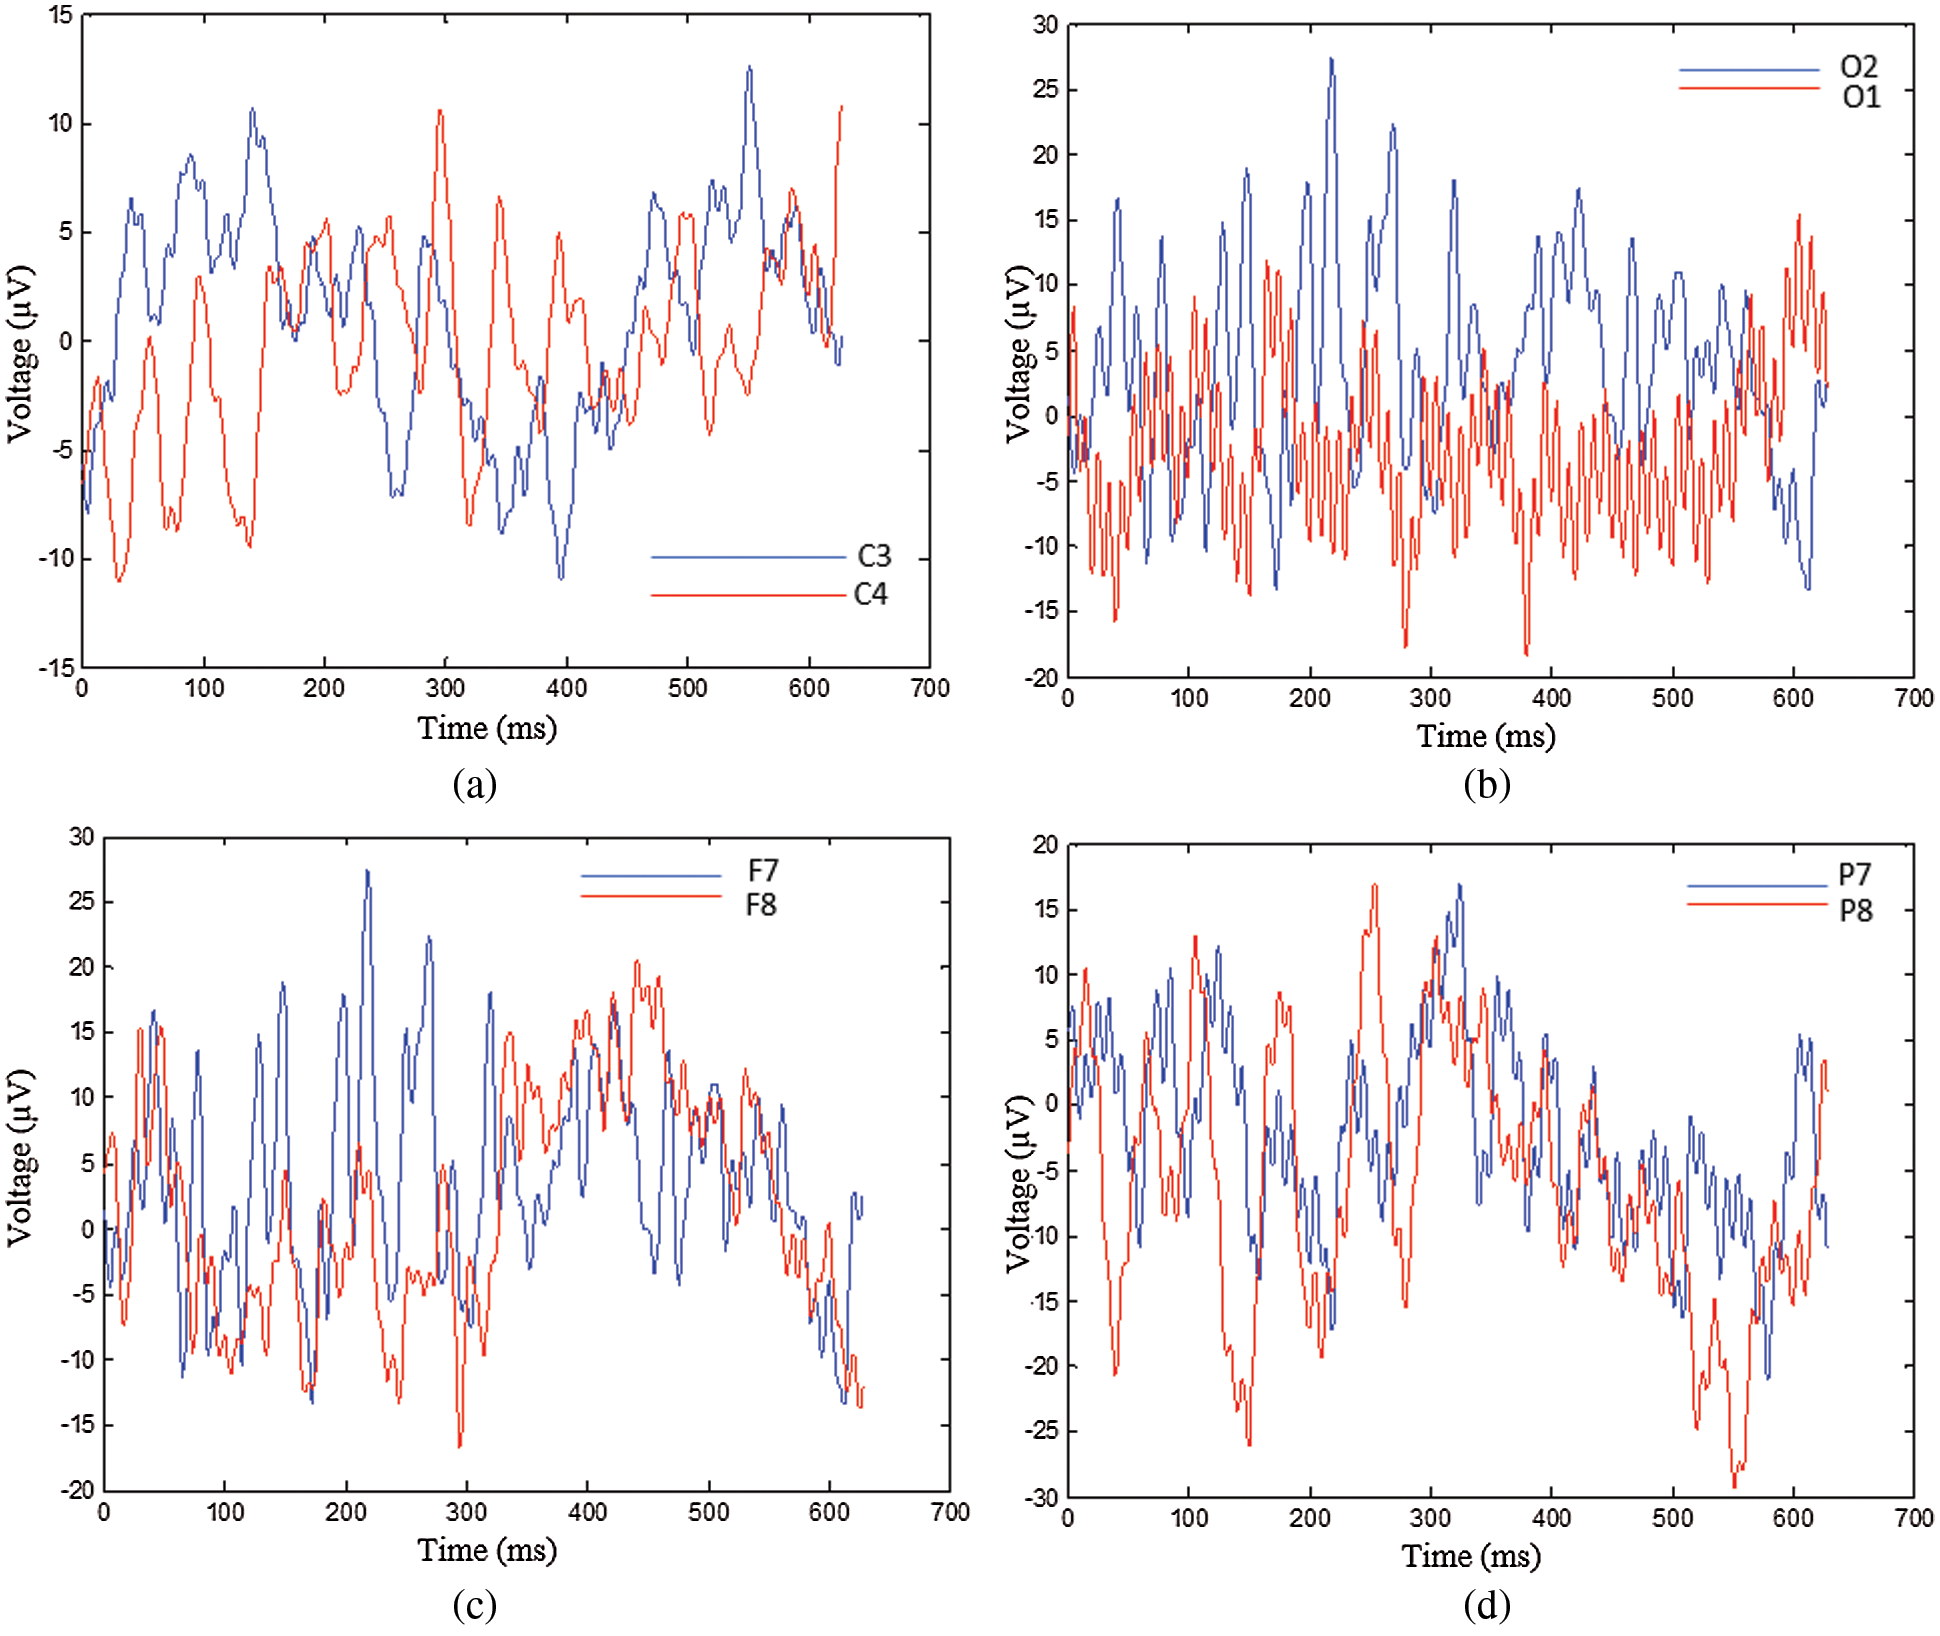
Figure 9: Evaluation of the grand average (GA) of 12 epochs to extract the N400 ERP response from (a): F7 and F8, (b):O1 and O2, (c): C3 and C4, (d):P7 and P8 electrode, axes are in time (ms) and voltage (μV)
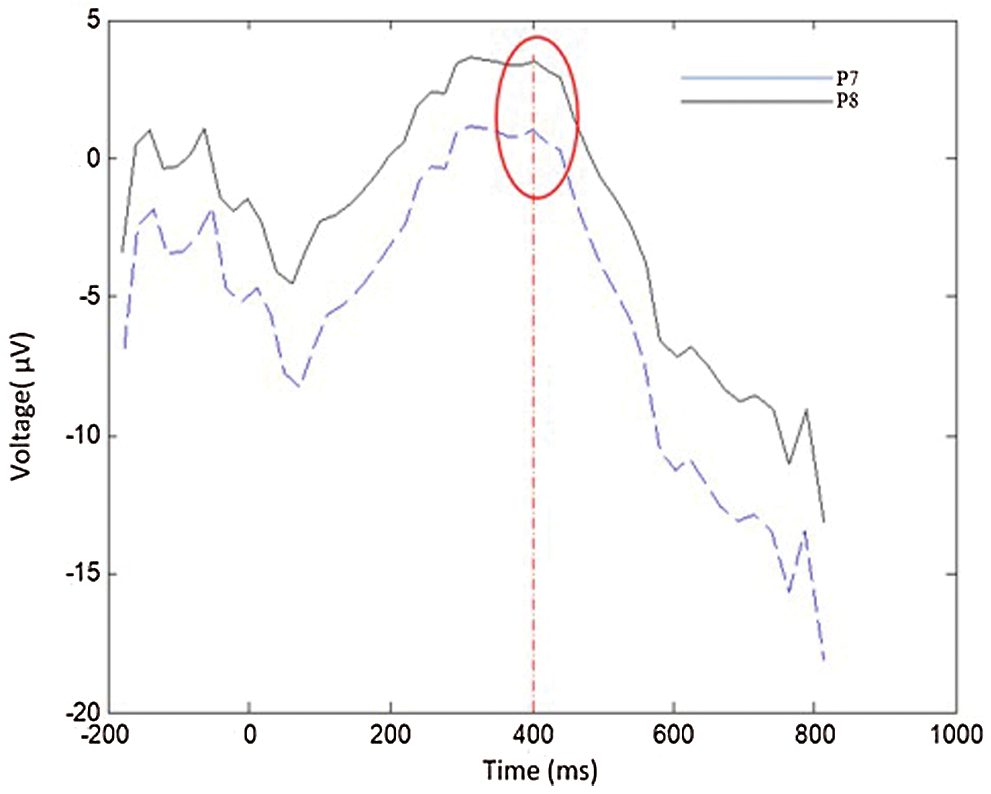
Figure 10: Estimation detection of component N400 from P7 and P8
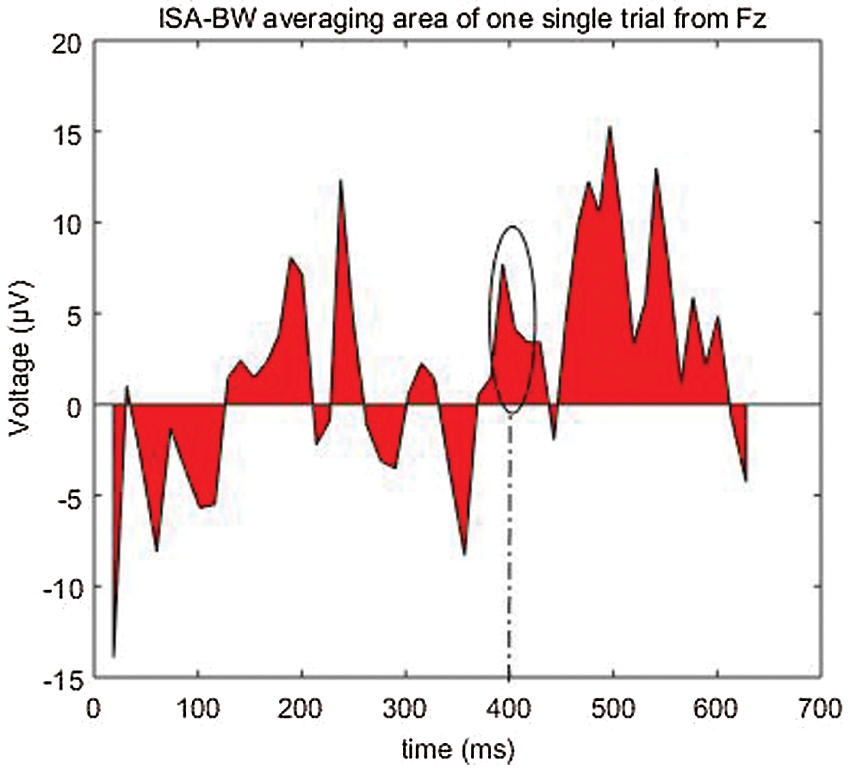
Figure 11: ISA-BW averaging from 1-single trial of Fz electrode
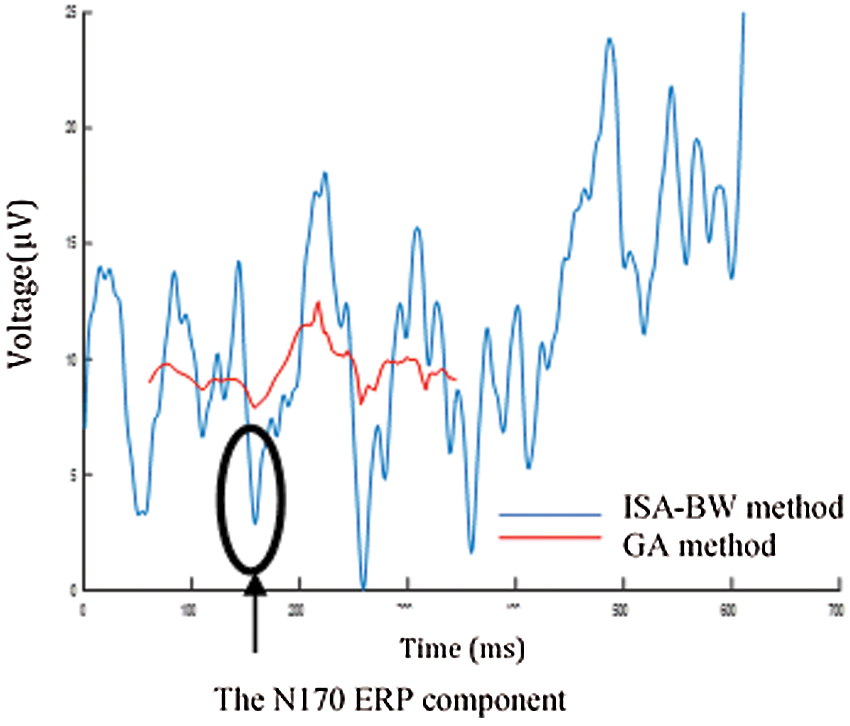
Figure 12: ISA-BW and GA method applied on Cz electrode to locate the N170 ERP component
In this paper, we evaluated the association between endogenous ERP components (N170, N400) for GC. This work highlights a comparison and analysis between classical priming paradigms and associative Stimulus Onset Asynchrony (SOA) 250 ms experimental priming conditions with a centrally presented example. Thus, the obtained priming effect can be modulated by manipulating (SO), the delay between the beginning of the presentation of the first and the appearance of the second stimulus. In the case of short SOA (less than 250 ms), the priming effects are of an automatic nature. With a long SOA (more than 250 ms), there is intervention of controlled processes in addition to automatic processes. In this work, the used two-approaches, ISA-BW and ISA, preserve correctly the shape of N400 and N170 without any added filters or any required additional synchronous average.
As N400 is strong in associative linkage, we look for the conditions where we can find it visibly. The relevant thing is to analyze the control conditions with the experimental conditions and since it is a reading protocol, we are looking for the parieto-temporal electrodes P7 and P8 (parietal as shown in Fig. 13).
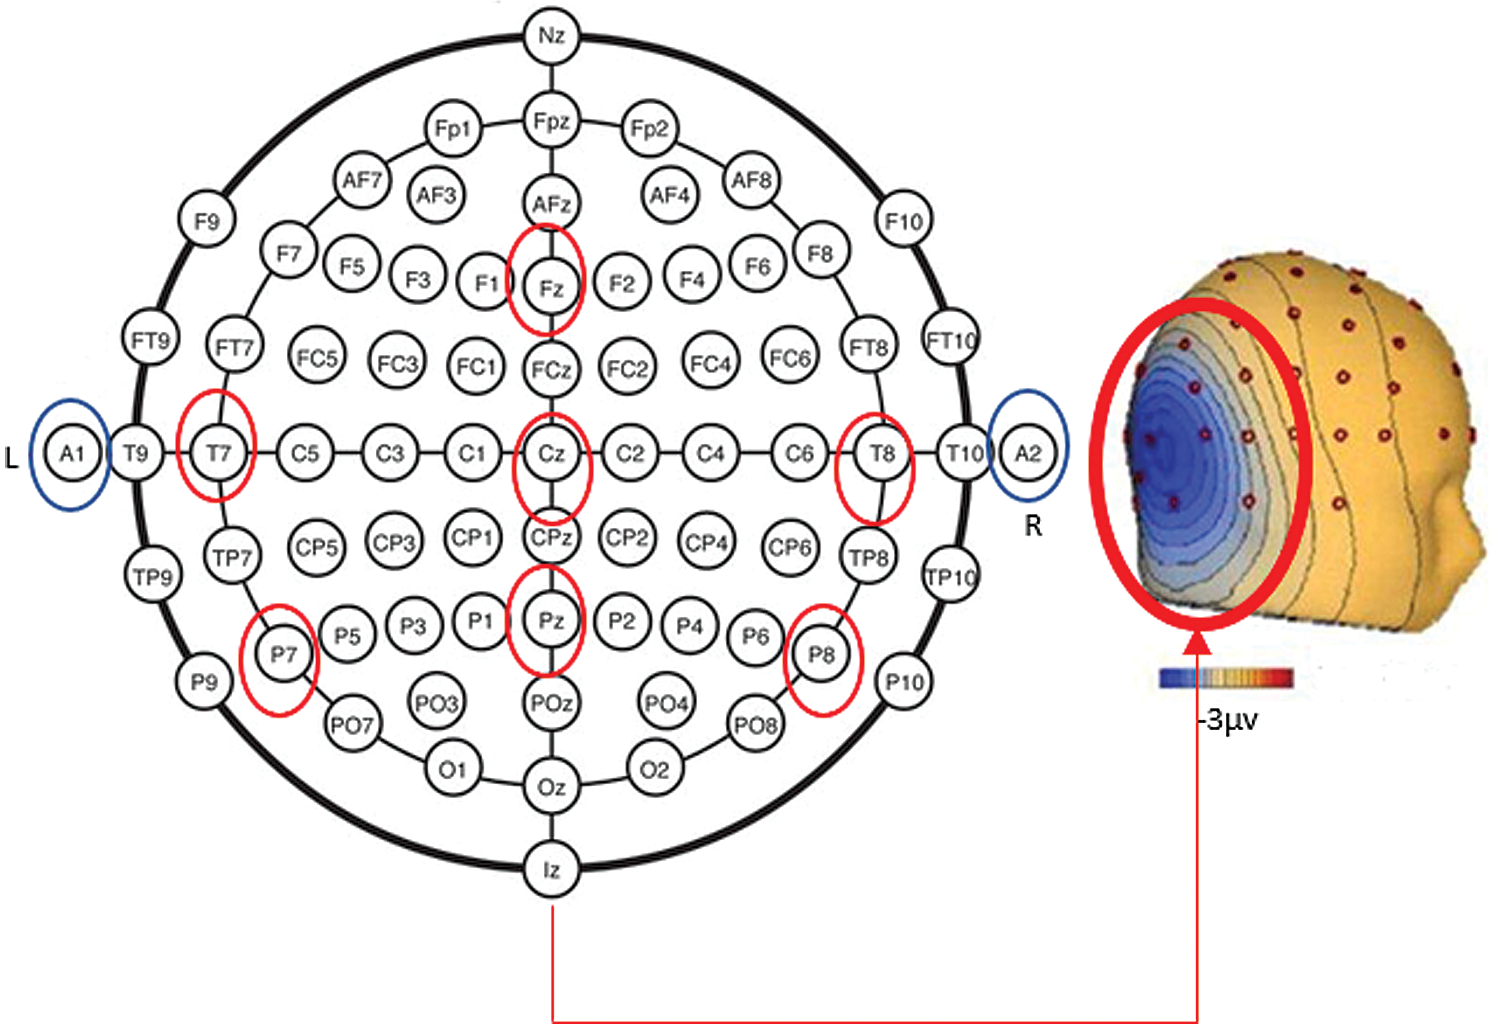
Figure 13: Electrode positions
Note: Red circle represents electrodes used to measure the N400 component amplitude and latency. Blue circles signal reference electrodes
Trigger [6–9] is the experimental control condition linked by these associative links presented centrally, where 9 is the target onset and 6 is the primer onset. Clearly, N400, contrary to what research has shown, is a bifid response that contains information and the more the gifted child is disappointed the more N400’ amplitude is wider. The paradigm is based on the priming by overlapping characteristics, priming by associative link which is precisely a competition between the two types of priming which explains the result of N400 bifid. Indeed, semantically speaking, the brain of the GC seeks what in a semantic category it could predict. Otherwise, the brain enters in a temporal competition to do both verifications. The N170 ERP component appears to reflect local sources in time and its amplitude increases with expertise and attention. In this study, the results show that N170 has an early phase between [143–172] ms and a late phase [187–193] ms. The response has greater negative peak amplitude in the right hemisphere than the left one. In the Temporal-Occipital region, results give |−4.10| μV > |−3.12| μV, p < .03. The difference maximal over P7, P8, p < .02 and some left hemisphere activation, TP7, p < .05). Therefore, N170 is sensitive to process a primary face perception and it is not likely for these stimuli, so the data cannot clarify to the proficiency hypothesis.
After ERP extraction, 13 statistical features are taken from the N400 responses which, in turn, are drawn out from 2 channels (P7-P8). The N400 component with the latency window of 150 to 500 ms was extracted. The feature extraction method aims to better characterize and profile GC. The combined features are computed in order to offer useful tools for data exploration. This leads us to determine significant features which can improve the diagnosis of GC.
Tab. 3 presents the time features extracted from N400 signals [34]. For the purpose of finding the subset of the most priority features, many experiments have been tested using the CD-J algorithm. In order to reduce the redundancy between samples and to select relevant features, a characterization degree method (CD-J) is performed [35]. This approach is a derived method from the linear discriminant analysis (LDA) based on the ratio between the inter-class and the intra-class variances. Different tests are applied on the feature number to grab the useful set. Reliant on the highest characterization degree, the most important attribute is chosen for all feature combinations. As revealed in Tab. 4, the average value of J is computed through the considered combination for each feature number. To conclude, the best combination is the one formed of five features among fourteen is ATS, TAS, PS, NS, ANS. The selected group has the highest characterization degree 2.032 compared to the last combinations. As shown in the results, the significant attributes belong to the area features and integral of points that are considered as the greatest negative peak amplitude in parietal electrode processing. The left pareto–temporal area is considered the greatest area that can extract features that are integral of negative points. In this study, testing the correlation of sensitivity to time markers with training effectiveness gives best results of N400 component which is in parietal area.


In summary, the research presented in this paper has been undertaken through four important phases. The first phase focused on selecting the sample participants on the basis of two criteria: The age range and the WISC-V test scores. The second was intended to create the essential stimuli to provoke the child in order to obtain the ERP responses via an android application that was invented to couple the acts of both reading and writing together. In this respect, it is worth noting that the tablet dialogues with the equipment set with an analog adapter were also created by the team. The third phase was meant to extract the ERPs. Accordingly, two methods ISA and ISA-BW were programmed and compared with the method of synchronized averages, called GA. The results attained showed that clear responses could be restored from 10 to 12 segments with ISA and one single trial with the ISA-BW method. It has also been demonstrated that the N400 component is a bifid waveform in early children, which is a novelty in the medical field. The final phase, which was about the extraction of the N400 component, helped us to carry out a study on the statistical attributes and apply the CD-J criterion to choose the most discriminative attributes. This final result has already initiated another work that is being done to achieve a classification of children according to their intellectual levels to better improve the recognition process of children with high potential. Compared to other works, the experimental results reveal that the proposed methods are extremely helpful and suitable for the realization of a real-time diagnostic system. The real clinical application is intended for GC for early diagnosis. Besides, this work takes index from ERPs that highlight more the mental operations and elucidate the neurology aspects for GC cognitive processes. In future works, several perspectives can be made to classify the different categories of giftedness by choosing a degree of intellectual advancement and using new tablet-based experiments.
Acknowledgement: We would like to express our gratitude to the editor and anonymous reviewers for their constructive comments that will lead to this manuscript improvement in quality and presentation.
Funding Statement: The authors received no specific funding for this study.
Conflicts of Interest: The authors declare that they have no conflicts of interest to report regarding the present study.
1. A. Bucaille, C. Jarry, J. Allard, S. Brochard, S. Peudenier et al., “Neuropsychological profile of intellectually gifted children: A systematic review,” Journal of the International Neuropsychological Society, vol. 27, no. 5, pp. 1–17, 2021. [Google Scholar]
2. P. Beljan, J. T. Webb, E. R. Amend, N. E. Web, J. Goerss et al., “Misdiagnosis and dual diagnoses of gifted children and adults: ADHD, bipolar, OCD, asperger's, depression, and other disorders,” Gifted and Talented International: The Official Journal of the World Council for Gifted and Talented Children, vol. 21, no. 2, pp. 83–86, 2016. [Google Scholar]
3. C. Steinkuehler and S. C. Duncan, “Scientific habits of mind in virtual worlds,” Journal of Science Education and Technology, vol. 17, no. 6, pp. 530–543, 2008. [Google Scholar]
4. N. T. Mazoyer, M. P. Bertolotti, G. Jobard, B. Mazoyer and M. Baciu, “Multi-factorial modulation of hemispheric specialization and plasticity for language in healthy and pathological conditions: A review,” Cortex Journal, vol. 86, no. 1, pp. 314–339, 2017. [Google Scholar]
5. D. Kahneman and W. Krämer, “Thinking, fast and slow,” Statistical Papers, vol. 55, no. 3, pp. 915–915, 2014. [Google Scholar]
6. C. Lamm, F. Ph. S. Fischmeister and H. Bauer, “Individual differences in brain activity during visuo-spatial processing assessed by slow cortical potentials and LORETA,” Cognitive Brain Research, vol. 25, no. 3, pp. 900–912, 2005. [Google Scholar]
7. C. Y. Wang and Y. E. Lin, “The influence of semantic relevance on the discernment of product appearance and function,” BMC Psychology, vol. 9, no. 1, pp. 1–16, 2021. [Google Scholar]
8. M. Joyal, C. Groleau, C. Bouchard, M. A. Wilson and S. Fecteau, “Semantic processing in healthy aging and Alzheimer's disease: A systematic review of the N400 differences,” Brain Sciences, vol. 10, no. 11, pp. 770, 2020. [Google Scholar]
9. J. M. Olichney, V. J. Iragui, S. D. P. Salmon and B. R. Riggins, “Absent event-related potential (ERP) word repetition effects in mild Alzheimer's disease,” Clinical Neurophysiology, vol. 117, no. 6, pp. 1319–1330, 2006. [Google Scholar]
10. M. Kutas and S. A. Hillyard, “Reading senseless sentences: Brain potentials reflect semantic incongruity,” Science Journal, vol. 207, no. 4427, pp. 203–205, 1980. [Google Scholar]
11. M. Kutas and K. D. Federmeier, “Electrophysiology reveals semantic memory use in language comprehension,” Trends in Cognitive Sciences, vol. 4, no. 12, pp. 463–470, 2000. [Google Scholar]
12. E. F. Lau, C. Phillips and D. Poeppel, “A cortical network for semantics:(de) constructing the N400,” Nature Reviews Neuroscience, vol. 9, no. 12, pp. 920–933, 2008. [Google Scholar]
13. F. Camarrone and M. V. V. Hulle, “Measuring brand association strength with EEG: A single-trial N400 ERP study,” PLoS One, vol. 14, no. 6, pp. 1–17, 2019. [Google Scholar]
14. C. Keitel, C. S. Y. Benwell, G. Thut and J. Gross, “No changes in parieto-occipital alpha during neural phase locking to visual quasi-periodic theta-, alpha-, and beta-band stimulation,” European Journal of Neuroscience, vol. 48, no. 7, pp. 2551–2565, 2018. [Google Scholar]
15. G. Mattavelli, M. Rosanova, A. G. Casali, C. Papagno and L. J. R. Lauro, “Top-down interference and cortical responsiveness in face processing: A TMS-EEG study,” Neuroimage, vol. 76, no. 13, pp. 24–32, 2013. [Google Scholar]
16. S. Sur and V. K. Sinha, “Event-related potential: An overview,” Industrial Psychiatry Journal, vol. 18, no. 1, pp. 70–73, 2009. [Google Scholar]
17. K. R. Müller, R. Vigário, F. Meinecke and A. Ziehe, “Blind source separation techniques for decomposing event-related brain signals,” International Journal of Bifurcation and Chaos, vol. 14, no. 2, pp. 773–791, 2004. [Google Scholar]
18. C. T. Lin, R. C. Wu, S. F. Liang, W. H. Chao, Y. J. Chen et al., “EEG-Based drowsiness estimation for safety driving using independent component analysis,” IEEE Transactions on Circuits and Systems I: Regular Papers, vol. 52, no. 12, pp. 2726–2738, 2005. [Google Scholar]
19. A. Subasiand and M. I. Gursoy, “EEG signal classification using PCA, ICA, LDA and support vector machines,” Expert Systems with Applications, vol. 37, no. 12, pp. 8659–8666, 2010. [Google Scholar]
20. A. M. Norcia, A. Lee, W. J. Meredith, P. J. Kohler, F. Pei et al., “A Case-control study of visual, auditory and audio-visual sensory interactions in children with autism spectrum disorder,” Journal of Vision, vol. 21, no. 4, pp. 5, 2021. [Google Scholar]
21. S. Mallat and Z. Zhang, “Matching pursuits with time-frequency dictionaries,” IEEE Transactions on Signal Processing, vol. 41, no. 12, pp. 3397–34151993, 1993. [Google Scholar]
22. D. Chen, S. Wan, J. Xiang and F. S. Bao, “A High-performance seizure detection algorithm based on discrete wavelet transform (DWT) and EEG,” PLoS One, vol. 12, no. 3, pp. e0173138, 2017. [Google Scholar]
23. K. Benharrath, B. Khadoumi, M. Sayadi, H. Rix, M. N. Magnié-Mauro et al., “A new approach to detect N400 event-related potentials in giftedness children,” in 4th Int. Conf. on Advanced Systems and Emergent Technologies (IC_ASET) IEEE, Hammamet, TUNISIA, pp. 75–78, 2020. [Google Scholar]
24. G. Vigliocco, D. P. Vinson, J. Druks, H. Barber and S. F. Cappa, “Nouns and verbs in the brain: A review of behavioral, electrophysiological, neuropsychological and imaging studies,” Neuroscience & Biobehavioral Reviews, vol. 35, no. 3, pp. 407–426, 2011. [Google Scholar]
25. B. New, C. Pallier, L. Ferrand and R. Matos, “A lexical database for contemporary French on internet: Lexique,” L'Année Psychologique, vol. 101, no. 3, pp. 447–462, 2001. [Google Scholar]
26. S. E. Petersen, P. T. Fox, A. Z. Snyder and M. E. Raichle, “Activation of extra striate and frontal cortical areas by visual words and word-like stimuli,” Science Journal, vol. 249, no. 4972, pp. 1041–1044, 1990. [Google Scholar]
27. A. V. Diez Roux, N. Ranjit, N. S. Jenny, S. Shea, M. Cushman et al., “Race/ethnicity and telomere length in the multi-ethnic study of Atherosclerosis,” Aging Cell, vol. 8, no. 3, pp. 251–257, 2009. [Google Scholar]
28. I. Sturm, S. Lapuschkin, W. Samek and K. R. Müller, “Interpretable deep neural networks for single-trial EEG classification,” Journal of Neuroscience Methods, vol. 274, no. 18, pp. 141–145, 2016. [Google Scholar]
29. T. W. Picton, A. Dimitrijevic, M. S. John, P. Van Roon et al., “The use of phase in the detection of auditory steady-state responses,” Clinical Neurophysiology, vol. 112, no. 9, pp. 1698–1711, 2001. [Google Scholar]
30. D. Gervini and T. Gasser, “Self-modelling warping functions,” Journal of the Royal Statistical Society: Series B (Statistical Methodology), vol. 66, no. 4, pp. 959–971, 2004. [Google Scholar]
31. S. Boudaoud, H. Rix and O. Meste, “Integral shape averaging and structural average estimation: A comparative study,” IEEE Transactions on Signal Processing, vol. 53, no. 10, pp. 3644–36, 2005. [Google Scholar]
32. H. Rix, O. Meste and W. Muhammad, “Averaging signals with random time shift and time scale fluctuations,” Methods of Information in Medicine, vol. 43, no. 1, pp. 13–16, 2004. [Google Scholar]
33. L. Saidi, J. Ben Ali, M. Benbouzid and E. Bechhoefer, “An integrated wind turbine failures prognostic approach implementing Kalman smoother with confidence bounds,” Applied Acoustics, vol. 138, pp. 199–208, 2018. [Google Scholar]
34. I. Kalatzis, N. Piliouras, E. Ventouras, C. C. Papageorgiou, A. D. Rabavilas et al., “Design and implementation of an SVM-based computer classification system for discriminating depressive patients from healthy controls using the P600 component of ERP signals,” Computer Methods and Programs in Biomedicine, vol. 75, no. 1, pp. 11–22, 2004. [Google Scholar]
35. K. Benharrath, B. Khaddoumi, M. Sayadi, H. Rix, O. Meste et al., “Feature optimization for gifted children diagnosis,” in 5th Int. Conf. on Advanced Technologies for Signal and Image Processing (ATSIP) IEEE, Sousse, TUNISIA, pp. 1–6, 2020. [Google Scholar]
 | This work is licensed under a Creative Commons Attribution 4.0 International License, which permits unrestricted use, distribution, and reproduction in any medium, provided the original work is properly cited. |