DOI:10.32604/iasc.2022.023417
| Intelligent Automation & Soft Computing DOI:10.32604/iasc.2022.023417 | |
| Article |
Envisaging Employee Churn Using MCDM and Machine Learning
1Amity International Business School, Amity University, Noida, 201301, India
2School of Computer Science and Engineering SCE, Taylor's University, Subang Jaya, 47500, Malaysia
3Department of Computer Science, College of Computers and Information Technology, Taif University, Taif, 21944, Saudi Arabia
*Corresponding Author: NZ Jhanjhi. Email: noorzaman.jhanjhi@taylors.edu.my
Received: 07 September 2021; Accepted: 18 November 2021
Abstract: Employee categorisation differentiates valuable employees as eighty per cent of profit comes from twenty per cent of employees. Also, retention of all employees is quite challenging and incur a cost. Previous studies have focused on employee churn analysis using various machine learning algorithms but have missed the categorisation of an employee based on accomplishments. This paper provides an approach of categorising employees to quantify the importance of the employees using multi-criteria decision making (MCDM) techniques, i.e., criteria importance through inter-criteria correlation (CRITIC) to assign relative weights to employee accomplishments and fuzzy Measurement Alternatives and Ranking according to the Compromise Solution (MARCOS) method to divide employees into three categories. Followed by executing churn analysis of each category of employees and original dataset using machine learning algorithms to investigate the importance of employee categorisation. CatBoost, Support Vector Machine, Decision Tree, Random Forest and XGradient Boost algorithms have been used to analyse the categorised and non-categorised dataset on the accuracy, precision, recall and Mathew's Correlation Coefficient (MCC) to derive the best suitable algorithm for the used dataset. CatBoost algorithm showed the best results regarding performance measurements for categorised employees are better than all employee datasets.
Keywords: Employee churn; employee categorisation; CRITIC; MARCOS; machine learning; weight criteria
Employee churn (EC) drains an organisation of time, money, and productivity [1]. In addition, turnover has indirect costs of low employee morale, unhappy customers, lost networks, and lost skillset, resulting in high costs for hiring new employees, which requires more time and capital. With the advent of new technologies, there has been an increasing trend in analysing data in quest of scientific evidence [2]. Churn analysis is vital to confirm constant growth and business advancement, ensuring a higher return rate. However, past literature has revealed a negative relationship between organisational performance and employee churn [3]. As per the Chartered Institute of Personnel and Development HR Outlook in 2016–17, it was concluded that less than 50 per cent of human resource leaders use analytics at basic to medium level, and 12.8 per cent only have used at an advanced level. Based on this context, machine learning is essential for designing an employee churn and retention approach (ECR). Over the past few years, there has been a boom in the successful application of machine learning (ML) algorithms in several domains, namely, suggestive systems [4], prediction of personal life events [5], stock price prediction. Insufficient resources for employee churn prediction manually and availability of reliable data [6] drives the implementation of ML algorithms for the employee churn issue.
Employee importance is evaluated based on various criteria; however, it is challenging to categorise employees accordingly. Multi-criteria decision making has proved potential in dealing with such a problem. Criteria Importance Through Intercriteria Correlation (CRITIC) method, calculate criteria weights using correlation coefficient and standard deviation to quantify each attribute's value. Measuring Alternatives and Ranking according to the COmpromise Solution (MARCOS) method use derived weights for categorising employees. MARCOS defines the relationship between reference values and alternatives. The association between alternatives and ideal/anti-ideal points are well-defined by determining the utility degree of the alternatives. As compared to other MCDM techniques, MARCOS is an effective and easy method for augmenting the process. It involves an algorithm to analyse the relationship between alternatives and reference points. The Fig. 1 below depicts the diagrammatic representation of research gap identified in the study.

Figure 1: Diagrammatic representation of research gap
Previous literature focuses on predicting EC using machine learning, but they miss the employee categorisation based on their importance and accomplishments as all employees are not critical to the company. Criticality may depend on the number of projects taken to date, job involvement, job satisfaction, time spent in the company and many others. Furthermore, factors triggering EC may also depend on the category of employee. Henceforth, designing a similar retention policy for all employees may prove ineffective. This study focuses on EC analysis using machine learning after categorising employees using MCDM techniques to fill this gap.
Previous research has not emphasised the prediction of employee churn based on employee categorisation using MCDM and ML algorithms together. Also, academicians have not placed a strong emphasis on employee categorisation and employee churn analysis via machine learning. This paper provides a novel approach to categorising employees using the CRITIC and MARCOS method and churn analysis of each employee category. Based on churn analysis of categorised employees, we design an approach highlighting the causes of attrition and strategising retention policy. Through categorisation, employees of critical importance, moderate and least productive employees are identified; enabling organisations to save cost and time. Factors prompting employee churn can be different for different categories; henceforth, retention strategies must be framed accordingly.
The paper is organised in the following sequence. Section 2 reviews the existing literature on employee churn in the context of machine learning. Section 3 describes CRITIC's research methods for weight estimation, MARCOS for employee categorisation and employee churn prediction using ML algorithms. Findings are summarised in Section 4, followed by a conclusion in Section 5.
Churn analysis has been commonly executed in various fields like marketing for predicting customer churn, assessing portfolio investors for financial risk tolerance [7], recommender system prediction about user's needs and preferences [8], but its applicability in human resource is still limited compared to date research in marketing and finance. On the other hand, employee churn is an important topic of human resource management, and a lot of research work is done between 1920 to 2020 [9].
With the increase in the execution of analytics, it has penetrated human resources over the past decade but has not achived the momentum it should have. Several implementations in data mining techniques include severance pay acceptance prediction, employee churn analysis [23], employee performance prediction [24], employee absenteeism prediction [25,26]. The current market scenario demands the HR function to move beyond mere reporting to an accurate forecast. Human Resource Predictive Analysis has rapidly changed the technology growth and can attain 100 per cent accuracy in decision-making for human resources [27]. However, Deloitte Press report 2015 states that today's HR cannot match the pace of business change. Today, there is a wide difference between what business leaders’ prospects and the incapabilities of HR to deliver.
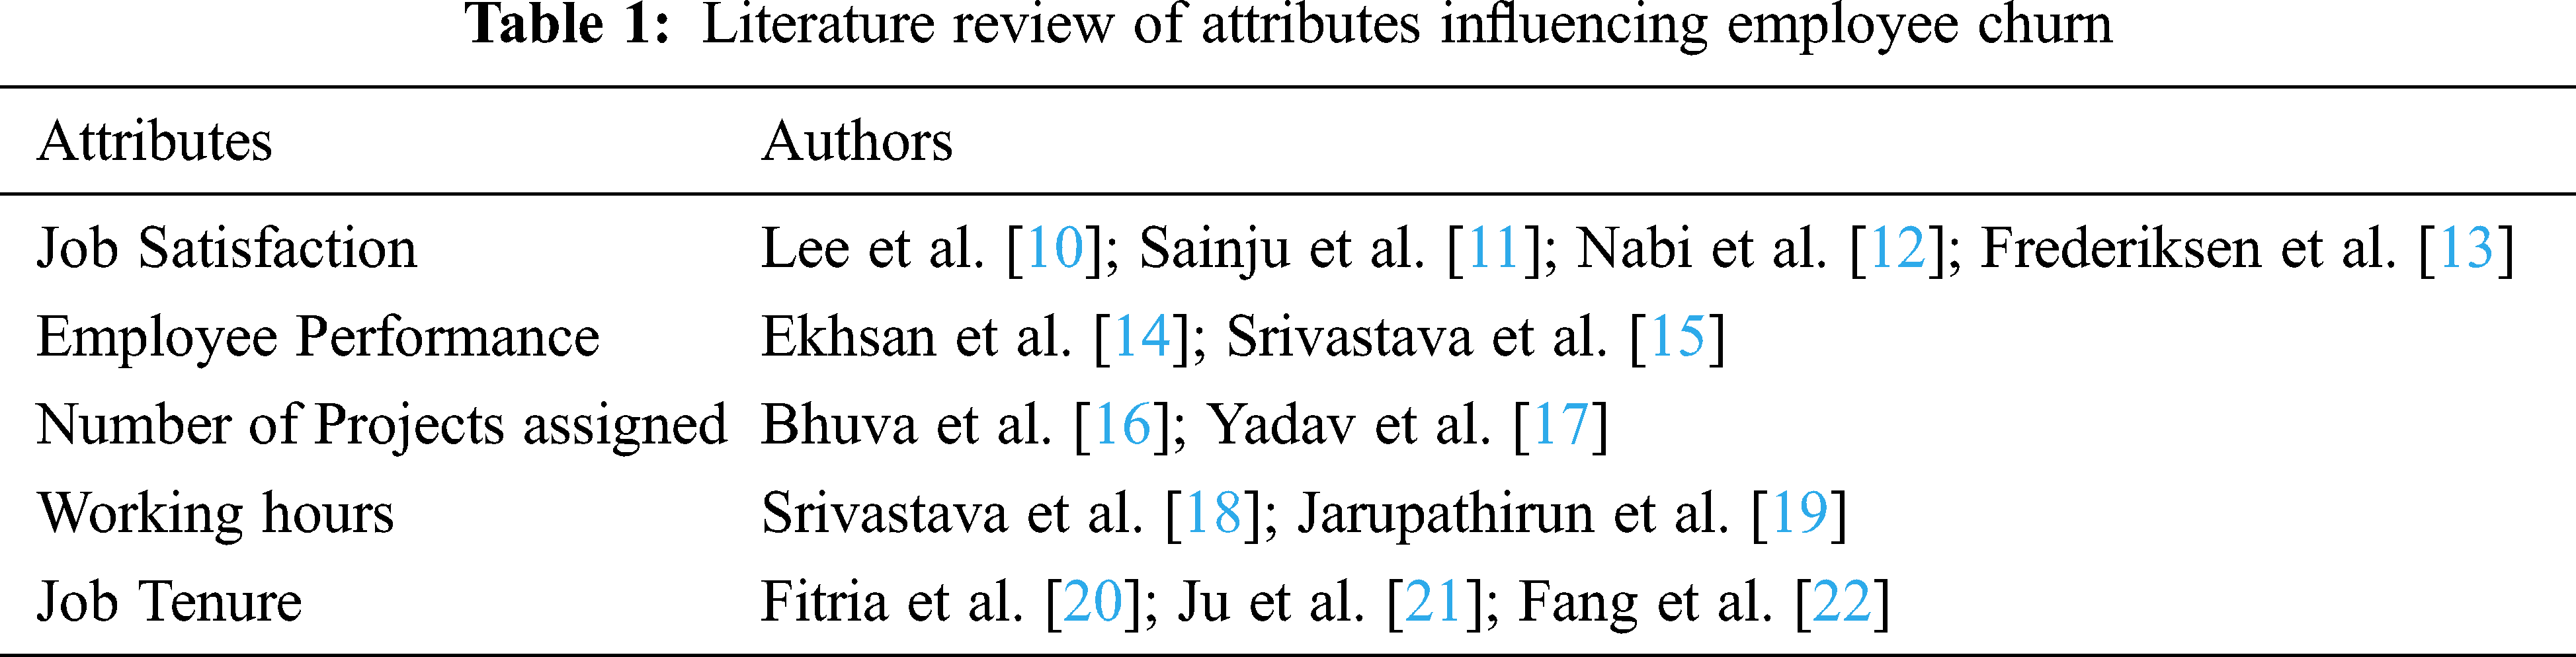
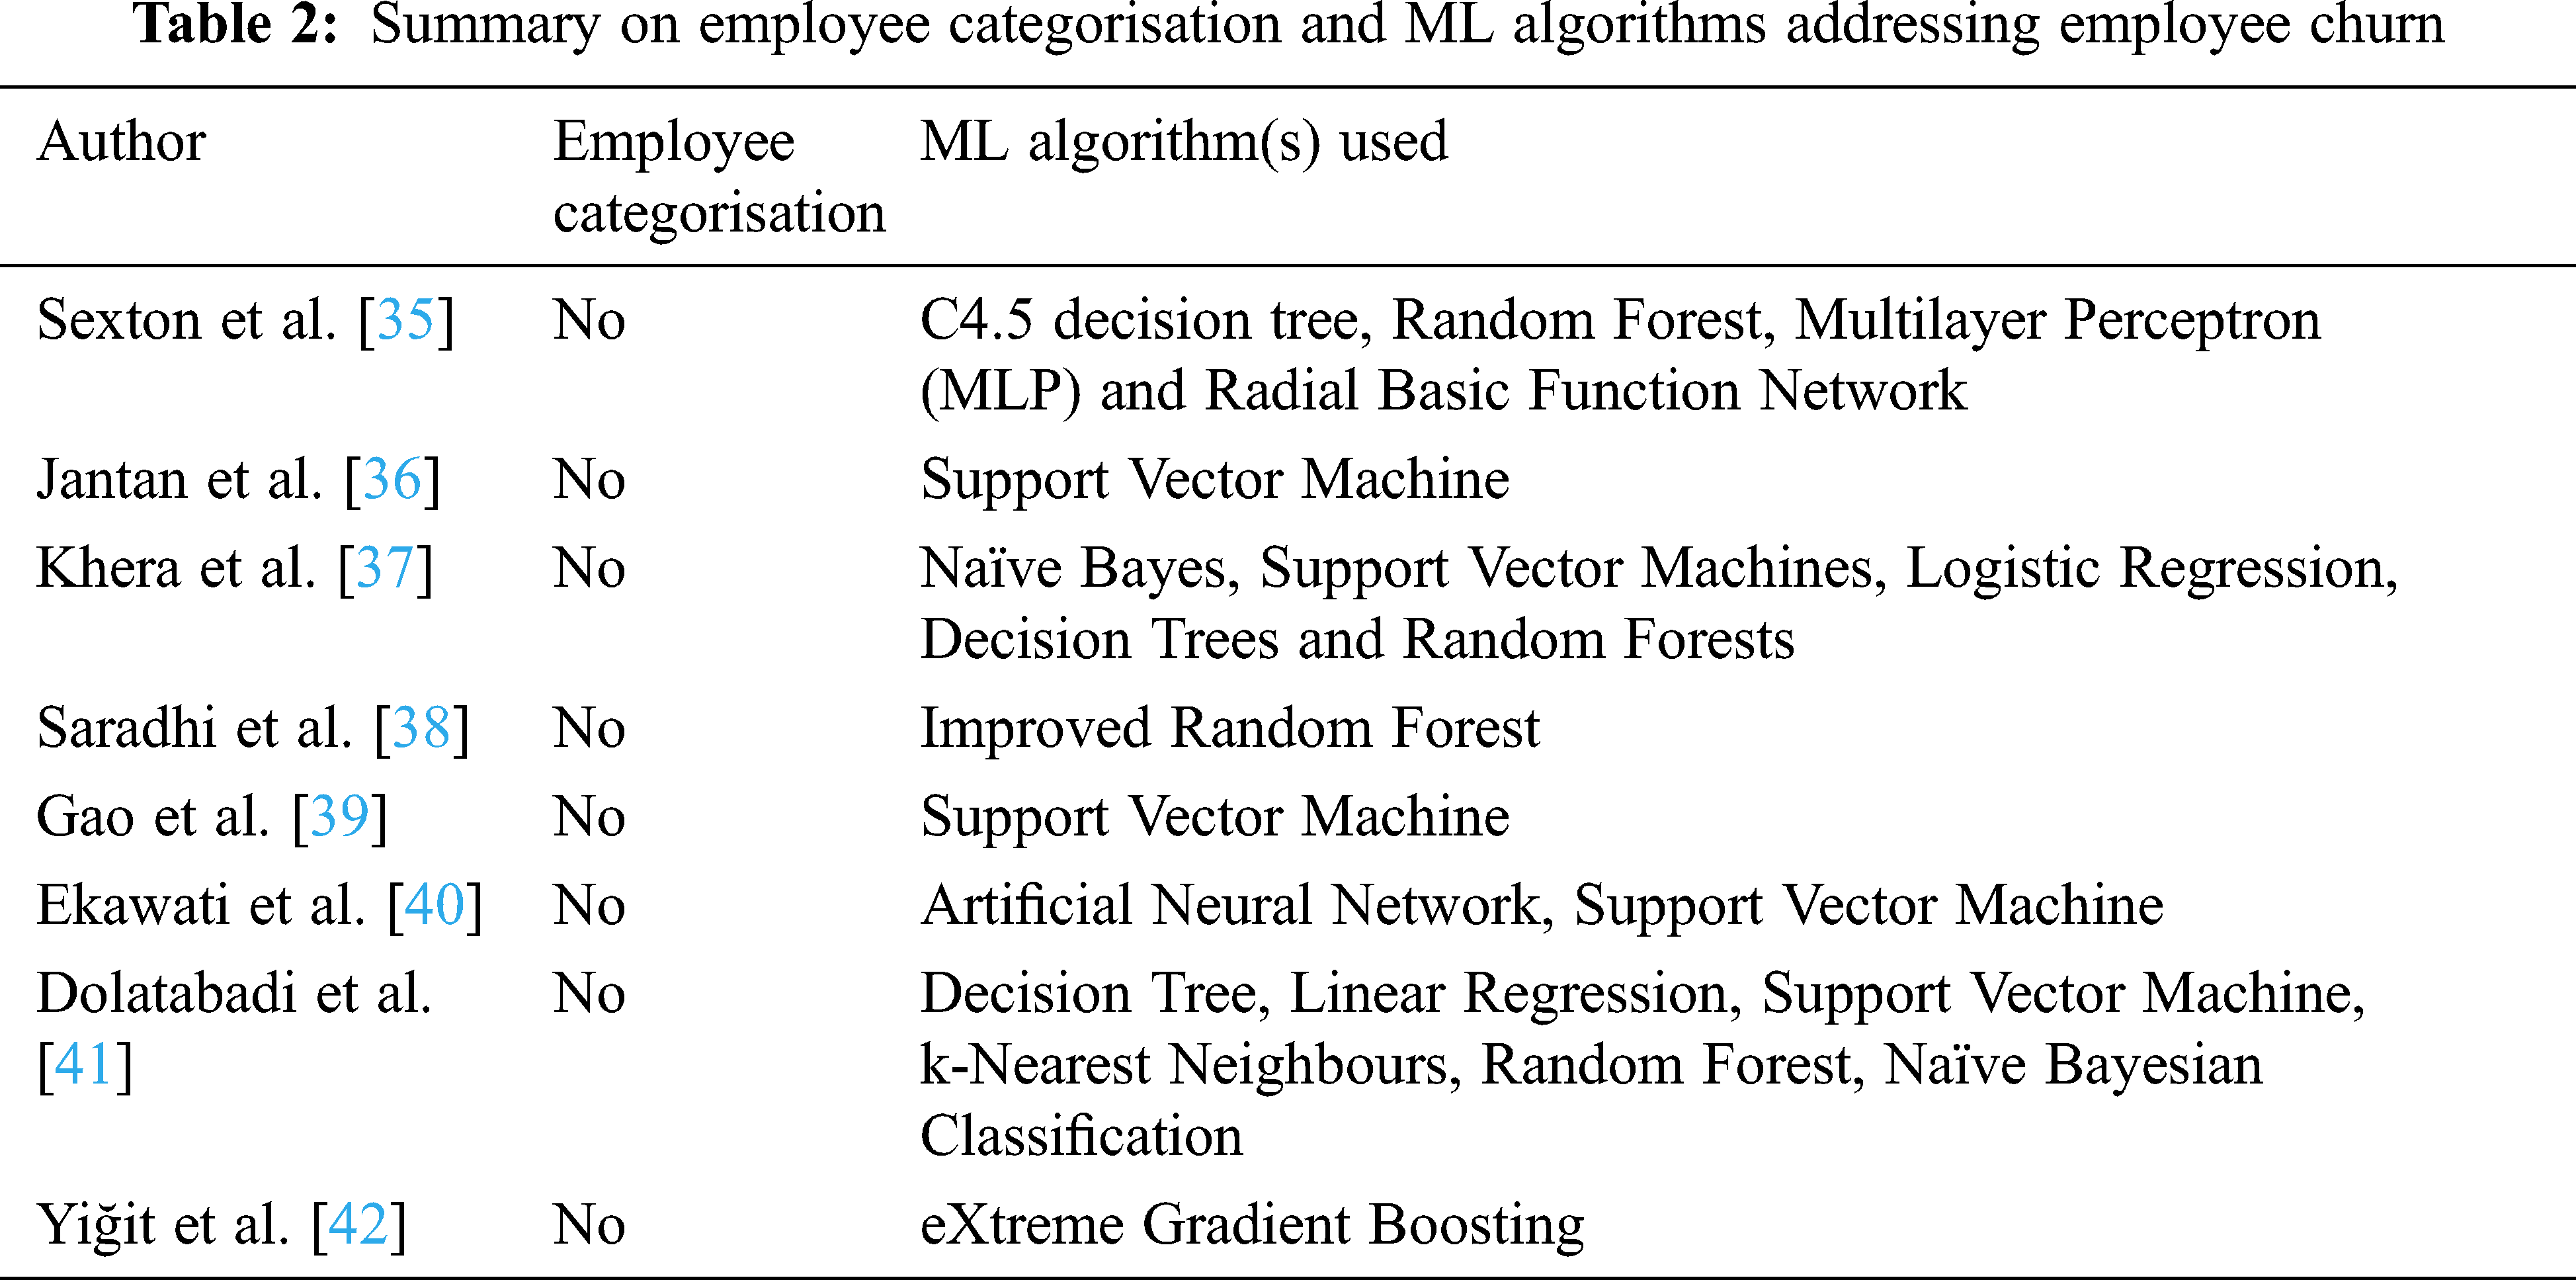
The voluntary cost can range to five times the employee's annual salary depending on the job importance and difficulty to replace an employee [28]. Though employee churn is identical to customer churn, the cost involved in EC is higher in some companies and requires more focus from the researchers in this field. High employee churn has detrimental consequences in the organisation, like impact on ongoing projects, dissatisfaction among customers, and inefficiency. It is hard to change employees with niche skillsets. Machine learning techniques can be applied to predict employee churn. Analytics examines data or content using various tools and techniques to get deeper insight, making predictions or suggestions [29]. EC can be approached in a similar way as customer churn prediction [30]. Machine learning algorithm uses employee data i.e., Human Resource Information System (HRIS) comprising employee attributes, performance levels, and satisfaction levels that provide insight into leaving the organisation. Data mining uses CRISP-DM in research studies as it gives a thorough understanding of the steps involved in data analysis. It includes business understanding, data understanding, data preparation, modelling, evaluation, and deployment. Data mining focuses on discovering models and patterns from extensive databases to generate results, but this result is not the end of the road as the application is not straightforward [31]. Neural network, visualisation technique, random tree, decision tree and linear regression are classifiers of supervised machine learning algorithms [32]. Several research works have been published related to employee churn due to dynamic market change [33]. A report published by IBM in 2016 states that usage of predictive analytics has increased by forty per cent over the last two years. Also, existing literature provides schemes of correlation between employee churn and job satisfaction based on theoretical assumptions. However, predictive analytics tend to extract the information from the available dataset. There has been rising interest in machine learning usage to predict employee churn in telecom, tourism, and health care. The neural network was used to predict EC; however, more improvement was required for accuracy and retention policy [34]. Several studies have focused on EC, as mentioned in Tab. 1; however, very few emphases on a retention policy for valuable employees can prove futile for the organisation as hiring cost is much higher than retention. From the below-mentioned Tab. 2, it is evident that the previous work focused on the prediction of EC without considering the categorisation of employees.
Previous literature includes analysis of employee churn using various machine learning algorithms, but categorisation of employees based on importance and productivity is unavailable. Considering employee categorisation is an essential factor because all employees do not hold equal importance in the organisation. The impact of distraught employees leaving the organisation will have a lesser effect than enthusiastic or Behavioural categorised employees. Considering all these issues, we have designed this paper for addressing EC, emphasising employee categorisation.
This section describes the methodology for categorisation of employees and prediction of employees using machine learning algorithms. The process is divided into three phases. Relative weights are derived using CRITIC in the first phase followed by categorisation of employees using MARCOS in the second phase. Lastly, support vector machine, random forest, CatBoost, XGradient Boost and decision tree supervised machine learning algorithms are applied on categorised employees and all employee datasets. Results of all ML algorithms are compared on parameters like accuracy, recall, precision, and Matthew's correlation coefficient. The proposed model is shown in below Fig. 2.

Figure 2: Proposed model by Authors
As shown in Fig. 2, employees are categorised into three categories. We mean the most productive and highly important to the organisation by ardent employees, while behavioural and distraught employees mean less and least-productive employees.
To exemplify the idea, the steps involved in analysis are explained on dataset available on the Kaggle website (URL: https://www.kaggle.com/analystanand/employee-attrition); the dataset of 4507 employees and eight attributes shown in Tab. 3.
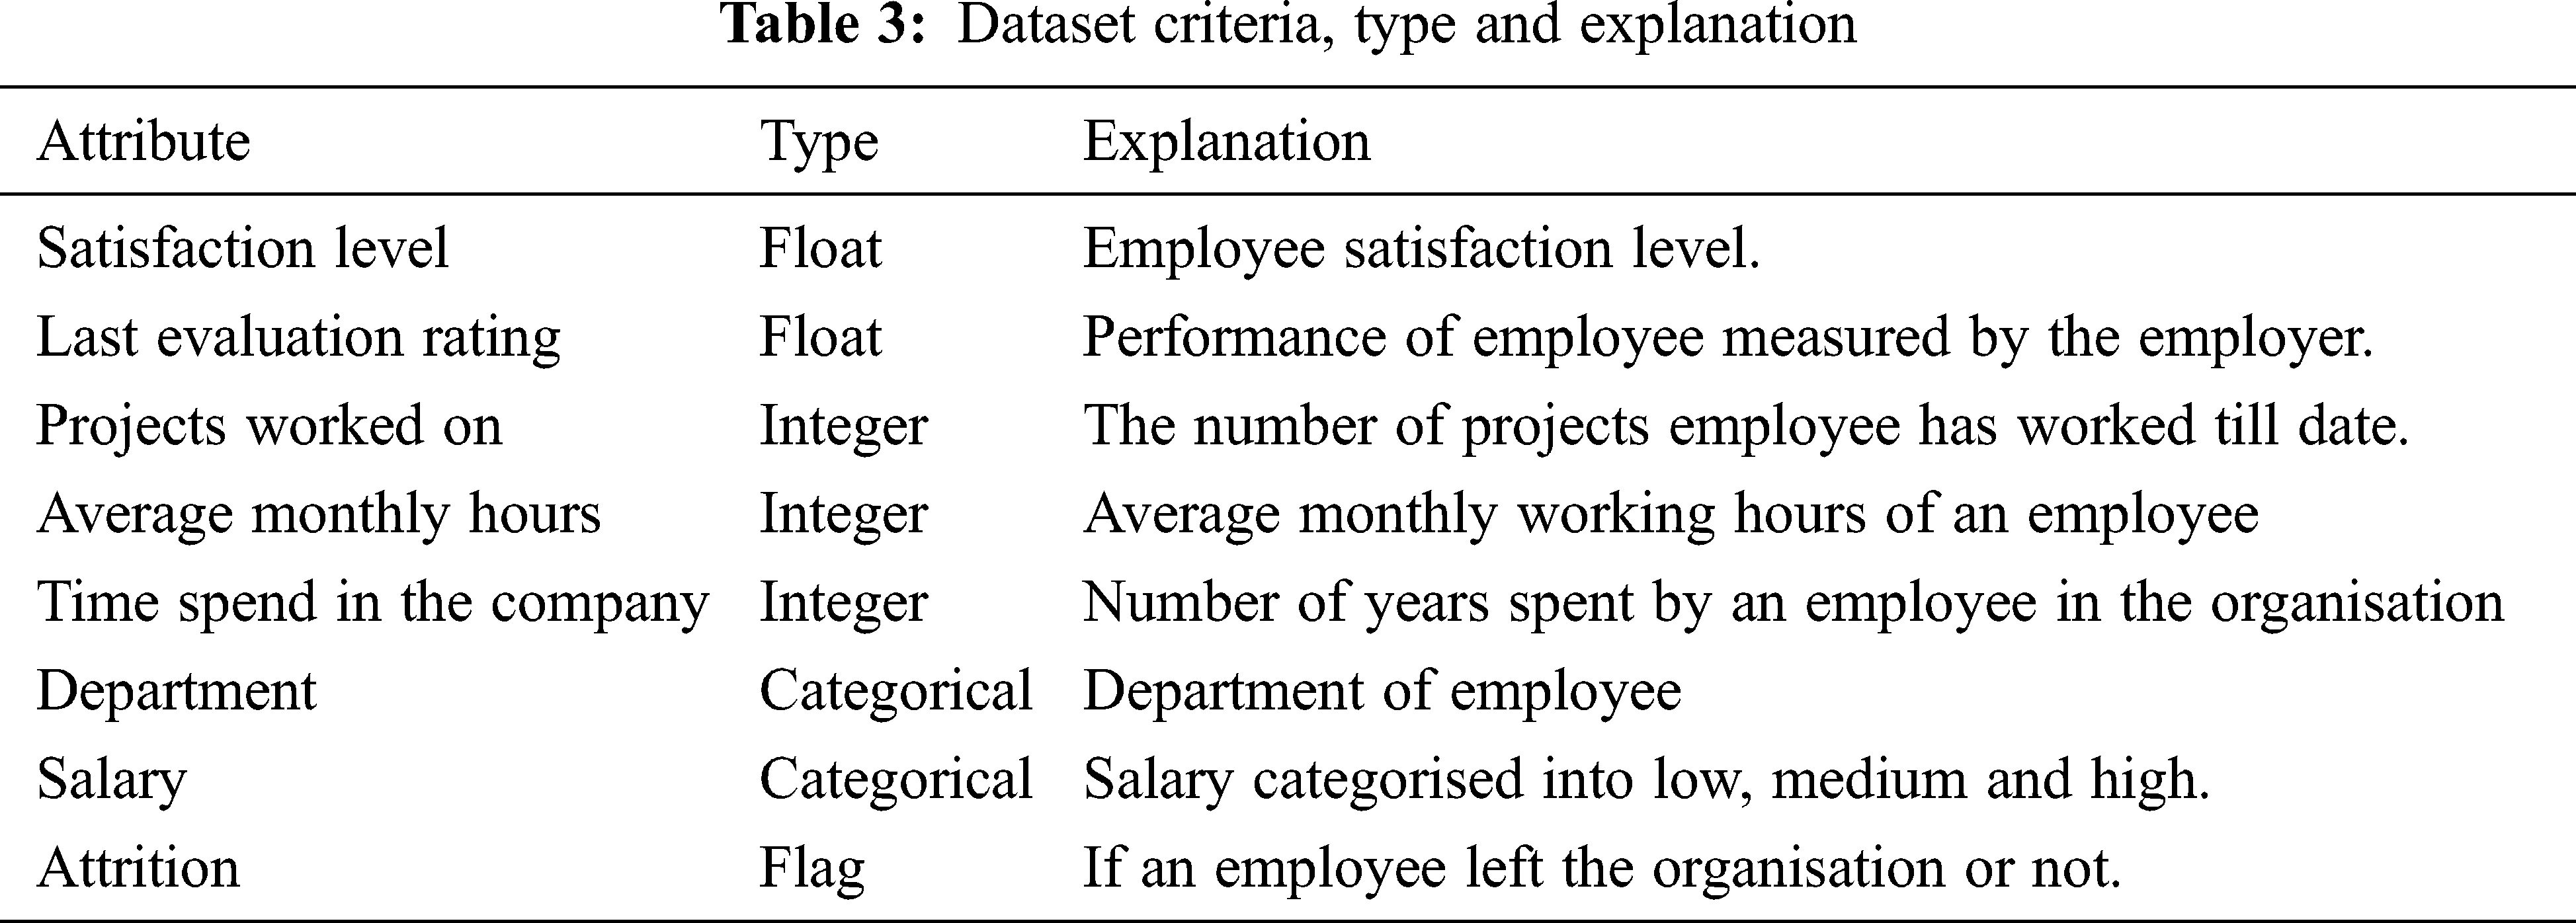
Dataset contains float (e.g., 7.2), integer (e.g., 23), categorical and flag (e.g., 1 or 0) type variables. Employees from various departments are analysed like sales, accounting, human resource, technical, support, IT, management, marketing, research & development and product management. At the same time, salary is categorised into low, medium and high categories. The description of each variable is shown in Tab. 3.
3.1 Criteria Importance Through Inter-Criteria Correlation (CRITIC)
Subjective weight methods such as the Delphi technique, analytical hierarchy process, SMART weighing is commonly used to determine weights. However, they may perhaps lead to deviation of index's weights due to subjective matters. The objective weight method is built on intrinsic information of indexes to derive weights to evade decision makers’ interference and make outcomes according to actualities. To avoid the limitation of the subjective weight method, we have used the CRITIC method, proposed in 1995 by Diakoulaki [43]. It is an objective weighting criteria method to determine weights of attributes using correlation coefficient and standard deviation to quantify each attribute's value. It is associated with the category of correlation method and is created on systematic assessment of decision-matrix to examine the information in the criteria basis weights are estimated.
3.1.1 Criteria weights using CRITIC. Following are the steps summarising the basics of CRITIC method:
Step 1: Normalisation of decision matrix: The number of accomplishments may have different values, which can cause inconsistent comparisons. Hence, decision matrix is normalised for standardising the data is calculated using Eq. (1)
Step 2: Computation of criteria weights using standard deviation and correlation: Secondly, Criteria weights are calculated using below formulas (2) and (3),
Cn is the extent of information confined in the nth criterion, σn means standard deviation of the nth criterion; rmn is the correlation-coefficient between mth and nth criteria. Thus, high criterion weight means a criterion with low correlation and high standard deviation with the other criteria. Henceforth, the Cn's higher value suggests more information attained from the criterion [44]. The sum of all values of criteria weights is 1. The Fig. 3 shows the Graphical representation of derived criteria weights.

Figure 3: Graphical representation of derived criteria weights
3.2 Measuring Alternatives and Ranking According to COmpromise Solution (MARCOS)
MARCOS defines the connection between alternatives and reference values, i.e., ideal and anti-ideal solutions. It measures the alternatives and their ranking concerning compromise solutions. Utility functions are determined based on defined relationship and compromise ranks derived concerning ideal and anti-ideal solutions. Utility functions signify the place of accomplishment concerning ideal and anti-ideal solutions. The best alternate is closest to the ideal solution and furthermost from the anti-ideal reference point.
MARCOS is characterised by its flexibility and does not become complex with an increase in more criteria. The analytic hierarchy process is a commonly used tool; however, it fails to provide rational ranking in many cases and becomes multifaceted with an increase in criteria. The TOPSIS method introduces a ranking index including the distance from the ideal and negative-ideal point. Results of MARCOS are more feasible due to the integration of ratio approach and reference point approach.
This method involves the below-mentioned steps:
Step 1: Development of initial-decision matrix: Like other MCDM techniques, the first step involves defining a set of n criteria and m alternatives.
Step 2: Development of extended initial decision matrix: Next, we define ideal (AI) and anti-ideal (AAI) in extension to initial decision making.
The basis on the criteria, AAI and AI, is calculated using (4) and (5):
where B and C signify benefit and non-benefit groups of criteria, respectively.
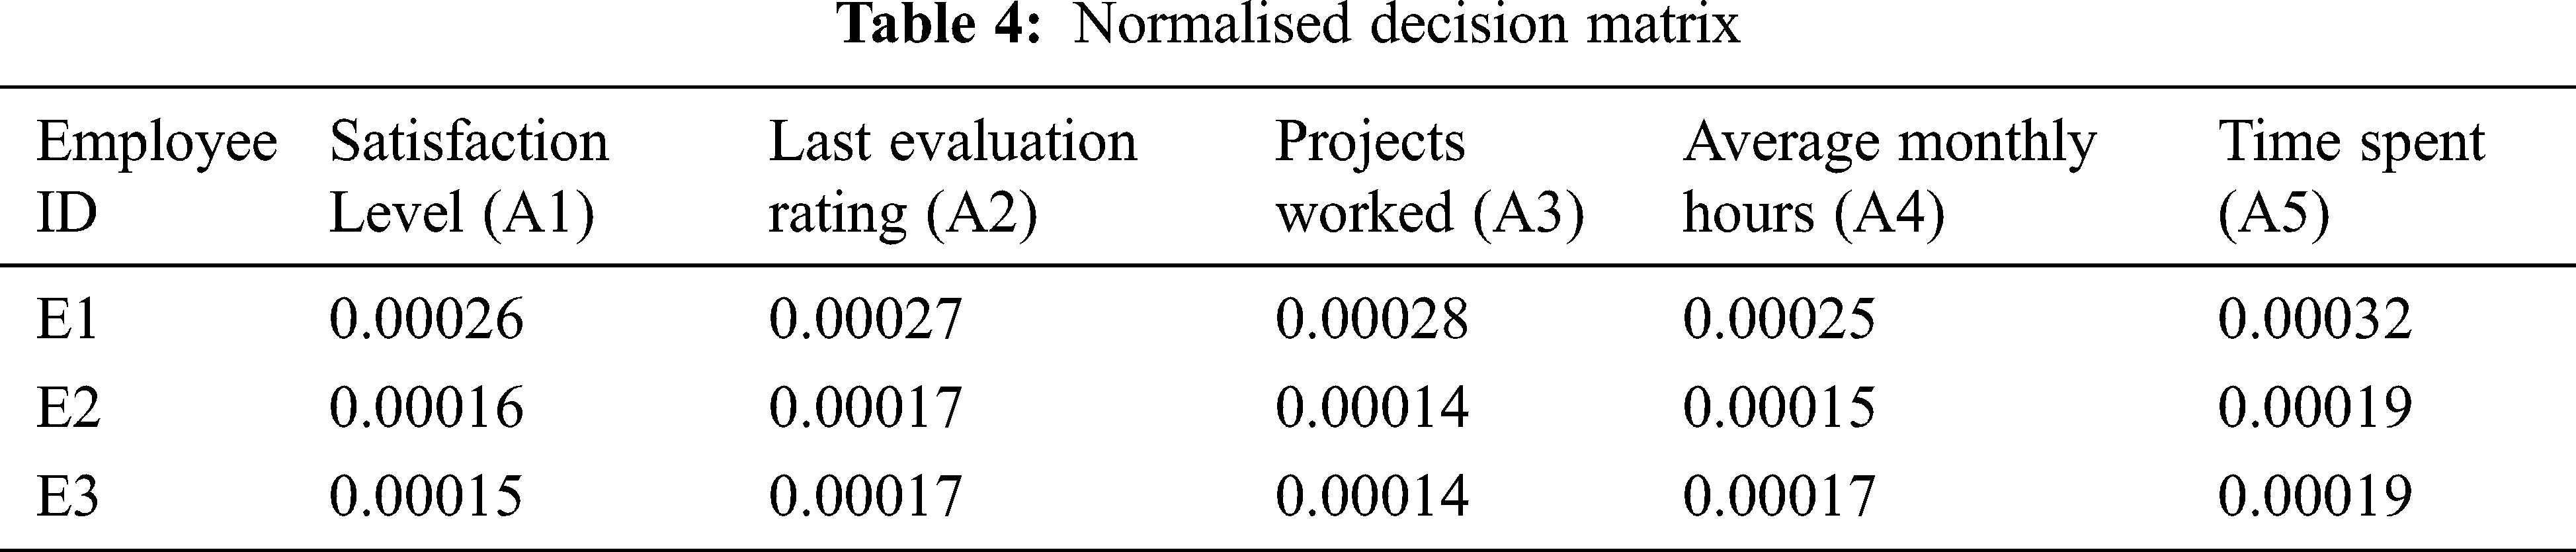
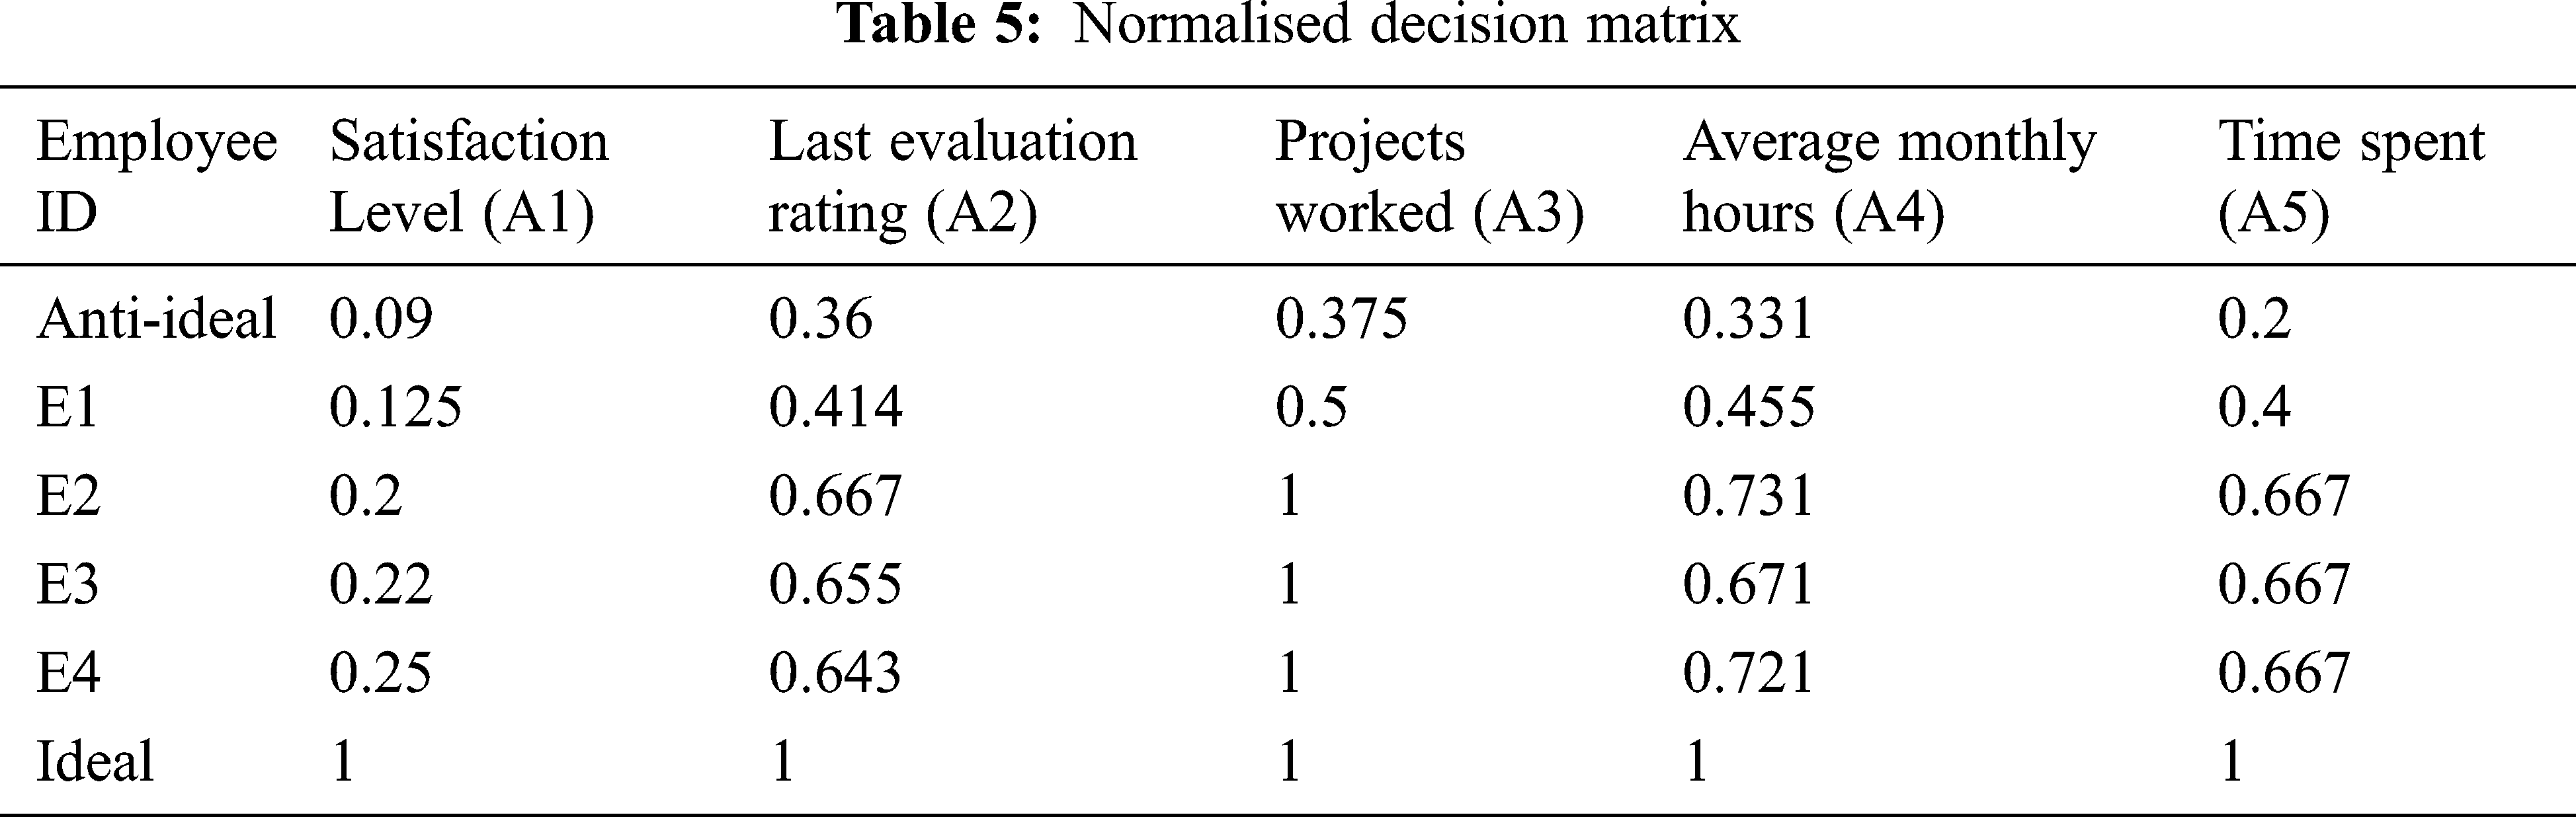
Step 3: Normalising the extended initial decision matrix: Initial decision matrix(X) is normalised to standardise the matrix and is done using the below expressions (6) and (7): The Tab. 5 below represented the Normalised decision matrix
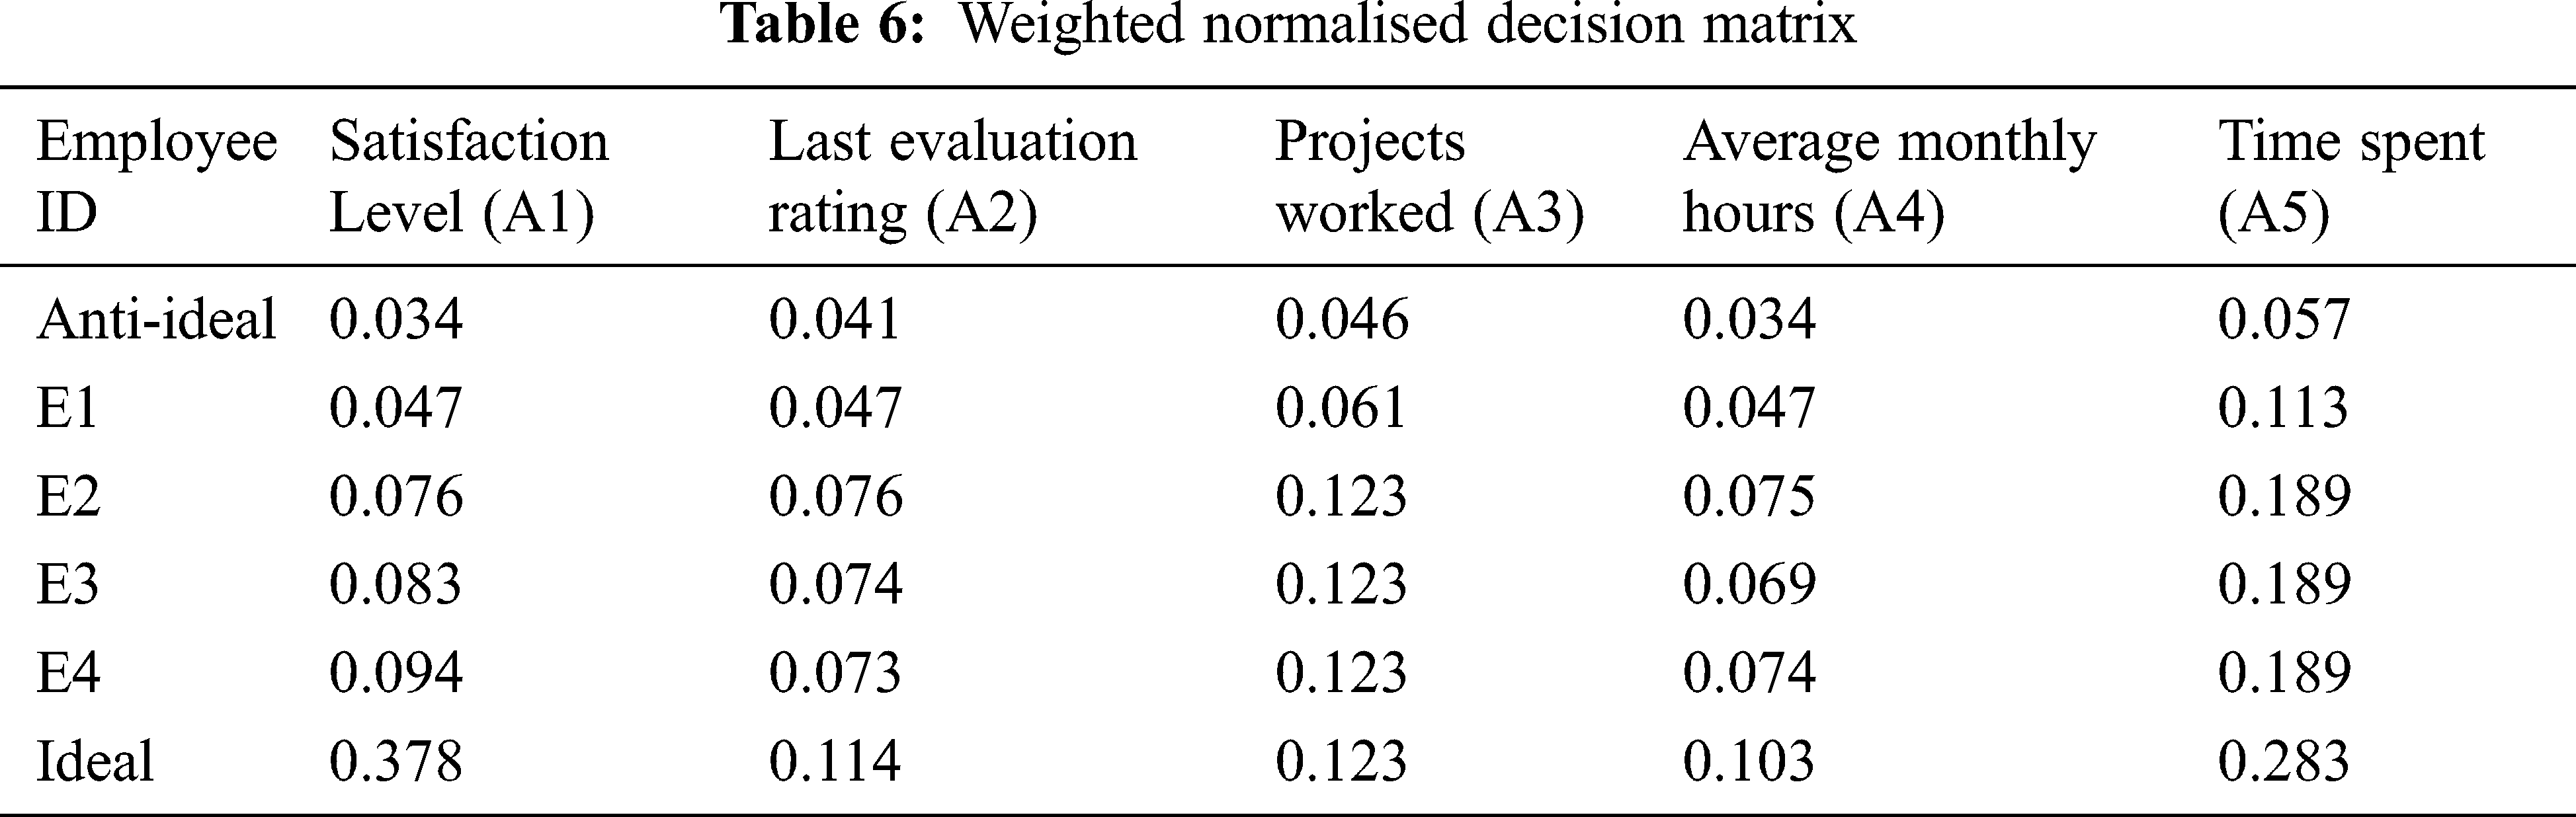
Step 4: Deriving the weighted matrix (V): We multiply the normalised decision matrix with weights of accomplishments derived using the CRITIC method to derive the weighted normalised decision. Below is the expression (8) used to derive the weighted matrix. Results are shown in Tab. 6.
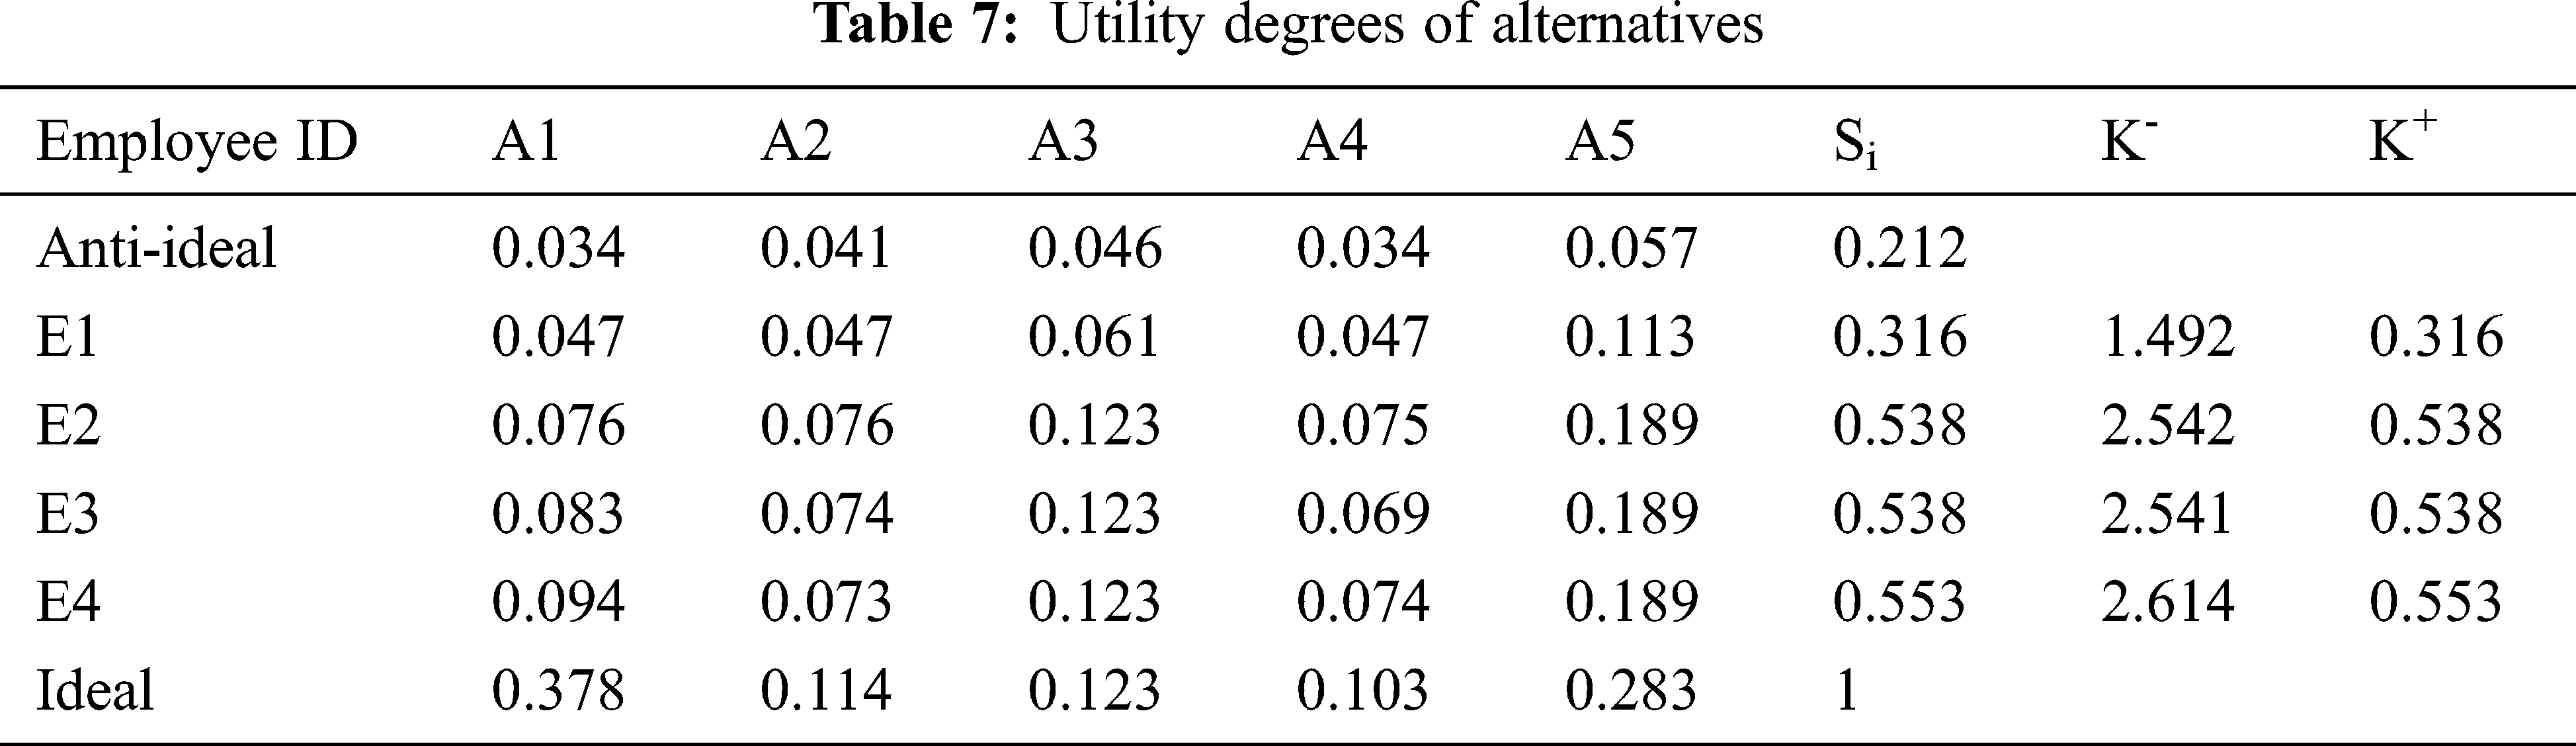
Step 5: Deriving utility degree of alternatives (Ki): This step involves deriving the utility degree of ideal and anti-ideal solutions using the below-mentioned expressions (9) and (10):
In the first step, all values are summarised to get Si values for alternatives, and then K+ and K− are derived, as shown in Tab. 7.
Step 6: Determining the utility function of alternatives f(Ki): This step involves calculating utility function using expression (12).
Step 7: Ranking of alternatives: Basis on final utility functions, we rank the alternatives.
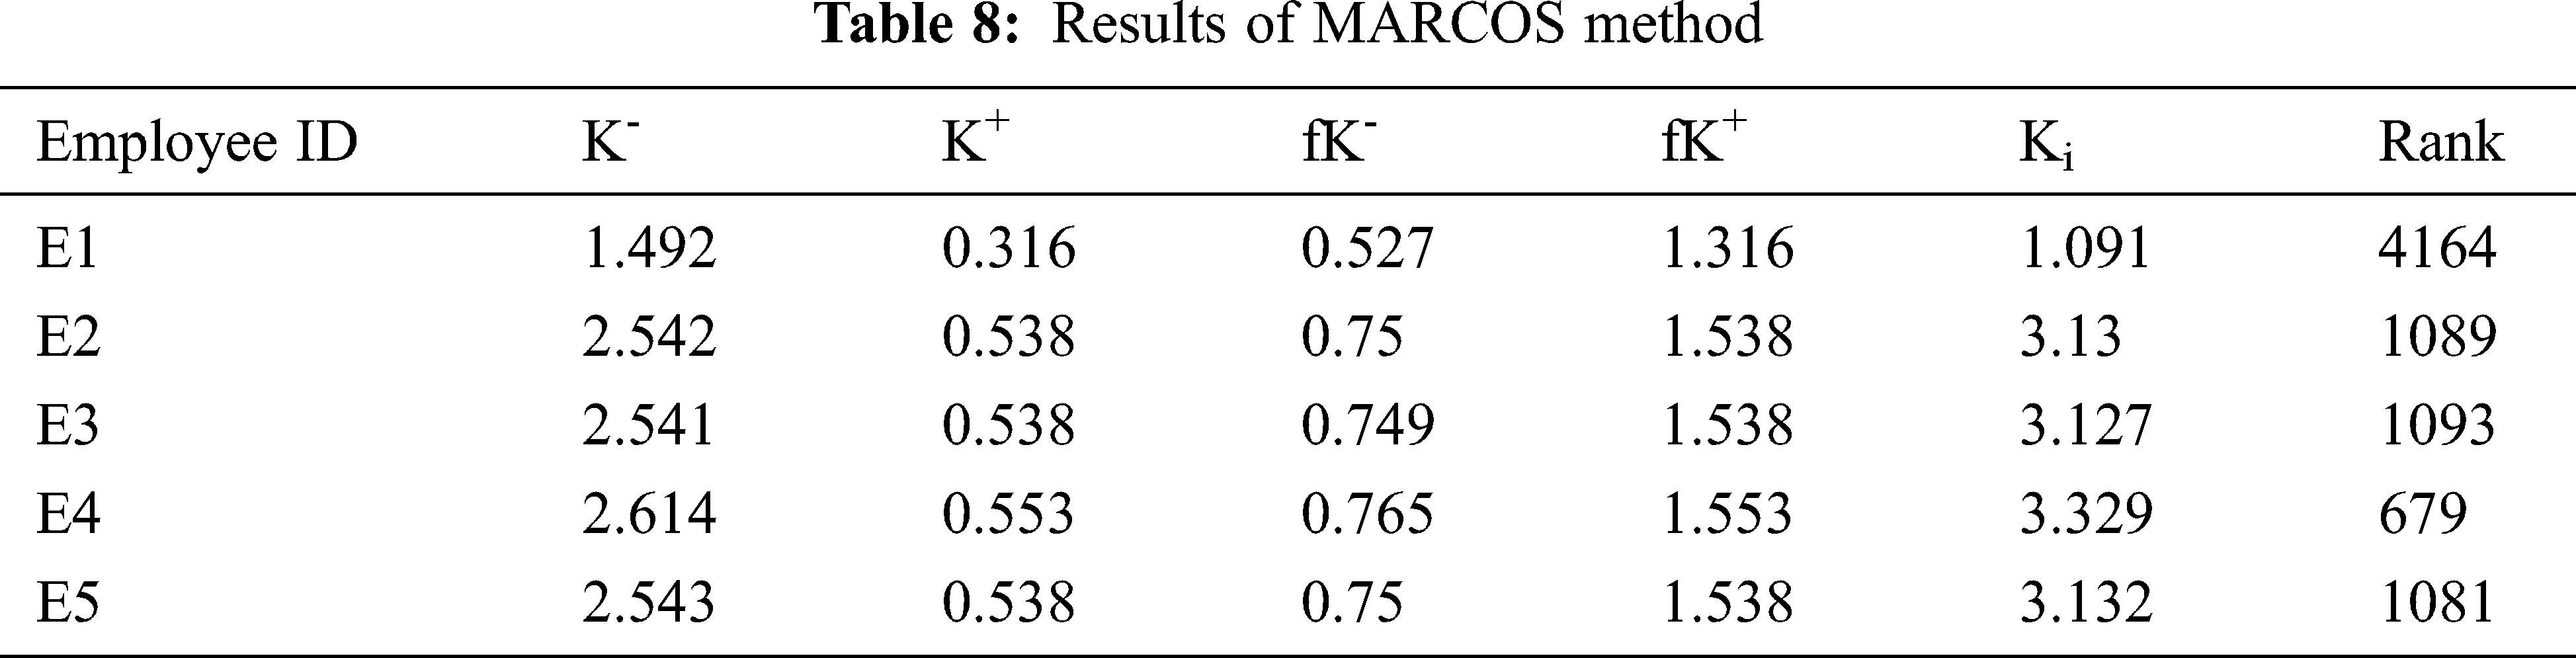
Based on the ranking of employees derived using accomplishments, categorising employees into Ardent, Behavioural, and distraught categories are shown in Tab. 9.
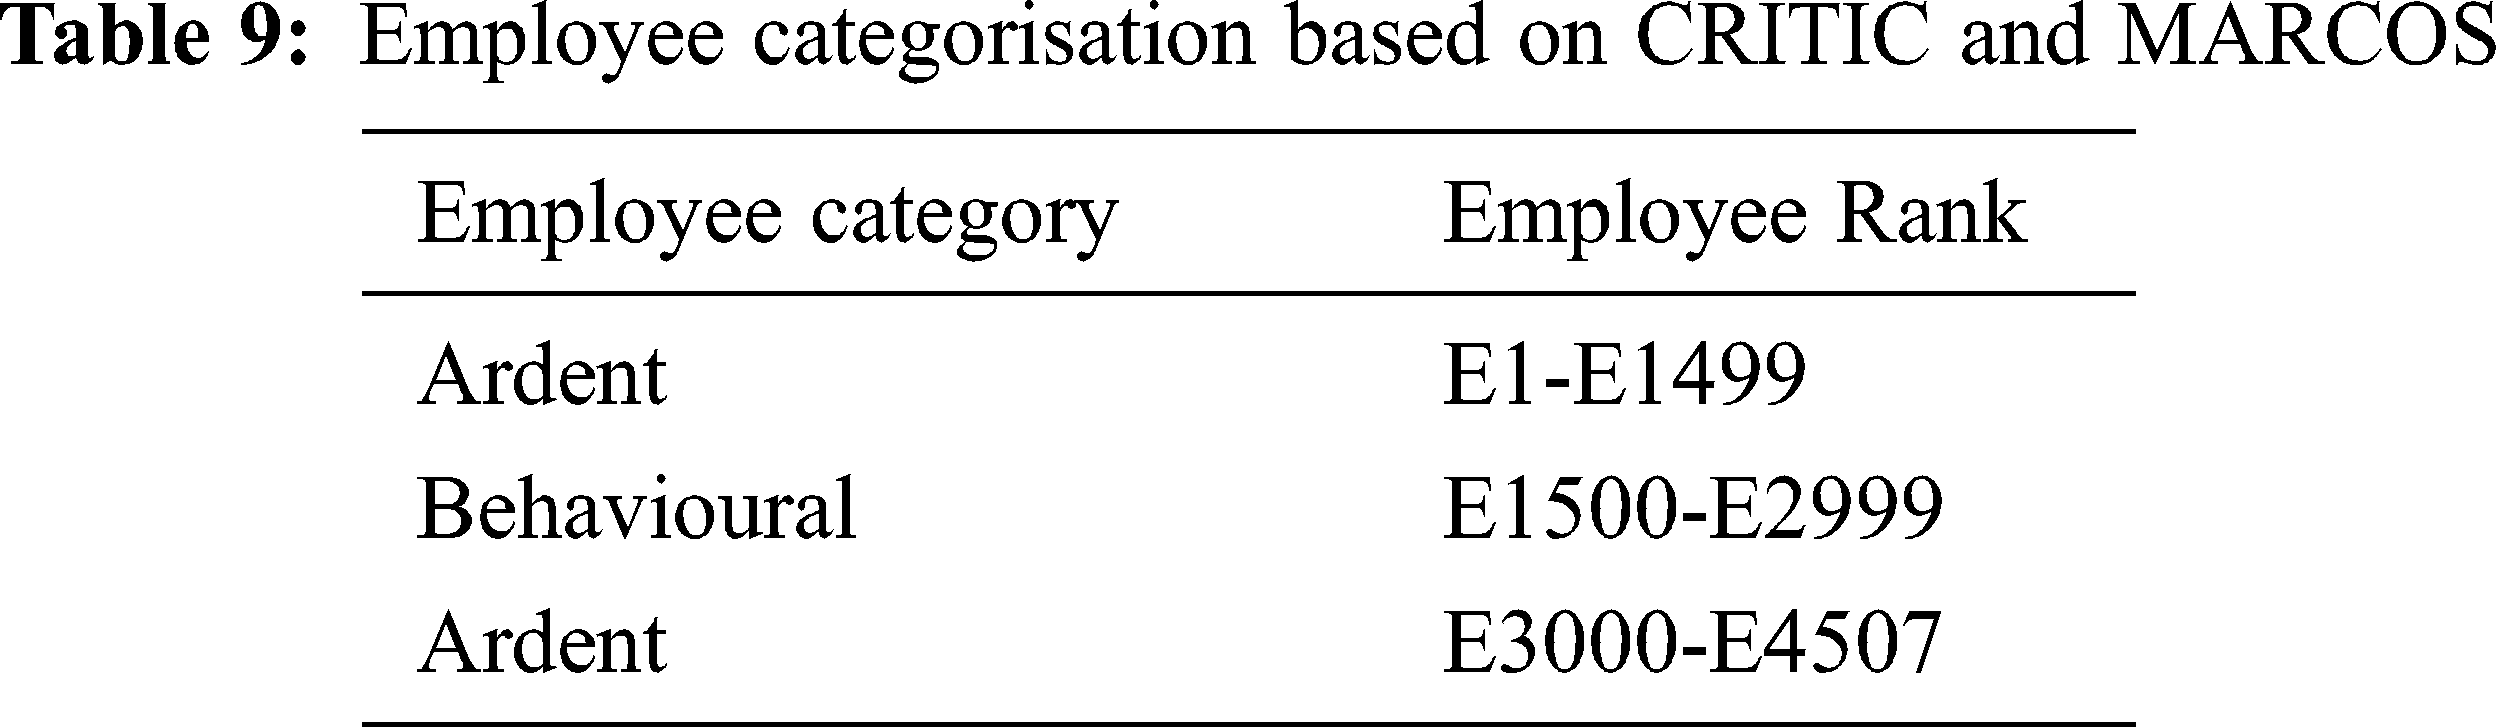
With the positive accomplishment, we mean larger the accomplishment value, better suitability for organisation and vice versa for negative accomplishment. So, for example, higher job satisfaction, higher the number of projects an employee has worked on; will be more valuable for the organisation.
3.3 Prediction of Employee Churn
To evaluate the proposed approach, we have used the trial IBM SPSS Predictive Modeler version 18.2.1. Human resource data has a combination of categorical and continuous data making supervised machine learning feasible to be implemented. We divided the data into an 80:20 ratio wherein 80 percent of trained data is used to test 20 percent data. The performance of classification models is measured using a confusion matrix. It compares the actual values with the predicted values derived by the machine learning model. This matrix gives a holistic view of the model performance and errors it is making. There exist four scenarios that can be explained with this model, they are:
True Positive (TP): The actual value is ‘Yes’ and the anticipated value is also ‘Yes’.
True Negative (TN): The actual value is ‘No’, and the anticipated value is also ‘No’
False Negative (FN): The actual value is ‘Yes’, the anticipated value says ‘No’.
False Positive (FP): The actual value is ‘No’, the anticipated value says ‘Yes’.
Below mentioned calculations can be performed using a confusion matrix; they are:
Accuracy (ACC): It defines how often the model correctly predicts the output. It is the ratio of a number of correct anticipated values to the total quantity of anticipations by the model.
Precision (PC): It identifies how many correctly predicted values turned out to be positive and calculated,
Recall (RC): It calculates the number of actual positive values are predicted corrected by the model and calculated as,
Matthew's Correlation Coefficient (MCC): Accuracy cannot be considered a reliable measure when the dataset is imbalanced as it provides an over-optimistic approximation of the model [45]. To overcome this limitation, MCC is used. It is a standard performance measurement for ML with extension to the multiclass case. MCC is more reliable for prediction results and produces high outcomes in all confusion matrix classes, i.e., true positives, true negative, false negatives and false positives.
The MCC range interval is between −1 to + 1, where −1 signifies perfect misclassification, and + 1 signifies seamless classification, and 0 is the expected value for the coin-tossing classification. The results of all employees and categorised employees concerning the ACC, RC, PC and Matthew's Correlation Coefficient (MCC) are summarised in the below-given Tab. 10.
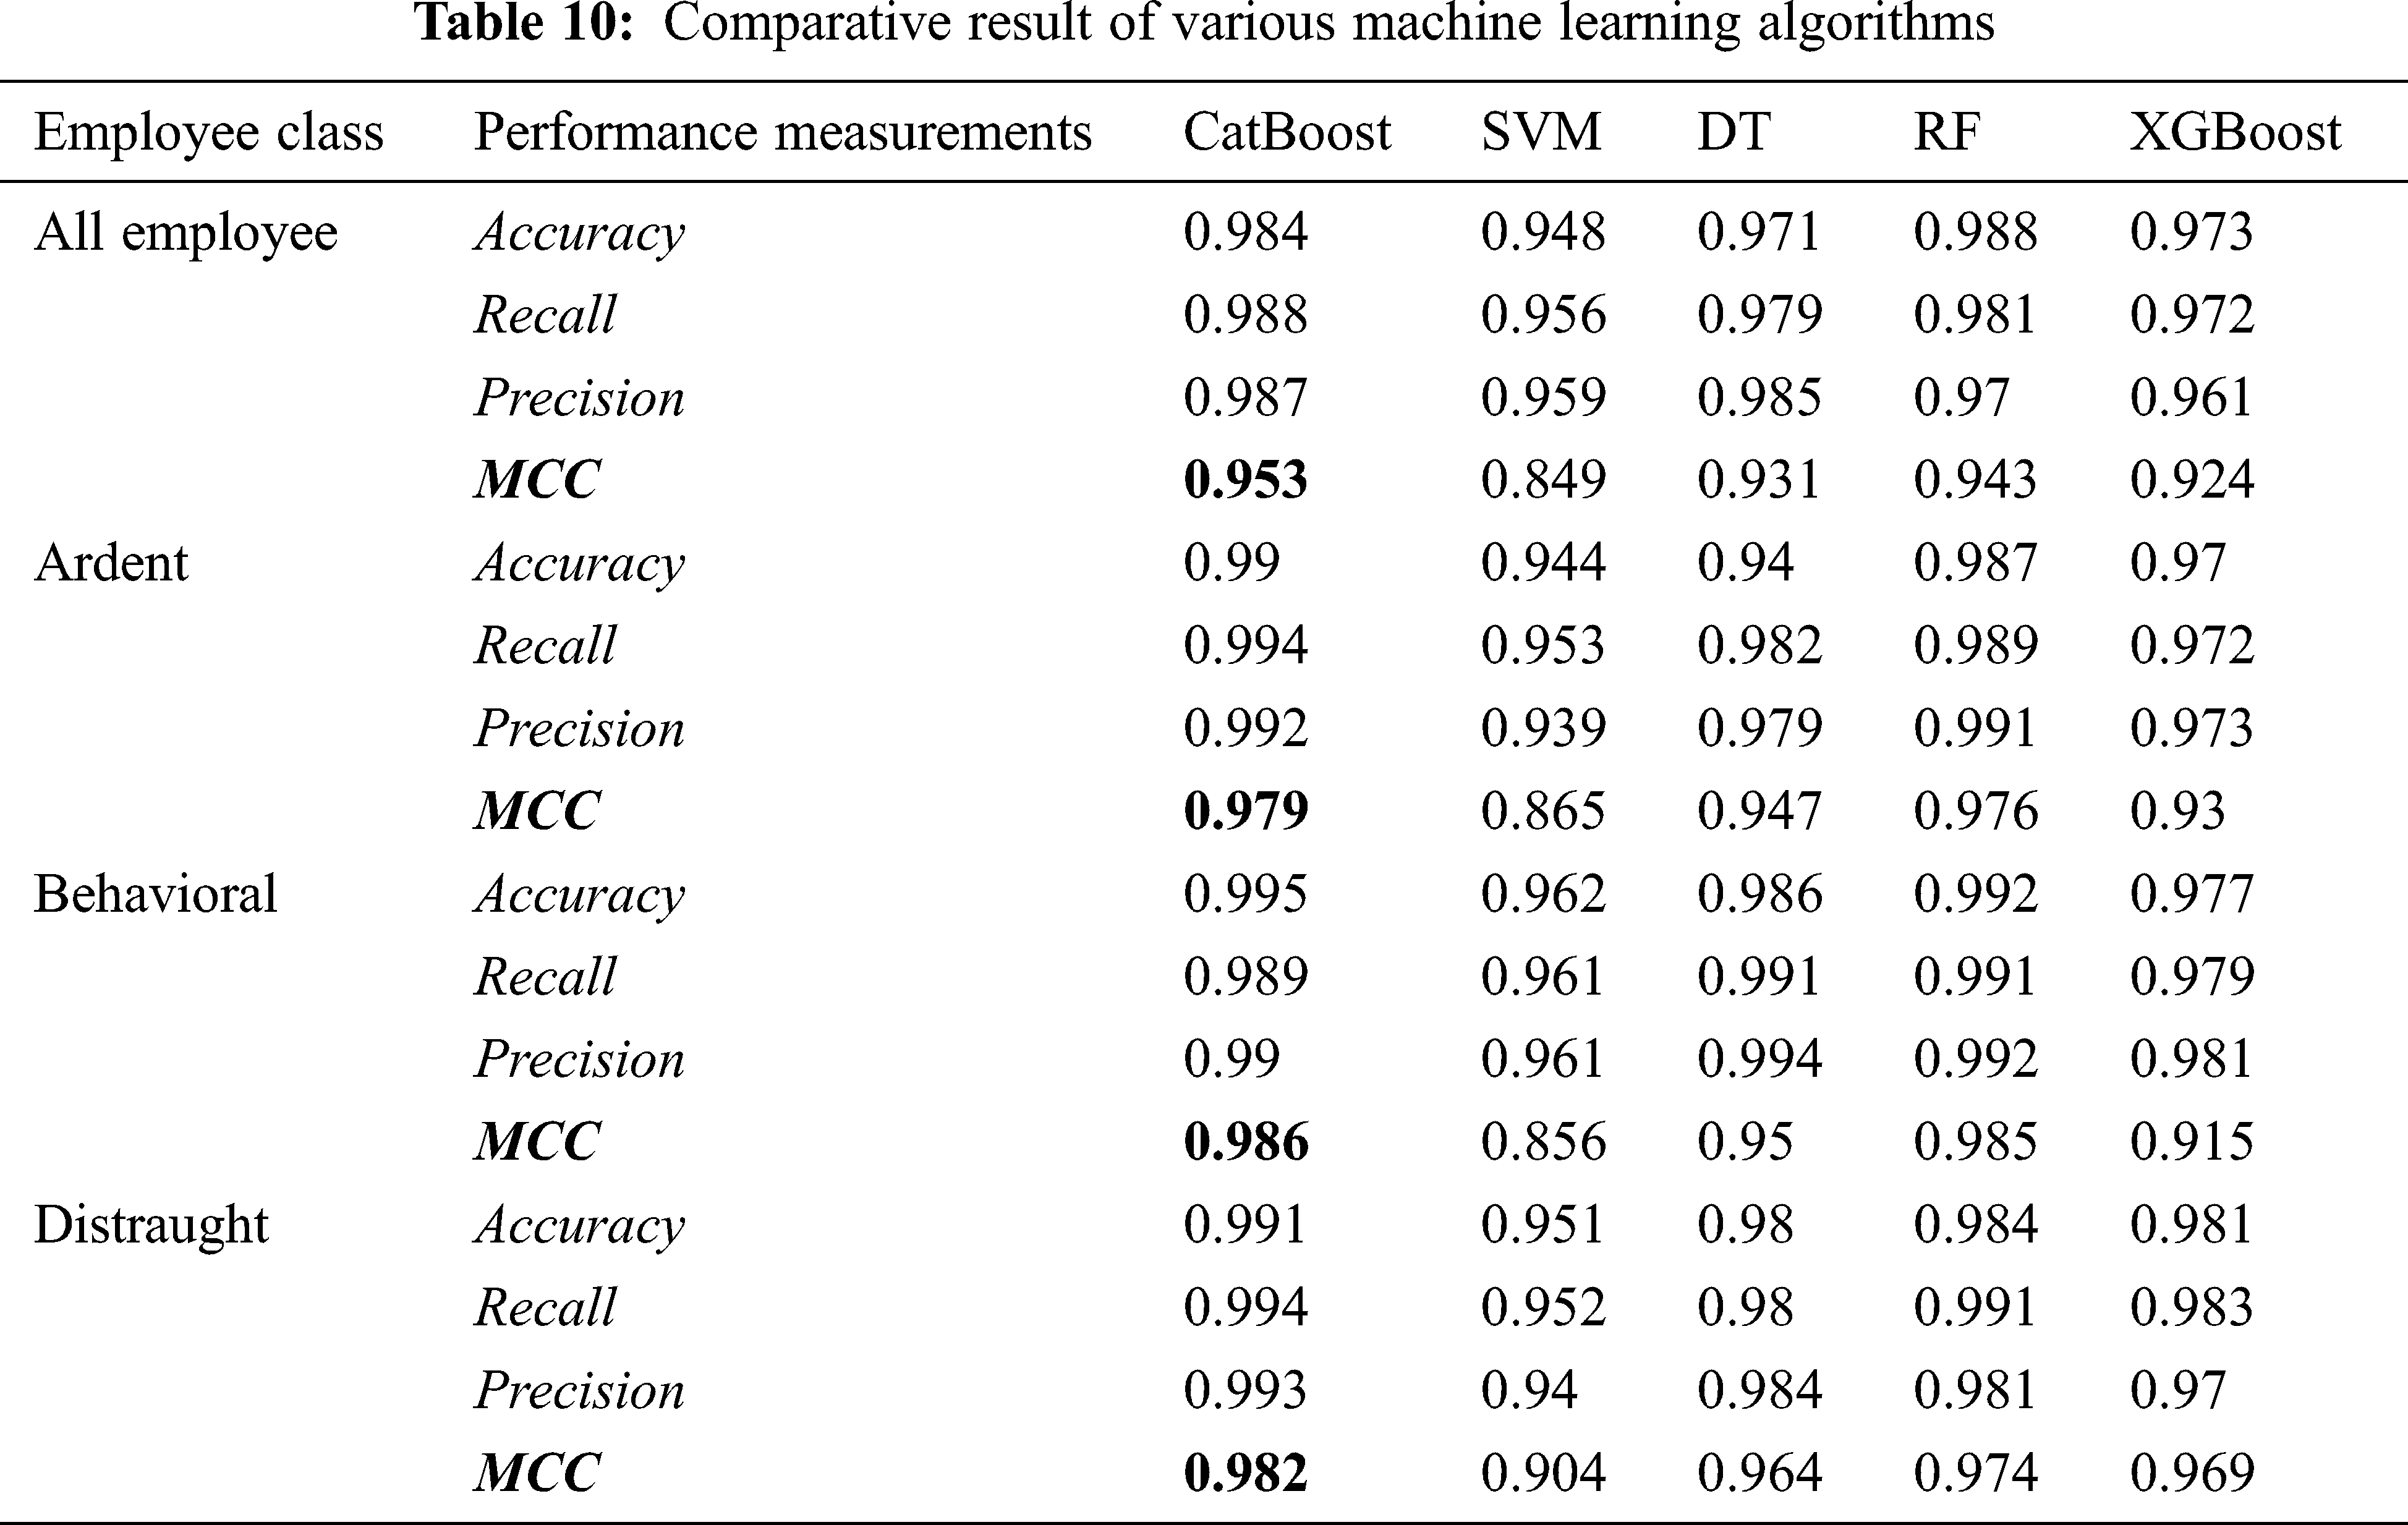
Based on the comparative results of five tested ML algorithms, the CatBoost algorithm has shown the best effect concerning Matthew's Correlation Coefficient. Also, accuracy cannot be considered as the only parameter to check the reliability of a model. MCC is a binary classification rate that derives a high score; if the binary predictor predicts the majority of correct positive and negative data illustrations. Therefore, MCC produces more informative and reliable results than accuracy [46].
Fig. 4 shows that the MCC value for all employees is less than category-wise prediction using supervised machine learning, demonstrating the effectiveness of the study. Furthermore, the proposed approach performs better than using the original dataset without categorising employees using a supervised ML algorithm.

Figure 4: Graphical representation of MCC using the proposed approach
Not all employees are valued based on their involvement and contribution to the organisation. Hence it is not recommended for organisations to hold retention policy the same as compared to valuable employees. Employee categorisation differentiates and identifies the valuable ones. As per the Pareto principle, 80 per cent of profits are produced by 20 per cent of employees. Differentiating churn thus is a vital research need. Also, retaining all employees may not be equally important for the organisation. Henceforth, class-wise categorisation of employees is essential. One way of categorising employees is based on accomplishments for different types of organisations. For example, a restaurant may have service rating and customer feedback as accomplishments; employees can be evaluated.
To fulfil this purpose, we propose an approach (Fig. 2) that purposes at categorising the employees as per their productivity concerning accomplishments. In this study, we use various employee accomplishments, like satisfaction level, last evaluation, the number of projects worked till date, last evaluation and time spent on decision-making. After deriving weights of different accomplishments using CRITIC. Next, MARCOS categorises the employees into different categories, i.e., Ardent, Behavioural, and Distraught. With the ardent category, we refer to those who are more engaged and productive in the organisation. Likewise, the behavioural and distraught employees are lesser and least engaged and productive, respectively. For experimentation, the original and categorised dataset is divided into training and testing datasets in 80:20 ratio. Using performance measurements, we used various ML algorithms to train and test datasets to evaluate the model's performance. The analysis of employees without categorisation and categorised employees separately for assessing the reasons for quitting the job is shown in Fig. 5.

Figure 5: Graphical representation of category-wise reasons of employee attrition
The primary reason for quitting the ardent employee category is satisfaction level; however, for behavioral and distraught employee class, projects worked on feature has the highest correlation with the target attribute ‘attrition’. However, the difference between the top three features for distraught category employees is 2 percent. As for all employees, the satisfaction level is feature resulting in employee churn followed by projects worked on. Fig. 4 clearly states that satisfaction level cannot be considered as feature responsible for employee churn. For each class, the major contributing factor for employee churn is different; employee categorisation can help organisations frame more cost-effective and efficient retention policies to reduce employee churn rate. EC prediction is more accurate by categorising the employees as compared to churn analysis without categorisation as shown in Tab. 10.
This paper proposed an MCDM and machine learning based approach for the EC issue denoted as Employee Churn and Prediction approach. Data mining has made enabled businesses to take critical and complex decisions easily [47]. Based on experimental results, it is clear that our proposed model has provided better results; ACC, RC, PC and MCC value is higher for the categorised dataset than the prediction of all employee datasets. The primary reason for churn for ardent, behavioural and distraught category employees has been found as satisfaction level, and a number of projects worked on respectively. Since the factors are different for different category employees, a retention policy can prove more effective for the organisation. Less work is done in the EC field using human resource analytics than customer churn and requires focus from academicians.
Also, high-end execution of human resource analytics has not been achieved by organisations either. The current market scenario demands HR function to move beyond mere reporting to accurate prediction. Despite its enormous potential, HR Analytics is still poorly integrated and practised by business owners and academicians outside of HR innovators, or in high-risk associate areas such as defence and financial services, where such activities are frequently shrouded in commercial secrecy. To increase productivity and growth, it is now critical to focus not only on descriptive analysis but also on prescriptive modelling. HR analytics is a hot issue right now, and it's generating a lot of buzz, but it has the potential to transform HR in the future. Studies show that the HR field is in the midst of sea change. It is the right time for HR leaders to start anticipating business results by improving the performance system, which includes lowering employee churn and increasing employee engagement.
Unlike any other research, this paper also has certain limitations. The proposed approach was validated using the secondary dataset available on the Kaggle website. Therefore, the CatBoost algorithm cannot be generalised as the best algorithm to show better results; however, it depends on the dataset and its attributes.
Our proposed model can be used in organisations with high employee churn such as retail, software, telecommunications; a slight improvement in accuracy of the model can contribute noteworthy monetary advantages. Also, the prediction model can be used on real-time data to generate solutions for effective performance.
Funding Statement: The authors would like to thank for the support from Taif University Researchers Supporting Project number (TURSP-2020/73), Taif University, Taif, Saudi Arabia.
Conflicts of Interest: The authors declare that they have no conflicts of interest to report regarding the present study.
1. S. Harrison and P. A. Gordon, “Misconceptions of employee turnover: Evidence-based information for the retail grocery industry,” Journal of Business & Economics Research (JBER), vol. 12, no. 2, pp. 145–152, 2014. [Google Scholar]
2. E. Wang, N. Alp, J. Shi, C. Wang, X. Zhang et al., “Multi-criteria building energy performance benchmarking through variable clustering based compromise TOPSIS with objective entropy weighting,” Energy, vol. 125, pp. 197–210, 2017. [Google Scholar]
3. J. I. Hancock, D. G. Allen, F. A. Bosco, K. R. McDaniel and C. A. Pierce, “Meta-analytic review of employee turnover as a predictor of firm performance,” Journal of Management, vol. 39, no. 3, pp. 573–603, 2013. [Google Scholar]
4. K. Tarnowska, Z. Ras and L. Daniel, Recommender System for Improving Customer Loyalty, 2020. [Google Scholar]
5. M. Khodabakhsh, M. Kahani and E. Bagheri, “Predicting future personal life events on twitter via recurrent neural networks,” Journal of Intelligent Information Systems, vol. 54, no. 1, pp. 101–127, 2020. [Google Scholar]
6. J. Xiao, X. Zhu, C. Huang, X. Yang, F. Wen et al., “A new approach for stock price analysis and prediction based on SSA and SVM,” International Journal of Information Technology & Decision Making, vol. 18, no. 1, pp. 287–310, 2019. [Google Scholar]
7. Q. N. Naveed, A. M. Aseere, A. H. Muhammad, S. Islam, M. R. N. Qureshi et al., “Evaluating and ranking mobile learning factors using a multi-criterion decision-making (MCDM) approach,” Intelligent Automation & Soft Computing, vol. 29, no. 1, pp. 111–129, 2021. [Google Scholar]
8. M. Hassouna, A. Tarhini, T. Elyas and M. S. AbouTrab, “Customer churn in mobile markets a comparison of techniques,” International Business Research, vol. 8, no. 6, pp. 224–237, 2016. [Google Scholar]
9. L. Rook, A. Sabic and M. Zanker, “Engagement in proactive recommendations,” Journal of Intelligent Information Systems, vol. 54, no. 1, pp. 79–100, 2020. [Google Scholar]
10. T. W. Lee, P. W. Hom, M. B. Eberly, J. Li and T. R. Mitchell, “On the next decade of research in voluntary employee turnover,” Academy of Management Perspectives, vol. 31, no. 3, pp. 201–221, 2017. [Google Scholar]
11. B. Sainju, C. Hartwell and J. Edwards, “Job satisfaction and employee turnover determinants in fortune 50 companies: Insights from employee reviews from indeed. Com,” Decision Support Systems, vol. 148, pp. 113582, 2021. [Google Scholar]
12. M. N. Nabi, A. A. T. Ahmed and M. S. Rahman, “The empirical study on human resource management practices with special reference to job satisfaction and employee turnover at investment corporation of Bangladesh,” Human Resource Management Research, vol. 7, no. 1, pp. 54–64, 2017. [Google Scholar]
13. A. Frederiksen, “Job satisfaction and employee turnover: A firm-level perspective,” German Journal of Human Resource Management, vol. 31, no. 2, pp. 132–161, 2017. [Google Scholar]
14. M. Ekhsan, “The influence job satisfaction and organisational commitment on employee turnover intention” Journal of Business, Management,” & Accounting, vol. 1, no. 1, pp. 48–55, 2019. [Google Scholar]
15. D. K. Srivastava and P. K. Tiwari, “An analysis report to reduce the employee attrition within organisations,” Journal of Discrete Mathematical Sciences and Cryptography, vol. 23, no. 2, pp. 337–348, 2020. [Google Scholar]
16. K. Bhuva and K. Srivastava, “Comparative study of the machine learning techniques for predicting the employee attrition,” International Journal of Research and Analytical Reviews (IRAR), vol. 5, no. 3, pp. 568–577, 2020. [Google Scholar]
17. S. Yadav, A. Jain and D. Singh, “Early prediction of employee attrition using data mining techniques,” in 2018 IEEE 8th Int. Advance Computing Conf. (IACC), Greater Noida, India, 2018, pp. 349–354, 2018. [Google Scholar]
18. P. R. Srivastava and P. Eachempati, “Intelligent employee retention system for attrition rate analysis and churn prediction: An ensemble machine learning and multi-criteria decision-making approach,” Journal of Global Information Management (JGIM), vol. 29, no. 6, pp. 1–29, 2021. [Google Scholar]
19. S. Jarupathirun and M. D. Gennaro, “Factors of work satisfaction and their influence on employee turnover in Bangkok, Thailand,” International Journal of Technology, vol. 9, no. 7, pp. 1460–1468, 2018. [Google Scholar]
20. Y. Fitria and M. R. Linda, “Perceived organizational support and work life balance on employee turnover intention,” Advances in Economics,” Business and Management Research, vol. 65, pp. 503–506, 2018. [Google Scholar]
21. B. Ju and J. Li, “Exploring the impact of training, job tenure, and education-job and skills-job matches on employee turnover intention,” European Journal of Training and Development, vol. 43, no. ¾, pp. 214–231, 2019. [Google Scholar]
22. M. Fang, J. Su, J. Liu, Y. Long, R. He et al., “A model to predict employee turnover rate: observing a case study of Chinese enterprises,” IEEE Systems,” Man, and Cybernetics Magazine, vol. 4, no. 4, pp. 38–48, 2018. [Google Scholar]
23. W. D. N. S. M. Tennakoon and U. L. Herat, “Perceived supervisor support and employee turnover intention: the moderating effect of employment tenure,” Wayamba Journal of Management, vol. 8, no. 1, pp. 14–26, 2017. [Google Scholar]
24. A. K. M. Masum, L. S. Beh, M. A. K. Azad and K. Hoque, “Intelligent human resource information system (i-HRISA holistic decision support framework for HR excellence,” International Arab Journal of Information Technology, vol. 15, no. 1, pp. 121–130, 2018. [Google Scholar]
25. N. Jain, A. Tomar, and P. K. Jana, “A novel scheme for employee churn problem using multi-attribute decision making approach and machine learning,” Journal of Intelligent Information Systems, vol. 56, no. 2, pp. 279–302, 2021. [Google Scholar]
26. J. M. Kirimi and C. A. Moturi, “Application of data mining classification in employee performance prediction,” International Journal of Computer Applications, vol. 146, no. 7, pp. 28–35, 2016. [Google Scholar]
27. K. Dogruyol. and B. Sekeroglu, “Absenteeism prediction: A comparative study using machine learning models,” in 10th Int. Conf. on Theory and Application of Soft Computing, Computing with Words and Perceptions - ICSCCW-2019, Switzerland, pp. 728–734, 2019. [Google Scholar]
28. S. N. Mishra, D. R. Lama and Y. Pal, “Human resource predictive analytics (HRPA) for HR management in organisations,” International Journal of Scientific & Technology Research, vol. 5, no. 5, pp. 33–35, 2016. [Google Scholar]
29. J. C. Sesil, “Value creation and advanced analytics,” in Applying Advanced Analytics to HR Management Decisions, United States of America: Pearson, pp. 72–73, 2014. [Google Scholar]
30. M. Y. Santos, C. Costa, J. Galvão, C. Andrade, O. Pastor et al., “Enhancing big data warehousing for efficient, integrated and advanced analytics,” in Int. Conf. on Advanced Information Systems Engineering, Rome, Italy, 2019, pp. 215–226. [Google Scholar]
31. S. H. Dolatabadi and F. Keynia, “Designing of customer and employee churn prediction model based on data mining method and neural predictor,” in 2017 2nd Int. Conf. on Computer and Communication Systems (ICCCS), Krakow, Poland, pp. 74–77, 2017. [Google Scholar]
32. N. Kalanat and E. Khanjari, “Action extraction from social networks,” Journal of Intelligent Information Systems, vol. 54, no. 2, pp. 317–339, 2020. [Google Scholar]
33. C. F. Chien and L. F. Chen, “Data mining to improve personnel selection and enhance human capital: A case study in high-technology industry,” Expert Systems with Applications, vol. 34, no. 1, pp. 280–290, 2008. [Google Scholar]
34. P. W. Hom, T. W. Lee, J. D. Shaw and J. P. Hausknecht, “One hundred years of employee turnover theory and research,” Journal of Applied Psychology, vol. 102, no. 3, pp. 530–545, 2017. [Google Scholar]
35. R. S. Sexton, S. McMurtrey, J. O. Michalopoulos and A. M. Smith, “Employee turnover: A neural network solution,” Computers & Operations Research, vol. 32, no. 10, pp. 2635–2651, 2005. [Google Scholar]
36. H. Jantan, A. R. Hamdan and Z. A. Othman, “Towards applying data mining techniques for talent managements,” in 2009 Int. Conf. on Computer Engineering and Applications, IPCSIT, Singapore, pp. 476–481, 2011. [Google Scholar]
37. S. N. Khera and Divya, “Predictive modelling of employee turnover in Indian IT industry using machine learning techniques,” Vision: The Journal of Business Perspective, vol. 23, no. 1, pp. 12–21, 2019. [Google Scholar]
38. V. V. Saradhi and G. K. Palshikar, “Employee churn prediction,” Expert Systems with Applications, vol. 38, no. 3, pp. 1999–2006, 2011. [Google Scholar]
39. X. Gao, J. Wen and C. Zhang, “An improved random forest algorithm for predicting employee turnover,” Mathematical Problems in Engineering, vol. 2019, pp. 1–12, 2019. [Google Scholar]
40. A. D. Ekawati, “Predictive analytics in employee churn: A systematic literature review,” Journal of Management Information and Decision Sciences, vol. 22, no. 4, pp. 387–397, 2019. [Google Scholar]
41. S. H. Dolatabadi and F. Keynia, “Designing of customer and employee churn prediction model based on data mining method and neural predictor,” in 2017 2nd Int. Conf. on Computer and Communication Systems (ICCCS), Krakow, Poland, pp. 74–77, 2017. [Google Scholar]
42. I. O. Yiğit and H. Shourabizadeh, “An approach for predicting employee churn by using data mining,” in 2017 Int. Artificial Intelligence and Data Processing Symposium (IDAP), Malatya, Turkey, pp. 1–4, 2017. [Google Scholar]
43. R. Punnoose and P. Ajit, “Prediction of employee turnover in organisations using machine learning algorithms,” International Journal of Advanced Research in Artificial Intelligence, vol. 5, no. 9, pp. 22–26, 2016. [Google Scholar]
44. D. Diakoulaki, G. Mavrotas, and L. Papayannakis, “Determining objective weights in multiple criteria problems: the critic method,” Computers & Operations Research, vol. 22, no. 7, pp. 763–770, 1995. [Google Scholar]
45. D. Chicco and G. Jurman, “The advantages of the matthews correlation coefficient (MCC) over F1 score and accuracy in binary classification evaluation,” BMC Genomics, vol. 21, no. 6, pp. 1–13, 2020. [Google Scholar]
46. J. Akosa, “Predictive accuracy: A misleading performance measure for highly imbalanced data,” in Proc. of the SAS Global Forum, Orlando, Florida, pp. 1–12, 2017. [Google Scholar]
47. N. A. Mahoto, R. Iftikhar, A. Shaikh, Y. Asiri, A. Alghamdi et al., “An intelligent business model for product price prediction using machine learning approach,” Intelligent Automation & Soft Computing, vol. 30, no. 1, pp. 147–159, 2021. [Google Scholar]
 | This work is licensed under a Creative Commons Attribution 4.0 International License, which permits unrestricted use, distribution, and reproduction in any medium, provided the original work is properly cited. |