DOI:10.32604/iasc.2022.021973
| Intelligent Automation & Soft Computing DOI:10.32604/iasc.2022.021973 | |
| Article |
Efficient Heuristic for Optimal MILP-LoRa Adaptive Resource Allocation for Aquaculture
1Department of ECE, PSG College of Technology, Coimbatore, 641004, Tamilnadu, India
2Dr. Jayalalithaa Fisheries University, Nagapattinam, 611002, Tamilnadu, India
*Corresponding Author: M. Iniyan Arasu. Email: iniyanarasunm@gmail.com
Received: 22 July 2021; Accepted: 09 September 2021
Abstract: LoRa is well-known for its extensive communication range, inexpensive efficiency, and reduced or less power consumption in end devices. End-device energy consumption in LoRa networks is ludicrous because some end-devices use massive dissemination variables to reach the remote doorway. Furthermore, the batteries in these end devices deplete very quickly, reducing network life significantly. To address this issue, an optimal mixed-integer linear programming long-range technique (OMILP-LoRa) was used in this study. The primary goal of this research is to enable adaptive resource allocation using the unique OMILP-LoRa protocol. The ACCURATE heuristic and the OMILP model for LoRaWAN resource allocation are presented in this work. The ACCURATE method was used to dynamically modify the spreading factor (SF) and carrier frequency (CF) configurations for every LoRaWAN IoT devices. The results shows the ACCURATE heuristic produces results that are related to the optimal obtained through the OMILP-LoRa device for channel use, increasing the placement of LoRaWAN, steps to prevent collisions, and enhancing the complete system. The suggested method’s performance includes a comparison of the proposed approach to different existing methods, including the ILP, LoRa, and MILP methods.
Keywords: Mixed-integer number linear program (MILP); resource allocation; long-range (LoRa); adaptable transmission
Fisheries are a key source of income for Indian coastal farmers. India is the third-largest user of aquaculture, particularly in low-power long-distance data acquisition and the move to collaborate on the LoRa (long-range) wireless sensor network [1,2]. The aquaculture architecture enables connectivity to a variety of sensors, which transfer sensor data over yield terminals [3]. LoRa is a well-known communication technology that uses the real layer of the chirp spread spectrum (CSS), with the higher layer being OSI-based. Because the quality of service (QoS) is inadequate, the radio boundaries are changed [4]. To increase service quality in LoRa networks, a specific software-based computer algorithm adjusts the transmission factor and carrier frequency (CF) radio limits [5]. LoRa organization setup can be difficult, especially when considering the number of organization terminals, carrier frequency (CF), spreading factor (SF), bandwidth (BW), and coding rate (CR) [6]. This is adjusted at the gadget or potentially network level to optimize small and big network execution [7].
LoRa in IoT application availability controls fit into the customary ILP model. A serious integer linear programming (ILP) model for wireless sensor network (WSN) organization has been proposed, which illuminates security, availability issues of sensor sending and essentially reduces equipment costs [8]. Current ILP’s Disadvantages are it requires an excessive factor and time to calculate the results. The Adaptive Data Rate (ADR) program is a significant LoRaWAN feature. This enterprise aims to decrease energy utilization and increase productivity by adjusting the data rate for each end terminal on a LoRaWAN following the organizational financial plan [9]. Overhauling the ADR expands network execution since data parcels sent with various SFs can be symmetrically recovered at once, subsequently decreasing airflow time [10]. ADR is a component for controlling the uplink (UL) transmission boundaries of LoRa gadgets relying upon the association’s financial plan. The ADR process must occur at the last hub. A rise in the IoT rankings brings about service quality prerequisites, estimations, and usage approaches, which assess the compatibility and reliability of ADR programs [11]. We utilize multiple integer linear programming (MILP) improvement to make an optimal variation in SF and CF boundaries [12]. The LoRaWAN network is demonstrated in Fig. 1.
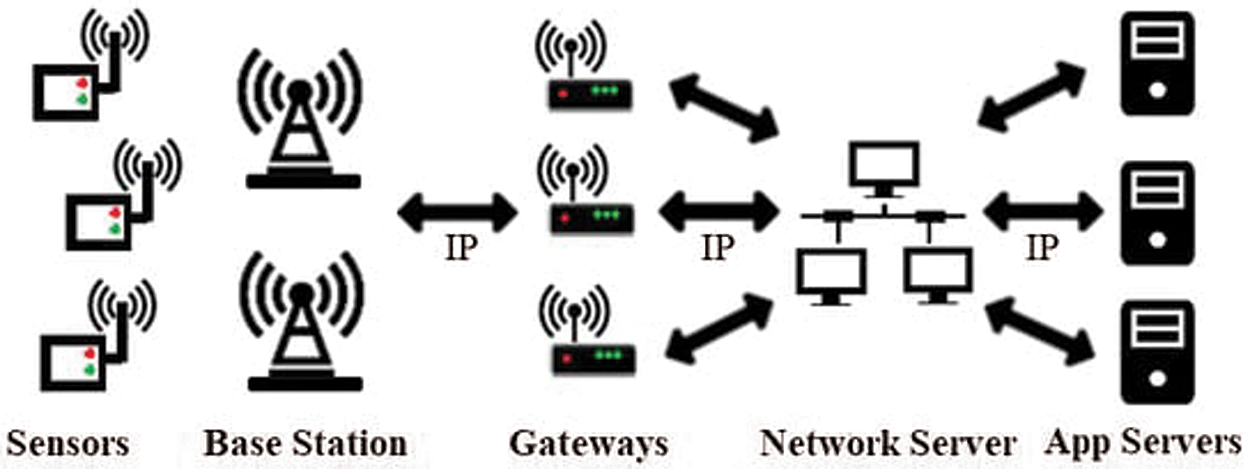
Figure 1: LoRaWAN network
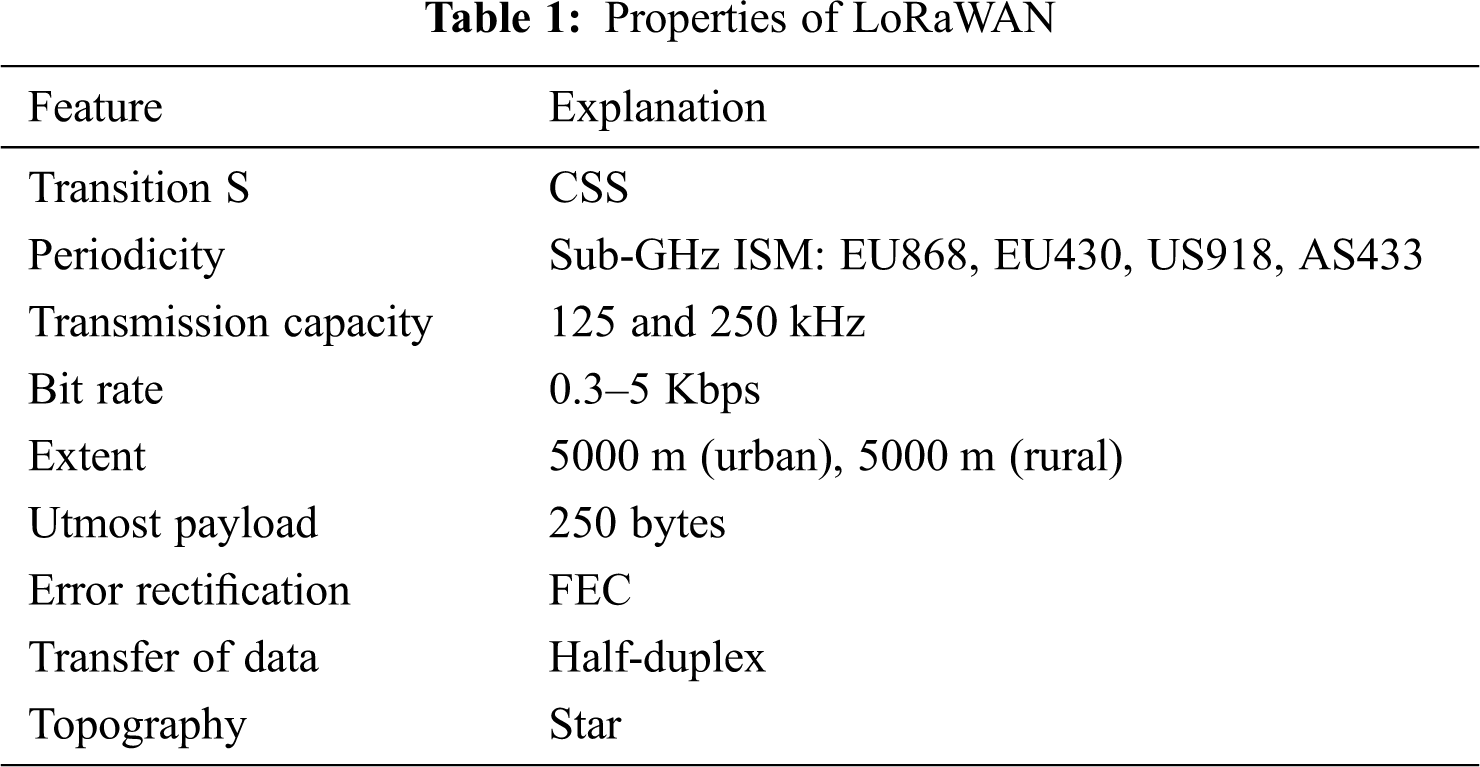
LoRaWAN offers stretched-out inclusion operating inside unlicensed and clean working frequency limits with ease, low force utilization, and flexible transmission rates. Lora doesn’t perform ceaseless observing and huge data loads [13]. This payload is limited to 100 bytes. MILP-LoRa was employed; MILP-LoRa is an innovative protocol [14]. This gadget must have the option to get to the Internet Protocol (IP) address relegated to them and simultaneously move data over the network. For MILP-LoRa displaying, MILP-LoRa functions as the passage and sensor terminals [15] and the characteristics of the LoRaWAN chirp spread spectrum, FEC (forward error correction) is shown in Tab. 1. In this particular situation, a cluster of passages in the network area helps to indicate an ideal way of dealing with improving utility execution and reducing upkeep costs [16].
Organization of paper: Section 2 contains a survey of existing methods and techniques. Section 3 discuss about the system model and also the application of the proposed method. Section four compares proposed methodology with current methodology and presents the result of proposed methodology. The conclusion part has been included in Section 5.
A significant amount of study has been conducted on various resource allocations for IoT applications. The present resource allocation mechanisms are listed below. Moraes et al. will investigate an effective examining LoRaWAN flexible resource allocation for IoT in 2020. An flexible conclusion for handling optimal LoRaWAN border and this study includes parameters to lower channel utilization and hence enhance the number of parcels sent [17]. Furthermore, to validate this approach, they compared it to an alternate heuristics-based strategy by separating MILP and results. MILP anticipated that the experimental results produced by the heuristic would be similar to those obtained by the heuristic.
Similarly, Fujdiak et al. (2018) examined the rating of a single-gate LoRaWAN network. This study includes four simulation tools for LoRaWAN innovation. Only one of the four instruments tested (Xirio) allows for explicit LoRa regulation and code rate, which largely determines coverage findings, therefore this result was highly accurate.
In addition, Eridani et al. will investigate monitoring systems in LoRa network architectures utilizing an intelligent gateway in the simple LoRa protocol in 2019. The Simple LoRa Protocol (SLP) is used in this study, together with a Raspberry Pi3b + as a Smart Gateway. The volume-based Dragino LoRa uses an 868 MHz 7 and Arduino UNO for the user. The design observation framework is mentioned in this publication. To get to a neighborhood, the system is created. Finally, the clever gateway demonstrated that it could conduct LoRa correspondence and watch data frameworks concurrently.
Moreover, in 2019, Zourmand et al. have developed the IoT utilizing LoRa technology. In this paper, the actual organization of the IoT framework utilizes LoRa innovation with the blend of Wi-Fi innovation. This paper presents the exhibition and the observed coverage region of the LoRa network in both indoor and outdoor conditions. An innovative configuration of LoRa boundaries, especially with SF and BW, is being studied in various places for the interior setup. Finally, the quality of the LoRa network doesn’t just rely upon the good ways of the gateway. The upsides of the LoRa network contrasted with other networks were a higher spreading factor and lower bandwidth setting that permitted a wide range of correspondence and higher clamor insusceptibility.
In 2019, Ngom et al. proposed a LoRa-based station for monitoring the water quality of a botanical garden pool. This paper presents a water quality observing framework through LoRa transmission. It was an easy foundation made with a distant station for continuous data assortment and a web stage for perception and abuse. The system has shown that it includes a danger appraisal algorithm for interfacing various sensors to survey the danger of water defilement.
Pakpahan et al. (2018) investigated a batik-waste water control system based on LoRa communication. In this paper, a Batik waste checking framework with LoRa is an instrument to screen batik waste dependent on the BML standard, utilizing the low capacity to accomplish a long-separation communication range. Checked boundaries incorporate pH level, temperature, and turbidity level. For the long-lasting function, it is necessary to screen water waste.
Similarly, in 2019, Firdaus et al. investigated characteristics of air measurement system-based IoT with LPWAN LoRa. This research employs IoT innovation to assess the current status of air quality levels such as temperature, air stickiness, CO, and CO2. The ATmega328P-AU is used as a regulator, the DHT22 sensor for temperature and air dampness, the MQ-7 sensor for CO gas, the MQ135 sensor for CO2 gas, LPWAN LoRa for data transmission connectivity, and Natures as a cloud service for storing data to be displayed on Android devices. Finally, the results of the tests revealed the standard error estimation of temperature, humidity, CO, and CO2. The sensor data outputs are subsequently saved in the cloud and shown on Android.
3 Flexible Resource Allocation of LoRaWAN
This portion discusses the optimal resource allocation based on MILP named OMILP-LoRa. Initially, the work expresses the functioning of the LoRa network and next to the OMILP-LoRa model to utilize the benchmark allocation. Finally, the optimized algorithm is employed to select radio framework based on power and distance of the signal.
The ability to modify the radio bounds is provided by effective resource allotment for LoRaWAN. In this sense, LoRaWAN establishes distinct radio-related constraints to provide a tradeoff between transmission range growth and reductions in delay, energy, and impedance. Each parcel can be assigned a different SF value, which can be defined as the ratio of image to laugh rate, with larger SF values used to convey a pocket that improves vulnerability and power expansion. Furthermore, SFs have a symmetrical layout, and it allows to withdraw and CF fixes the capacity which ranges from 137 to 1020 MHz in 61 Hz.
This study agreed that one gateway could untangle all sf and cf flags at the same time. Even though LoRaWAN provides a variety of potential results for orthogonalizing transmissions, effective material allotment for channel communication is a difficult work. As a result, the LoRaWAN thick suffers increased packet misery caused by impedance. By increasing channel usage and by reducing interference and collisions, a resource allocation with the change in SF and CF borders is obtained. Types of devices for LoRaWAN demonstration: IoT and Gateway (GW). IoT devices [18] classified to three types based on their utility: Type A, Type B, and Type C.
Only Type A devices are considered in this procedure. GW has a spherical service area A with a radio range Rj, a set number N of devices, and N are distributed evenly. Each IoT device has a unique identity, as well as a tuple T i = (u i, v i, w I with its geographical coordinates. The Euclidean distance (D i, GW j) is used to compute the length within a chosen IoT device I and G jW, where distance (D i, G jW)R j indicates that IoT device I is within the G jW coverage. Whole energy received (T (p, j)) by G jW from the IoT device, I is calculated by adding the device transmission power D i. tx to the antenna gain GL and removing the propagation loss L (p, i) is presented below,
Each device should have Distance measure values and to receive power, use the tuple L = (x i, y i, dist (D i, GW j), P (rx, j)). The device power received by a certain G jW (T (p, j)) is used to determine which is the minimum SF value required to allow transmission among a specific IoT device I and G jW, because it must receive a packet with receiver power T (p, j) greater than the sensitivity value for a given SF value. The sensitivity setting is defined as follows:
A LoRaWAN packet [19] is made up of both raw and inflated fragments. Non-inflated fragments describe the preface and the Start Frame Delimiter (SFD), whereas modulation defines payload and CRC. Time load
(Ld) is given as
Lp can be computed by adding preface size (Sp) and mandatory preamble and again it is multiplied with the symbol duration (ST). It is given by,
ST is calculated as shown in Eq. (5). Conclusion: upper SF needs longer ST, considering a constant bandwidth BW.
loadsize It refers to the size of the load is multiplied by
We calculated N number of load dependent on condition 8, where PL denotes packet size, IH denotes understood header, and DE denotes data rate enhancement. Particularly, IH is 0 if the header is enabled, and 1 in all other cases. Particular header reduces packet size with the help of predetermined CR, accepted verification, and Cyclic Redundancy Check (CRC), in absence of these characteristics the header will include these properties. If data rate enhancement DE is enabled, the DE value is set to 1.
To calculate the CR value is given by,
We prioritise the usage of SF with a greater no. of IoT devices to issue a compromise among amplifying channel use and decreasing impedance, deferral, and force utilisation. This judgement is essential because increasing SF causes longer transmission delays, which increases impact. Furthermore, because of the relationship between transmission rate and SF, the most minimal SF esteem (i.e., SF approaches 7) supports significantly more gadgets with lower blockage than other SFs. In this manner, we obtain ToA for each SF labelled as T (sf 7,) T (sf 8), T (sf 9), T (sf 10), T (sf 11), T (sf (12)) based on Eqs. (3) and (8), and sfk is calculated by dividing ToA. The sum of ToA for each SF (TTOA) is calculated as follows:
At first, we calculate the ratio between the ToA for each SF (
Afterward, we reversed the
Eq. (12) shows the ratio of IoT devices from LoRaWAN
As a result, we enable the SF esteem by ensuring that the SF esteem they select provides enough force to the packet collection at G-W. The key advantage of LoRa is its low bandwidth. Furthermore, it does not allow the protocol to be sent persistently, which is prohibited due to the frequency band’s principles. In this regard, LoRa is only suitable for brief and infrequent interactions.
• OMILP-LoRa intends to increase channel utilisation by reducing the impact of LoRaWAN by modifying SF and CF radio boundaries. Because OMILP-LoRa reflects the best SF and CF boundary designs, its results can be used as a benchmark for those obtained by other algorithms. The following variable is defined for optimal resource allocation:
• δi,sf,cf ∈ {0.1}: binary variable, where 1 indicates that the model chose IoT device I with spreading factor sfin the channel cf, and 0 otherwise;
•
• γ: Average transmission rate expressed in packets per second.
Based on the time required to send a frame and the average transmission rate, OMILP-LoRa seeks to use the LoRaWAN channel at the lowest possible cost, as indicated in Eq. (13). It is designed for the implementation to use frequency plan. This frequency plan uses 8 available channels for uplink transmission.
In this regard, OMILP-LoRa calculates the cost of channel by (T (sf k)), whereas the variable _(i, sf, cf) determines which SF (sf) and CF (cf) a certain IoT device will use. The restriction established by Eq. (15) ensures that the chosen device I have sufficient power to operate a given SF ((d, sf)), where each IoT device I compare each SF with the sensitivity levels. The constraint imposed in Eq. (15) assures whether materials are allocated to all devices properly The number of devices used are defined in Eq. (16). Atlast, channel allocation is done by the constraints established by Eqs. (17) and (18) on same SF channel.
Subject to:
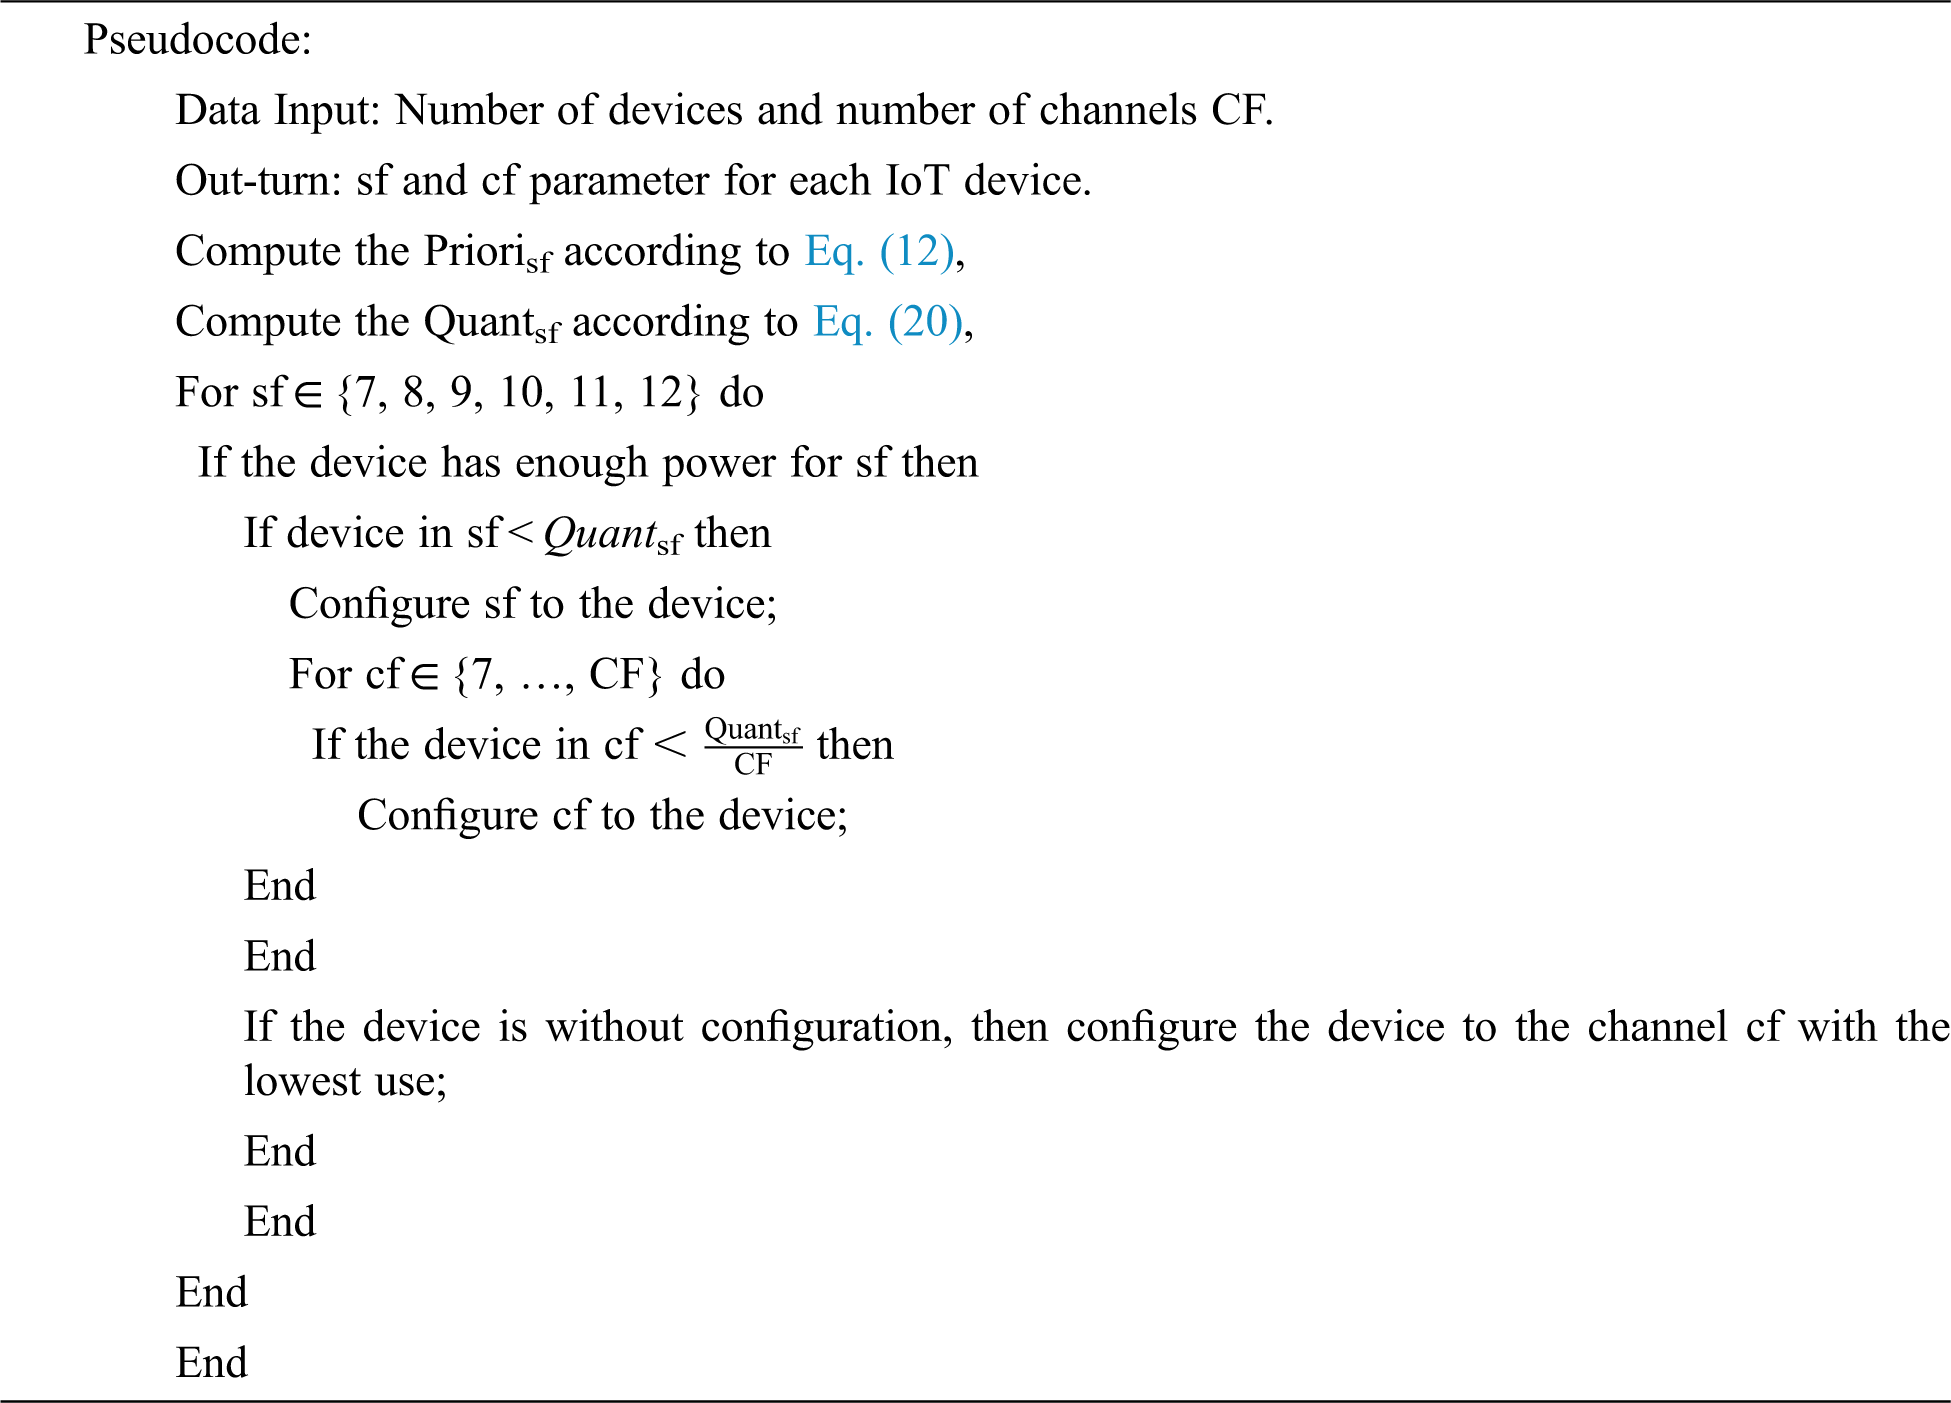
This section introduces the ACCURATE resource allocation heuristic, which modifies LoRaWAN radio boundaries to increase channel utilization with decreasing impedance. The ACCURATE heuristic determines the IoT devices N as well as the number of available frequency channels.
OMILP-LoRa is widely utilised in the aquaculture business. Monitoring and controlling are critical functions in aquaculture. This method not only checks the water quality regularly, but it also delivers a warning about the water quality as well as preventive steps. This methodology is made up of four modules: the power supply module, the sensor module, the gateway module, and the output module.
The overall framework of the approach indicated in Fig. 2.
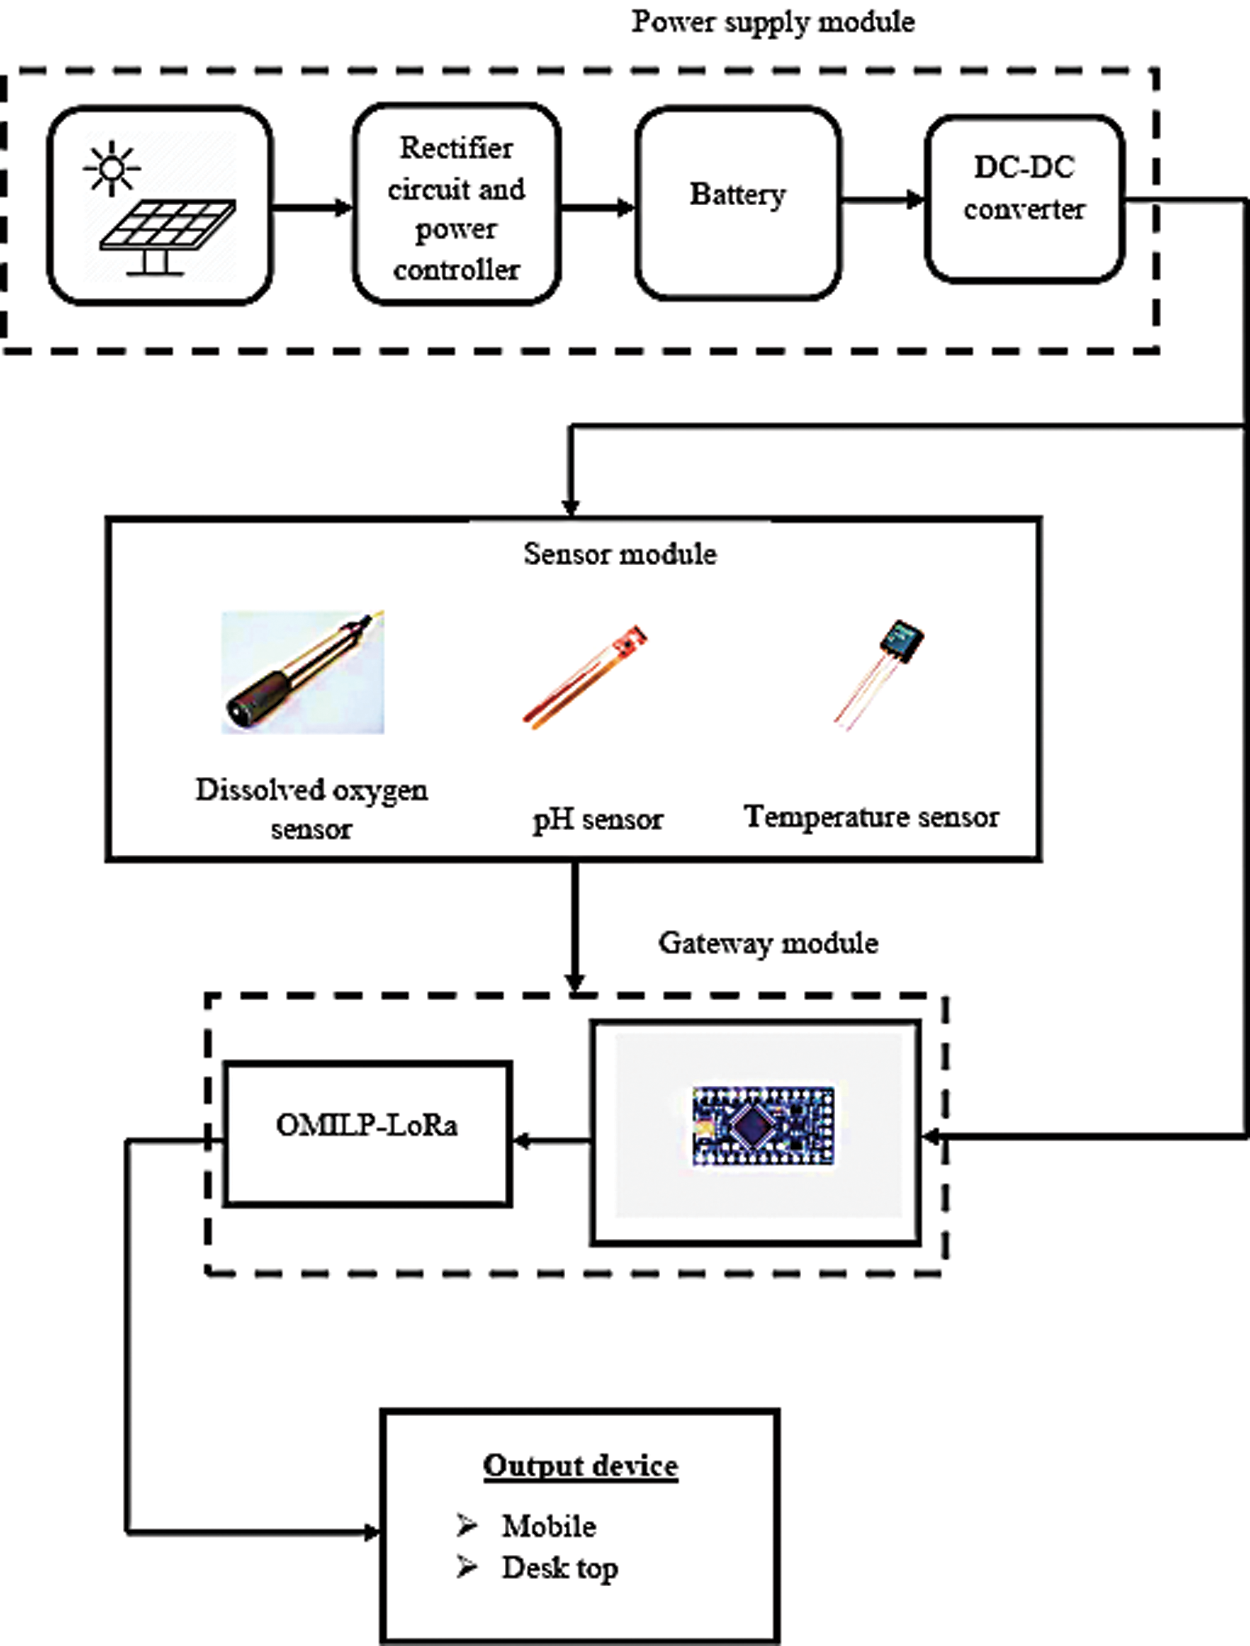
Figure 2: Overall diagram of the proposed method
First, the force flexibly module is utilised to turn on the control and the checking board. The solar panel, a rectifier circuit with a force regulator, a DC-DC converter, and a battery are all part of the power supply module, which stores and flexibly supplies the required capacity for the segments. Solar panels are devices that capture the sun’s rays and transform them into power. A solar panel is a collection of sun-powered (or photovoltaic) cells used to generate electricity via the photovoltaic effect. as a result of increasing natural pollution, the solar panel is an eco-accommodating force in the age framework. The minor variations in the sunlight-based board are a result of the occurrence of various radiation levels. This variation causes a fluctuation in current yield, which must be separated by the battery’s need. The force regulator maintains a constant voltage to charge the battery and so increases its life. The sensor module is described as follows:
Sensor module: The sensor module is the method’s second phase. This sensor module is used in aquaculture to detect aberrant water parameters. The sensor module is made up of three sensors: a pH sensor, a dissolved oxygen sensor, and a temperature sensor. The detailed description of the sensor module is given as,
A pH metre is scientific equipment that measures the sharpness or alkalinity of a fluid’s hydrogen-ion action, which is reported as pH. It is usually communicated in numbers ranging from 0 to 14. Worth 7 demonstrates objectivity. The pH value corresponds to the hydrogen-particle focal point or the negative circle of the hydrogen-particle response. The normal pH esteem range is 6.5 to 8.5.
An essential compound analysis approach (titration strategy), an electrochemical analysis technique (stomach terminal technique), and a photochemical analysis strategy can all be used to assess dissolved oxygen levels (fluorescence technique). The diaphragm cathode approach is the most common. Water at lower temperatures should have more mg/L of broken-down oxygen and a larger percentage of disintegrated oxygen, whereas hotter, filthy water should have less mg/L and a lower percentage of DO. Solid water should generally have oxygen values above 6.5–8 mg/L and between 80–120 percent.
These sensor modules are used to monitor water levels and transmit warning alerts. The sensitivity parameter is sent to the gateway modules after sensing the water level. When delivering the output modules, the gateway modules just transmit the state of the water levels. We used the Arduino Pro Mini and OMILP-LoRa in the entry module. It is used to send data at a certain moment to maximize channel utilization while avoiding interference. In this manner, accurate device power analysis is sufficient to transfer sensitivity to each SF. The study intends to deliver data at a predetermined time and to monitor aquaculture.
In this section, the proposed method’s approach is used to send data from the sender to the destination. To evaluate the performance of various parameter selection strategies, including those assigned by solving the DER optimization problem, throughput, packet collisions, energy consumption, and the fairness index. The evaluation parameter of the methodology is given by,
The evaluation matrices of the proposed method are DER, throughput, energy consumption, a packet of collision, and the fairness index. The mathematical expression of the evaluation matrices is given by,
DER: It is defined as the ratio of successfully received messages by Gateway to transmitted messages by the node within an estimation window. The mathematical expression of DER is given by,
where, Np represents the number of packets, C represents the number of packets Collison and Ns represents the number of packets sent.
Throughput: The transport of data from one point to another in a specific length of time is referred to as throughput. Throughputs are measured in data packets per second (p/s PPs). The addition of all data rates sent to all network is known as system throughput.
A crash in packets happens when more stations attempt to send a packet to the network same time. This is not unusual in a shared medium with several computers in the same network segment, such as Ethernet. Packet collisions occur when two or more network nodes attempt to communicate data at the same moment, potentially resulting in data loss. As a result, nodes may be forced to resend packets, decreasing system performance. The average collision rate is less than 5%. A packet collision happens when two or more network nodes try to transfer data at the same time, resulting in data collisions and probable data loss. A normal rate is one with a collision rate of less than 5%. Energy usage and the air quality index: The amount of electricity or energy consumed is referred to as energy consumption. The fairness index shows the dispersed devices. The fairness index is computed is given by,
The suggested methodology is contrasted to existing methods such as MILP, LoRa, and ILP in this section. We used five nodes from the proposed technique in this comparative study. The proposed method’s comparison analysis is compared to several metrics such as collision, energy consumption, DER, fairness index, and throughput. The following section provides a comparison of the proposed method to the existing collision method. The packet collision performance measurements are depicted in Fig. 3, and the comparison is summarized in Tab. 2.
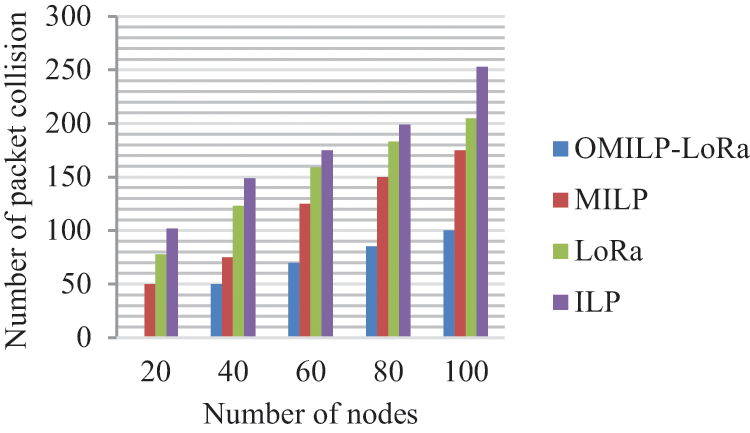
Figure 3: Comparative analysis of packet collision
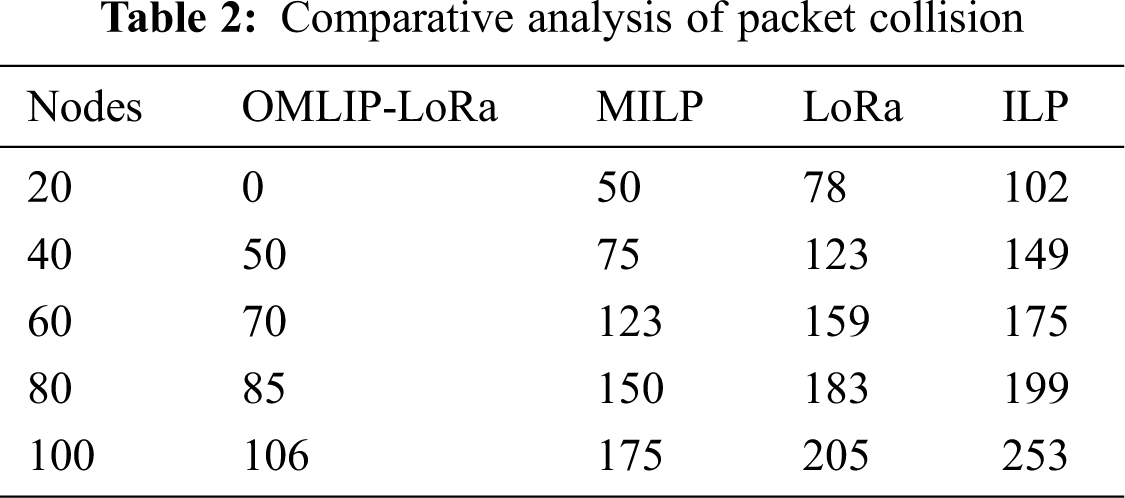
Fig. 3 depicts a comparison of the proposed method to existing methods such as MILP, LoRa, and ILP. We use five nodes in this strategy, such as 20, 40, 60, 80, and 100, against the number of collisions. The number of nodes is 20, the suggested method’s collision is 0, and the existing method’s collision is 0. The MILP value is fifty, the LoRa value is seventy-eight, and the ILP value is one hundred. The proposed approach has a collision rate of 50. The existing techniques have a MILP value of 75, a LoRa value of 123, an ILP value of 149, and a number of nodes are 40. When the suggested and existing approaches are compared, the collision rate of the proposed method is lower than the existing method. In this comparative analysis, the collision rate is very low. The collision rate of the method is low. The result is lossless information.
Fig. 4 shows the usage of energy analysis with the proposed method and the existing method, and the comparative analysis of energy consumption is tabulated in Tab. 3. When the node is 20, the energy consumption of the proposed method is 70 and the energy consumption of the existing methods is 120, 125, and 140. At node 40, the energy consumption of the proposed and current method is 80, 125, 135, and 155 respectively. In this comparative analysis, the energy consumption is compared with proposed and existing methods. The comparison of DER value is tabulated in Tab. 4.
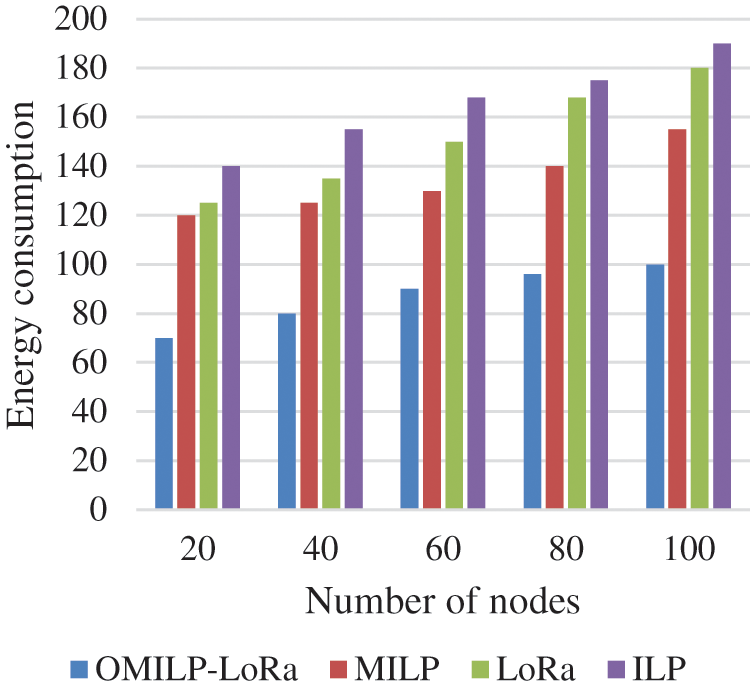
Figure 4: Comparative analysis of energy consumption
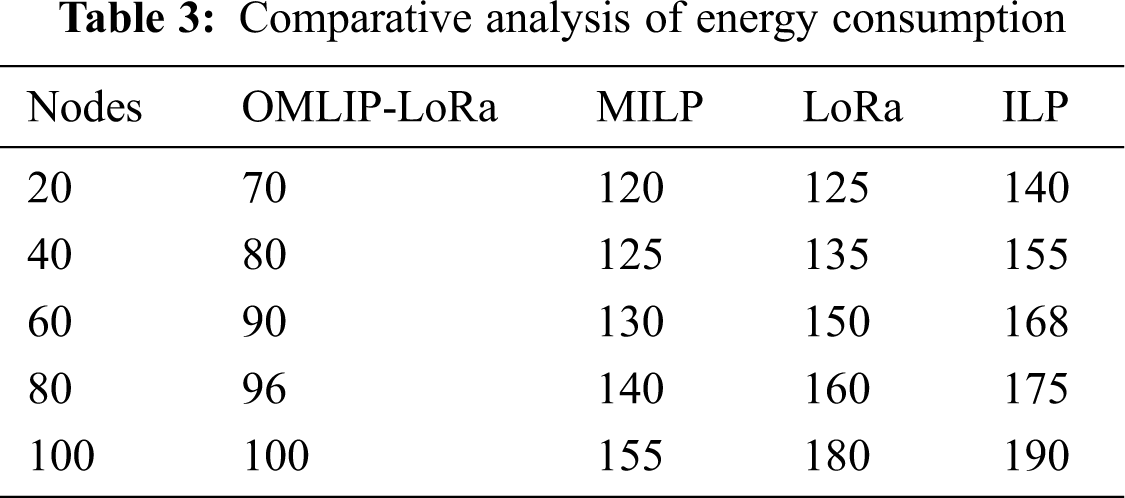
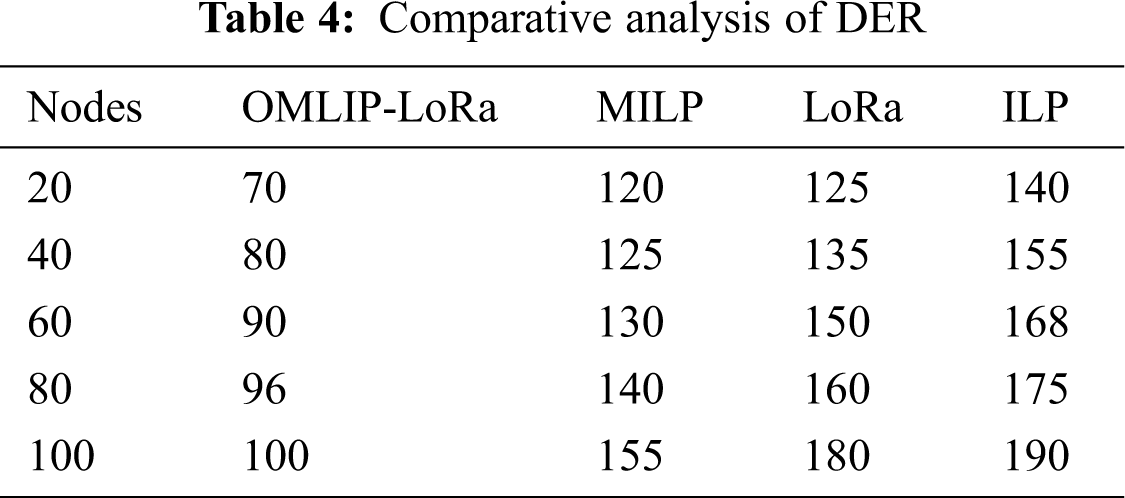
Fig. 5 shows various nodes in network against the existing methods of OMILP-LoRa and ILP. The comparison the fairness index is tabulated in Tab. 5.
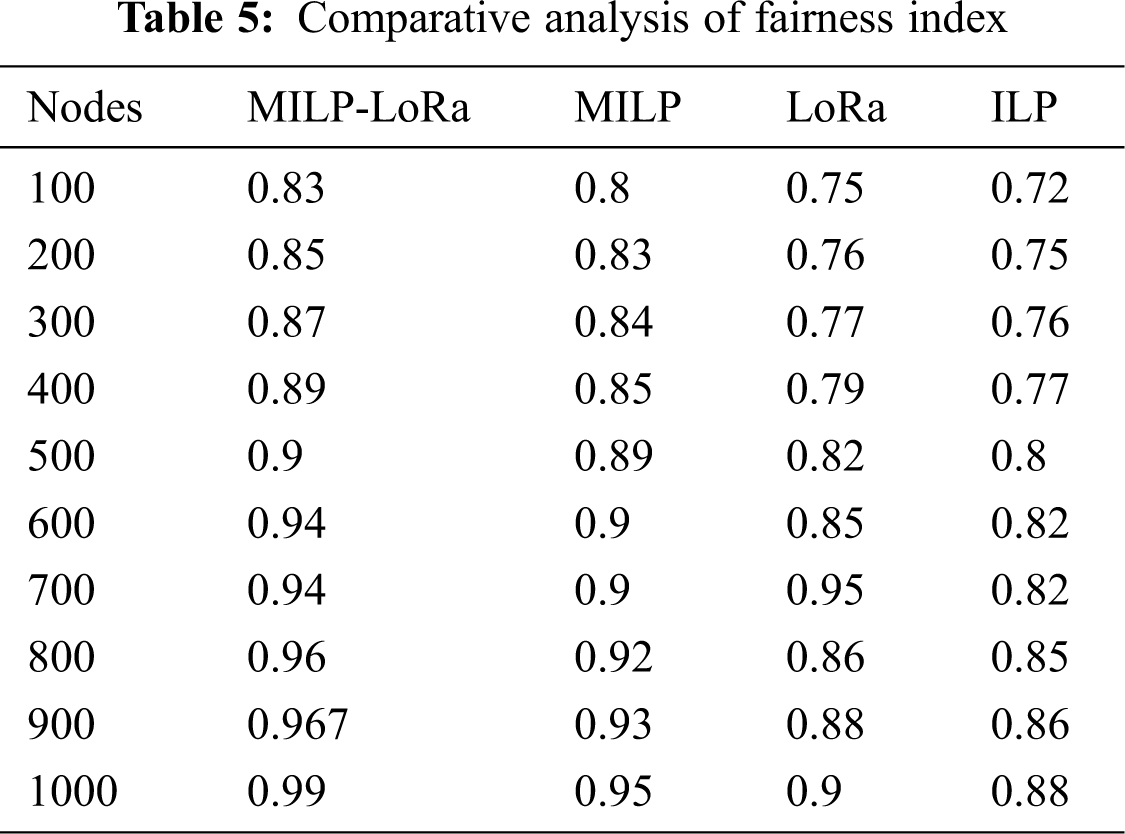
Fig. 6 shows comparative analysis of the fairness index of proposed methods to the existing method, the axis assumed the fairness index, and the number of nodes. The fairness index compared the proposed method OMILP-LoRa to existing methods MILP, LoRa, ILP; finally, the result is the proposed methods reach the higher fairness index. The comparison of throughput is tabulated in Tab. 6.
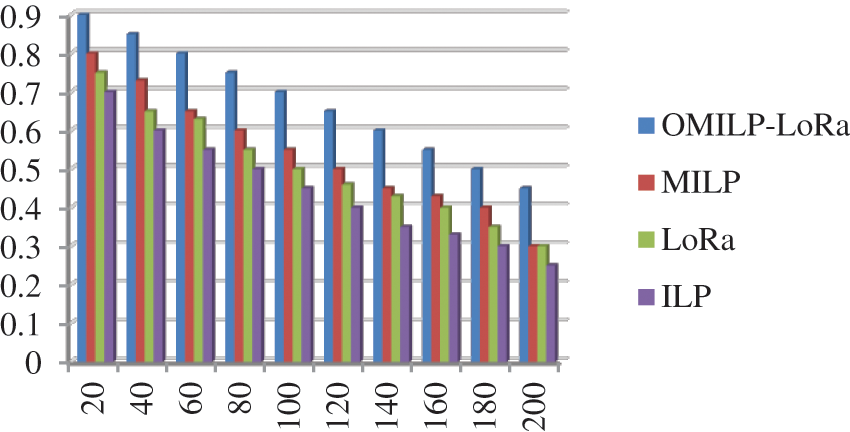
Figure 5: Comparative analysis of DER
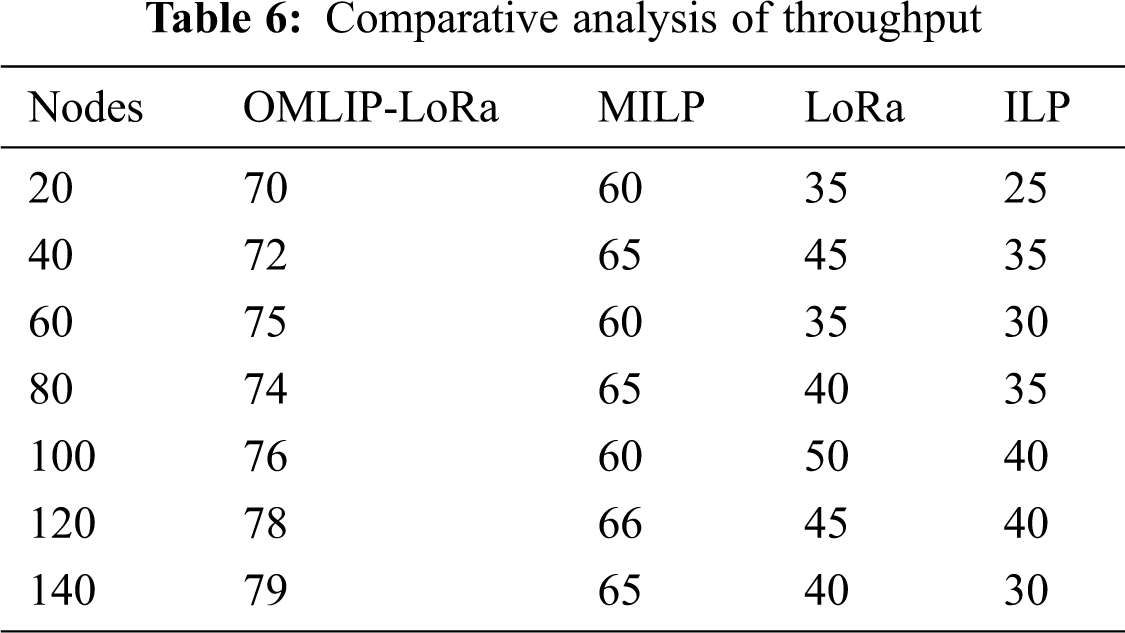
Fig. 7 represents the comparison between the proposed and the existing method for throughput. When comparing proposed and the existing method against the throughput, the proposed method throughput is high. The performance of the proposed technique over existing techniques is improved by 0.157%, 0.446%, and 0.551% respectively.
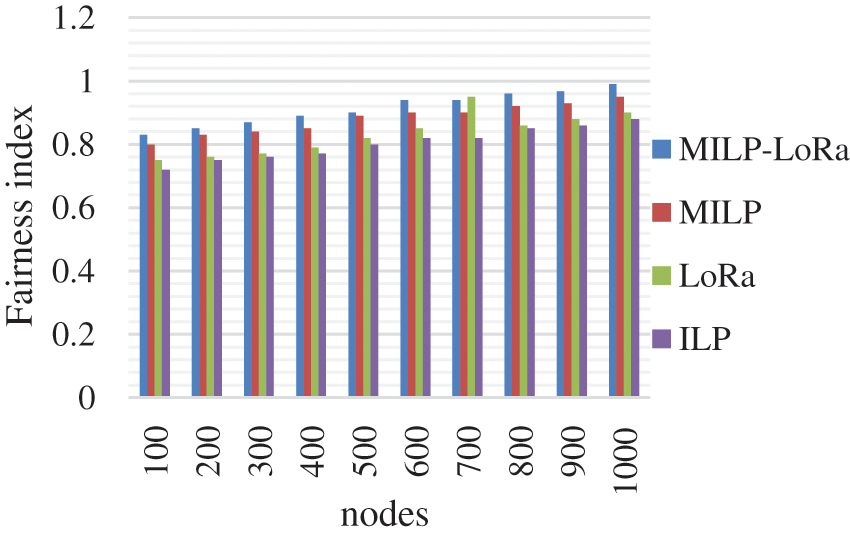
Figure 6: Comparison of fairness index
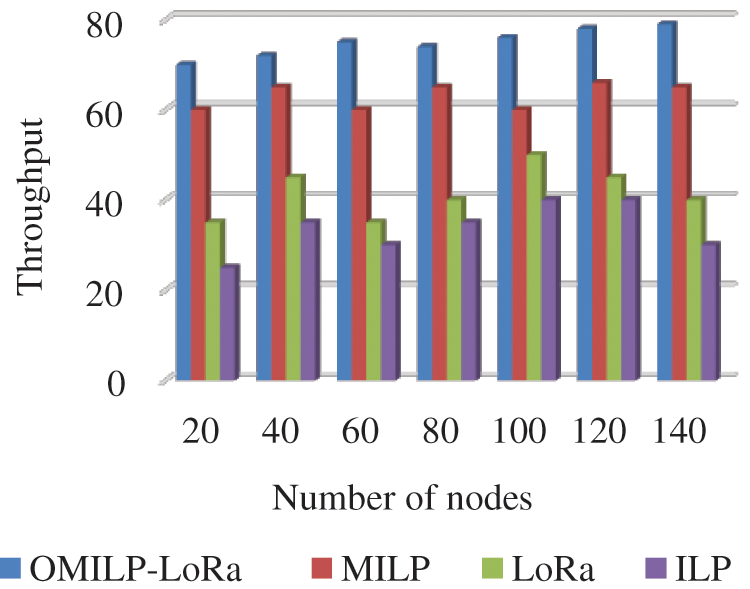
Figure 7: Comparative analysis of throughput
When the throughput is high, the proposed method transfers the data from one place to another place at a given particular time.
LoRaWAN resource allocation is critical, especially as scalability increases. The suggested heuristic modifies the LoRaWAN SF and CF parameters to reduce channel use, packet collisions, and, as a result, maximize packet delivery. The simulation results show that the ACCURATE heuristic delivers results that are near to the best provided by the OMILP model for channel utilization, increasing the allocation of LoRaWAN parameters to decrease collisions, and to enhance complete system. The performance of the proposed method was analyzed by various parameters, such as throughput, packet collision, DER, fairness index, and energy consumption. The comparative analysis was analyzed by various parameters, such as MILP, LoRa, and LIP.
Acknowledgement: The author would like to express his heartfelt gratitude to the supervisor for his direction and unwavering support during this research.
Funding Statement: The authors received no specific funding for this study.
Conflicts of Interest: The authors declare that they have no conflicts of interest to report regarding the present study.
1. Z. Wang, L. Kong, K. Xu, L. He, K. Wu et al., “Online concurrent transmissions at LoRa gateway,” in Proc. Conf. on Computer Communications, Toronto, ON, Canada, IEEE, pp. 2331–2340, 2020. [Google Scholar]
2. Q. Yubi, L. Ma and X. Liang, “Symmetry chirp spread spectrum modulation used in LEO satellite internet of things,” IEEE Communications Letters, vol. 22, no. 11, pp. 2230–2233, 2018. [Google Scholar]
3. M. L. Jovanovic, M. Koprivica and N. Neskovi, “Implementation of IoT system for securing telecommunications infrastructure based on LoRaWAN operator’s network,” in Proc. Int. Conf. on Smart Technologies, Novi Sad, Serbia, pp. 1–6, 2019. [Google Scholar]
4. M. Qaraqe, S. Althunibat, O. S. Badarneh and R. Mesleh, “Performance analysis of chirp spread spectrum system under mobility scenario,” Physical Communication, vol. 43, pp. 101233, 2020. [Google Scholar]
5. D. Eridani, E. D. Widianto and R. D. O. Augustinus, “Monitoring system in LoRa network architecture using a smart gateway in simple LoRa protocol,” in Proc. Int. Seminar on Research of Information Technology and Intelligent Systems, Yogyakarta, Indonesia, pp. 200–204, 2019. [Google Scholar]
6. M. Luvisotto, F. Tramarin, L. Vangelista and S. Vitturi, “On the use of LoRaWAN for indoor industrial IoT applications,” Wireless Communications and Mobile Computing, vol. 1, pp. 1–11, 2018. [Google Scholar]
7. M. S. Aslam, A. Khan, A. Atif, S. A. Hassan and A. Mahmood, “Exploring multi-hop LoRa for green smart cities,” IEEE Network, vol. 34, no. 2, pp. 225–231, 2019. [Google Scholar]
8. A. Frankic and C. Hershner, “Sustainable aquaculture: Developing the promise of aquaculture,” Aquaculture International, vol. 11, no. 6, pp. 517–530, 2003. [Google Scholar]
9. L. Cao, W. Wang, Y. Yang, C. Yang and Z. Yuan, “Environmental impact of aquaculture and countermeasures to aquaculture pollution in China,” Environmental Science and Pollution Research-International, vol. 14, no. 7, pp. 452–462, 2007. [Google Scholar]
10. W. Wang, J. Sun, C. Liu and Z. Xue, “Application of immune stimulants in aquaculture: Current knowledge and future perspectives,” Aquaculture Research, vol. 48, no. 1, pp. 1–23, 2017. [Google Scholar]
11. J. M. Munguti, J. D. Kim and E. O. Ogello, “An overview of Kenyan aquaculture: Current status, challenges, and opportunities for future development,” Fisheries and Aquatic Sciences, vol. 17, no. 1, pp. 1–11, 2014. [Google Scholar]
12. A. G. Murray, G. Alexander and J. P. Edmund, “A framework for understanding the potential for emerging diseases in aquaculture,” Preventive Veterinary Medicine, vol. 67, no. 2, pp. 223–235, 2005. [Google Scholar]
13. B. Zion, “The use of computer vision technologies in aquaculture–a review,” Computers and Electronics in Agriculture, vol. 88, pp. 125–132, 2012. [Google Scholar]
14. A. Munguti, J. Mbonge, J. D. Kim and E. O. Ogello, “An overview of Kenyan aquaculture: Current status, challenges, and opportunities for future development,” Fisheries and Aquatic Sciences, vol. 17, pp. 1–11, 2014. [Google Scholar]
15. A. Bischi, L. Taccari, E. Martelli, E. Amaldi, G. Manzolini et al., “A detailed MILP optimization model for combined cooling, heat and power system operation planning,” Energy, vol. 74, pp. 12–26, 2014. [Google Scholar]
16. A. Zourmand, A. L. K. Hing, C. W. Hung and M. A. Rehman, “Internet of things (IoT) using LoRa technology,” in Proc. Int. Conf. on Automatic Control and Intelligent Systems, Selangor, Malaysia, pp. 324–330, 2019. [Google Scholar]
17. R. Kufakunesu, G. P. Hancke and A. M. A. Mahfouz, “A survey on adaptive data rate optimization in LoRaWAN: Recent solutions and major challenges,” Sensors, vol. 20, no. 18, pp. 5044, 2020. [Google Scholar]
18. E. Sisinni, P. Ferrari, D. F. Carvalho, S. Rinaldi, P. Marcoetal., “LoRaWAN range extender for industrial IoT,” IEEE Transactions on Industrial Informatics, vol. 16, no. 8, pp. 5607–5616, 2019. [Google Scholar]
19. T. T. Nguyen, H. H. Nguyen, R. Barton and P. Grossetete, “Efficient design of chirp spread spectrum modulation for low-power wide-area networks,” IEEE Internet of Things Journal, vol. 6, no. 6, pp. 9503–9515, 2019. [Google Scholar]
 | This work is licensed under a Creative Commons Attribution 4.0 International License, which permits unrestricted use, distribution, and reproduction in any medium, provided the original work is properly cited. |