DOI:10.32604/iasc.2022.024005
| Intelligent Automation & Soft Computing DOI:10.32604/iasc.2022.024005 | |
| Article |
A Wireless ECG Monitoring and Analysis System Using the IoT Cloud
Faculty of Computers and Information Technology, University of Tabuk, Tabuk, Saudi Arabia
*Corresponding Author: Anas Bushnag. Email: abushnag@ut.edu.sa
Received: 30 September 2021; Accepted: 01 November 2021
Abstract: A portable electrocardiogram (ECG) monitoring system is essential for elderly and remote patients who are not able to visit the hospital regularly. The system connects a patient to his/her doctor through an Internet of Things (IoT) cloud server that provides all the information needed to diagnose heart diseases. Patients use an ECG monitoring device to collect and upload information regarding their current medical situation via the Message Queue Telemetry Transport (MQTT) protocol to the server. The IoT cloud server performs further analysis that can be useful for both the doctor and the patient. Moreover, the proposed system has an alert mechanism that sends notifications when a certain threshold is reached. The monitoring system accepts two types of input data: real-time data that are collected by an ECG device and benchmark data from the PhysioNet ECG-ID database. The system framework has four components: input, embedded device, IoT cloud server, and interface. Herein, two experiments are conducted using both types of input data. The results show that the proposed system provides reliable and trusted results that might reduce the number of required hospital visits. A comparison between the proposed system and several techniques previously reported in the literature is conducted. Finally, an implementation of the proposed system is presented to illustrate its operation.
Keywords: Electrocardiogram (ECG); monitoring system; MQTT; Internet of Things (IoT); IoT cloud server
Providing healthcare for people who live in rural and remote areas is a massive challenge because of the small number of care providers and the lack of practitioners and medical equipment. In these remote regions, it is difficult for patients to travel long distances to visit the nearest medical facility because of the long duration and high expenses of these trips. On the other hand, physicians find it difficult to work in remote locations because it requires them to travel back and forth daily [1]. Moreover, the number of elderly people who need regular checkups without physically being present in medical facilities is continuously increasing [2]. Furthermore, checkups should be carried out in a comfortable, precise, and affordable manner for wide availability [3]. Therefore, finding a technological solution to help both patients and physicians is crucial to help reduce the number of trips to hospitals for regular checkups.
The Electrocardiogram (ECG) signal is considered to provide valuable information about cardiac diseases [4]. Therefore, accurate identification of the properties of an ECG signal will help detect abnormalities within the signal and improve predictions. The ECG signal records the electric pulses of the heart, including the magnitude and direction of the signal. Electrical flow is produced by the depolarization and repolarization of the atria and ventricles. A typical ECG signal cycle contains three waves, namely, the P wave, the QRS wave, and the T wave, as shown in Fig. 1. Additionally, the ECG signal contains several intervals, such as the PR, QT, ST, TQ, QRS, and RR intervals. The shape and amplitude of the waves and the duration of the intervals determine the characteristics of the signal and whether it is normal or abnormal. Moreover, these characteristics can be used for diagnostic purposes [5]. For example, a normal P wave should be present and upright, so an absent or inverted P wave may indicate that the patient has a form of dysrhythmia such as junctional rhythm. The PR interval should be between 0.12 and 0.2 s, and therefore, detection of it outside its normal time range can indicate hard line dysrhythmia. The QRS complex is usually between 0.06 and 0.12 s, so a duration above this range can indicate Premature Ventricular Contractions (PVC) dysrhythmia. Unequal RR intervals in an ECG signal indicate that the rhythm is irregular. Furthermore, an ECG signal can be utilized to calculate the heart rate [6]. Accurate analysis of the ECG signal is essential for both specialists and patients.

Figure 1: Electrocardiogram (ECG) signal
The Internet of Things (IoT) is a relatively new and effective solution for many existing medical, transportation, and industrial systems [7]. The IoT is a dynamic global network that has self-configuration capabilities, uses communication protocols and assigns identities to physical and virtual “things” [8]. Similarly, the IoT can be a virtual network that communicates with the real world [9]. It has the ability to handle a massive number of devices using different types of communication protocols simultaneously, providing flexibility and scalability for many applications [10]. The IoT is based on devices with sensors and actuators that are used for awareness of the surrounding environment. These sensors and actuators are connected via the Internet to accomplish a specific task [11]. The IoT takes advantage of low-cost sensors and a wide range of radio-frequency identifications as well as wireless communications [12]. A typical IoT system can be involved in healthcare, the Food Supply Chain (FSC), transportation and logistics, mining production, firefighting, smart cities, and many other fields [13].
Message Queue Telemetry Transport (MQTT) is a standard messaging protocol. It connects networks and embedded devices. MQTT has three routing mechanisms: one-to-one, one-to-many, and many-to-many communication. Therefore, MQTT is suitable for IoT systems because of its optimal connection and many-to-many capabilities. MQTT uses publish/subscribe patterns for communication between parties that provide simplicity and flexibility. Additionally, MQTT is suitable for devices with limited resources such as unreliable and low-bandwidth links. MQTT utilizes Transmission Control Protocol (TCP) to ensure the delivery of messages. MQTT has three components: a publisher, a subscriber, and a broker. The communication process is carried out as follows: if a subscriber is interested in one of the topics, for example, outside temperature, then the subscriber asks the broker for a subscription to the temperature topic. Then, the broker informs the subscriber about the topic of interest once the publisher publishes it. We note that the subscriber may be an IoT cloud service and the publisher may be an IoT device. The publisher senses the environment and transmits the information to the subscriber via the broker. The responsibility of the broker is to coordinate between the publisher and the subscriber [14]. Moreover, the broker carries out authentication for both parties to secure the channel between them [15]. The overall architecture of MQTT is shown in Fig. 2. MQTT has an advantage over Hypertext Transfer Protocol (HTTP) because it listens and transmits only when the value of a variable is changed. This is unlike HTTP, which sends GET requests continuously to check the value of the variable, increasing the amount of traffic; therefore, HTTP is not considered a real-time interaction, unlike MQTT [16]. Hence, MQTT is used for several IoT applications, such as monitoring, healthcare, and energy meter systems. Since MQTT can handle low-power and low-memory devices, it is selected for use in communications in the proposed framework [17].

Figure 2: Message queue telemetry transport (MQTT) protocol architecture
In the proposed system, the four-layer architecture, consisting of a sensing layer, a networking layer, a service layer, and an interface layer, is used. Fig. 3 shows the four-layer architecture. The sensing layer is considered the inner connected network; this network controls and connects the ‘things’ together remotely. The networking layer is responsible for allowing ‘things’ to share information with other ‘things’. All applications, functions, and services are carried out in the service layer. The interface layer provides one solution across the system despite the different protocols and standards. There are two different data sources in the proposed system: an ECG device that reads real-time data from the patient and the PhysioNet ECG-ID database. This database has 310 ECG recordings collected from 44 men and 46 women. The ages of the people whose ECG recordings are contained in the database range from 13 to 75 years. Each ECG record contains 20 s of data and is digitized at 500 Hz with a 12-bit resolution. Moreover, each record has two versions: a raw signal and a filtered signal. The proposed system is tested using both of these different data sources: real-time and PhysioNet ECG-ID database for verification.

Figure 3: Four-layer IoT architecture
The rest of the paper is organized as follows. Section 2 presents the related work. Section 3 provides the proposed system. Section 4 demonstrates the results and analysis. Section 5 shows the system implementation. Section 6 concludes the paper.
Reference [18] aimed to develop an affordable end-to-end portable ECG monitoring system that uses Bluetooth Low Energy (BLU). The system has three modules: first, a 5-lead ECG monitoring system; second, a smartphone application for receiving, plotting and analyzing the incoming data; and third, a remote server for storing the collected data. The proposed system plots an ECG signal for the phone application, and then, the signal is stored in a web server for further analysis and future reference. The system analyzes the ECG signal and provides the vent rate, QRS value, RR interval, and heartbeat classification into one of the following three categories: normal, tachy, and brady. This information is sent to the phone application and can also be accessed by the doctor via the web server. The main issue of the system is the connection reliability both between the physical monitoring system and the phone application and between the phone application and the web server. Moreover, the user interface for patients and doctors is very basic based on the figures demonstrated in their paper.
The authors of [19] proposed a system for real-time arrhythmia detection. They collect the ECG data using a three-lead ECG sensor. The system alerts the health care provider if a patient has arrhythmia. Detection is achieved by applying the Pan-Tompkins and wavelet-based algorithms. These algorithms specify the PVCs that are calculated based on the locations of the QRS peaks of the ECG signal. If three or more PVCs are detected, this means that the patient has arrhythmia. This result in the system automatically notifying the care provider. A Liquid Crystal Display (LCD) and button user interface was developed for the proposed system. Additionally, a system control that is run by a web server was created to allow patients to access their information and configuration. Benchmark data were used in the paper to validate their work. However, this proposed system is limited in that it only provides information for PVCs. This may not be sufficient for the analysis of the patient’s situation from the doctors’ perspective.
In the system studied in [20], the ECG signal is collected by an AD8232 sensor. Then, the signal is digitized using the 10-bit Analog-to-Digital converter (ADC) of the ATmega328 microcontroller. The digital signal is transmitted using a serial cable or via Bluetooth to a smartphone application. The digitized signal and its timestamp are stored in a micro SD card for reference for future use. Initially, the developers used a breadboard for their system as a prototype. Then, they printed a Custom Circuit Board (PCB) that improved the quality of the acquired ECG signal of the system to achieve less noise with a PCB implementation instead of a traditional breadboard. However, the system does not provide any automatic transmission over the Internet. It only transmits the data via Bluetooth to a smartphone application for data representation. Therefore, further manual steps are required to send the ECG data to a specialist. This can be useful for patients with ECG system knowledge but may be difficult to manage for other patients. Additionally, the system only presents the ECG signal without any data analysis.
In paper [21], the system was claimed to automatically monitor patient health. The data are processed via Raspberry Pi and then uploaded to an IoT cloud. There is a graphical representation of the information to help doctors keep track of the patient’s condition. A notification is sent in case a patient’s condition is critical. In this technique, the ECG sensor is connected to an Arduino, which is connected to a Raspberry Pi. However, the temperature sensor is connected directly to the Raspberry Pi. Moreover, at the other end of the system, the Raspberry Pi is connected to an LCD, an IoT cloud, and a website. The system can handle only real-time data from the AD8232 sensor. The obvious drawback of this system is the design. The hardware design can be improved because the use of Arduino and Raspberry Pi together is not practical since they can replace each other in these kinds of applications. Moreover, using an IoT cloud should be sufficient, and there is no need for a separate website. These complications can be hard for the average user since the system should be minimalistic and user-friendly.
The technique in [22] aimed to use an IoT system to measure the ECG signal with a Raspberry Pi 3. Then, data are transmitted to a cloud server for storage and analysis. The proposed system uses an Android application for patients and a web application for doctors. The system suggests the closest medical center in case the patient has an unexpected condition. The system uses Short Message Service (SMS) and Global Positioning System (GPS) for the patient location. The system focuses on the P-wave, QRS complex, and T wave of the ECG signal to determine the condition of the patient’s heart. In this system, the Raspberry Pi sensor senses the ECG signal of the patient, which is later sent to the cloud server. On the cloud, the signal is analyzed and compared with normal signals. The system utilizes machine learning for data analysis. Note that the use of machine learning might be a power-consuming approach for these kinds of applications. Moreover, the system has no Graphical User Interface (GUI) to facilitate interaction.
The technique in paper [23] is a healthcare monitoring system based on the IoT. It is designed to help people with heart diseases. The system monitors the ECG signal by wearable sensors, and then, data are kept in a database that can only be accessed by authorized people. The system also provides an email notification mechanism to notify users when a certain condition is met, asking for immediate help. The authors claim that the system is efficient and dependable after a pilot study. The system uses Raspberry Pi 2, Arduino Uno, and AD8232 sensors. The collected ECG signal is transmitted to an IoT cloud via Bluetooth or WiFi. The system has a GUI that can be accessed via a mobile application or a web page. The main disadvantage of this system is the duplicate use of Raspberry and Arduino systems, which make the hardware more complicated and hard to use.
In [24] the ECG signal for remote patients is measured by using the ECG PhysioNet ECG-ID to authenticate the patient based on a classification. The authentication relies on the sum of Squared Differences (SSDs). The system has different stages. First, it extracts the features of the ECG signal. Second, these signals are classified based on a Support Vector Machine (SVM). How the machine learning concept would integrate with the hardware was not shown in this technique.
Reference [25] presented another technique that applies machine learning approaches for ECG signal classification. The proposed system uses SMOTE for oversampling. The dataset used in the system is from PhysioNet Challenge 2017. The classification is performed by AdaBoost, K-Nearest Neighbors Algorithm (KNN), and SVM methods. The AdaBoost approach provides the best results in terms of accuracy. The steps of the system include the following: preprocessing, feature extraction, feature selection, data oversampling, and classification algorithms. However, the system has not been implemented.
The proposed system in [26] uses Atmega328P as a microcontroller and AD8232 for ECG measurement. The system does not use the Internet, but it can monitor a patient up to 100 meters away using Bluetooth. Later, the ECG signal is stored in the patient’s phone and accessed by the doctor. The system has several stages: reading the ECG signal, signal processing, and signal viewer. The data of the system are published on a screen for monitoring the patient’s condition. The main drawback of the system is the lack of live monitoring for doctors. The patient has to send the data to the doctor manually after taking the readings.
In [27], the proposed system attempts to merge the IoT and big data with integrated ECG sensors. The signal is transmitted via Bluetooth, ZigBee, and WiFi. The collected data can be transferred to a doctor or even stored on a cloud for further analysis. The doctor should be able to access the patient’s report via a smart device. The big data in the system are used for decision making and analysis. The system has three main phases: data acquisition, data transmission, and cloud-based infrastructure. The notable disadvantage of this study is that it does not show an actual implementation of the system.
The main framework has four components: input, embedded device, cloud, and interface. For the input component, the data source can be either an ECG sensor for real data testing or a benchmark dataset such as the PhysioNet ECG-ID database. The data source is fed into an embedded system that contains a microcontroller, a data analysis unit, inputs/outputs, and a WiFi module. After the data are analyzed by the microcontroller and the data analysis unit, the information is transmitted via WiFi using MQTT to the cloud for storage, further analysis, and instant warnings. Information can be accessed and warnings can be triggered by the interface component via web or smartphone applications. Fig. 4 shows the overall framework of the proposed system.

Figure 4: Overall system framework
The first source of the data is the AD8232 sensor used to collect real data from a patient. The sensor records the electrical activity, which is utilized to chart the ECG signal and output it as an analog reading. The raw ECG signal can be noisy, and therefore, the sensor acts as an op-amp to clarify the signal. The AD8232 sensor is designed to work in noisy conditions such as patient motion or remote electrodes. The second source is the PhysioNet ECG-ID database, in which each record has two versions: raw and filtered. In this study, the filtered data are used. The ESP8266 microcontroller receives the data from either the AD8232 or PhysioNet ECG-ID database and analyzes the data. First, the ECG signal is converted into an array of values. These values are passed to the Pan-Tompkins algorithm [28] for QRS detection. The Pan-Tompkins algorithm operates as follows:
The second low-order low-pass filter is given by
The high-pass filter is given by
The derivative is given by
The squaring function is given by
The moving-window integration is given by
Eqs. (1) and (2) are low-pass and high-pass filters that are used to clean the ECG signal by removing noise. The high-pass filter is simply the output substruction of the first-order low-pass filter. These two filters are standards in the Pan-Tompkins algorithm, which is used in the proposed model. They are used to improve the signal quality and remove noise for better QRS detection. After filtering the signal, Eq. (3) obtains the QRS-complex slope information by differentiation. In Eq. (4) each point of the ECG signal is squared to make all points positive and emphasize the high frequencies. Finally, Eq. (5) is a moving-window integration for obtaining information for the waveform feature and the slope of the R wave.
After the QRS complex is detected, the peak of the R wave is calculated. This allows the calculation of the RR interval by Eq. (6).
where
RR is the current RR interval, CR is the current R wave peak time, and PR is the previous R wave peak time. In addition, the patient heart rate is calculated by the following equation:
where
HR is the current heart rate. The RR interval normality is tested and evaluated based on its current range. Therefore, a value of the RR interval time within the range of
is considered a normal RR interval; otherwise, it is abnormal, and an alert needs to be sent to both doctors and patients. The following test is the rhythm test, in which how far the current RR interval is from the average RR interval is calculated. Therefore, the average RR interval needs to be calculated using Eq. (9).
where
ARR is the average RR interval time, TRR is the total interval time, and RC is the number of QRS-detected complexes. If the current RR interval time falls within the range of
this means that the rhythm is normal; otherwise, the patient has an arrhythmia, and an urgent alert must be sent for notification. Algorithm 1 shows the overall steps of the proposed system.
Optimization is essential in the transfer of data between IoT devices and the cloud. This is mostly because every update will consume the daily available resources. In IoT cloud services, resources are limited. Therefore, if more than one IoT device is present and each device has multiple variables, this may consume the daily quota of allowed resources in a few minutes in the case of a nonoptimal system design. For example, if one of the IoT devices has five variables and the allowed daily resources are 4000 updates, in the case where each of these variables needs to be updated every 0.1 s, the system can run only for a very limited time. Therefore, identification of the variable that needs to be updated and how frequently this variable needs to be updated is key for good system design. Additionally, processing and performing functions and conditions using system variables should be executed by either one of the two ends of the system, namely, the IoT device or the IoT cloud. This is another design decision that must be made, and each choice has advantages and disadvantages.
In this work, the Pan-Tompkins QRS detection algorithm is processed on the IoT device rather than on the IoT cloud. The main reason is that the Pan-Tompkins QRS detection algorithm requires high computations and multiple updates. Therefore, if it is run on the IoT cloud, it will consume a massive amount of resources with lower performance since the IoT cloud refreshes its data in specific intervals. The current HR and RR are calculated on the IoT device as well. Therefore, ECG data either from the PhysioNet database or the AD8232 sensor as well as the current HR and RR are the only data sent to the cloud to minimize the traffic between the IoT device and the IoT cloud. This saves resources and keeps the system running much longer. On the IoT cloud side, the average HR and average RR are calculated to avoid the transfer of their values from the IoT device, unnecessarily consuming resources. Moreover, the rhythm test and RR normality test functions are processed on the IoT cloud.
All alerts are handled by the IoT cloud, such as emails, telegram messages, and SMSs. The balance between the requirements for processing on the IoT device and the processing on the IoT cloud is crucial because it involves a tradeoff between resource consumption and performance. Graphs, figures, charts, and information required by either a doctor or a patient are handled by the GUI of the IoT cloud that is accessible via smart devices.

The system hardware has three main components: a NodeMCU ESP8266 IoT device, an AD8232 sensor, and data collection hardware. The IoT device has the capability to receive data from either the AD8232 sensor or PhysioNet ECG-ID. The actual system hardware is shown in Fig. 5. The system has a minimal design for portability and cost.

Figure 5: Actual system hardware
NodeMCU ESP8266 is an embedded device with integrated WiFi. This is essential for the proposed small compact system since there is no need for a separate WiFi module. The architecture of NodeMCU ESP8266 has the capabilities of GPIO connection to the Internet and data transmission via the Internet. NodeMCU ESP8266 utilizes the standard Lua Programming Framework script [29]. The main reason for this is to allow programming in a simple way. The memory of NodeMCU ESP8266 has a capacity of 4 MB [30]. Another powerful feature of this embedded device is the use of Arduino IDE, which is currently compatible with many popular operating systems, such as Windows, Mac OS, and Linux. Fig. 6 shows an overview of the NodeMCU ESP8266 system architecture.

Figure 6: NodeMCU ESP8266 Pinout
An AD8232 sensor is used to provide an ECG signal to the system. After obtaining the ECG signal information from the patient, several values can be calculated, such as HR and RR. AD8232 can be connected to most popular microcontrollers, including ESP8266, which is the one used in the proposed system. AD8232 can run in poor conditions such as vibration and is still able to provide a clear ECG signal. This is beneficial since the system will be used mostly by ordinary people. After extracting the ECG signal, an amplifier is applied to convert the signal into a digital form that can be processed. The sensor avoids the electrode half-cell latent in the same step. This process is achieved by using the built-in ADC. Moreover, AD8232 contains a mid-supply buffer, a right-leg drive amplifier, a fast reinstate circuit, and lead-off recognition circuitry [31]. Fig. 7 shows the overview of the AD8232 system.

Figure 7: Overview of the AD8232 system
The system has electrodes, which are disposable, safe, fast, cheap, and easy to use. This is a better alternative to wet reusable electrodes since the system is used mostly by the patients themselves at home. These electrodes have 3 leads instead of the regular 12 leads for simplicity. The 3 leads are placed on the right chest, left chest close to the patient’s heart, and right part of the stomach.
The proposed system hardware uses the MQTT protocol because it updates the variables only when needed. This is unlike HTTP, which always sends requests to the IoT cloud server even if there are no data to update, resulting in wasted resources. Since the IoT cloud used in this study is a free service with limited resources, minimizing the number of uploads to the cloud is essential for a longer IoT network lifetime. The proposed system has three variables that require updating: ECG signal, current HR, and current RR. These variables are uploaded only if new values appear, which reduces the number of updates the IoT cloud server uses. However, the other variables, such as average heart rate, average RR, RR normality, and rhythm, are calculated on the IoT cloud server to save resources. Calculating these values on the IoT device and uploading them to the IoT cloud will consume a massive amount of the available resources. Fig. 8 shows the MQTT concepts in the proposed system and how tasks are divided between the IoT device and IoT cloud server. The proposed model is soft real-time, which adds flexibility and tolerance to the users. This will help with noise created by the user, for instance, device shaking, missing some values because of synchronizing issues, or any other reasons. Since the model is soft real-time, it will be able to provide the overall ECG signal of the patient regardless of these missing values. Therefore, any further analysis such as HR and RR including the calculation of other parameters can still be achieved using the available ECG signal. In case two or multiple ECG signals are uploaded, different IoT devices are utilized using different sessions on the IoT cloud. Therefore, there will be no interference between them since each IoT device has its variables and session reserved on the cloud.
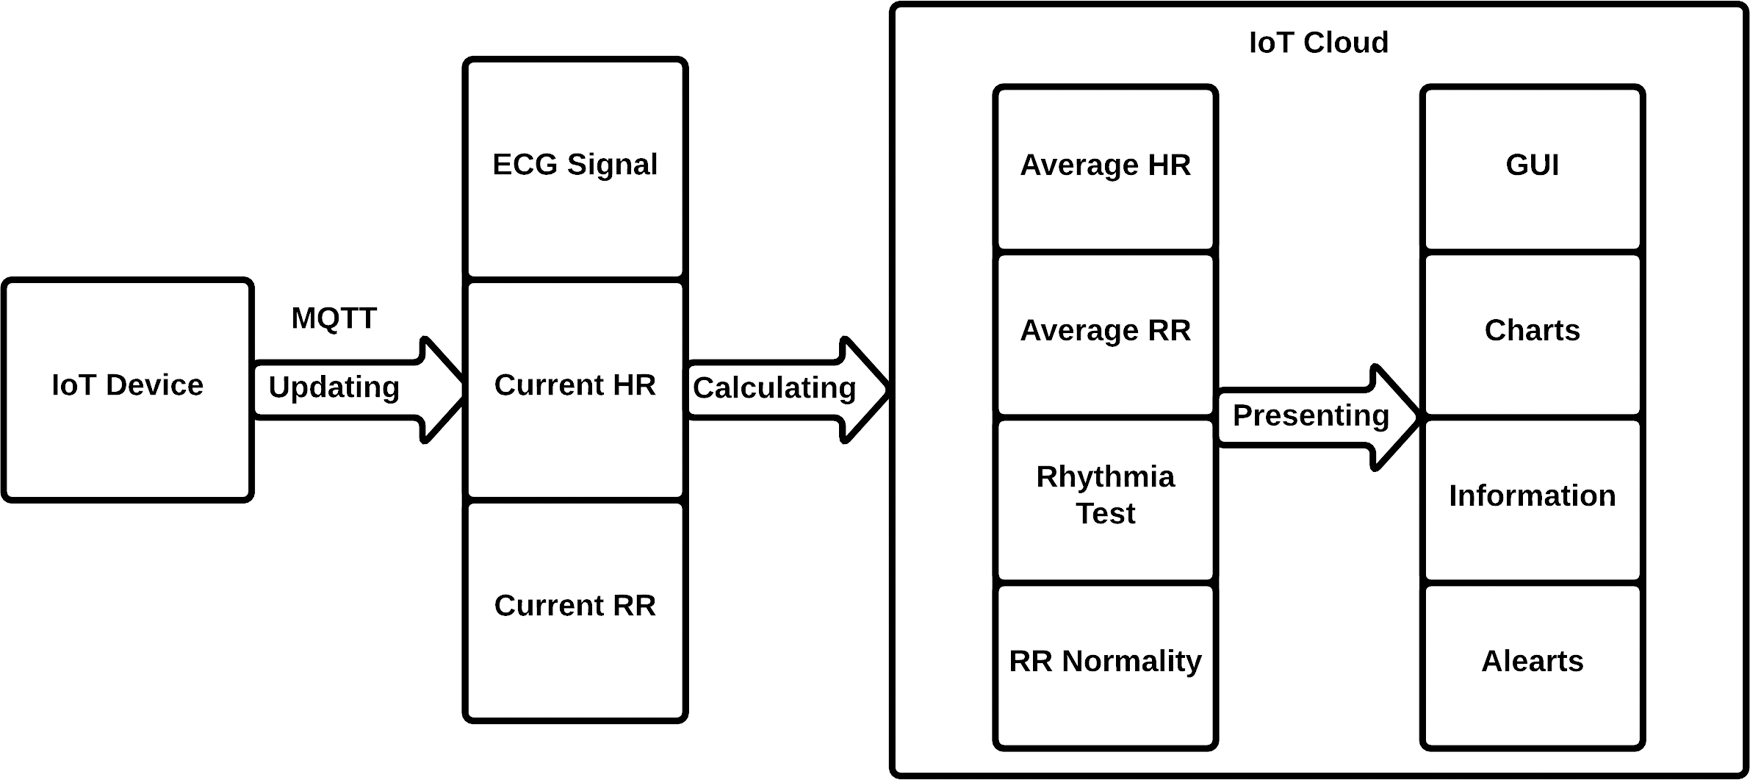
Figure 8: MQTT updating process in the proposed system
In this section, the first part includes two scenarios. The first scenario involves the ECG-ID database, and the second scenario involves real-time data from the AD8232 sensor. In the second part, the proposed technique is compared to the methods reported in the literature to show the differences between them.
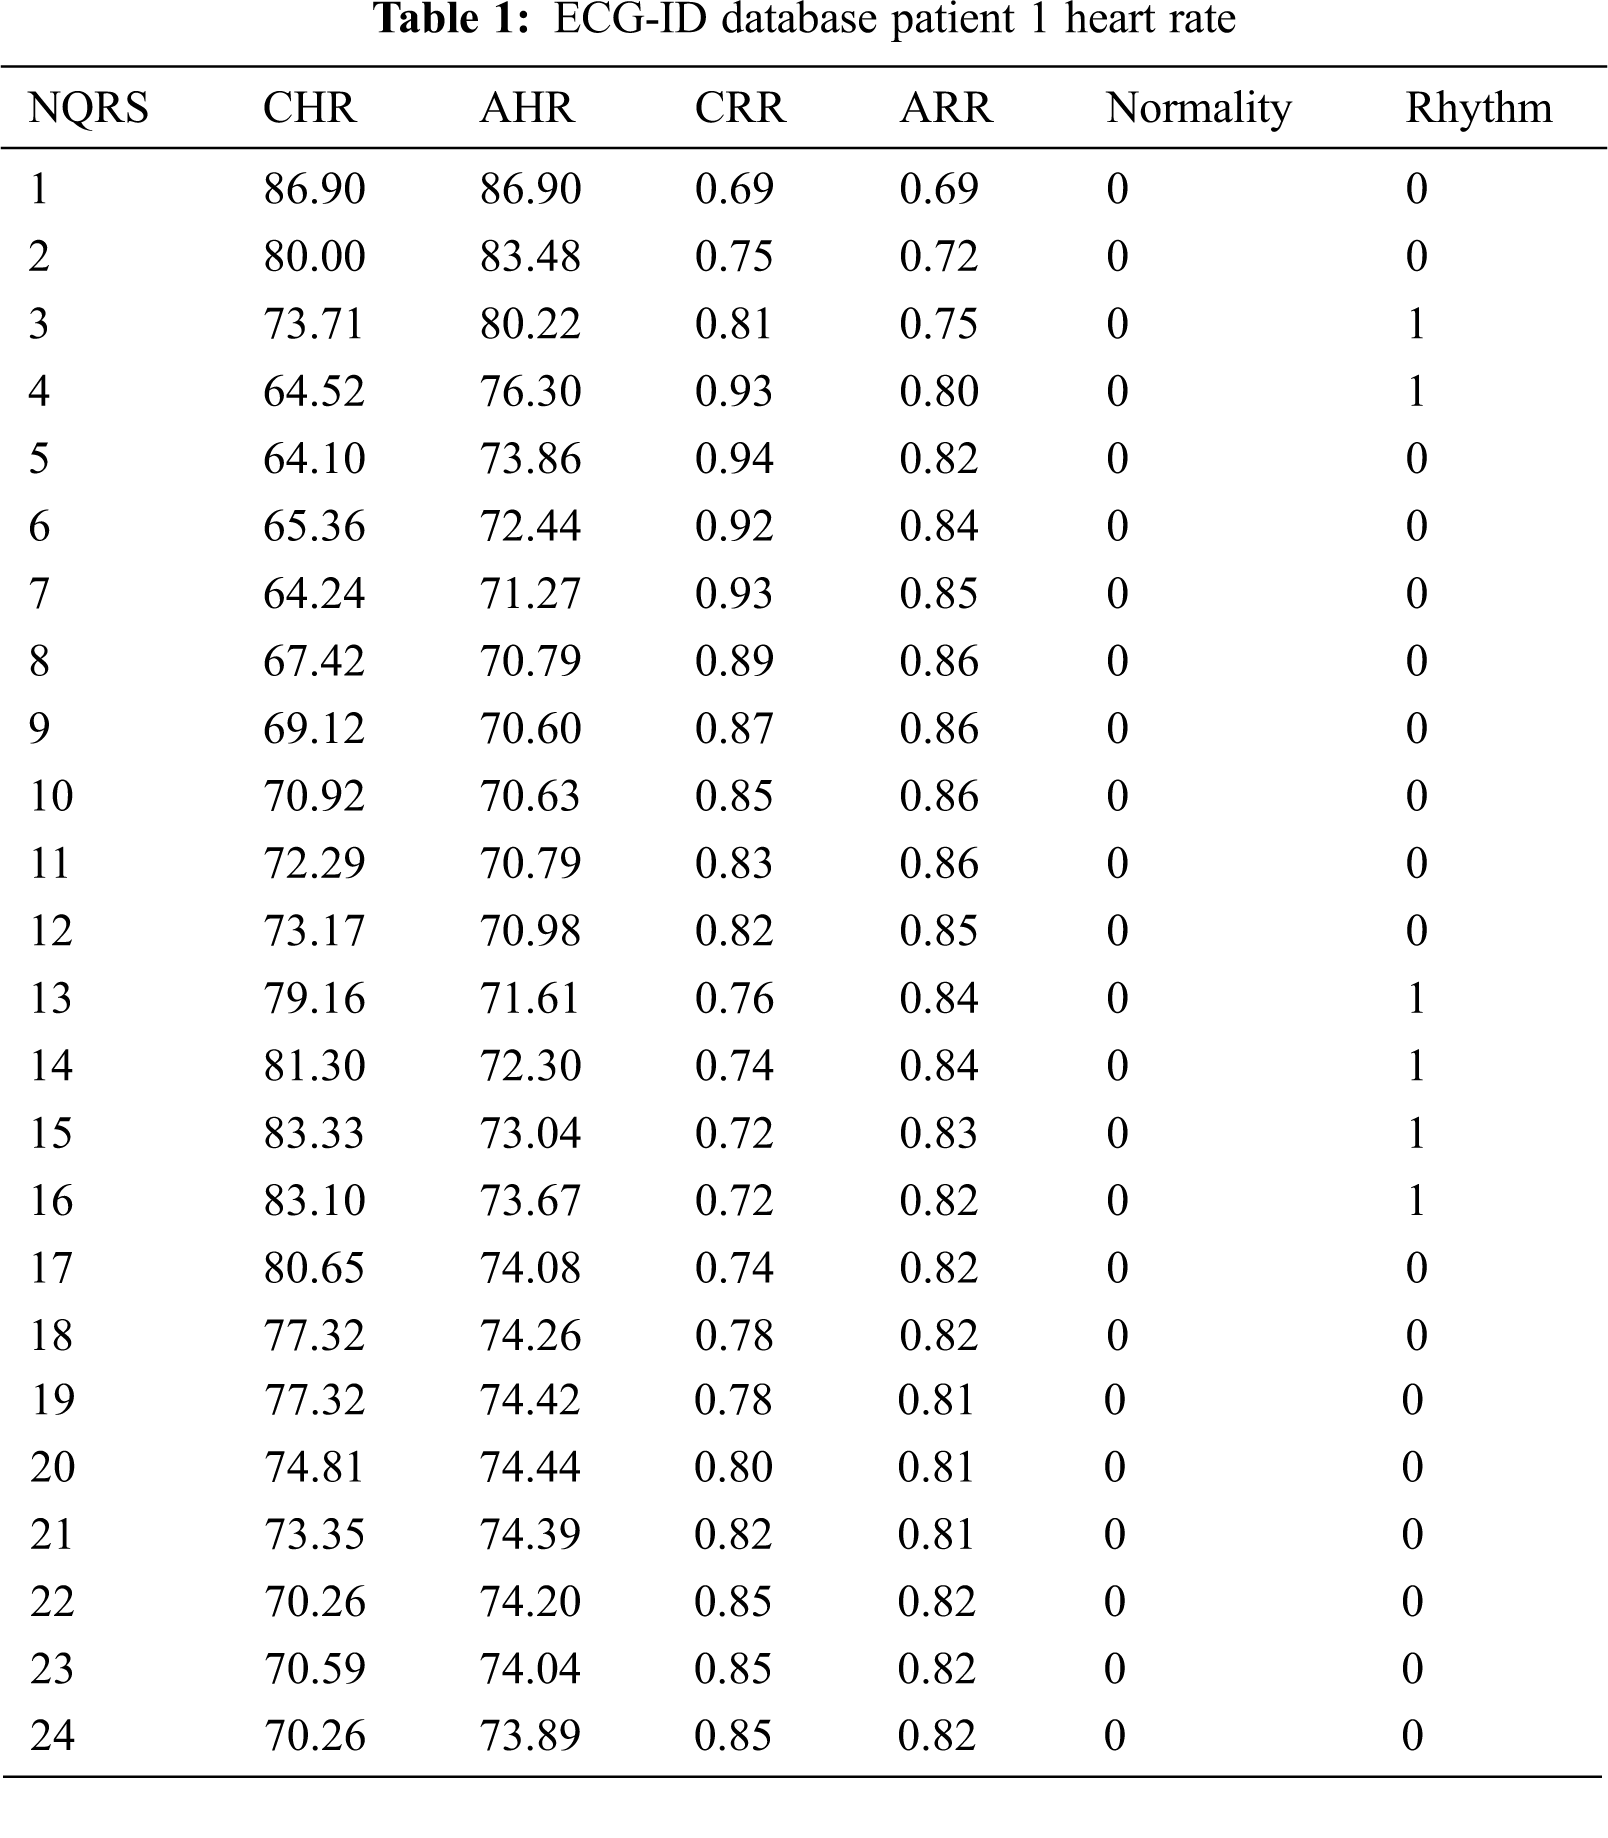
An ECG signal for a 25-year-old male patient was examined to illustrate the system operation (Fig. 9). The results presented in Tab. 1 show that the proposed system detected a total of 24 QRS complexes with 100% accuracy. The patient had an arrhythmia between QRS 3 and 4 as well as between QRS 13 and 16. However, the RR normality of this patient fell in the normal range. Fig. 10 left shows that the patient’s current heart rate dropped at the beginning and then started to rise to its peak at QRS 15. On the other hand, the average heart rate shows that the patient had a normal heart rate during the test. For the current RR, as shown in Fig. 10 right, the values initially increased to reach a maximum at QRS 5 and then decreased to reach a minimum at QRS 9 before increasing slightly. This behavior indicates that the RR intervals are not normal, as confirmed by the rhythm test. The average RR shows the direction of RR intervals, which can be beneficial for diagnosing health problems.

Figure 9: PhysioNet ECG-ID database from patient 1 filtered record

Figure 10: ECG-ID database patient 1 heart rate (left). ECG-ID database patient 1 RR (Right)
In the second scenario, data were physically collected from an actual male patient using the AD8232 device. The patient was 37 years old and did not have a history of heart disease. The ECG of the patient is shown in Fig. 11. The proposed system detected all 25 QRS complexes with 100% accuracy, as shown in Tab. 2. The RR normality of the patient was in the normal range in all 25 QRS complexes. The current heart rate of the patient was normal except in the first QRS complex because this was the first reading of the AD8232 sensor. However, the average heart rate after the first QRS complex started to drop rapidly to meet the current heart rate, as shown in Fig. 12 left. The rhythm was irregular in the first four QRS complexes because of the first heart rate reading of the system. Then, it changed to the regular level in the rest of the test (Tab. 2). The current RR is consistent with the average RR in all QRS complexes except for the first few complexes because of the first reading of the sensor. Fig. 12 right shows the relationship between the current RR and the average RR.

Figure 11: Real-time data from AD8232

Figure 12: Heart rate from AD8232 (Left). RR from AD8232 (Right)

In this section, the proposed technique and other techniques reported in the literature are compared. Many of the system designs in the related works can only accept either benchmark data or real-time data. In the proposed system, the design is developed to accept both types of data, providing greater flexibility and reliability. Most of the methods reported in the literature do not involve cloud storage or use a private web server for storage. This will lead to questionable reliability of the system. By contrast, the proposed system uses an IoT cloud system that can analyze stored data for further analysis. Moreover, this system uses a well-designed GUI that is user-friendly, whereas many of the previous techniques do not use a GUI or use a basic GUI with limited options. The proposed system data can be accessed via multiple platforms, including web, smartphone, and PC. Additionally, it can have different interfaces for patients and doctors. The system has an alert mechanism that is triggered if a certain threshold is reached. The resolution of the data is 12-bit for a more accurate representation. Tab. 3 shows a comparison between the proposed technique and some of the techniques previously reported in the literature.

The output of the IoT device is transferred to an IoT cloud service called Ubidots for further analysis. Ubidots is an IoT service that is reliable since it has been tested and evaluated for functionality and scalability by thousands of applications. Using this service is much better than building a cloud system including a GUI from scratch, which requires hundreds of functionality and scalability tests. Moreover, the service has a fully customized GUI and functions using HTML and JavaScript. The implementation of the proposed system was tested on the PhysioNet ECG-ID database and real-time data. To obtain an accurate reading from the AD8232, five readings for the ECG values are reported to the cloud per second, f = 1/5 = 0.2 s. The proposed system provides the doctor with all necessary data, such as average heart rate, average RR, RR normality, and rhythm. When the condition of Eq. (8) is met, the value of RR normality is changed to 1, and then, a warning message is sent. Similarly, for rhythm, if the condition of Eq. (10) is met, the value of rhythm is changed to 1, and then, a warning message is sent. This information is calculated and analyzed on the cloud to reduce the number of uploaded data since Ubidots is a service that calculates the number of variable updates to the cloud as dots and then charges the subscriber based on his or her usage. Fig. 13 shows an overview of the system dashboard.
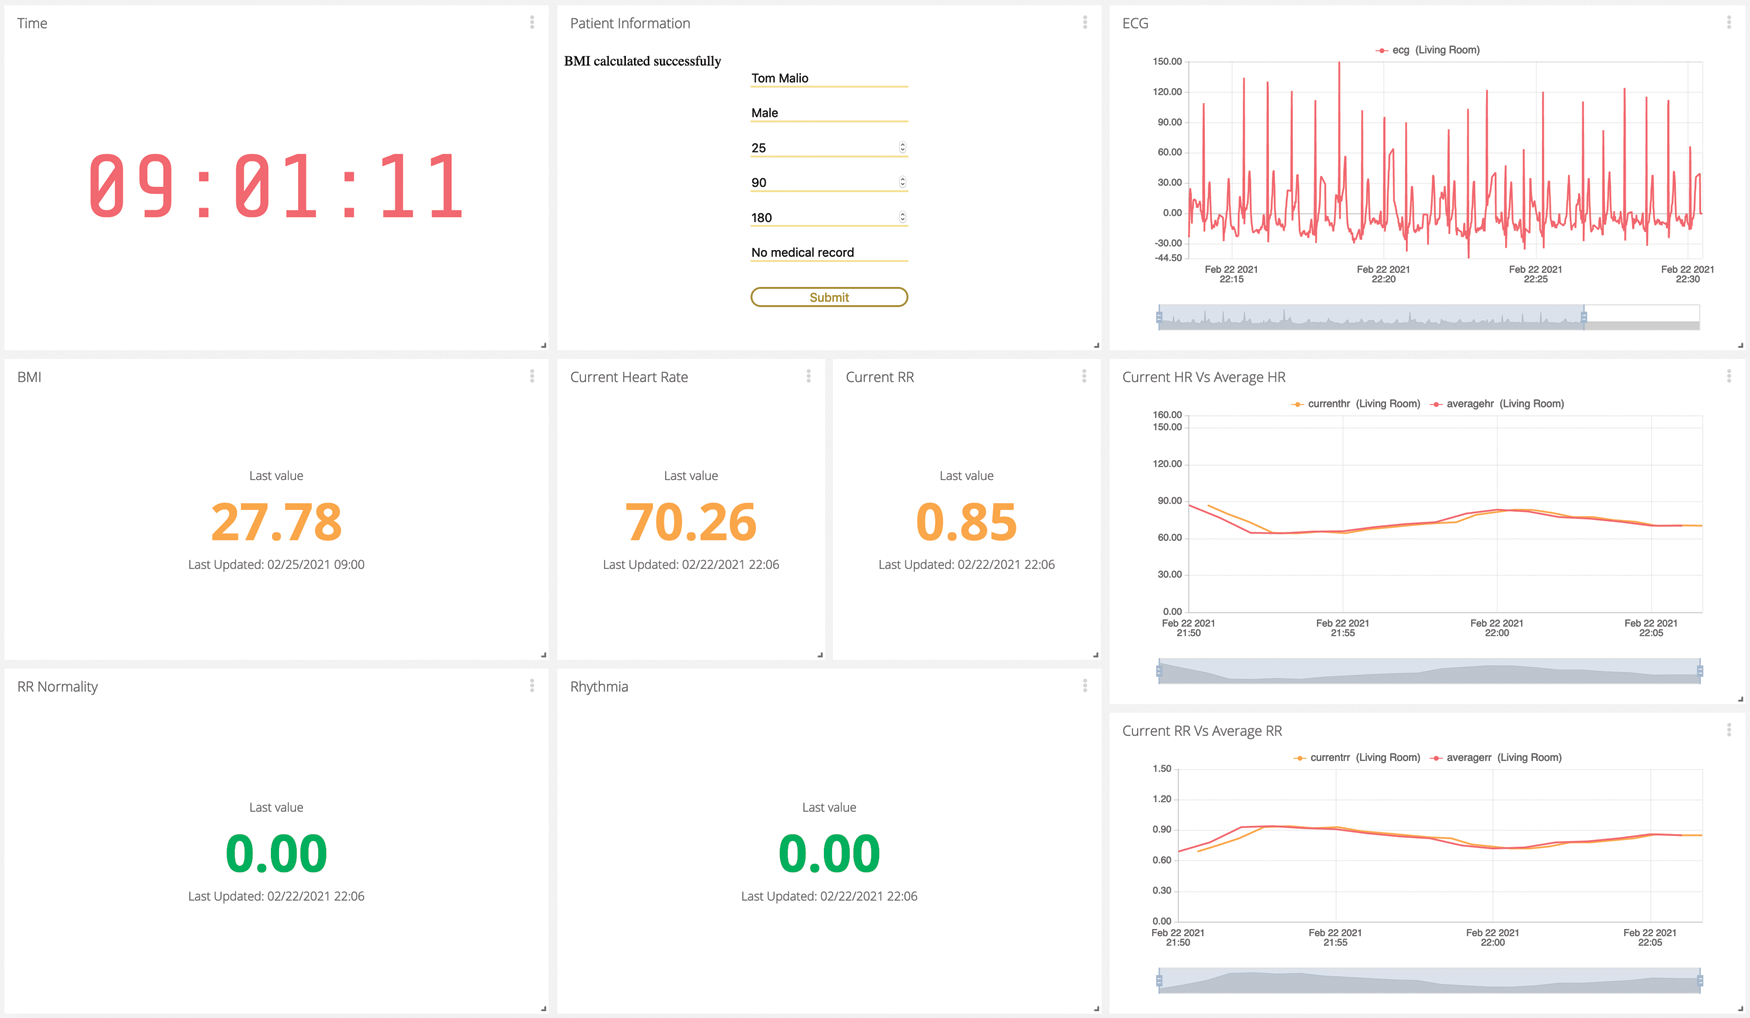
Figure 13: Proposed system dashboard
The dashboard has eight main parts: patient information, ECG reading, current heart rate, current RR, average heart rate, average RR, normality, and rhythm. In the patient information section, when the desired information is added, the label disappears and is replaced by the actual information. For example, in the first box, the system asks the user to add the patient’s name; once the user starts to type, the label disappears and is replaced by the actual patient’s name. Moreover, the system can provide additional information such as Body Mass Index (BMI). If the RR normality or rhythm are irregular, the system sends a warning e-mail to the patient’s clinic, as shown in Fig. 14.

Figure 14: Example of a warning email when a patient has an irregular value
The proposed system provides a complete solution for patients who have difficulties visiting the hospital regularly. The hardware of the solution is portable, small, and compact. The system monitors and analyzes the ECG signal of a patient and uploads all data to an IoT cloud for further analysis. The data can be accessed by the patient and doctor for greater usability. Moreover, the system has an alert mechanism that sends notifications when a certain threshold is exceeded. The system was tested on the ECG-ID database and real-time data. The results show that the system performs reliably and can help reduce the number of visits to hospitals when the condition of the patient is stable. The proposed system was compared to several other systems previously reported in the literature. The proposed system has a professional graphical user interface, uses a cloud with analysis capabilities, and can address two types of data sources, unlike many systems reported in the literature, which lack at least one of these features. In future work, a pilot study can be conducted on several patients to demonstrate the scalability of the proposed system.
Funding Statement: The author received no specific funding for this study.
Conflicts of Interest: The authors declare that they have no conflicts of interest to report regarding the present study.
1. R. K. Pathinarupothi, P. Durga and E. S. Rangan, “Iot-based smart edge for global health: Remote monitoring with severity detection and alerts transmission,” IEEE Internet of Things Journal, vol. 1, pp. 2449–2462, 2018. [Google Scholar]
2. P. P. Ray, “Internet of things based physical activity monitoring (PAMIoTAn architectural framework to monitor human physical activity,” in Proc. of IEEE CALCON, Kolkata, pp. 32–34, 2014. [Google Scholar]
3. G. Xu, “Iot-assisted ECG monitoring framework with secure data transmission for health care applications,” IEEE Access, vol. 8, pp. 74586–74594, 2020. [Google Scholar]
4. M. S. S. Ramos, J. M. Carvalho, A. J. Pinho and S. Brás, “On the impact of the data acquisition protocol on ECG biometric identification,” Sensors, vol. 21, pp. 4645, 2021. [Google Scholar]
5. S. Karpagachelvi, M. Arthanari and M. Sivakumar, “ECG feature extraction techniques: A survey approach,” arXiv preprint arXiv:1005.0957, 2010. [Google Scholar]
6. R. E. Wagner, H. P. da Silva and K. Gramann, “Validation of a low-cost electrocardiography (ECG) system for psychophysiological research,” Sensors, vol. 21, pp. 4485, 2021. [Google Scholar]
7. L. Da Xu, W. He and S. Li, “Internet of things in industries: A survey,” IEEE Transactions on Industrial Informatics, vol. 10, pp. 2233–2243, 2014. [Google Scholar]
8. R. Van Kranenburg, “Ambient intelligence and its promises,” in The Internet of Things: A Critique of Ambient Technology and the All-seeing Network of RFID. Amsterdam, Netherlands: Institute of Network Cultures, Chapter One, 2008. [Google Scholar]
9. S. Prabavathy, K. Sundarakantham and S. S. M. Shalinie, “Design of cognitive fog computing for intrusion detection in internet of things,” Journal of Communications and Networks, vol. 20, pp. 291–298, 2018. [Google Scholar]
10. C. C. Liao, T. S. Chen and A. Y. Wu, “Real-time multi-user detection engine design for IoT applications via modified sparsity adaptive matching pursuit,” IEEE Transactions on Circuits and Systems I: Regular Papers, vol. 66, pp. 2987–3000, 2019. [Google Scholar]
11. O. Vermesan, P. Friess, P. Guillemin, S. Gusmeroli, H. Sundmaeker et al., “Internet of things strategic research roadmap,” Internet of Things-Global Technological and Societal Trends, vol. 1, pp. 9–52, 2011. [Google Scholar]
12. S. Shen, L. Huang, H. Zhou, S. Yu, E. Fan et al., “Multistage signaling game-based optimal detection strategies for suppressing malware diffusion in fog-cloud-based IoT networks,” IEEE Internet of Things Journal, vol. 5, pp. 1043–1054, 2018. [Google Scholar]
13. A. Al-Fuqaha, M. Guizani, M. Mohammadi, M. Aledhari and M. Ayyash, “Internet of things: A survey on enabling technologies, protocols, and applications,” IEEE Communications Surveys & Tutorials, vol. 17, pp. 2347–2376, 2015. [Google Scholar]
14. E. Park, J. Lim, B. C. Park and D. Kim, “Iot-based research equipment sharing system for remotely controlled two-photon laser scanning microscopy,” Sensors, vol. 21, pp. 1533, 2021. [Google Scholar]
15. A. Al-Fuqaha, M. Guizani, M. Mohammadi, M. Aledhari and M. Ayyash, “Internet of things: A survey on enabling technologies, protocols, and applications,” IEEE Communications Surveys Tutorials, vol. 17, pp. 2347–2376, 2015. [Google Scholar]
16. Ubidots, “Ubidots MQTT API reference,” 2020. [Online]. Available: https://ubidots.com/docs/hw/#response-codes. [Accessed 2021]. [Google Scholar]
17. W. H. Liao, B. Dande, C. Y. Chang and D. S. Roy, “MMQT: Maximizing the monitoring quality for targets based on probabilistic sensing model in rechargeable wireless sensor networks,” IEEE Access, vol. 8, pp. 77073–77088, 2020. [Google Scholar]
18. A. Vishwanatham, N. Ch, S. Abhishek, S. Sanagapati, S. Mohanty et al., “Smart and wearable ECG monitoring system as a point of care (POC) device,” in 2018 IEEE Int. Conf. on Advanced Networks and Telecommunications Systems (ANTS), Indore, India, pp. 1–4, 2018. [Google Scholar]
19. N. Clark, E. Sandor, C. Walden, I. S. Ahn and Y. Lu, “A wearable ECG monitoring system for real-time arrhythmia detection,” in 2018 IEEE 61st Int. Midwest Symp. on Circuits and Systems (MWSCAS), Ontario, Canada, 2018. [Google Scholar]
20. M. Bravo-Zanoguera, D. Cuevas-González, J. P. G. Vazquez, R. L. Avitia and M. A. Reyna, “Portable ECG system design using the AD8232 microchip and open-source platform,” Multidisciplinary Digital Publishing Institute Proceedings, vol. 42, pp. 49, 2019. [Google Scholar]
21. A. Rahman, T. Rahman, N. H. Ghani, S. Hossain and J. Uddin, “Iot based patient monitoring system using ECG sensor,” in 2019 Int. Conf. on Robotics, Electrical and Signal Processing Techniques (ICREST), Dhaka, Bangladesh, 2019. [Google Scholar]
22. R. Hodrob, M. Obaid, A. Mansour, A. Sawahreh, M. Naghnagheah et al., “An IoT based healthcare using ECG,” in 2020 21st Int. Arab Conf. on Information Technology (ACIT), Giza, Egypt, 2020. [Google Scholar]
23. T. Shaown, I. Hasan, M. M. R. Mim and M. S. Hossain, “Iot-based portable ECG monitoring system for smart healthcare,” in 2019 1st Int. Conf. on Advances in Science, Engineering and Robotics Technology (ICASERT), Bangladesh, 2019. [Google Scholar]
24. A. Rehman, N. A. Saqib, S. M. Danial and S. H. Ahmed, “ECG based authentication for remote patient monitoring in IoT by wavelets and template matching,” in 2017 8th IEEE Int. Conf. on Software Engineering and Service Science (ICSESS), Beijing, China, 2017. [Google Scholar]
25. Z. Xing Zhong, A. J. Michael, Z. Jie Lun and D. Hong Yue, “ECG classification using machine learning techniques and smote oversampling technique,” in 2020 2nd Int. Conf. on Image Processing and Machine Vision, Bangkok, Thailand, 2020. [Google Scholar]
26. A. F. Ghifari and R. S. Perdana, “Minimum system design of the IoT-based ECG monitoring,” in 2020 Int. Conf. on ICT for Smart Society (ICISS), Bandung, Indonesia, 2020. [Google Scholar]
27. M. Bansal and B. Gandhi, “Iot & big data in smart healthcare (ECG monitoring),” in 2019 Int. Conf. on Machine Learning, Big Data, Cloud and Parallel Computing (COMITCon), Faridabad, India, 2019. [Google Scholar]
28. J. Pan and W. J. Tompkins, “A real-time QRS detection algorithm,” IEEE Transactions on Biomedical Engineering, vol. 3, pp. 230–236, 1985. [Google Scholar]
29. S. S. Prayogo, Y. Mukhlis and B. K. Yakti, “The use and performance of MQTT and CoAP as internet of things application protocol using NodeMCU ESP8266,” in 2019 Fourth Int. Conf. on Informatics and Computing (ICIC), Semarang, Indonesia, 2019. [Google Scholar]
30. G. Suprianto and W. Wirawan, “Implementation of distributed consensus algorithms for wireless sensor network using NodeMCU ESP8266,” in 2018 Electrical Power, Electronics, Communications, Controls and Informatics Seminar (EECCIS), Batu, Indonesia, 2018. [Google Scholar]
31. A. S. Prasad and N. Kavanashree, “ECG monitoring system using AD8232 sensor,” in 2019 Int. Conf. on Communication and Electronics Systems (ICCES), Coimbatore, India, 2019. [Google Scholar]
 | This work is licensed under a Creative Commons Attribution 4.0 International License, which permits unrestricted use, distribution, and reproduction in any medium, provided the original work is properly cited. |