DOI:10.32604/iasc.2022.023783
| Intelligent Automation & Soft Computing DOI:10.32604/iasc.2022.023783 | |
| Article |
VANET: Optimal Cluster Head Selection Using Opposition Based Learning
Department of Computer Technology, Anna University–MIT Campus, Chennai, 600044, Tamilnadu, India
*Corresponding Author: S. Aravindkumar. Email: saravind123@gmail.com
Received: 21 September 2021; Accepted: 19 November 2021
Abstract: Traffic related accidents and route congestions remain to dwell significant issues in the globe. To overcome this, VANET was proposed to enhance the traffic management. However, there are several drawbacks in VANET such as collision of vehicles, data transmission in high probability of network fragmentation and data congestion. To overcome these issues, the Enhanced Pigeon Inspired Optimization (EPIO) and the Adaptive Neuro Fuzzy Inference System (ANFIS) based methods have been proposed. The Cluster Head (CH) has been selected optimally using the EPIO approach, and then the ANFIS has been used for updating and validating the CH and also for enhancing the data transmission procedures. The dijkstra’s algorithm has been used for identifying the shortest path for data transmission. The results showcases that the proposed technique has attained the maximum Packet Delivery Ratios (PDRs) as 73.23% at a sensor radius of 130 m and 70.42% at a velocity of 10 km/h. Moreover, the proposed method has outperformed the existing technique in terms of the CH formation delay, the end to end delay and the PDR.
Keywords: Vehicular Ad hoc NETworks (VANET); Enhanced Pigeon Inspired Optimization (EPIO); Adaptive Neuro Fuzzy Inference System (ANFIS); Cluster Head (CH)
According to the 2016 United Nations Census Report, the population of the cities is greater than that of the pastoral areas for the first time in human history. Currently 54.5% of the world’s population is living the in urban regions and by 2030 it is expected that 60% of the world’s population will subsist in the metropolitan regions [1]. This raises the number of vehicles in the urban areas. The increasing number of vehicles leads to traffic congestion. Traffic congestion, in particular, is a serious crisis in all the urban areas [2]. Millions of people waste hours in traffic every day. Overall, vehicle emissions are a major source of air pollution and global warming [3]. Due to accidents, traffic congestion has increased [4] and according to the survey, there are repeated cross-sectional accidents that lead to brutal punishments [5]. To solve these problems, traffic congestion must be properly managed. Traffic management at road junctions is a multifarious constraint. In the recent years, Computational Intelligence (CI) works on a set of bio-inspired computational methods and techniques. Also, CI has been used for finding the vehicle moving directions and congestion alleviations in the study [6]. Moreover, by incessant improvement of the wireless communication technology and the embedded methodology, the Intelligent Transportation System (ITS) is now turning out to into a hot investigation field in the current years. More than years, the attention in the Internet of Things (IoT) networks is now improving significantly. More specially, a huge compact of hubs are now being located on the VANETs [7]. As special MANET (Mobile Ad hoc NETworks), VANET has turned out to be an essential part of the ITS [8]. Also, a VANET can enhance the flow of traffic for assisting smart hauling and for affording suitable data services. It launches connections among the neighboring vehicles and also among the vehicles and the roadside units [9]. The message in a vehicular network can be categorized into the Vehicle to Vehicle (V2V) and the Vehicle to Infrastructures (V2I) types [10]. The Dedicated Short-Range Communication (DSRC) appears to be an individual consistent such as a de-facto protocol in VANETs for sustaining both the Vehicle to Vehicle (V2V) communications and the Vehicle to Infrastructure (V2I) based communications. The On-Board Unit (OBU) and the Road-Side Unit (RSU) are the two main message devices that appear to be the predetermined roadside installations and mobile devices fitted to the vehicles [11,12]. Moreover, VANET can assist in the reduction of traffic accidents at the intersections by means of sending caveat messages to the vehicles. But, the performance of the VANETs needs to be improved for ensuring the proper transmission of the messages; especially the security messages are to be delivered appropriately to the concerned targets. VANETs are exaggerated by problems such as self authenticity and communication consistency when the vehicle nodes communicate information with the new nodes [13]. The other key problems in VANETs are high mobility, constraint of road method, numerous topology deviations, botched network relations, and appropriate message of information that makes routing of packets difficult [14].
Moreover, by means of influencing the 5G enabled Vehicular Ad hoc NETwork (5G-VANET), it can be broadly acknowledged that the associated vehicles possess capabilities in enhancing the road safety levels, transportation intelligence and assists in the vehicle distraction experiences. The numerous enabling applications in 5G-VANET rely on proficient content distribution between mobile vehicles that appears to be an extremely demanding problem due to the existence of huge data volume, fast changing topology, and unbalanced traffic volumes [15]. Propagation is a main emergency service of VANET as the number of vehicles increases each and every day. Due to the increased density of vehicles, it is required to transmit the crisis communication to every vehicle for evading the problems related to traffic jams and vehicle accidents. To overcome this, a hierarchical network organization has been proposed as a replacement of the flat network organization; here the vehicles would be divided into several virtual groups called as the clusters. Vehicles in a similar cluster can openly communicate with its head vehicle through an intra-cluster message, whereas the inter-cluster message could be attained by the head vehicles [16]. The speed of the vehicles attains a small period of time period unlock for transmitting messages among the vehicles. When the traffic density on the road appears to be high, the vehicles would produce close-up messages that can overload the channel. The result would be channel congestion that would lead to packet losses. The packet loss within the configuration appears to be significant for many VANET applications, including major emergency alarm methods. This raises the bar for wealth and undermines the management of the VANETs. Various techniques have been proposed for decreasing van congestions based on the CH generation delay, the completion delay, and the packet delivery rate. Therefore, the following contributions have been made as follows:
Initially, the concerned vehicles would be clustered in the network. Therefore, the cluster head would be selected in the beginning using the Enhanced Pigeon Inspired Optimization (EPIO) method. In the proposed EPIO, for enhancing the performance of the PIO, the Opposition based PIO with Cauchy distribution has been adopted and used here. In order to avoid vehicle collisions, the probability of an accident has been presented based on the expected location of a node and thus offers the required premature caveat and the follow-up measures if the probability exceeds a predefined limit value. Subsequent to the structure of the CH, for updating and validating the CH and for improving the data transmission procedures, the ANFIS based prediction model has been proposed here. Also, for improving the data transmission process, the dijkstra’s algorithm has been presented for finding the shortest path. The performance of the proposed approach has been appraised and contrasted with the existing techniques based on the hop by hop aspect in terms of the CH formation delay, the end to end delay and the packet delivery ratio.
The rest of the article has been organized as follows. Section 2 discusses the various related works. The proposed method has been discussed in Section 3. The experimental results and discussions have been described in Section 4. Finally, the paper has been concluded in Section 5.
This section discusses several new traffic management researches on congestion control on VANET. In [17], the Clustering Algorithm using the Traffic Regularity of Buses (CATRB) has been used for improving the cluster stability on the VANET. In this technique, they have considered the location, speed and route of the vehicles for accomplishing the clustering process. They have included an allusion code for the permanent lanes on the motor vehicles in the metropolitan regions. They have elected a cluster leader based on the concept of a regular triangle that appears to be at the same point as the center and circumference. In [18], they had presented a strategy called as the game-theoretic based CIAC (Co-operative Interest-Aware Clustering). The proposed CIAC balances the usage cost by controlling the performance levels of the non supportive vehicles between the vehicles within the clusters and fillips the vehicles to seize the required attention in the procedure of clustering for communicating data and charge. In addition, they had chosen the cluster head based on a strategic game-theoretic method and a fair use strategy. Due to their proposal, they had reduced the behavior of the non supportive vehicles in VANET. In [19], an adaptive method for controlling the congestion rate when generating beacons was expected, abbreviated as Adaptive Beacon Generation Rate (ABGR).
In order to improve the competence of road traffic on VANET the Density-Based Dynamic Cluster (DBDC) was proposed [20]. Using the DBDC method, the peak density of the exact location was determined. In addition, it offered an effective solution to the congestion based problems. They used the average vehicle density threshold for controlling congestion in a cluster. The compilation process started when the peak density was greater than the threshold value. The findings of the paper clearly demonstrated that the cluster attained a greater constancy than expected. In VANET, delay was an important issue that was not focused in the previous work. In [21], they proposed the fuel consumption and the delay aware Traffic Scheduling scheme. Under this approach, a vehicle interacts with a new vehicle. It communicates with the road units and collects the data about the reporting area of the vehicles and the number of vehicles. The information was successfully broadcasted exploiting the Coverage Awareness Cluster protocol.
As the road congestion increased, in [22] they had developed a method for improving the data collection, classification, planning, and transmission of the following phases. Under this technique, the traffic data was observed and sent to the Dynamic Traffic Management Center (DTMC) through the sensor nodes. They utilized a vague logic for estimating the section priority of the concerned road. Data packets were sent to the DTMC by the congestion alarm routing algorithm. Due to the expected pattern, the waiting time of the vehicle had been reduced here. In [23], they had presented a Webster based signal model for computing the intersection delays. The results of the research proved that the Webster model enhanced the accuracy of the traffic delay by estimating more than the conventional ones. In [24] the Pigeon Inspired Optimization (PIO) approach based on a bio-inspired swarm intelligence optimizer was proposed. The mathematical model of the PIO and the meticulous execution process were provided. The map and the compass operator model had been used here based on the sun and the magnetic fields, whereas the landmark operator model was designed based on the identities. Various performance metrics had been used for measuring the Quality of Service (QoS), in terms of the end-to-end delay, the packet delivery ratio and the cluster head formation delay.
In our proposal, an Enhanced Pigeon Inspired Optimization (EPIO) approach and an Adaptive Neuro-Fuzzy Inference System (ANFIS) based methodologies have been presented for enhancing the traffic management and the data transmission procedures in VANET. The architecture of the proposed scheme for traffic management using the EPIO and the ANFIS techniques through VANET has been illustrated in Fig. 1. Initially, the vehicles in the network would be divided into several zones for effective traffic management. Each zone would then be considered as a cluster. Therefore, the Cluster Head (CH) here is chosen optimally using the EPIO approach. For avoiding the collision of vehicles, a collision probability would be observed at the origin of a node’s probable state. While the probability exceeds the predefined threshold, the CH would transmit an early warning and provide the required guidelines for avoiding the collision. The vehicles of the VANET possesses dynamic behaviors, therefore the ANFIS based prediction model has been used for predicting the CH at every particular instance of time interval for effective traffic management and data transmission. In addition, for improving the data transmission between the nodes, the shortest path has been selected using the dijkstra’s algorithm.
3.2 Zone Division and Initial Formation of Cluster
In our proposal, a dynamic zone clustering method has been employed in VANET. For enhancing the traffic management in VANET, vehicles in a particular area have been divided into eight zones. Each zone has been considered as a cluster here. Clusters are virtual groups in VANET that can be organized by the CH and the clustering algorithm. Every cluster in the VANET zone would possess a CH and a list of Cluster Members (CMs). Here, CMs refer to the vehicles of each cluster.
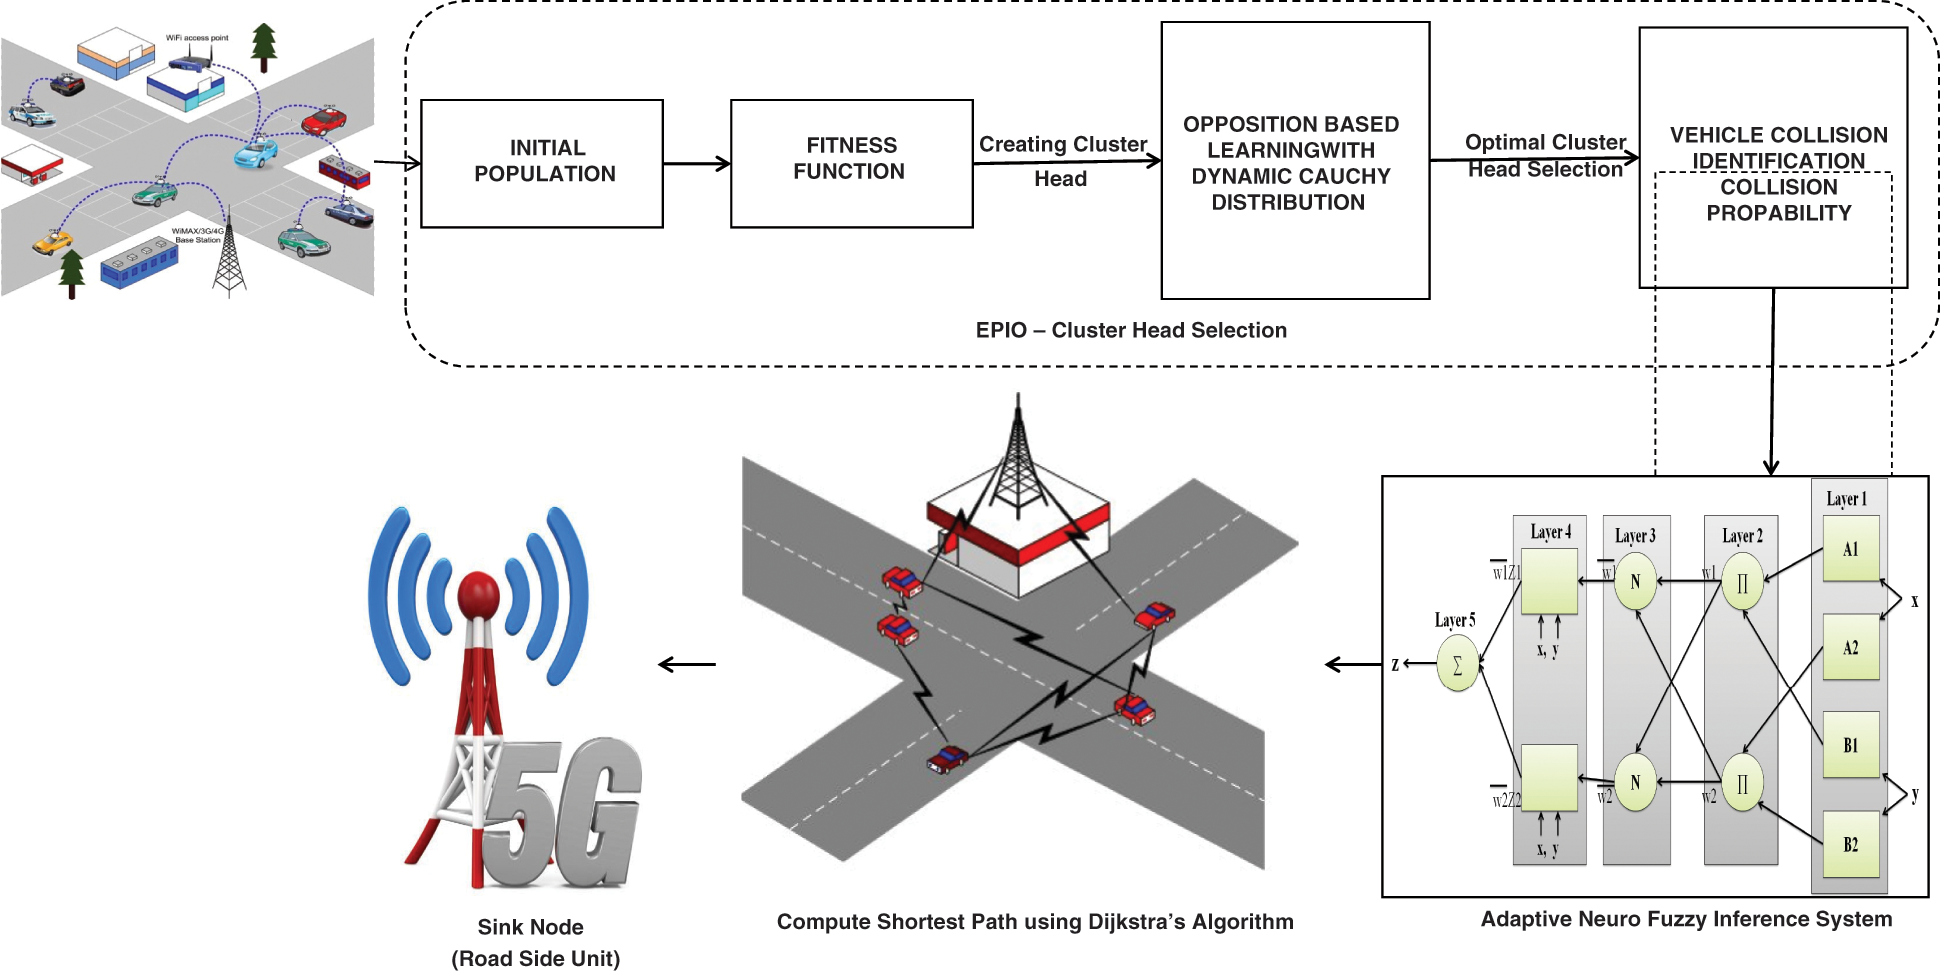
Figure 1: Proposed architecture for the cluster head selection using an Enhance Pigeon Inspired Optimization, and for validating and updating the cluster head using an Adaptive Neuro-fuzzy Inference System in VANET for efficient data transmission
The cluster head has been selected in each zone based on the dynamic zone based clustering methodology. The PCH (Percentage of Cluster Head) estimation process has been used here for avoiding data congestion. In each zone the vehicles have been divided initially for estimating the maximum buffer size. This is then followed by the computation of the distance between the source and the sink nodes in each of the individual zones. For example: the node nearest to the sink node possessing a higher percentage would be opted as a cluster head for avoiding data congestion. Therefore, the CH has been selected based on the various parameters like: node location (vehicle location), velocity and buffer size based on the PCH as the CH should possess a higher stability among its neighboring vehicles. To choose the CH optimally, the EPIO technique has been deployed.
The fitness function
where, v represents the velocity of the vehicles due to the increasing number of vehicles, it is inversely proportional, p indicates the location distance, w1, w2 and w3 represent the co-efficient, b represents the buffer size of each of the vehicles and w represents the weight of the final value based on the clustering process.
3.5 Selection of Optimal Cluster Head Using Proposed EPIO Algorithm
In our proposed EPIO algorithm, the opposition based PIO technique with Cauchy distribution has been implemented. Here, the Opposition Based Learning (OBL) has been used for enhancing the performance of the conventional PIOA and the dynamic Cauchy probability distribution has been used as a mutation operator. The process of selecting the optimal cluster head has been discussed as follows:
3.5.1 Mathematical Model of PIO
The PIO algorithm has been offered with reference to the magnetic field and sun, map and compass based operator models. The Landmark operator model has been offered based on its identities. In order to idealize the various incoming characteristics of the pigeons, two operators have been constructed based on a certain defined set of procedures:
The Map and compass operator: Pigeons could perceive the earth’s field by utilizing the magnets for creating a map in its brain. They tend to assume the height of the sun for adjusting the direction of the compass. As they fly towards their target, they would become less dependent on the sun and the magnetic particles. In the PIO model, virtual pigeons have been employed naturally. In this map and compass operator, rules have been described with reference to its location Xi and velocity Vi of a pigeon i. Locations and velocities in the D-dimension search space have been modernized in every iteration. Based on the Eqs. (3) and (4), the new position Xi and velocity Vi of a pigeon i at the tth iteration can be computed.
where, Xg is the current global best location, rand is the random number and R is the map and compass factor gained by contrasting the individual locations between the pigeons. Fig. 2a shows the best locations of all the pigeons that have been assured by exploiting the map and compass operator. In contrast with every flying location, it is clear that the right-centered pigeon’s location appears to be the top one. According to Eq. (3), each pigeon can alter their flying route subsequently by this exact pigeon location, it is articulated by broad darts. The thin arrows indicate the preceding flying route that has a relation with the factor Vi (t−1).e−Rt in Eq. (3). The Landmark operator: When the pigeon flies near its target, they would essentially rely on the adjoining signs. If they become aware of the signs, they would fly directly to the end. If they are far away from the target and are not familiar with the symbols, they would follow the pigeons that are aware of the symbols. In the landmark operator, the partial number of pigeons has been lessened by the factor Np in each of the individual generations. Yet, the pigeons would still appear distant from the target and would appear different with different landmarks. Let Xc(t) represent the center point of several pigeon’s location at the tth iteration and consider that the individual pigeons can fly straight to their target. The location modernization rule for the pigeon i at the tth iteration has been obtained by using the Eqs. (5)–(7).
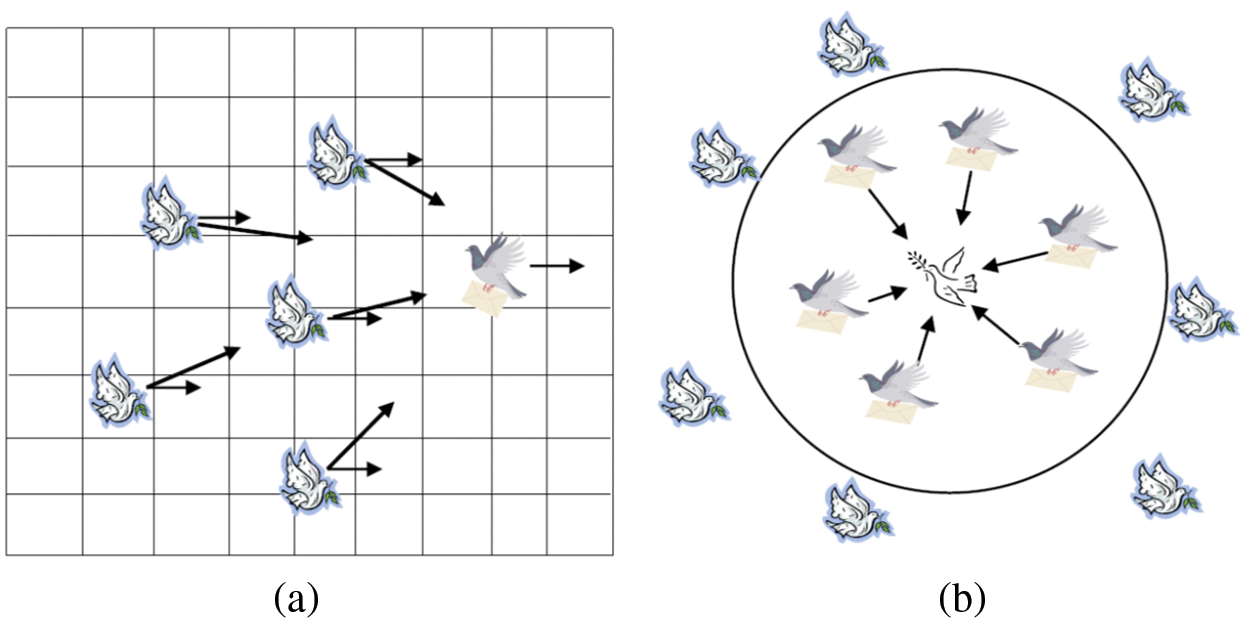
Figure 2: (a) Map and compass operator (b) Landmark operator model
where
Opposition Based Learning (OBL): In OBL, the initial population of the individual methodologies would be approximate and gradual in its subsequent iterations until an optimal solution is reached. The accumulation time of this technique is related to the distance between the initial assumption and the optimal solution. If the choice of the original solution appears to be optimal, then it can be integrated quickly, or else, it would consume longer time durations for accomplishing the integration procedures. One of the best ideas for improving the initial solution by evaluating the existing candidate solution and its counter solution at the same time is to learn from the OBL and select is the one that appears to be more suitable for the initial solution. This is because, according to the probability theory, any predicted solution is 0.5 times larger than its actual solution. This technique would be constructive not only to start the population, but also to develop the ultimate key for the individual iterations. OBL’s is an optimization problem, also at the same time it is capable of estimating the present aspirant solution together with its counter solution.
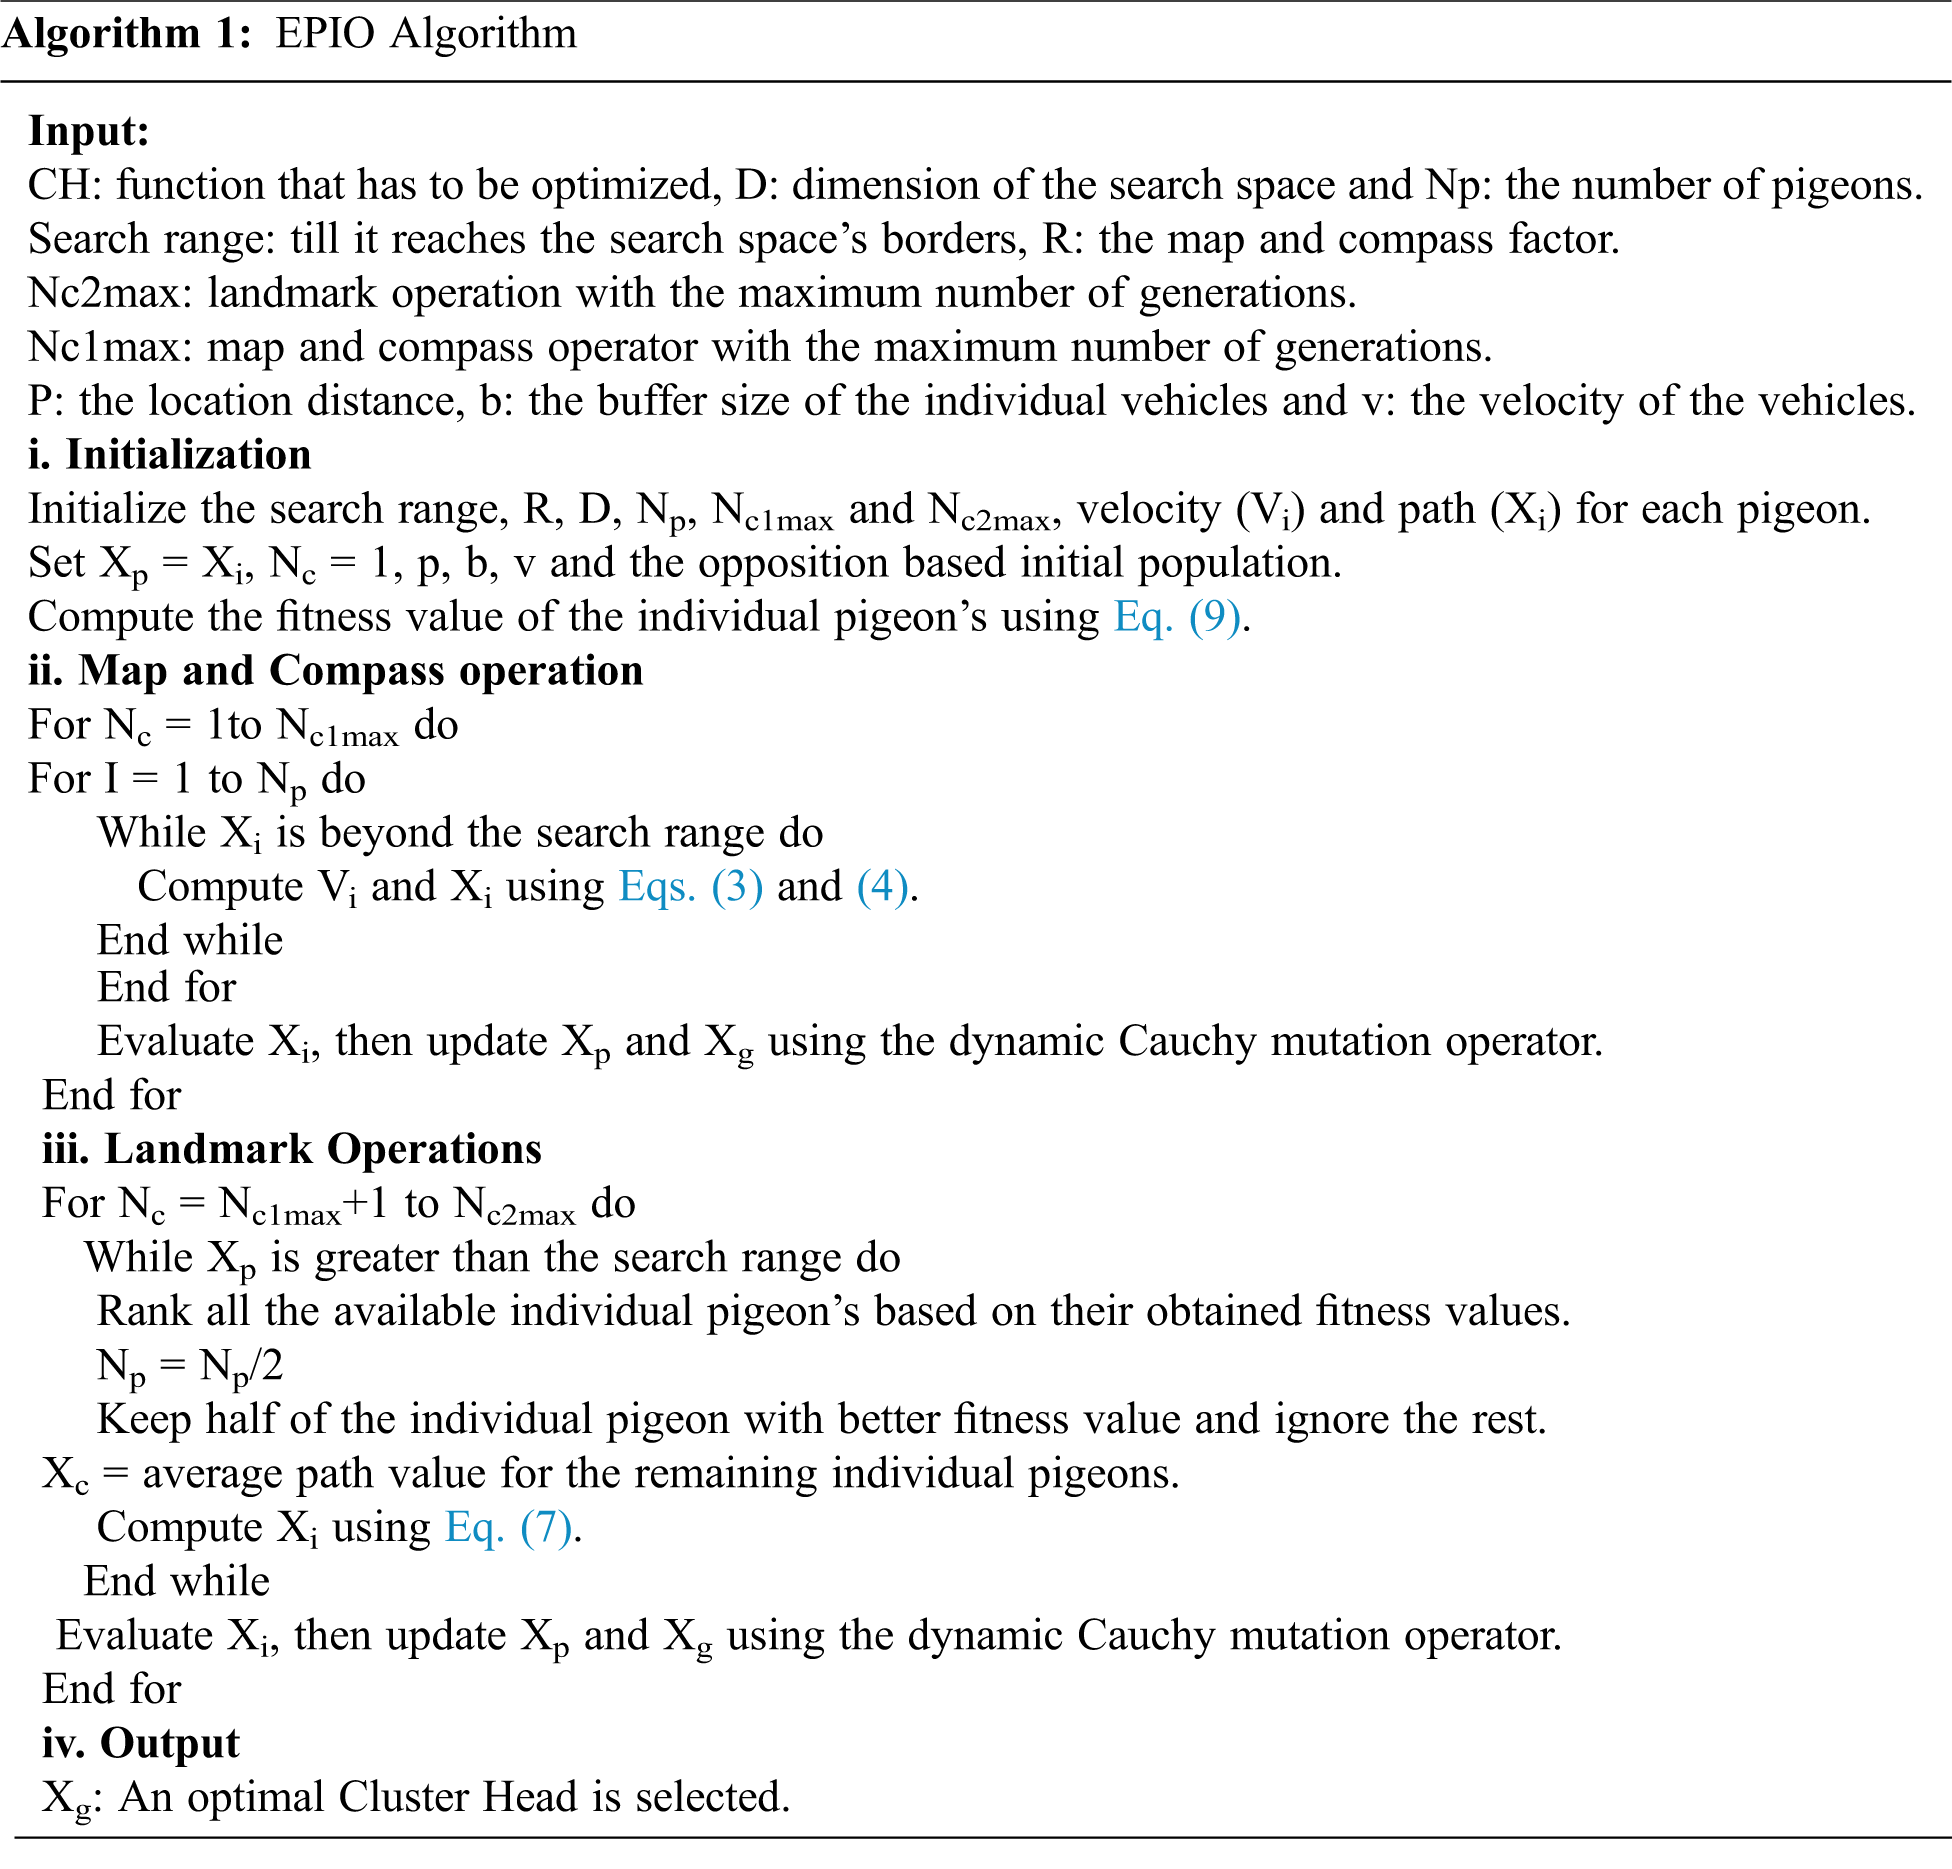
Proposed Enhanced Pigeon Inspired Optimization Algorithm: In our proposed method, the adopted opposition based learning and the dynamic Cauchy distribution improvises the performance of the PIO together with their convergence speed. The meticulous execution procedure of the EPIO in the cluster head selection process is as follows. Also the pseudo code for the EPIO technique for the CH selection has been indicated in algorithm 1.
Step 1: Opposition based initial population: To control the size according to the resistance, the factors ai and bi must be dynamically updated based on the current population search space. This means that the least and the largest values of every dimension in the current population have been inured to compute with the contrary solution as an alternative of the predefined interval limits ([ai, bi]). The dynamic resistance on the other hand can assist the pigeons in identifying the enhanced conditions and speed up levels. The new opposition-based technique has been calculated using Eq. (8).
where Pi,j is the jth location vector of the ith pigeon in the population, OPi,j is the opposite position of Pi,j, apj and bpj are the least and the greatest values of the jth dimension in the current population respectively.
Step 2: Set the parameters of the PIO technique, namely, the number of iterations Nc1max and Nc2max for the two operators is to be set as Nc2max > Nc1max. The map and compass factor indicated by R with the population size Np has the D dimensions of the solution space. Also, start with the location distance, buffer size, and speed of the individual vehicles.
Step 3: Calculate the fitness function using Eq. (2)
Step 4: Every pigeon is set with a randomized path and velocity. By comparing the robustness of the individual pigeons the present preeminent path can be obtained.
Step 5: Function map and compass operator: Initially, the velocity and the path of the individual pigeons can be updated using Eqs. (3) and (4). Fitness can be compared with the upcoming pigeon’s and thus the new preeminent path can be discovered.
Dynamic Cauchy distribution
Different mutation operators have been proposed in the evolutionary optimization literature for enhancing the performance levels by avoiding the pre-integration procedures. Among them, the spread of the Gauss and the Kuchi has become popular. Compared to the Gaussian probability distribution, the Cauchy probability distribution tends to escape the local optimum due to its long-tail probability distribution function. This prompts us to utilize the Cauchy probability distribution as a mutation operator for improving the execution of a regular PIO. In this algorithm, the dynamic Cauchy mutation has been applied on the pigeons for enhancing the performance of the PIO. The one-dimensional Cauchy density function has been denoted by Eq. (10).
where t > 0 is a scale parameter. The Cauchy distributed function can be computed using Eq. (11).
where Ft (x) represents the Cauchy distributed function and x represents the solution of the fitness function. The cause for exhausting such a mutation operator is to raise the probability of evading from a local optimum [25]. The Cauchy mutation operator employed in the EPIOA can be computed using Eq. (12).
where
Step 6: If Nc > Nc1max, end the map and compass operator and run the subsequent operator. Otherwise, go to Step 4.
Step 7: Arrange the pigeons according to its practice values. According to Eq. (5), partially pigeons with high robustness would follow the other pigeons. Then according to Eq. (6), we can obtain the hub of the individual pigeons, this hub thus appears to be the preferred location. All pigeons would flee to the end by altering the flight routes according to Eq. (7). Subsequently, it would store the most excellent key parameters and cost values.
Step 8: if Nc > Nc2 max, end the landmark operator and select the CH. Otherwise, go to Step 6.
After selecting the optimal cluster head using the EPIOA, the vehicle collision is to be avoided. Collision probability has been evaluated due to the node’s predictable state. The generation of the warning message provides guidelines to the vehicles based on this probability. Based on the relative distance and speed with a pair of front and rear nodes the expected state can be represented. The probability of avoiding collision [26] has been computed using Eq. (13).
where ρs is the probability of the number of collisions among the nodes, η is the relative distance among the nodes and vf and vr represents the velocity of the front and the rear node respectively. Eq. (13) has been found to employ the nodes moving on the highway with random speeds that are associated with a set χ containing the predefined speed range. The fraction
where, ρc denotes the collision probability and ρm denotes the maximum collision probability. The proposed method further computes the probability depending on the direction of the nodes. Since highways are bi-directional, at a given time the nodes can move in the opposite directions. The probability of a collision between two or more nodes traveling on the opposite sides of the highway may be higher depending on their relative distance and relative speed (as indicated in Eq. (14)). However, in practice there will be a conflict among them. Therefore, ignoring the direction component in the realistic bi-directional scenarios makes the proposed scheme inefficient. To solve this problem, the Hamming distance has been included for calculating the final collision probability using Eq. (15).
where, k indicates the hamming distance. This determines the problem of imprecision in the probability evaluation for the nearby nodes and also for the nodes moving in the opposite directions. Consider the collision probability derived using Eq. (14) among Node A and C2: CH is 0.9. This is definitely a frightening circumstance regarding the probability attained. Even though the nodes are moving on the opposite directions of the highway, there is no possibility for collision among them. To ensure this, Eq. (15) has been proposed. Therefore, if it attains the value as 0, then the probability of the collision becomes 0.
3.7 Updating and Validation of CH and Enhance the Data Transmission
In the previous step the CH has been selected using the opposition based learning algorithm. After a certain time interval, the CH of the individual zones that plays an important role may be updated and validated correspondingly. Congestion may occur while broadcasting the messages over the VANET channels (i.e., the message channel turns into surpass via communication, and event-driven communications). It has been observed that an increased number of vehicles in the cluster area are endeavoring to transmit concurrently in the impenetrable circumstance. This indeed would reduce the packet delivery ratio and thus congestion may encounter. Therefore, the ANFIS based model has been introduced for updating and validating the CH and for enhancing the data transmission process.
3.7.1 Adaptive Neuro Fuzzy Inference Method Based Prediction Model
The ANFIS is a multi-layer feed-forward network that includes both the terminals and the directional links. The ANFIS model functions with respect to the ambiguous Sugeno model with an adaptive system structure that supports both the learning and the adaptation based procedures. For example, two inputs provided through ‘x’ and ‘y’ with the output ‘z’ have been used for the ambiguous logical inference. Let the rule base have two fuzzy “if-then” rules of the Takagi and the Sugeno’s type [27] and this has been denoted in Eqs. (16) and (17).
Under the Rule 1 and Rule 2, Zi has been observed as the output around the fuzzy area stated by the fuzzy rules, the fuzzy sets have been denoted as Ai and Bi where as pi, ri,and qi represent the acquired design parameters for the training procedures. The ANFIS architecture employs these rules as represented in Fig. 3. The circle indicates the permanent node and the adaptive nodes have been indicated using the square symbols.
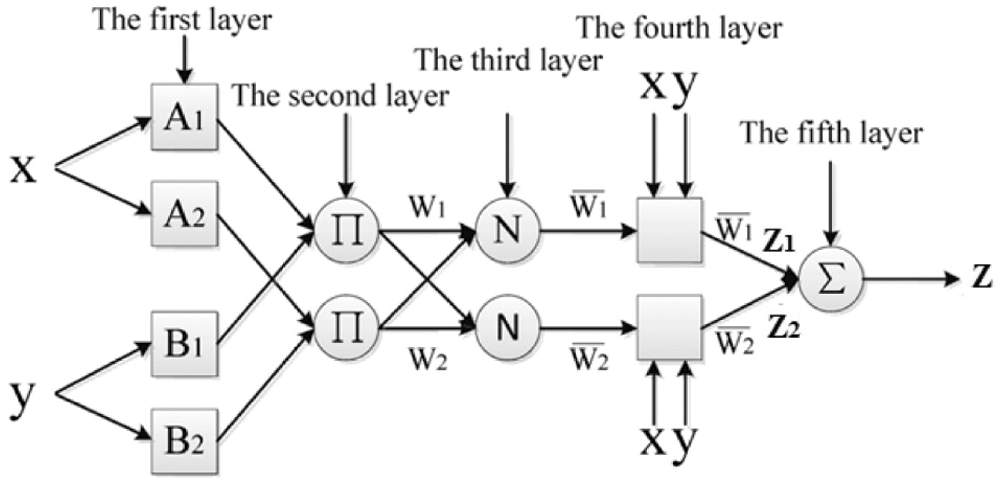
Figure 3: The architecture of the ANFIS model
Here, the ANFIS model has been trained using the grid partition technique. The proposed ANFIS based prediction model predicts the CH based on the inputs such as location distance, velocity and buffer size of the vehicles. For efficient creation of the CH, the ANFIS prediction model has been learned with the samples acquired from the initial EPIOA based clustering algorithm. Therefore, there is no need of any additional training of the ANFIS and is thus trained with respect to the initial node conditions. Based on the training data, the ANFIS can be trained and updated. This updated ANFIS engine has been named as the self learning CH predictor. After certain time interval, the ANFIS based prediction model would predict the particular node as the CH or not. It’s appears to be a rapid process and hence the CH formation delay appears to be less.
After the CH formation and validation, the data transmission from the source to the destination would be accomplished. Therefore, in order to enhance the data transmission between the nodes, the dijkstra’s algorithm can be adopted and utilized for computing the shortest path for the encountered data transmission process. The Dijkstra’s algorithm was initially proposed in the year 1956 by Edsger Dijkstra and published in the year 1959 [28]. The Dijkstra’s algorithm has been represented in the form of a weight matrix whereas every weight number appears to be Wij ≥ 0. By means of utilizing the exploring methodology the path to every point can be traced and labeled accordingly. Specifically, the label comprises of two parts, the first part corresponds to the letter that specifies a symbol in front of that point, this illustrates it residing location. And the second part corresponds to the number; it indicates the distance from the starting point to that of the present location. It could detect the shortest path from the start node to the nearby sink node. Dynamically Evolving Networking (DEN) model was introduced in [29] for solving the dynamic routing problem during mobility. In [30], the microscopic mobility model was deployed with realistic traffic management for solving the dynamic routing problem by incorporating the lognormal model. Initially, the distance between the cluster heads and their velocities were computed. Then, the dijkstra’s algorithm was applied for finding the shortest route for transmitting the data easily and effectively. The dijkstra’s algorithm was considered for both the forward and the backward searching mechanisms with minimum cost. The path was changed for every certain instance of time by the dijkstra’s routing algorithm. Also, when an emergency occurs inside the zone, the message would be sent to the cluster head and then it would flood the information to all the vehicles that are connected to it.
4 Experimental Results and Discussion
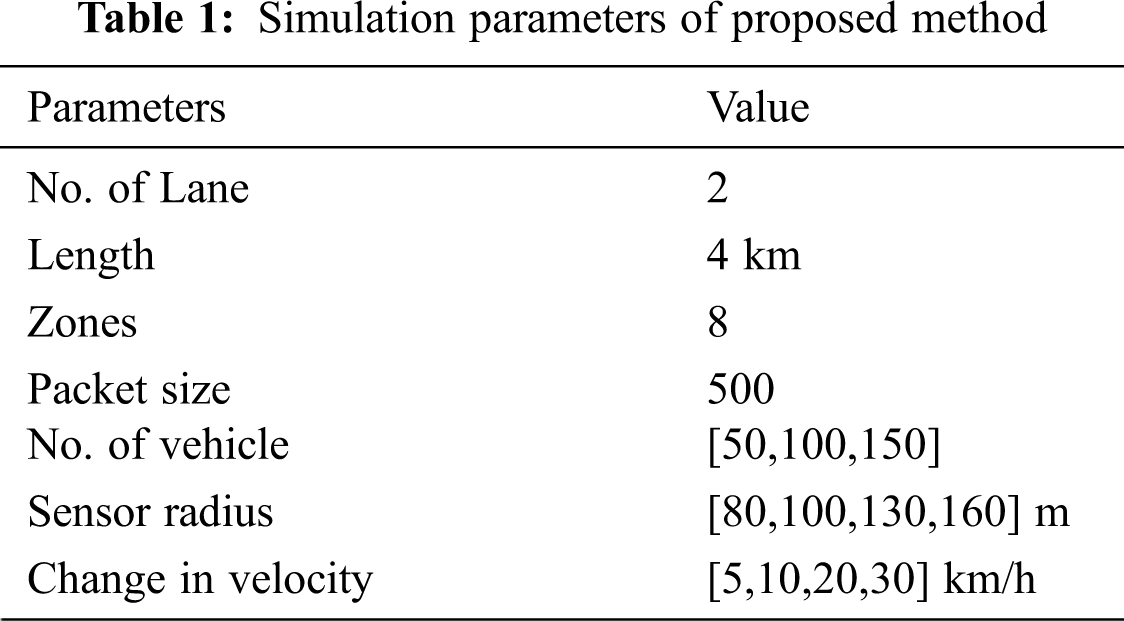
Results of the proposed methodology have been analyzed with different performance metrics like: Packet Delivery Ratio (PDR), end to end delay and Cluster Head (CH) formation delay. Also, the proposed method has been analyzed and contrasted with the existing hop-by-hop technique. Tab. 1 represents the simulation parameter of the proposed method. Performance of the proposed method has been analyzed under two conditions: performance related to the change in velocity and performance related to the change in sensor radius.
The average ratio of successfully received packets at the sink node to the total number of packets generated in the source node.
4.1.2 Average End-to-End Delay:
It is the time variation among the communication data source from the destination. Data transfer between the sources to the destination may be lost due to the node coverage area or their location.
Initially, the CH selection would be done based on the EPIOA based clustering algorithm, after the t-time slot the CH updating or validating procedures would be accomplished based on the ANFIS prediction. This time duration of the CH update is called as the CH formation delay.
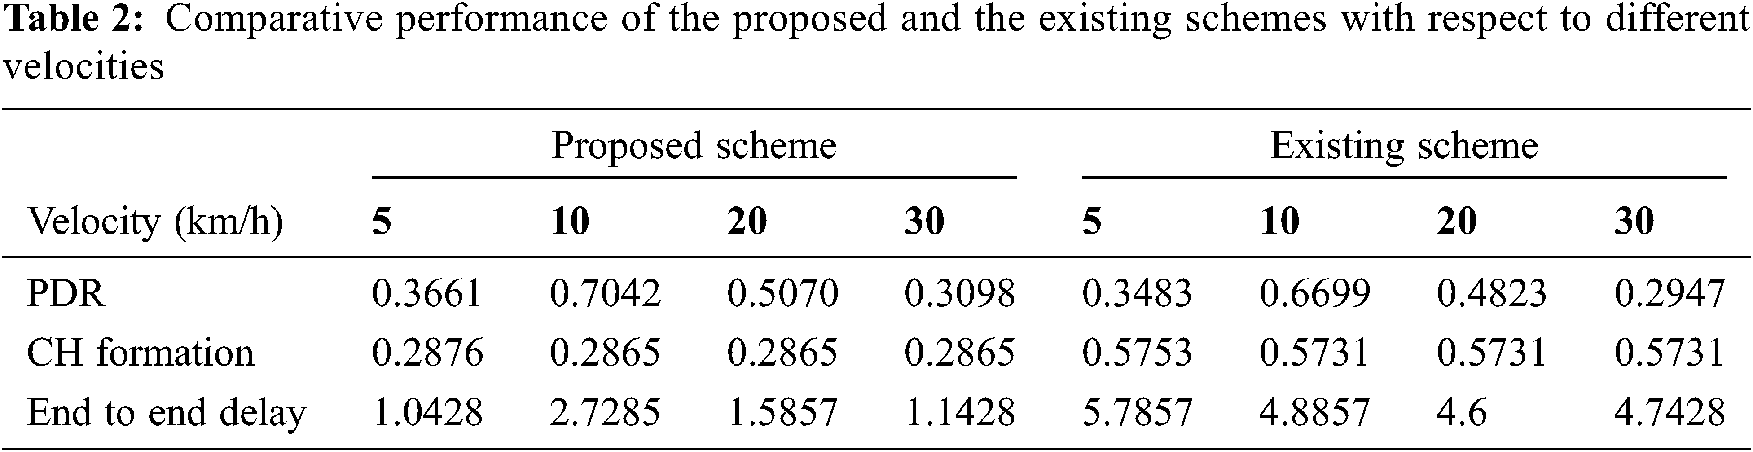
4.2.1 Performance Related to Change in Velocity:
In the first test case, the performance of the proposed method has been analyzed and derived from various velocity levels of the vehicles such as 5, 10, 20, and 30. Tab. 2 illustrates the performance of the proposed and the existing methodologies with respect to the change in their velocity. Fig. 4a represents the performance of the proposed and the existing methodologies in terms of the CH formation delay. As shown in the Fig. 4a, the proposed methodology’s performance level with respect to the CH formation delay has been achieved as 0.2876 ms for a velocity of 5, 0.286560963 ms for a velocity of 10, 0.286553023 ms for a velocity of 20 and, 0.286560743 ms for a velocity of 30. Whereas, the hop-by-hop algorithm based on the existing technique has achieved 0.575368939 ms for a velocity of 5, 0.573121926 ms for a velocity of 10, 0.573106045 ms for a velocity of 20 and, 0.573121487 ms for a velocity of 30. Therefore, from the obtained results the proposed methodology has been observed to perform better than the existing method in terms of the CH formation. This is because the proposed methodology has consumed lesser time durations in the formation of the CH.
Fig. 4b illustrates the performance of the proposed and the existing methodology using the end to end delay metric. As shown in Fig. 4b, the proposed method has consumed minimum time duration for accomplishing the data transmission process using the end to end delay for different velocities such as 5, 10, 15, 20 and for 30 it was 1.042857143, 2.728571429, 1.585714286 and, 1.142857143 ms respectively. Whereas, the existing methodology on the other hand had taken 5.785714286 ms for a velocity of 5, 4.885714286 ms for a velocity of 10, 4.6 ms for a velocity of 20 and 4.742857143 ms for a velocity of 30 correspondingly. Also, when there appears a raise in the velocity value, the end to end delay decreases i.e., the data transfer speed raises. Therefore, the proposed methodology has been observed to perform better than the existing methodology in terms of the end to end delay attribute. Fig. 4c illustrates the performance of the proposed and the existing method in terms of the packet delivery ratio.
4.2.2 Performance Related to Sensor Radius (R):
In the second test case, the performance of the proposed method has been analyzed with different sensor radius. Tab. 3 illustrates the performance of the proposed and the existing techniques with respect to the sensor radius. The performance of the proposed and the existing methods in terms of the CH formation delay has been represented in the Fig. 5a with respect to different sensor radius.
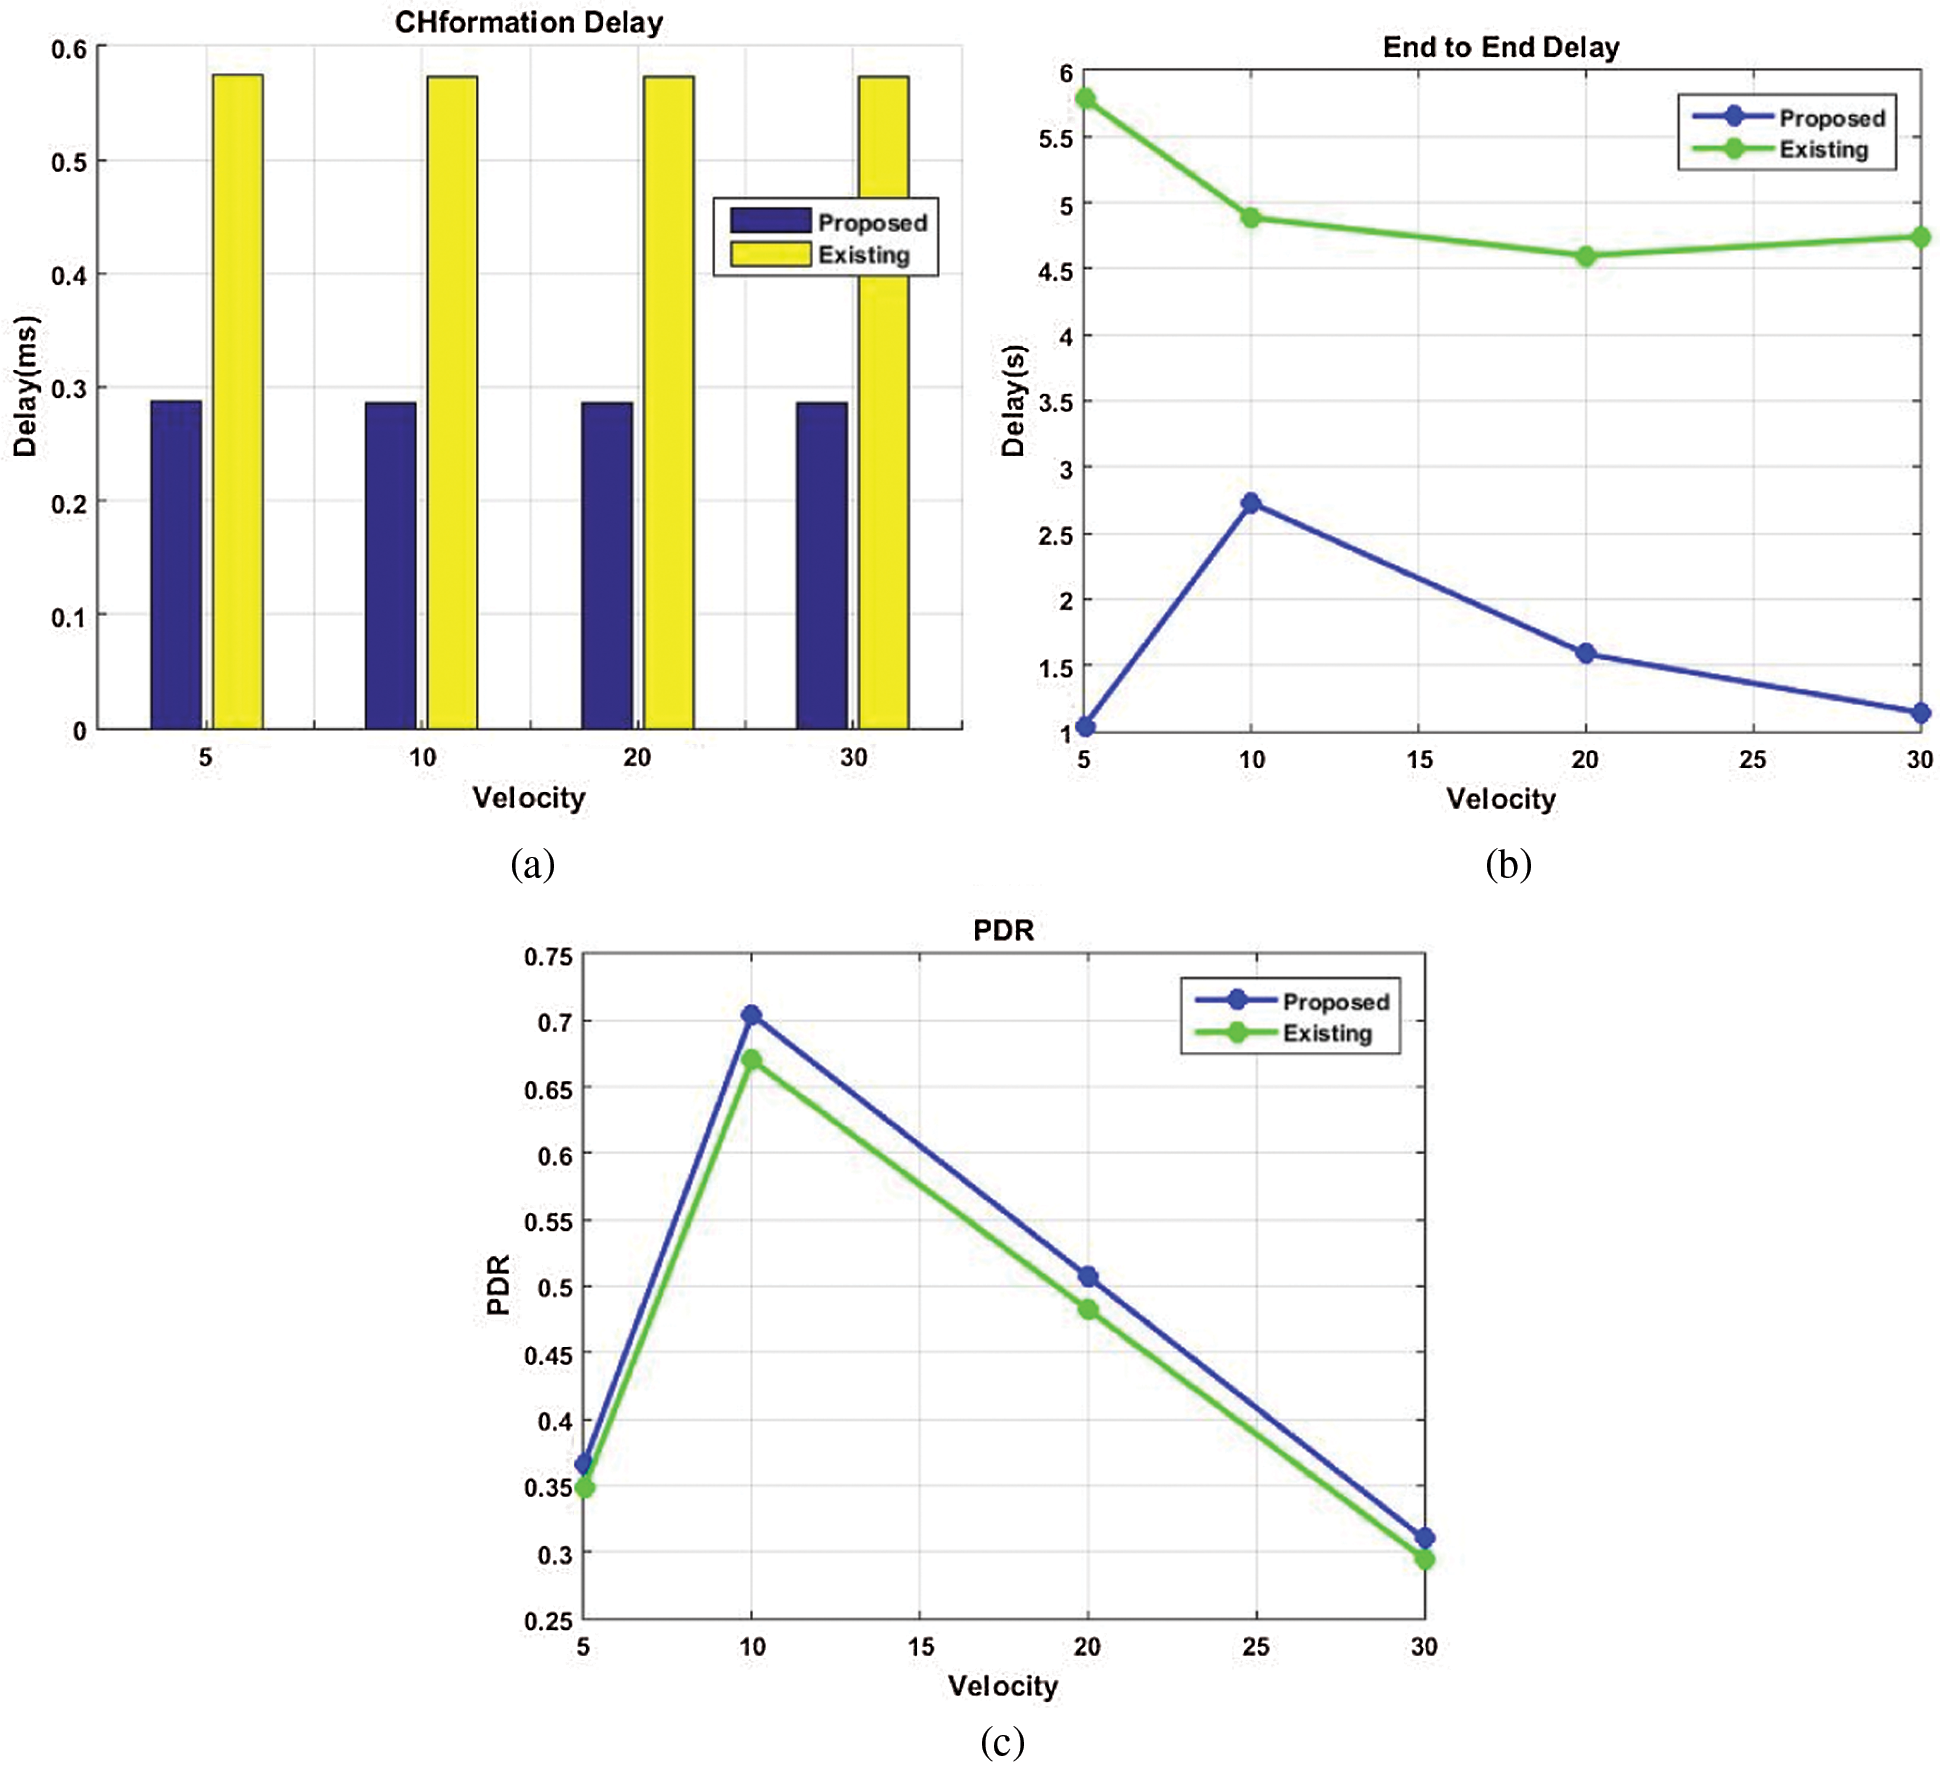
Figure 4: (a) Comparative performance of the proposed and the existing techniques in terms of the CH formation delay with respect to different velocities. (b) Comparative performance of the proposed and the existing techniques in terms of the end to end delay aspect with respect to different velocities. (c) Comparative performance of the proposed and the existing techniques in terms of the PDR factor with respect to different velocities
As shown in Fig. 4c, the proposed methodology achieves the maximum packet delivery ratio as 0.704225352 at a velocity of 10. Similarly for the velocities such as 5, 20 and 30 the methodology has achieved the packet delivery ratios as 0.366197183, 0.507042254 and 0.309859155 respectively. The existing method has achieved the packet delivery ratios as 0.348398701 for a velocity of 5, 0.669997503 for a velocity of 10, 0.482398202 for a velocity of 20 and 0.294798901 for a velocity of 30 correspondingly. In addition to this, the packet delivery ratio decreases with an increase in its velocity. Therefore, from this analysis, when compared with the existing method, the proposed method has been observed to achieve better performance levels in terms of the packet delivery ratio. Fig. 5a represents the CH formation delay performance of the proposed method for different sensor radius such as 80, 100, 130, and 160, this has been observed as 0.287525993 ms, 0.286554477 ms, 0.286564961 ms and, 0.286563588 ms respectively. Whereas the existing technique has attained 0.575051986 ms for a sensor radius of 80, 0.573108955 ms for a sensor radius of 100, and 0.573129923 ms for a sensor radius of 130 and 0.573127176 ms for a sensor radius of 160. From the obtained results it has been found that the proposed method outperforms to the existing techniques in terms of the CH formation delay (i.e., the proposed method has taken less time to form CH).
The performance of the proposed and the existing method for the end to end delay aspect has been illustrated in Fig. 5b with respect to different sensor radius. Fig. 5b represents the performance of the proposed method in terms of the end to end delay aspect and this has been observed to be 0.471428571 ms for a sensor radius of 80, 0.957142857 ms for a sensor radius of 100, 2.485714286 ms for a sensor radius of 130 and, 1.928571429 ms for a sensor radius of 160. While, the existing technique has 3.328571429 ms for a sensor radius of 80, 4.142857143 ms for a sensor radius of 80,5.185714286 ms for a sensor radius of 80 and 5.3 ms for a sensor radius of 160. It can be seen that the proposed method has taken minimum time for accomplishing the data transmission process as the end to end delay value appears to be low during the evaluation of the present technique.
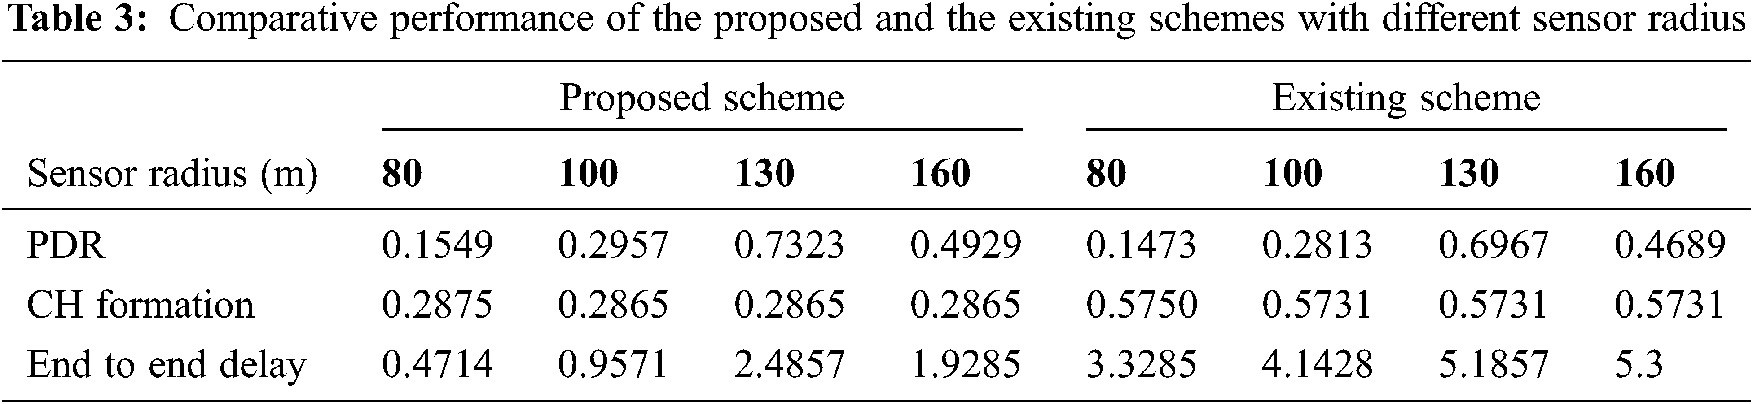
Therefore, the proposed scheme has outperformed in terms of the end to end delay aspect. The performance of the proposed and the existing method for the packet delivery ratio has been illustrated in Fig. 5c by varying the sensor radius. It clearly indicates that the proposed method has achieved the maximum packet delivery ratio at a sensor radius of 130 as 0.732394366. Likewise, for the other sensor radius such as 80, 100 and, 160 the proposed method has achieved the values of 0.154929577, 0.295774648 and, 0.492957746 respectively. Whereas, for the sensor radius of 80, 100, 130, and 160 the existing method has been achieved the delivery ratios as 0.147399451, 0.281398951, 0.696797403 and, 0.468998252 respectively. When compared with the existing method, the proposed method outperforms in terms of the packet delivery ratio with high values.
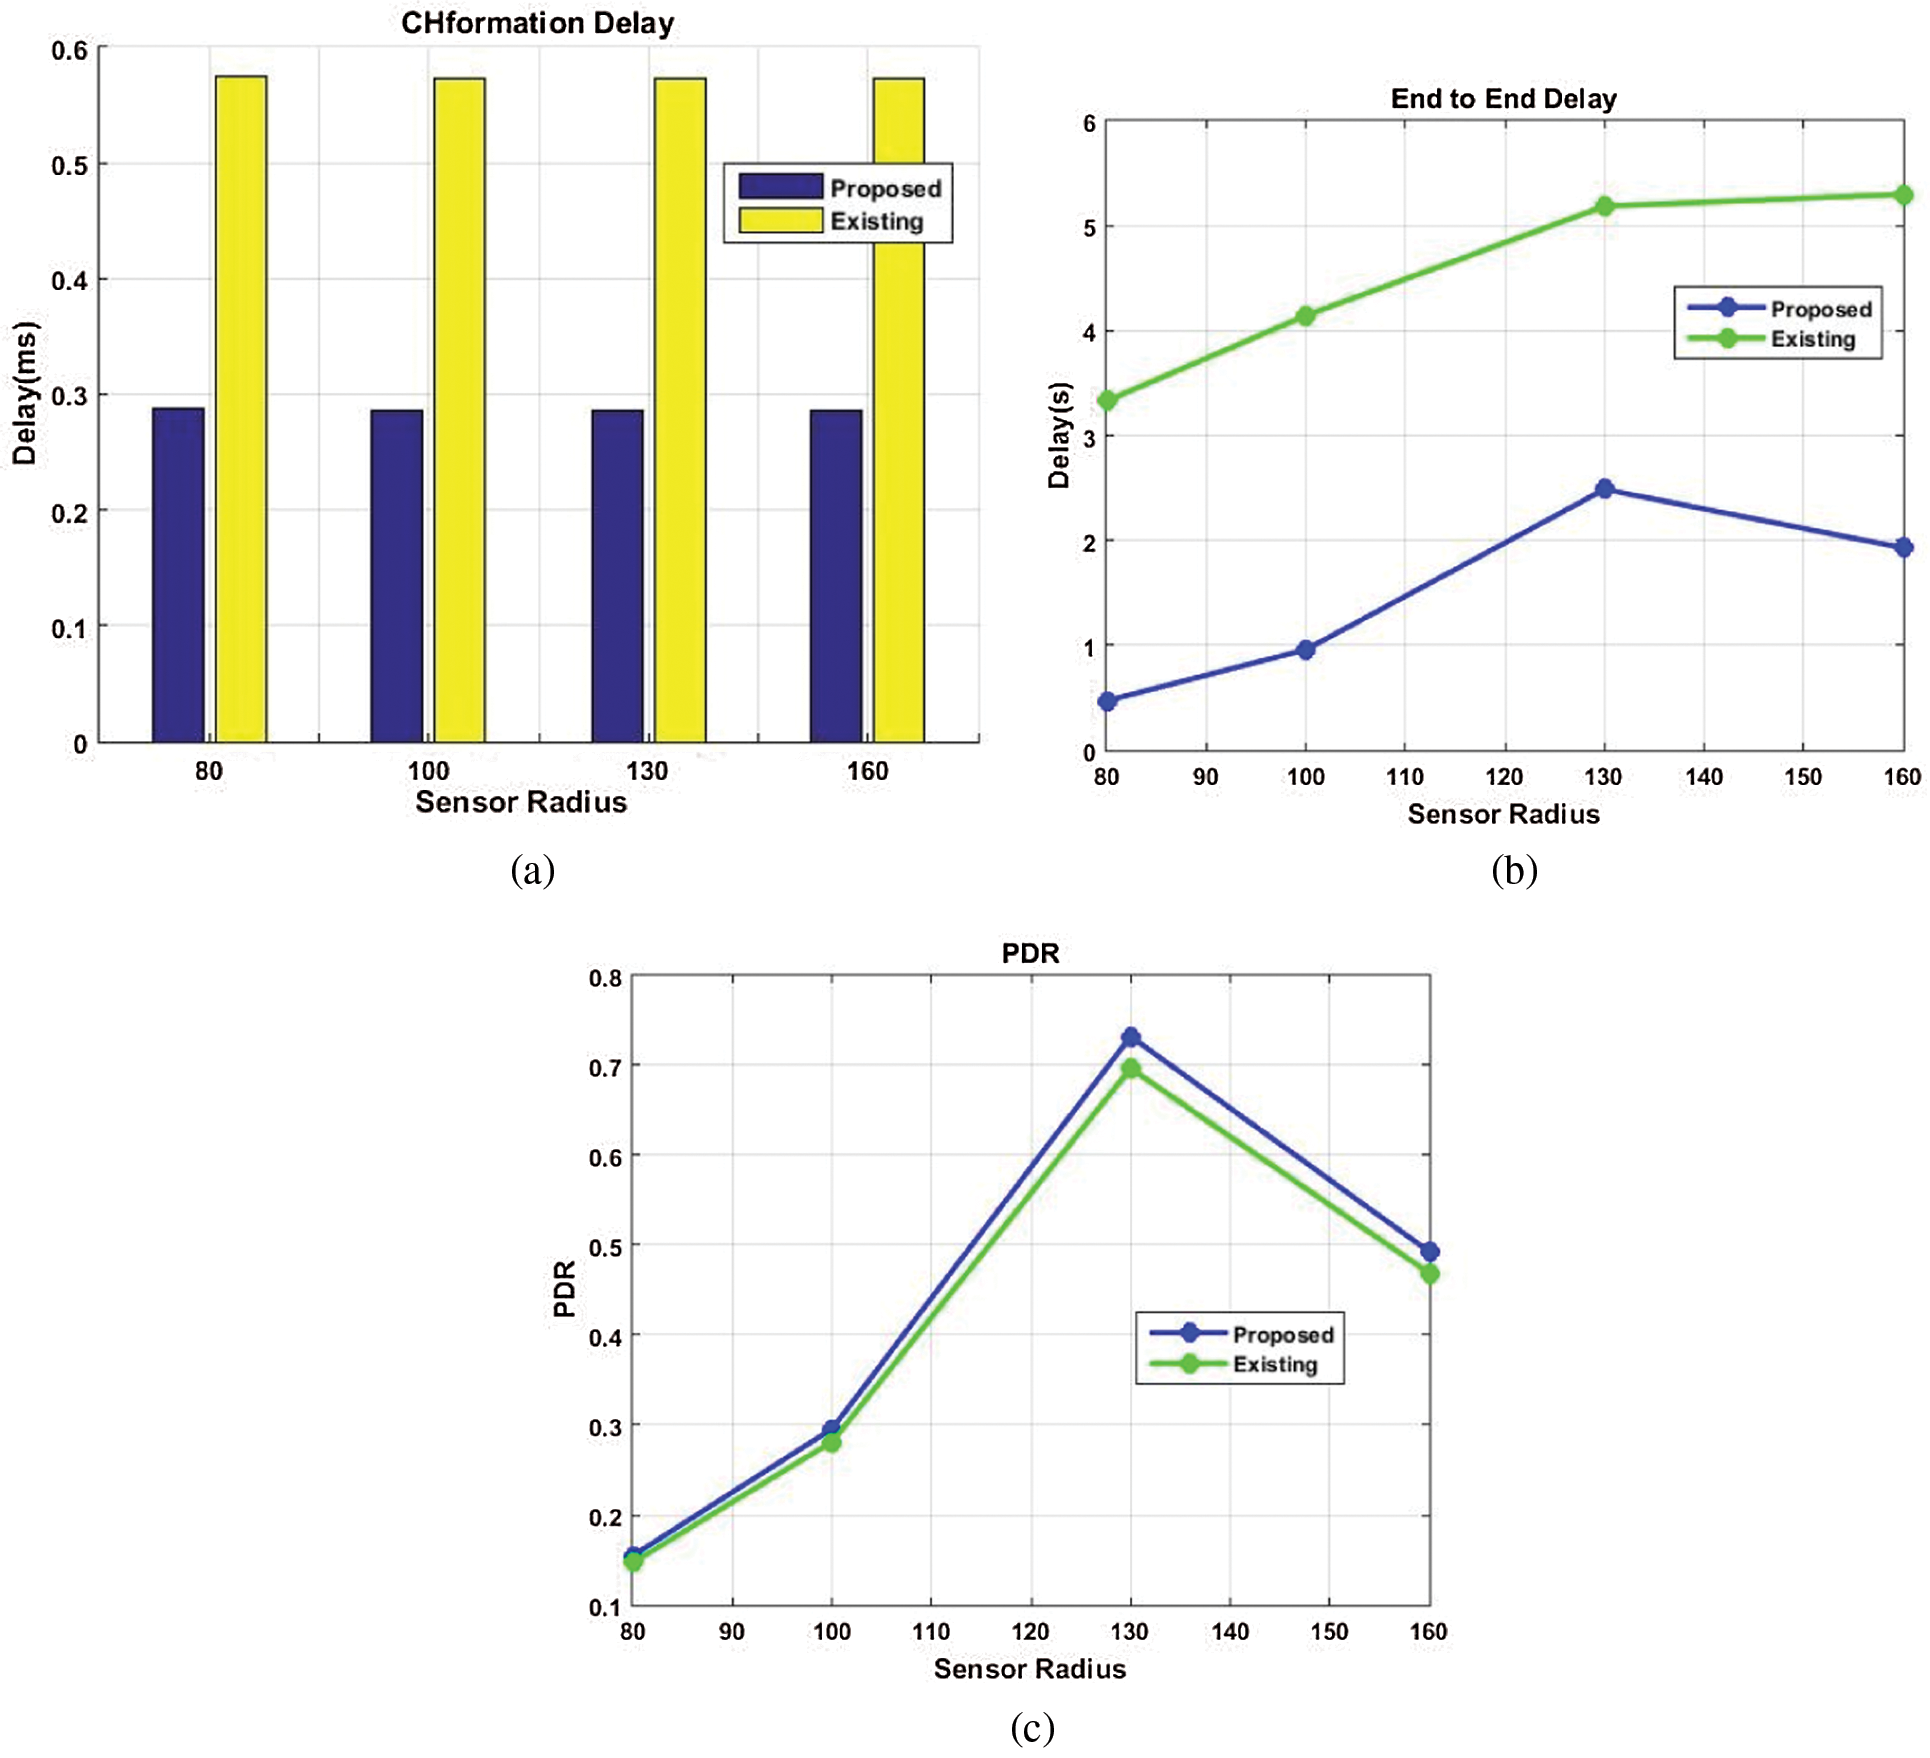
Figure 5: (a) Comparative performance of the proposed and the existing techniques in terms of the CH formation delay with respect to different sensor radius. (b) Comparative performance of the proposed and the existing techniques in terms of the end to end delay attribute with different sensor radius. (c) Comparative performance of the proposed and the existing techniques in terms of the PDR factor with various sensor radius
To enhance the traffic management in VANET, the EPIOA based clustering methodology has been proposed initially for selecting the optimal CH. The CH has been used for reducing the collision of the vehicles and for enhancing the data transmission procedures among the nodes efficiently. In VANET, the nodes appear to be dynamic in nature. Therefore, for updating and validating the CH and for enhancing the data transmission processes the ANFIS based prediction model has been proposed for updating and validating the CH. Additionally, for enhancing the data transmission process, the dijkstra’s technique has been proposed for identifying the shortest path for accomplishing the data transmission procedure. Also, the proposed method has been analyzed under two conditions such as different velocities of the vehicles and the sensor radius. The results show that the proposed methodology outperforms the existing technique in terms of the CH formation delay, the end to end delay and the packet delivery ratio.
Funding Statement: The authors received no specific funding for this study.
Conflicts of Interest: The authors declare that they have no conflicts of interest to report regarding this present study.
1. A. Rehman, M. M. Rathore, A. Paul and F. Saeed, “Vehicular traffic optimisation and even distribution using ant colony in smart city environment,” IET Intelligent Transport Systems, vol. 12, no. 7, pp. 594–601, 2018. [Google Scholar]
2. P. Alvarez, I. Lerga, A. S. Hernandez and J. Faulin, “The impact of traffic congestion when optimising delivery routes in real time. A case study in Spain,” International Journal of Logistics Research and Applications, vol. 21, no. 5, pp. 529–541, 2018. [Google Scholar]
3. M. Ahmad, Q. Chen, Z. Khan, M. Ahmad and F. Khurshid, “Infrastructurebased vehicular congestion detection method for V2I,” International Journal of Communication Systems, vol. 32, no. 3, pp. 1–14, 2019. [Google Scholar]
4. J. B. Bump, S. K. Reddiar and A. Soucat, “When do governments support common goods for health? Four cases on surveillance, traffic congestion, road safety, and air pollution,” Health Systems & Reform, vol. 5, no. 4, pp. 293–306, 2019. [Google Scholar]
5. U. Sander, “Opportunities and limitations for intersection collision intervention—A study of real world ‘left turn across path’ accidents,” Accident Analysis & Prevention, vol. 99, no. September 10–12, pp. 342–355, 2017. [Google Scholar]
6. M. R. Jabbarpour, H. Zarrabi, R. H. Khokhar, S. Shamshirband and K. K. R. Choo, “Applications of computational intelligence in vehicle traffic congestion problem: A survey,” Soft Computing, vol. 22, no. 7, pp. 2299–2320, 2018. [Google Scholar]
7. M. B. Taha, C. Talhi, H. O. Slimane, S. Alrabaee, “TD-PSO: Task distribution approach based on particle swarm optimization for vehicular ad hoc network,” Transactions on Emerging Telecommunications Technologies, vol. 1, no. 2, pp. 1–19, 2020. [Google Scholar]
8. D. Zhang, H. Ge, T. Zhang, Y. Y. Cui, X. Liu et al., “New multi-hop clustering algorithm for vehicular ad hoc networks,” IEEE Transactions on Intelligent Transportation Systems, vol. 20, no. 4, pp. 1517–1530, 2019. [Google Scholar]
9. X. Zhang and X. Chen, “Data security sharing and storage based on a consortium blockchain in a vehicular ad-hoc network,” IEEE Access, vol. 7, no. 1, pp. 58241–58254, 2019. [Google Scholar]
10. L. Rivoirard, M. Wahl and P. Sondi, “Multipoint relaying versus chain-branch-leaf clustering performance in optimized link state routing-based vehicular ad hoc networks,” IEEE Transactions on Intelligent Transportation Systems, vol. 21, no. 3, pp. 1034–1043, 2020. [Google Scholar]
11. H. Bagherlou and A. Ghaffari, “A routing protocol for vehicular ad hoc networks using simulated annealing algorithm and neural networks,” Journal of Supercomputing, vol. 74, no. 6, pp. 2528–2552, 2018. [Google Scholar]
12. J. Wang, K. Liu, K. Xiao, C. Chen, W. Wu et al., “Dynamic clustering and cooperative scheduling for vehicle-to-vehicle communication in bidirectional road scenarios,” IEEE Transactions on Intelligent Transportation Systems, vol. 19, no. 6, pp. 1913–1924, 2018. [Google Scholar]
13. N. Taherkhani and S. Pierre, “Centralized and localized data congestion control strategy for vehicular ad hoc networks using a machine learning clustering algorithm,” IEEE Transactions on Intelligent Transportation Systems, vol. 17, no. 11, pp. 3275–3285, 2016. [Google Scholar]
14. Y. R. B. Al-Mayouf, N. F. Abdullah, M. Ismail, M. A. Q. Salih, O. A. Mahdi et al., “Evaluation of efficient vehicular ad hoc networks based on a maximum distance routing algorithm,” EURASIP Journal on Wireless Communications and Networking, vol. 2016, no. 1, pp. 787, 2016. [Google Scholar]
15. L. Guiyang, Q. Yuan, H. Zhou, N. Cheng, Z. Liu et al., “Cooperative vehicular content distribution in edge computing assisted 5G-VANET,” China Communications, vol. 15, no. 7, pp. 1–17, 2018. [Google Scholar]
16. M. Ren, J. Zhang, L. Khoukhi, H. Labiod and V. Veque, “A unified framework of clustering approach in vehicular ad hoc networks,” IEEE Transactions on Intelligent Transportation Systems, vol. 19, no. 5, pp. 1401–1414, 2018. [Google Scholar]
17. H. Tseng, R. Wu and C. Lo, “A stable clustering algorithm using the traffic regularity of buses in urban VANET scenarios,” Wireless Networks, vol. 26, no. 4, pp. 2665–2679, 2020. [Google Scholar]
18. I. Ahmad, R. Noor, M. Zaba, M. Qureshi, M. Imran et al., “A Cooperative heterogeneous vehicular clustering mechanism for road traffic management,” International Journal of Parallel Programming, vol. 48, no. 5, pp. 870–889, 2020. [Google Scholar]
19. W. Li, W. Song, Q. Lu and C. Yue, “Reliable congestion control mechanism for safety applications in urban VANETs,” Ad Hoc Networks, vol. 98, no. 7, pp. 102033, 2020. [Google Scholar]
20. R. Regin and T. Menakadevi, “Dynamic clustering mechanism to avoid congestion control in vehicular ad hoc networks based on node density,” Wireless Personal Communications, vol. 107, no. 4, pp. 1911–1931, 2019. [Google Scholar]
21. J. Prakash, N. Sengottaiyan and S. Anbukaruppusamy, “Fuel consumption and delay aware traffic scheduling in vanet environment,” Wireless Personal Communications, vol. 117, no. 4, pp. 3173–3191, 2021. [Google Scholar]
22. M. Shelke, A. Malhotra and P. N. Mahalle, “Fuzzy priority based intelligent traffic congestion control and emergency vehicle management using congestion-aware routing algorithm,” Journal of Ambient Intelligence and Humanized Computing, vol. 42, no. 13, pp. 17, 2019. [Google Scholar]
23. H. Liu, L. Rai, J. Wang and C. Ren, “A new approach for real-time traffic delay estimation based on cooperative vehicle-infrastructure systems at the signal intersection,” Arabian Journal for Science and Engineering, vol. 44, no. 3, pp. 2613–2625, 2019. [Google Scholar]
24. H. Duan and P. Qiao, “Pigeon-inspired optimization: A new swarm intelligence optimizer for air robot path planning,” International Journal of Intelligent Computing and Cybernetics, vol. 7, no. 1, pp. 24–37, 2014. [Google Scholar]
25. H. Wang, H. Li, Y. Liu, C. Li and S. Zeng, Oplocation-based particle swarm technique with Cauchy mutation. Scotland: IEEE Congress on Evolutionary Computation, pp. 25–28, 2007. [Google Scholar]
26. S. Haider, G. Abbas, Z. H. Abbas, S. Boudjit and Z. Halim, “P-DACCA: A probabilistic direction-aware cooperative collision avoidance scheme for VANETs,” Future Generation Computer Systems, vol. 103, no. 10, pp. 1–17, 2020. [Google Scholar]
27. J. Gill, J. Singh, S. Olayinka, S. Damola, E. Opemipo et al., “Adaptive neuro-fuzzy inference system (ANFIS) approach for the irreversibility analysis of a domestic refrigerator system using LPG/TiO 2 nanolubricant,” Energy Reports, vol. 6, no. 2, pp. 1405–1417, 2020. [Google Scholar]
28. Y. Chen, S. Shen, T. Chen and R. Yang, “Path optimization study for vehicles evacuation based on dijkstra algorithm,” Procedia Engineering, vol. 71, no. 16, pp. 159–165, 2014. [Google Scholar]
29. X. Qu, E. Liu, R. Wang and H. Ma, “Complex network analysis of VANET topology with realistic vehicular traces,” IEEE Transactions on Vehicular Technology, vol. 69, no. 4, pp. 4426–4438, 2020. [Google Scholar]
30. N. Akhtar, S. C. Ergen and O. Ozkasap, “Vehicle mobility and communication channel models for realistic and efficient highway VANET Simulation,” IEEE Transactions on Vehicular Technology, vol. 64, no. 1, pp. 248–262, 2015. [Google Scholar]
 | This work is licensed under a Creative Commons Attribution 4.0 International License, which permits unrestricted use, distribution, and reproduction in any medium, provided the original work is properly cited. |