DOI:10.32604/iasc.2022.023666
| Intelligent Automation & Soft Computing DOI:10.32604/iasc.2022.023666 | |
| Article |
Overhauled Approach to Effectuate the Amelioration in EEG Analysis
School of Computer Science and Engineering, Vellore Institute of Technology, Chennai, 600127, India
*Corresponding Author: S. Beatrice. Email: s.beatrice2015@vit.ac.in
Received: 16 September 2021; Accepted: 29 October 2021
Abstract: Discovering the information about several disorders prevailing in brain and neurology is by no means a new scientific technique. A neurological disorder of any human being can be analyzed using EEG (Electroencephalography) signal from the electrode’s output. Epilepsy (spontaneous recurrent seizure) detection is usually carried out by the physicians using a visual scanning of the signals produced by EEG, which is onerous and may be inaccurate. EEG signal is often used to determine epilepsy, for its merits, such as non-invasive, portable, and economical, can exhibit superior temporal tenacity. This paper surveys the existing artifact removal methods. It puts a new-fangled mode forward to confiscate artifacts and hauls informative derived values from EEG to automate Epilepsy detection. The automated Epilepsy detection has to precisely indicate and detect the neural abnormality of the brain. This indication and detection process necessitates a proficient approach for the prompt removal of artifacts of the EEG signals. An effective artifact removal of EEG signals can alone enable the useful features of the original signals for further processing. Once the original signals excluding the noise is obtained, a delicate strategy for extracting the features of the signals, becomes mandatory in order to accomplish robust classification of the signal. Then an expert classification technique is implemented to aid the automated analysis process to correctly distinguish the EEG signal features.
Keywords: ACAR (Adaptive common average reference); electroencephalography (EEG); epilepsy; ICA (Independent component analysis); 1D-LBP (One dimensional-local binary pattern); seizure detection
Neurons are an enormous magnitude of individual brain cells. Electrical firings hold the responsibility of ensuring communication within the neurons. Each neuron is connected to a small subset of other neurons. Neurons can be analyzed using the EEG signal since the EEG signal is non-invasive, economical, portable, and has a temporal resolution. The neuron’s structure is depicted below in Fig. 1. The oscillations at a range of frequencies are indicated using Scalp EEG activity. Approximately these oscillations exhibit distinctive frequency ranges. The resulting EEG signal may also contain some signals from eye movements (EOG), nearby muscle activities (EMG), etc., So, for accurate analysis, EEG signals are to be split into frequency bands that vary from high to low frequencies.
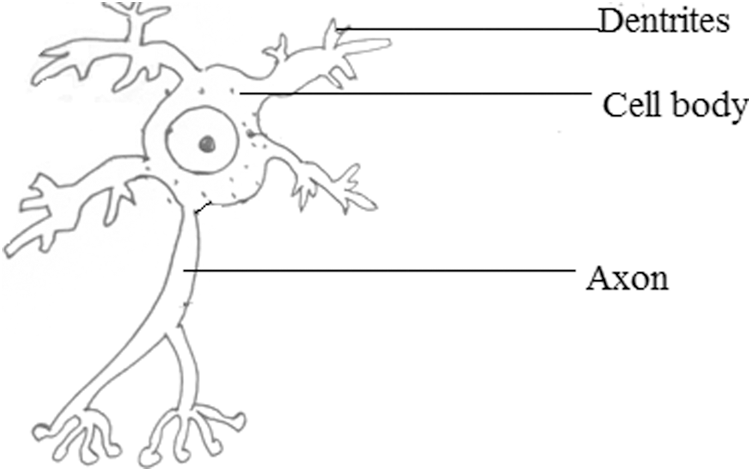
Figure 1: Structure of a neuron
On analyzing the burst suppression, epilepsy and seizure detection can be done. The seizure is nothing but a simple neurological disorder in which excessive neurons are jittered simultaneously. Epilepsy is another neurological disorder where the spontaneous recurrent seizure occurs. Tab. 1 defines the range of frequencies. If the frequency level goes above the range other than that specified in Tab. 1, then neurological disorders can arise.

Epileptic EEG activity has been classified as ictal (during a seizure), postictal (after a seizure) and interictal (between seizures). Interictal EEG data is viewed as a collection of isolated spikes, spike trains, sharp waves, or spike-wave complexes. The monitoring of the relative energy flanked by the frequency bands highly assists in decoding the dominant activity and states such as relaxed, excited, drowsy, muscle activities. In this paper, first, an overview of pre-processing techniques is presented, and it provides insights on the challenges in this area. Later Feature extraction methods. Finally, the paper is concluded with classification methods.
Many techniques for catching a glimpse of an epileptic seizure have been invented. Feature extraction by which the informative values are derived and classification of EEG signal plays vitally a crucial role in detecting ictal and interictal signals. They assist in the treatment of epileptic patients and indicate the precautionary measures. Existing methods were not adequately sufficient to endow the accurate data about Epilepsy detection. Conventional diagnostic methods techniques rely on the expert’s knowledge for visually inspecting lengthy EEG recordings which is often timely protracted and highly prone to errors. So, in the research of epilepsy detection, Supriya et al. delved into the effect such as the average weighted degree of a complex network [1]. They employed a Complex network for its higher performance and used a single feature to minimize computation cost.
Parvez et al. Enhanced seizure detection was carried out utilizing the temporal correlation within the EEG signals. According to their approach, the EEG signal is parted into a few epochs and then arranged into a 2D matrix and different transformation/decomposition methods are applied to dig out a few statistical features and these features are then applied as input into LS-SVM (Least Square-Support Vector Machine) for further classification [2]. The reason for using LS-SVM is the minimized operational error, maximized margin hyperplane, and the better classification obtained by taking into consideration by the accuracy of the ictal and interictal period of epilepsy. Wang detected the seizure intervals of epilepsy patients by employing the basis of Partial Directed Coherence (PDC). They implemented Support vector machine to discriminate interictal periods from ictal periods of EEG signals [3].
Riaz et al. (2016) used the approach of Empirical Mode Decomposition (EMD) for feature extraction. Intrinsic mode function (IMF) is a yield of EMD [4]. Sharpley et al. implemented EMD since the frequency components of EEG signals change from one interval to the other [5]. Wavelet CSP (Common Spatial Pattern) algorithm is a widely used algorithm for EEG signal processing and the best results were obtained using their proposed methodology. Zabihi et al. (2015) proposed another approach to detect seizures by using the CHB-MIT database to achieve precise classification over competing techniques without any pre-processing [6]. Their approach achieved the highest accuracy and minimum rate of fake alarms among the existing extraction methods and achieved detection accuracy.
To detect the seizures Gajic et al. suggested Wavelet transform and Statistical pattern recognition which was implemented by three stages which are 1. Extracting features using wavelet transform. 2. Reduction of feature space dimension 3. Classification using quadratic classifiers. The cons of their approach are reduced noise level and achieved very good specificity, sensitivity, and accuracy [7]. Das et al. used Discrete Wavelet Transform (DWT) and/neural network to detect epilepsy [8,9]. By using these methods, they achieved better accuracy. The classifiers such as Linear Discriminant Analysis (LDA), Multi-Layer Perceptron Neural Network (MLPNN), Probabilistic Neural Network (PNN), Elman Neural Network (ENN), Radial Basis Function Neural Network (RBFNN), Naive Bayes, Mahalanobis Distance, K-Nearest Neighbor (K-NN), Decision Tress, Logistic Regression, Bayes Quadratic, Hidden Markov Model (HMM), Support Vector Machine (SVM) are prominently used in EEG classification techniques for epileptic seizure detection [10–12]. They defined SVM as the powerful and popular method for better seizure detection performance [13–15]. There are multi-class SVMs [16–18] OneVsOne, OneVsRest and DAG MSVMs, but take more computation time. Among the various classifiers support vector machine and neural networks support most of the characteristics and are popularly used by many researchers. In classification algorithms, a normal task is to suit a model to a collection of data. This model is later used for classifying new samples. Regularization is a technique used to avoid the over-fitting problem.
1.2 Motivation and Justification of the Proposed Work
Burst suppression is a pattern of electroencephalogram that contains quasi-periodic fluctuation between isoelectric suppressions. It is the characteristic of an extremely inactivated brain, happening in the circumstances together with general anesthesia, infant encephalopathy, and coma. The electroencephalographic Burst Suppression Pattern (BSP) is a combination of high amplitude bursts and low amplitude suppressions. Electroencephalography is one of the main tools used for recording brain activity. The primary motivation of using the electroencephalogram is flexible to use, which results in outstanding time resolution and low cost. The recorded EEG signals are more often contaminated with the different types of noises, which can be associated with the EEG signal’s frequency band. Hence it is the biggest challenge to remove the noise from the recorded EEG signal, and the various sources of noise are discussed. The prime drive in this paper is to come up with a hybridized instigative artifact removal analysis, feature extraction and classification techniques.
2 Analysis of EEG Signal for the Detection of Brain Abnormalities
This research investigates the pre-processing of the EEG signal, a feature extraction technique, and different classifiers to classify the EEG signals into the Epilepsy Disease patients and Healthy Control. In the pre-processing of the EEG signal, artifacts are removed. The feature extraction technique utilizes the wavelet transform, and the dimensionality reduction techniques are carried out by the Independent Component Analysis (ICA). The dimensionally reduced EEG signals are additionally processed by utilizing distinct classifiers such as K-Nearest Neighbor, Support Vector Machine (SVM).
The performance measures of the classifiers are compared based on their metrics like Accuracy, Sensitivity, Specificity, Precision, Recall, and F-measure. A very requiring process is epilepsy using the EEG signal. Three main stages are involved in the automated EEG detection process: artifact removal (pre-processing), feature extraction, and classification. The raw EEG signals are provided as input to the pre-processing to perform noise removal and decompose the EEG signal into five sub-band signals in order to do the analysis. From each of the six EEG signals, such as the original EEG, delta, theta, alpha, beta, and gamma, the nonlinear parameters (time and frequency) were extracted. The nonlinear parameters extracted are then fed into a classifier that can classify either normal or abnormal as the same.
Regrettably, numerous varieties such as artifacts resulting in ocular artifacts, electrode artifacts, motion artifacts, and EMG artifacts resulting from muscle activity are grabbed by EEG signals, which increases the misclassification of recorded EEG signals. The artifacts and their types are shown below in the diagrammatic representation (Fig. 2). During the seizure detection, roughly artifacts can increase the actual negative rate, while some specific types of seizure may be left undiagnosed and regarded as non-epileptic events. Therefore, it is more important to automatically remove such felonious artifacts before a seizure or epilepsy detection to ensure the accurate detection of epilepsy. Many long-established tactics ((S. Barua (2014)) have been proposed to attenuate artifacts from recorded EEG signals [19].
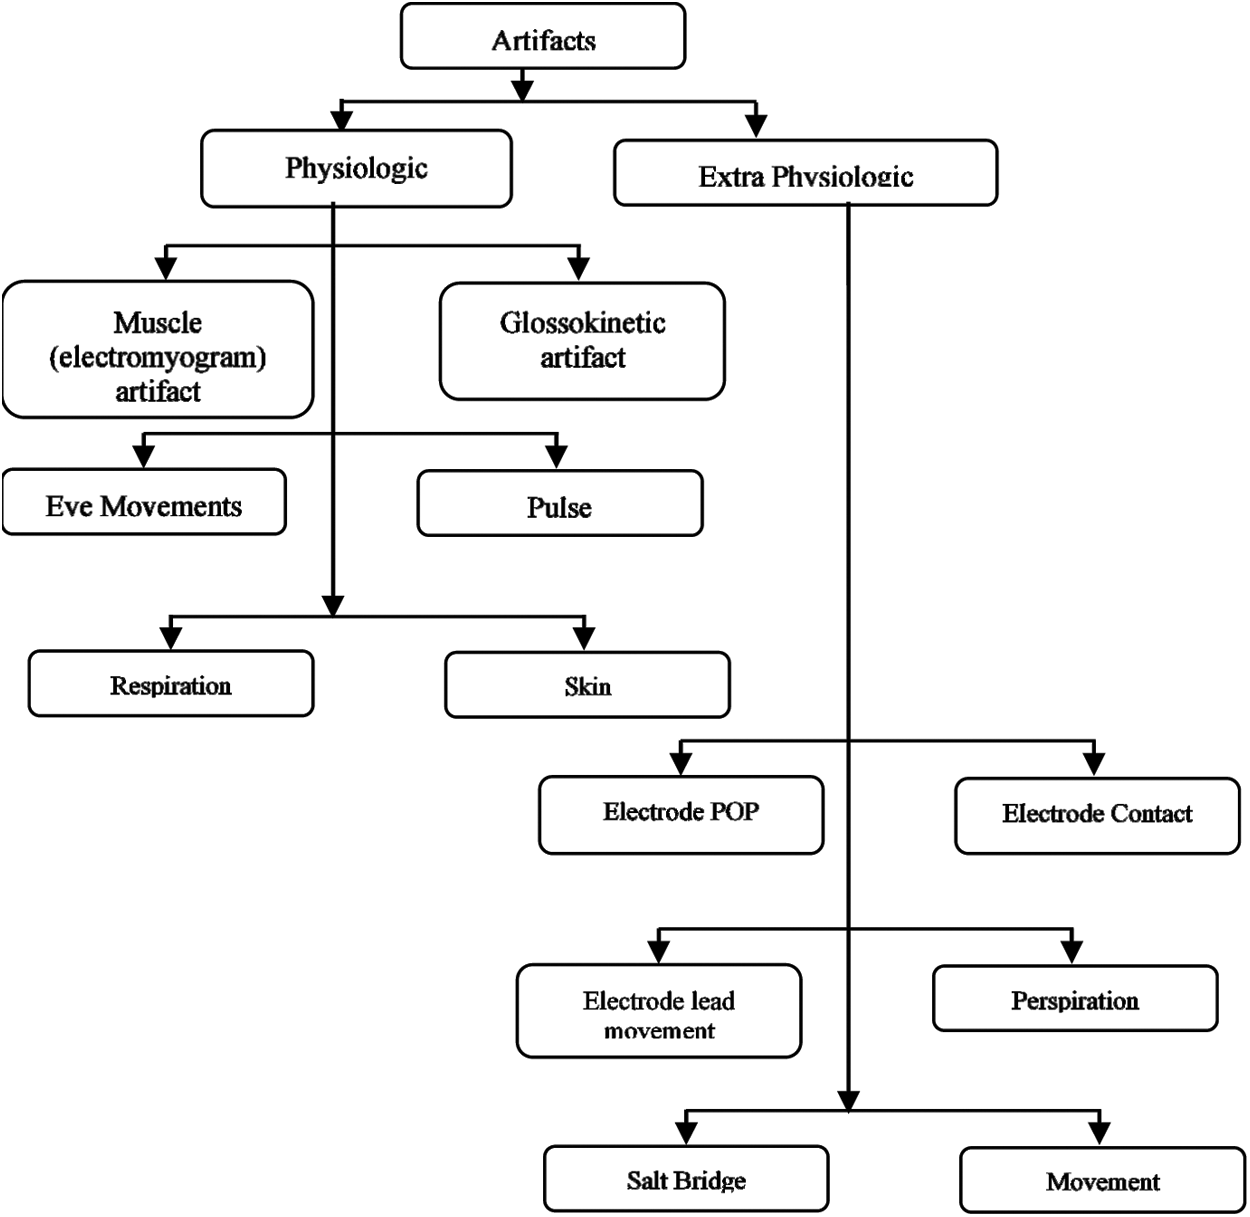
Figure 2: Types of artifacts
Blind source separation (BSS), which includes independent component analysis (ICA) and canonical correlation analysis (CCA), is the most widely used means of decreasing noise in EEG signals [20–22]. Islam et al. mainly concentrated [23] on the methods which can separate artifacts from seizures. They developed an automated program to remove artifacts at their best without distorting the signal of interest. Stationary Wavelet transform has been used to separate artifacts from seizures by considering the spectral band of seizure activities [24]. Their approach reduces false alarms in seizure detection. Mammone et al. (2012) proposed a method to remove artifacts using wavelet independent component analysis, which gives superior results on suppression of artifacts in EEG signals. Artifacts can be removed [25] by several methods such as Regression-based, EMD (Empirical Mode Decomposition), ICA (Independent Component Analysis), etc.
Regression analysis is a traditional approach to identifying artifact samples and eradicating the same artifact samples from the signal and is the most used method to remove some physiological artifacts such as ocular and cardiac artifacts [26,27] from the Observed artifact-contaminated EEG signal and an artifact reference signal. But this method is case-based that is limited only to particular cases. It is mainly used whenever the reference channel is available, and only those references can be used to eradicate the artifacts. Methodologies for eradicating artifacts include Indexing, Enveloping, Squaring, and thresholding.
2.1.2 Blind Source Separation (BSS)
BSS is a prevalent method of removing eye-related artifacts and some of the muscle artifacts that come from jaw clenching, swallowing, and rising eyebrows [28]. The process of BSS is to extract the individual unfamiliar source signals from their combinations.
Let’s consider X as the observed signals in multi-channel recordings and the source, S with additive white noise vector N, that is defined in Eq. (1)
Independent component analysis (ICA)
ICA is a special case of BSS. It is a probabilistic technique for learning a linear transformation of a random vector. Independent component analysis acts as a one-stop solution for all artifacts removal in any EEG signal since the methodology of ICA itself encompasses Indexing, Enveloping, Squaring, Thresholding. ICA addresses EMG artifacts & other Physiologic artifacts. The block diagram of ICA is given below in Fig. 3.
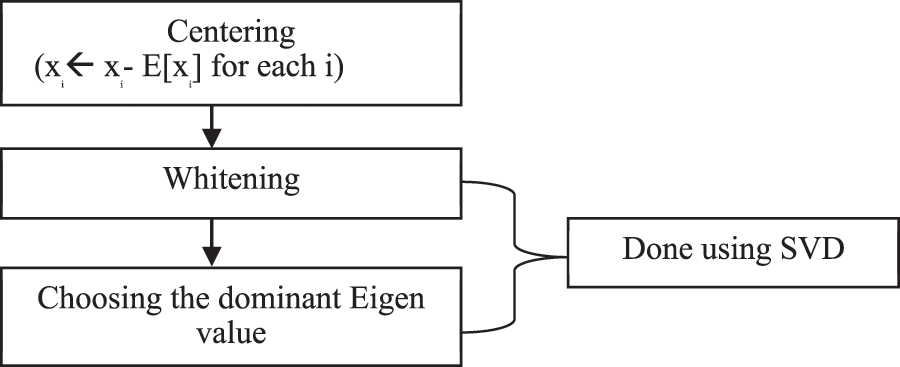
Figure 3: Block diagram of ICA
Steps of ICA process
Centering
The basic idea of Centering is to bring the data to zero means and it is used in the removal of the DC offset from the observations.
Whitening & Singular Value Decomposition (SVD)
Whitening refers to normalizing variance in all the possible directions and treating all the dimensions equally. To perform whitening and to find dominant eigenvalues, Singular Value Decomposition (SVD) can be used.
2.1.3 Adaptive Common Average Reference (ACAR)
Adaptive Common Average Reference combines the merits of CAR and ANC (Adaptive Noise Cancelling) filter. To remove correlated artifacts, ACAR can be used.
CAR
• Common Average Referencing (CAR)-a simple technique in computations.
• It is usually used in EEG signals, where it is essential to detect signal sources at actual noisy recordings.
For ‘k’ channels, a simple model can be defined in the below equation Eq. (2)
CAR is calculated by considering sample by sample, which is calculated by the average of all the channels. To remove the artifacts CAR is defined below as a global reference in Eq. (3):
where
Theoretically, the anticipated signals are not correlated amid channels and the noises are indistinguishable, i.e., wk ∼ 1 for each channel and defined in the below Eq. (4).
Since different channel characteristics in CAR enable unpredictable amplitudes in artifacts, the proposed approach adapts ACAR. CAR is considered as Xk/nt to an ANC filter as a reference signal and the weight for each channel is found by finding the relationship between ANC output and the reference. Adaptive noise canceling (ANC) filter is given below in Fig. 4.
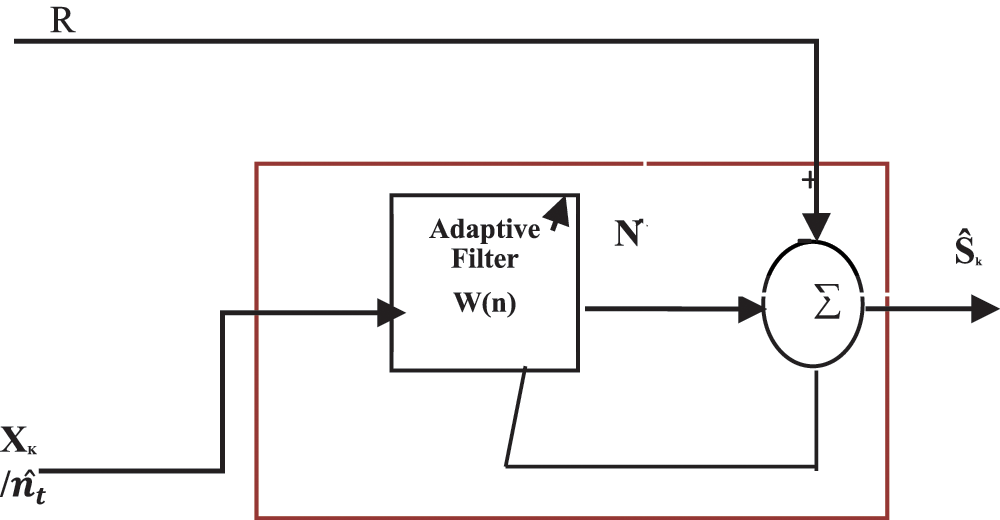
Figure 4: System design for an adaptive noise canceling (ANC) filter
Where
Rk-recorded signal where Rk = S+N.
X-A reference correlated with N, W-FIR filter coefficients to minimize output
Ŝ-Output, W(n) = [ω0(n) ω1(n) …ωL−1(n)]T
ACAR
The block diagram of ACAR filter is given above in Fig. 5.
where
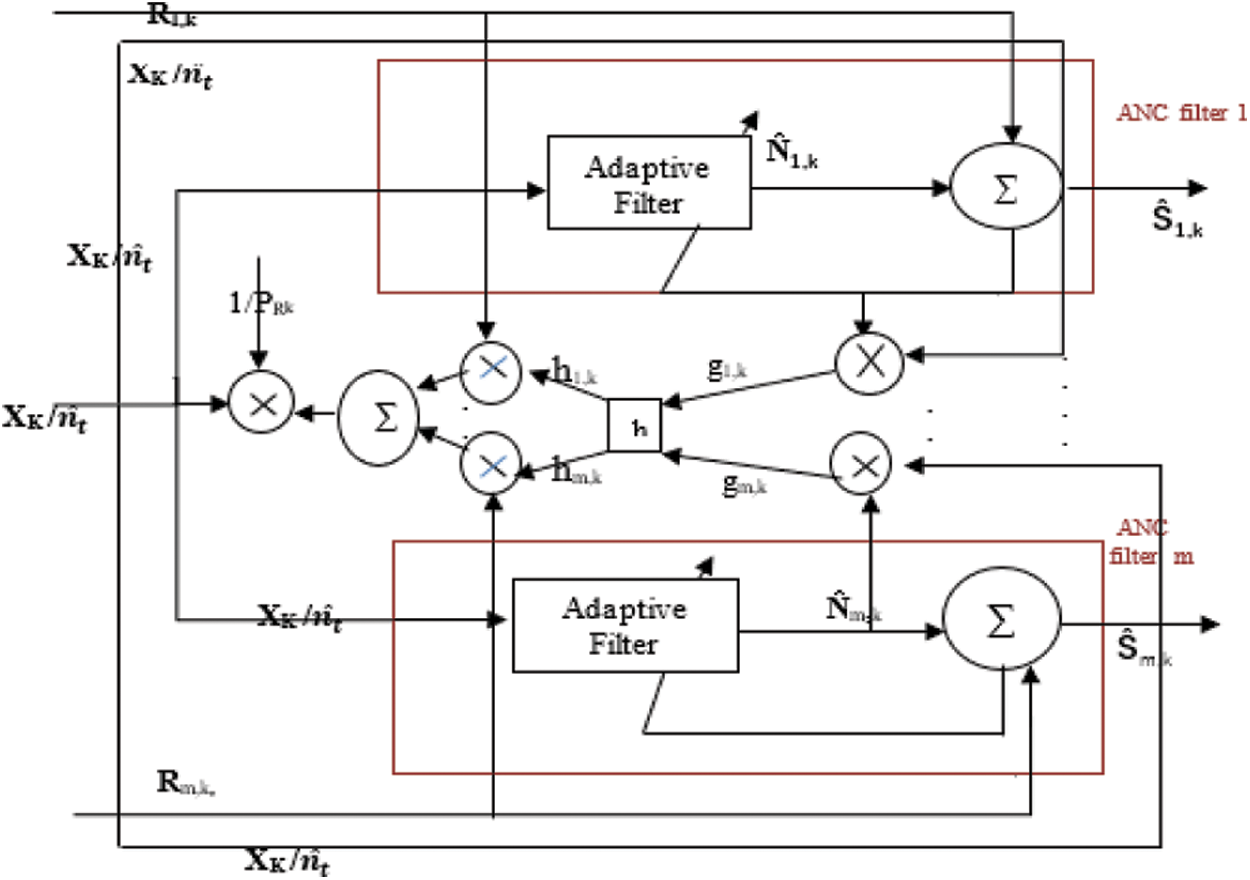
Figure 5: Block diagram of ACAR
Rk-recorded signal where Rk = S + N.
Ŝ-filtered output
h block-Moving average on g
PRk-Average signal power of R as given by Eq. (7).
The feature extraction technique can be employed for the dimensionality reduction of the features. The signal characteristics can be best portrayed using the extracted features. The feature extraction can be performed both in Time and Frequency domains. Feature extraction methods enable the extraction of the relevant features and the features with little or no predictive information are eliminated.
2.2.1 Local Binary Pattern (LBP)
After the analysis of different methods, LBP is found to be one of the most powerful methods for feature extraction. LBP can also be used to descript texture and summarizes the local-gray level structure of an image. The fundamental design to develop the LBP operator Chatlani et al. is to use two harmonizing metrics [29]: local spatial patterns and grayscale contrast.
The description of LBP code is given below in Eq. (8):
where s(x) =
‘m’-surrounding pixels,
Pi-Points (i = 0…m − 1)
2.2.2 One Dimensional Local Binary Pattern (1D-LBP)
1D-LBP is a kind of LBP used to process the signals. 1D-LBP is very akin to LBP, but it is pertinent to use only for a 1D signal. The example of a signal point Sc of 1D-LBP code is shown in Fig. 6.
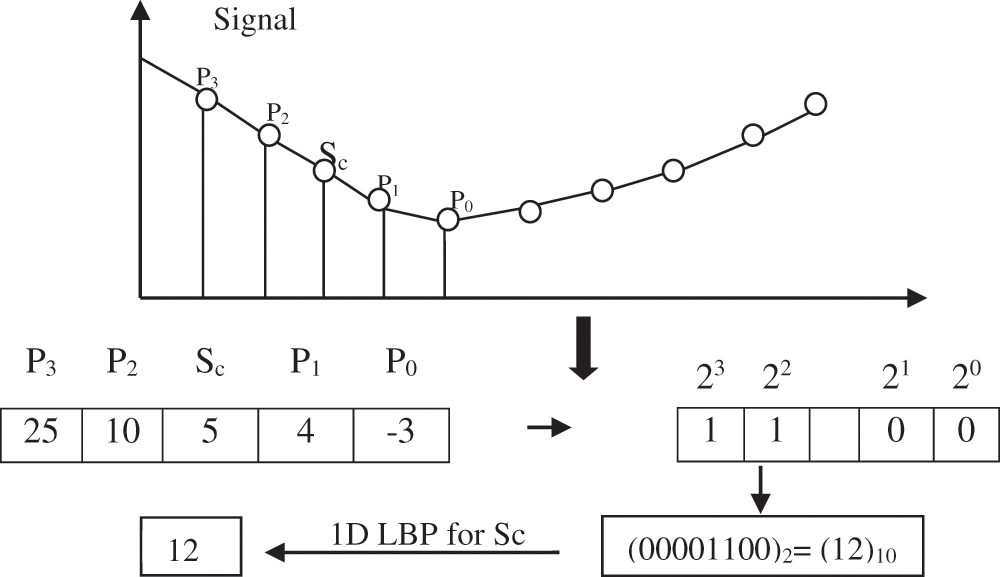
Figure 6: Block diagram of the ACAR filter
One dimensional (1D-LBP) transformation code is given below in Eq. (9):
where s(x) =
Sc-signal point
m-Number surrounding points (Pi, i = 0, … m − 1)
In the above technique [30], different weights (2i, i = 0…m − 1) are assigned to different points.
To instigative Epilepsy, the combination of different methods to remove artifacts and seizures also detected using an innovative, optimized algorithm founded from the primary research and has come up with innovative changes that abolish the downsides of the previous approaches.
Pre-processing is a vital methodology by which raw data is transformed into a format suitable for upcoming analysis. EEG signals while pre-processed the annihilation of the artifacts from the data and getting the accurate neural signals. Regarding EEG artifacts, this proposed method analyses all the possible artifacts encountered while recording an EEG signal and suggests a one umbrella methodology that at its best annihilates all those possible artifacts. A feature defines a unique property that is quite measurable. Extracted features are intended to minimize the loss of essential information implanted in the signal and simplify the number of incomes required to define a substantial magnitude of data correctly.
The newly suggested ideology for detecting epilepsy is given below in Fig. 7.
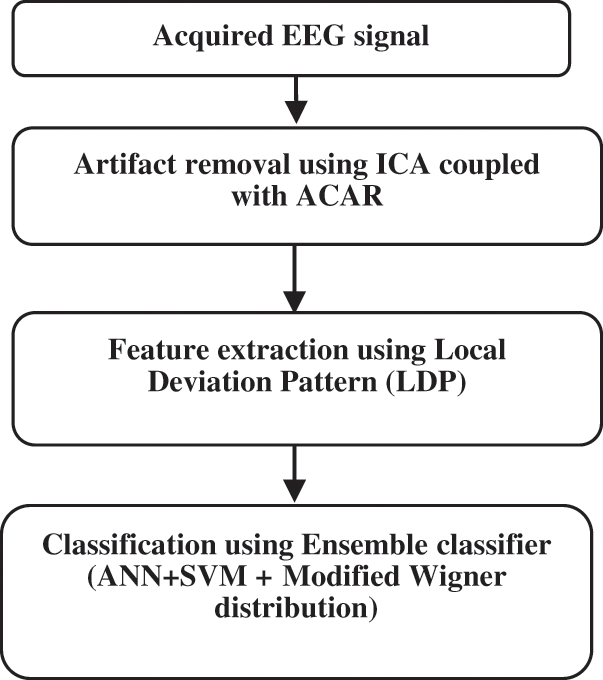
Figure 7: Proposed method for Epilepsy detection
After acquiring the EEG signal, ACAR is mainly employed to remove the noise or artifacts. After removing artifacts, LDP (Local Deviation Pattern) is adapted as its feature extraction technique because of its high discriminative power, computationally simple, invariant to grayscale changes, and exhibits superior performance. The proposed method is to detect epileptic seizures, feature extraction, and classification. Ensemble classifier is the combination of ANN and SVM binary classifier technique with Modified Wigner distribution function to perform better classification. Given a series of training samples, ensemble classifier tries to find which sample goes to first-class and the one that fits the second. It is adapted since the prediction is accurate, is robust, and performs effectively with the noisy data.
It is efficiently used in cases where it is difficult to remove the noise. ACAR tackles EOG artifacts and other extra physiologic artifacts. The basic idea behind ACAR is, a weighted CAR is considered as XK
3.1.2 One Dimensional Local Deviation Pattern (1D-LDP)
1D-LBP is thin-skinned to noise and, so it exhibits limited of detecting the hidden patterns. To overcome this limitation, 1D-LDP has been proposed. The 1D-LDP technique is concerned with calculating the Standard deviation of the neighbouring points and finds the comparison among neighbouring points and the deviated value. The code, which is in binary form, has been obtained after the comparison. After getting the code, it must be converted into the transformation code. The standard deviation is the most acceptable way to measure the variation. Each comparison results in a binary value (0 or 1) both in 1D-LBP and LDP.
The 1D-LDP is more descriptive when compared with that of 1 D-LBP. The Example of 1D-LDP is defined in Fig. 8. 1D-LDP is an innovative technique for extracting features by using the standard deviation of the adjacent points. The 1D-LDP feature extraction technique is realized using the following steps:
1. ‘m’ is set as the number of neighbouring points.
2. For each Sc (Signal point), consider m/2 neighbour points.
3. The standard deviation (D) of the neighbouring points is computed as below in Eq. (10):
4. The disparity between the neighbouring points and the mid-point is computed below:
Ri = Pi − D; where ‘i’ varies 0. . .m − 1
5. 1D-LDP code is computed as below in Eq. (11):

Figure 8: Example of 1D-LDP
3.2 Proposed Ensemble Classifier
This classifier is a combination of ANN and SVM base classifiers with modified Wigner distribution. ANN explained in 2.3.2. SVM performs intense byzantine transformations and then catches out the way of separating the data based on the outputs by which they are defined. A nonlinear classification can be efficiently carried out by the SVM classifier using a kernel trick. Vladmir N. Vapnaik put forth a model for creating nonlinear classifiers by utilizing Kernel trick to maximum-margin hyperplanes. A much more complex relationship can be captured between the data points without performing complex transformations manually. SVM can be defined below by using a training set that contains ‘N’ training artifact samples and coefficients ∝_(1…N) learned in the training step, the decision function of X(1…M).
SVM is defined in the below equation Eq. (12):
Decision function
where
K(.)-kernel function, b-input vector.
3.2.1 Modified Wigner Distribution Function
Modified Wigner distribution function as Time-frequency distribution function is a variation of the Wigner distribution function (WD) with reduced or removed cross-terms. A modified Wigner distribution (MWD) can be formulated as
where π(t, f)-Cohen’s kernel function (low-pass function), which usually masks the interference with the original Wigner representation.
Performance evaluation of the methods adopted, enhanced, and developed is the most key step in any research. For the performance analysis, the paper considers the CHB-MIT database Goldberger et al. which is web-based, freely available [31]. This database provides access to all the researchers working on neurological disorders since it offers a wide range of EEG records to augment their research. This paper uses CHB-MIT database. It contains child patients EEG recordings that are collected at Boston Children’s Hospital. For up to seven days, subjects are observed to define their seizures. The dataset has 22 subjects, from that, 5 male and 17 females provided recordings divided into 23 cases. Due to hardware restrictions, there are pauses between sequentially numbered .edf files during which the signals are not captured; in most situations, the intervals are shorter than 10 s. All signals are sampled at 256 samples per second, with a resolution of 16 bits. The majority of the files include 23 EEG signals. These recordings were made using the International 10–20 method.
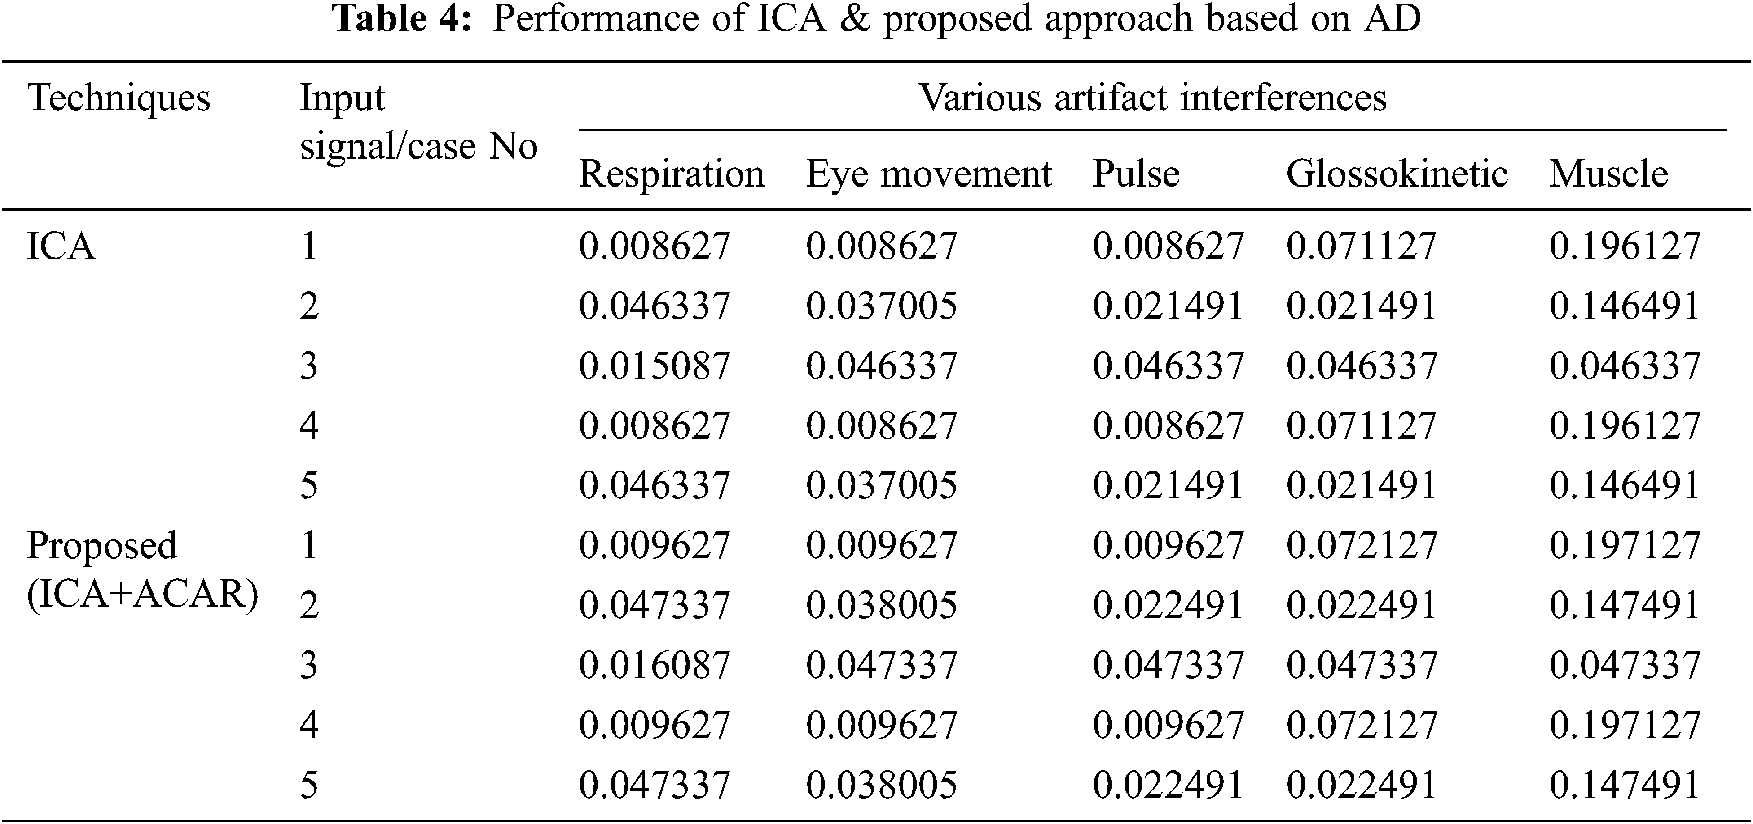
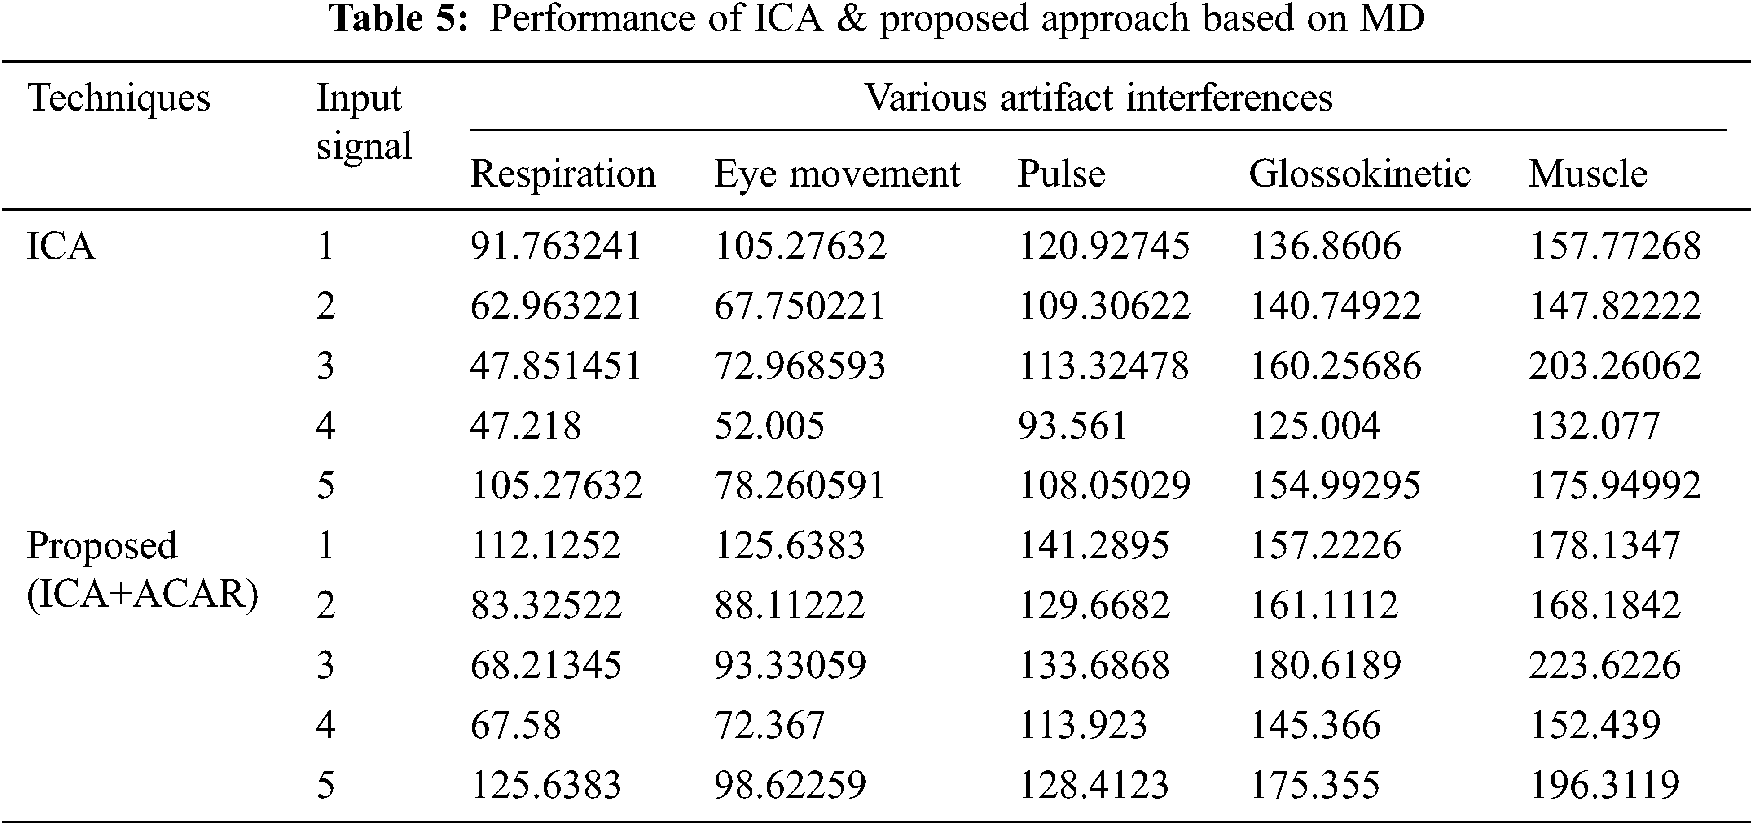
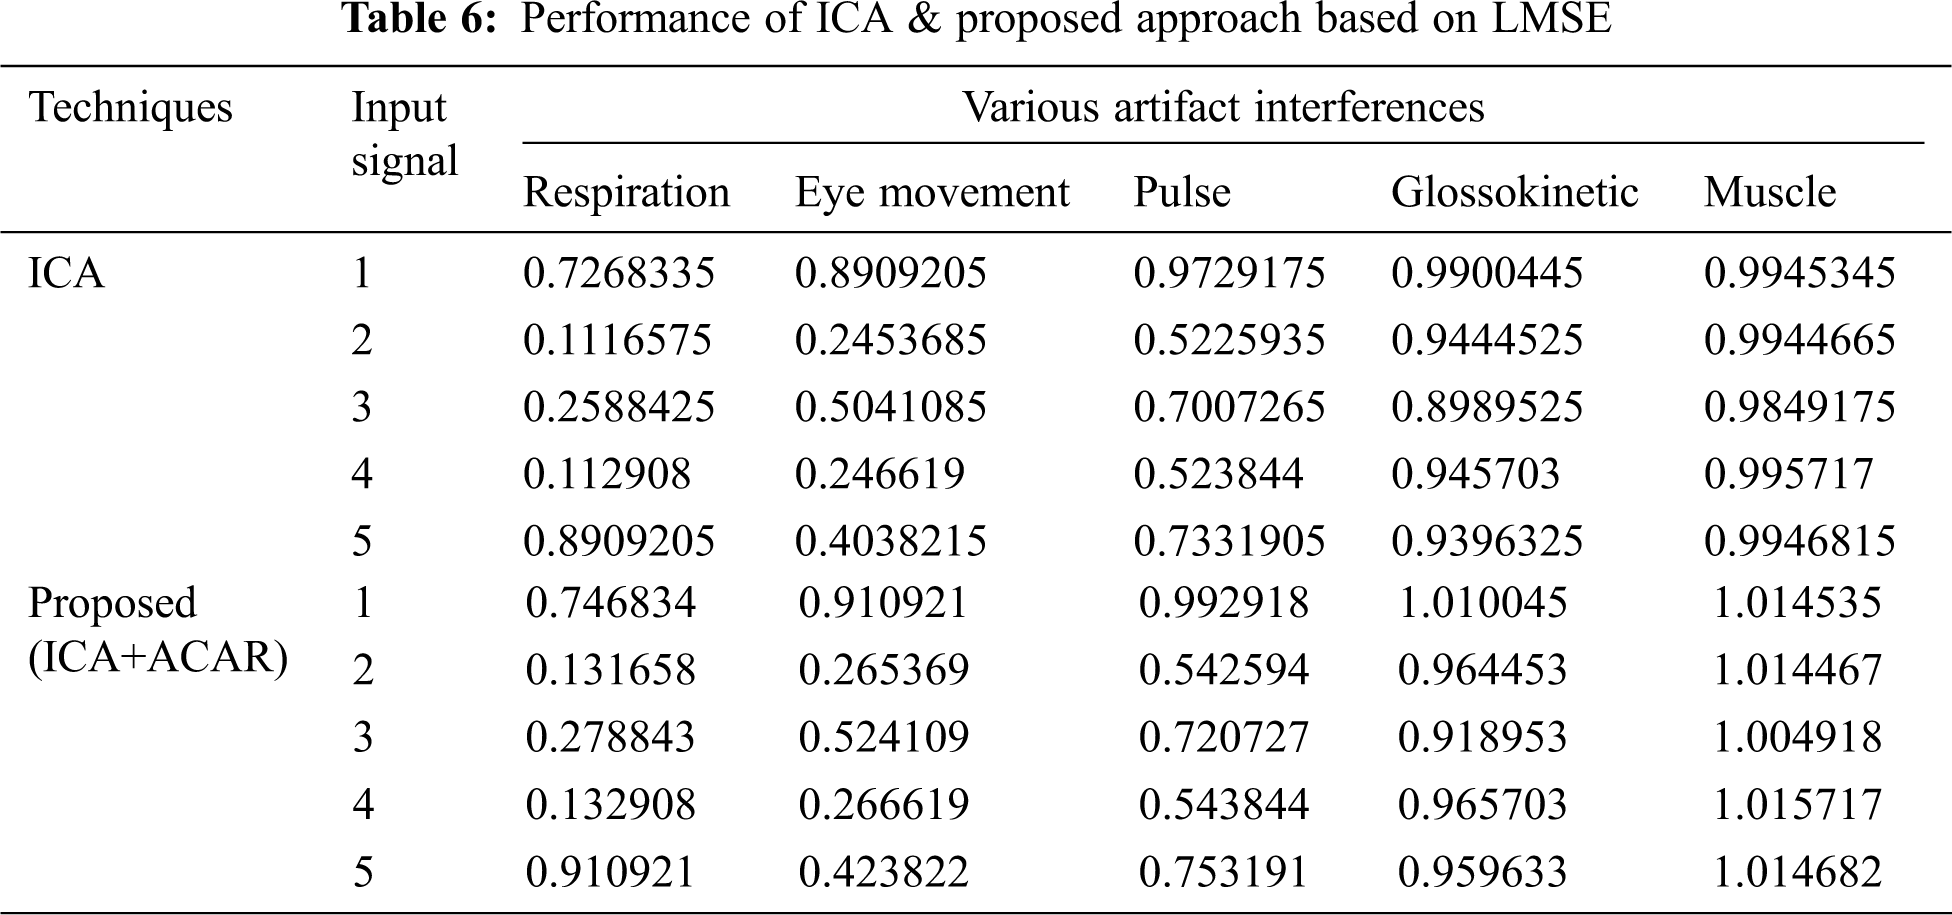
The Performance metrics that aids in evaluating the system performance are mentioned in this section. All types of physiologic artifacts have been considered for performance analysis. For the performance evaluation, Peak Signal to Noise Ratio (PSNR), Mean Square Error (MSE), Average Difference (AD), Maximum difference (MD), Laplacian Mean Squared error (LMSE) and Normalized Absolute Error (NAE) are taken. Tabs. 2 and 3 depicts the MSE, PSNR, and performance of the above-specified algorithms. It is identified that (from Tab. 2) high PSNR value can be produced by Proposed approach when compared with supplementary algorithms. Moreover, it also produces low MSE values with good computational speed (from Tab. 3). Tab. 4 shows the average difference values and Tab. 5 shows the maximum difference. Tab. 6 shows the LMSE values and Tab. 7 shows the NAE values. From the tables, it is identified that the proposed approach yields good results. Ensemble classifier performance is shown in Tabs. 8–10. The value of Accuracy, Precision and F-measure are calculated using Cross validation and Partitioning technique as K-FOLD. Ensemble classifier gives better performance in all the three metrics.
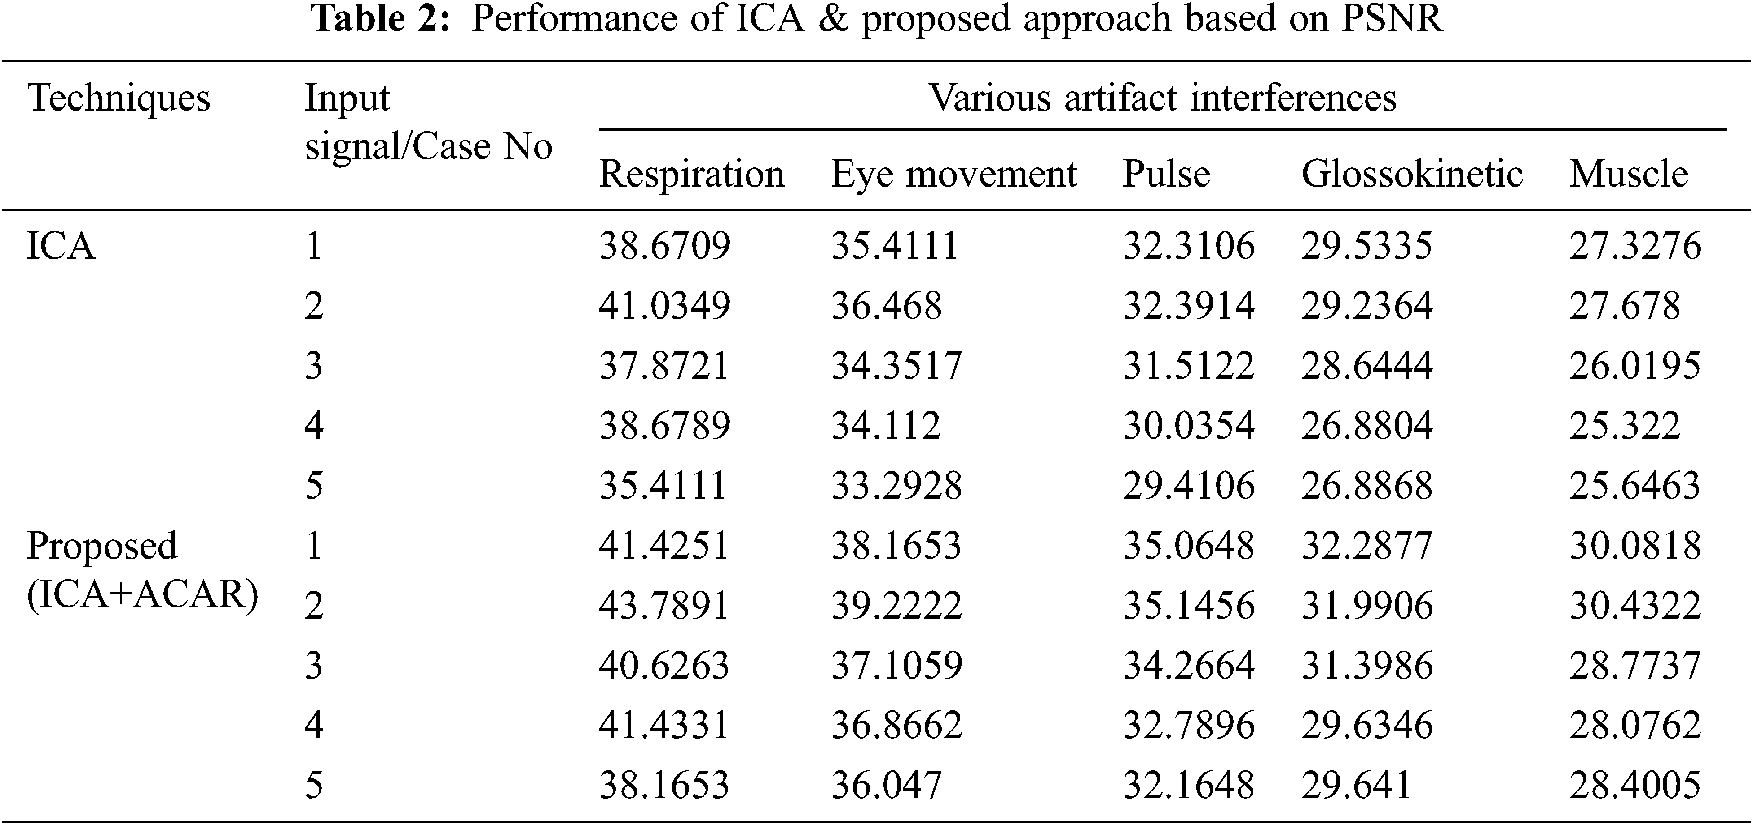
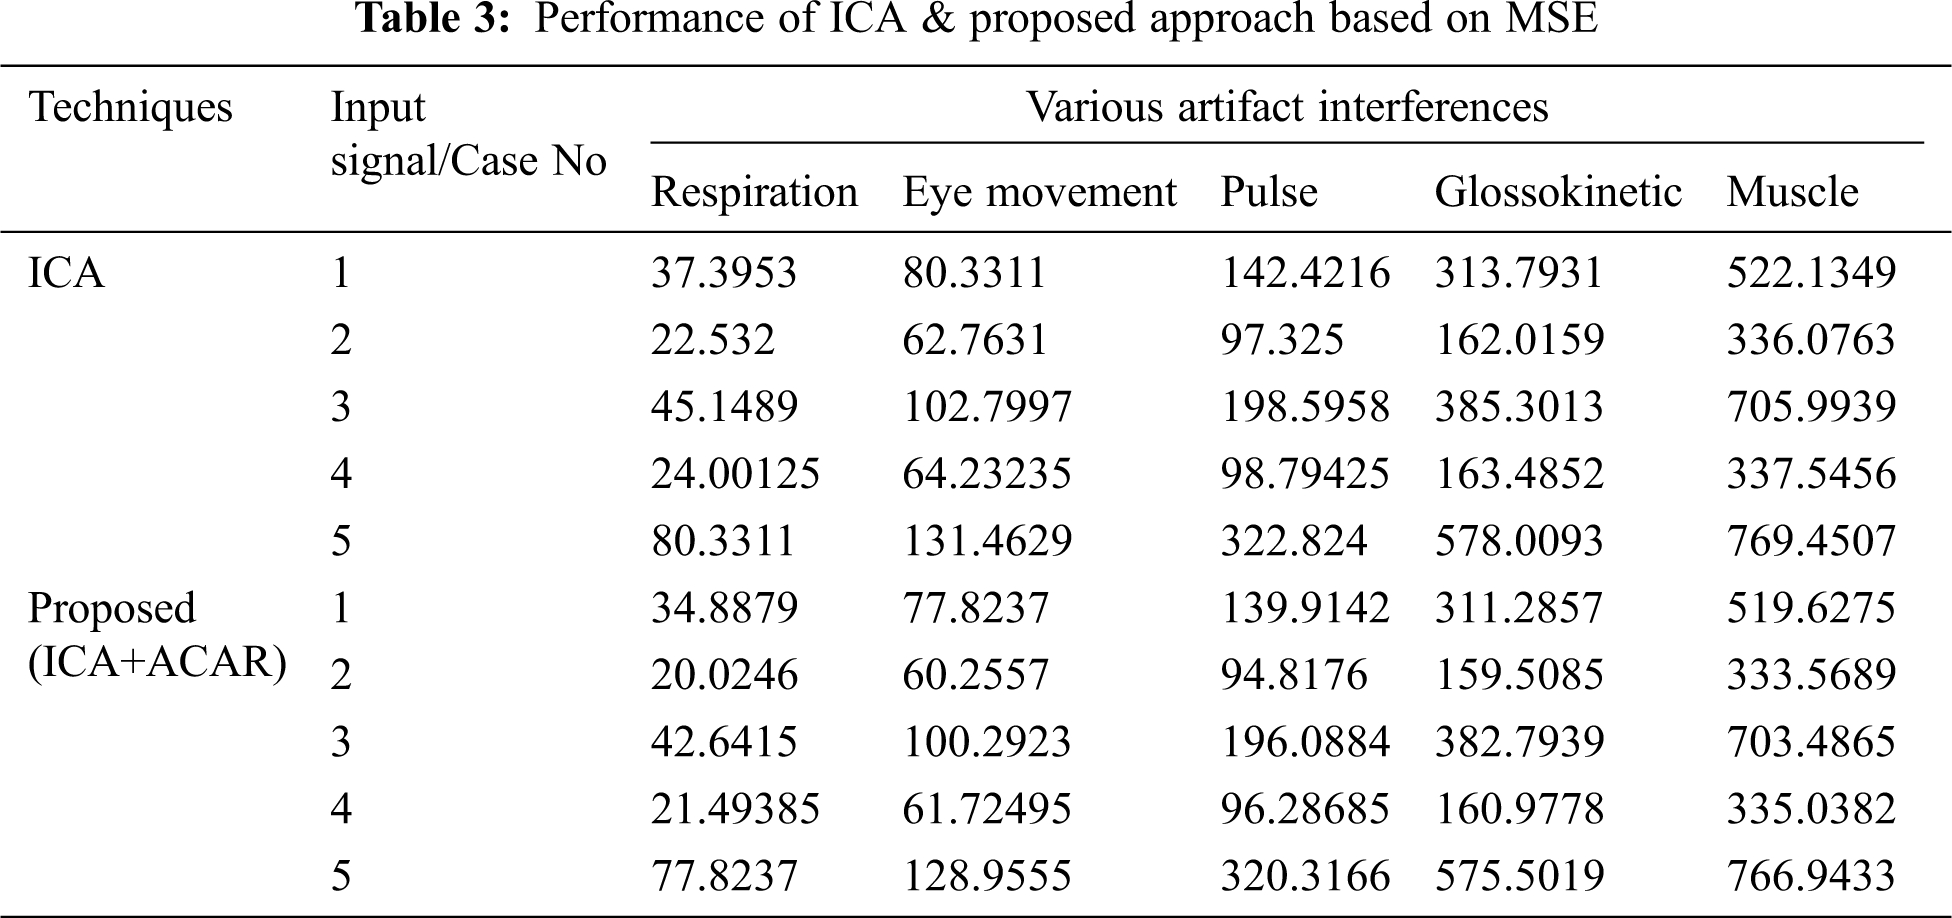

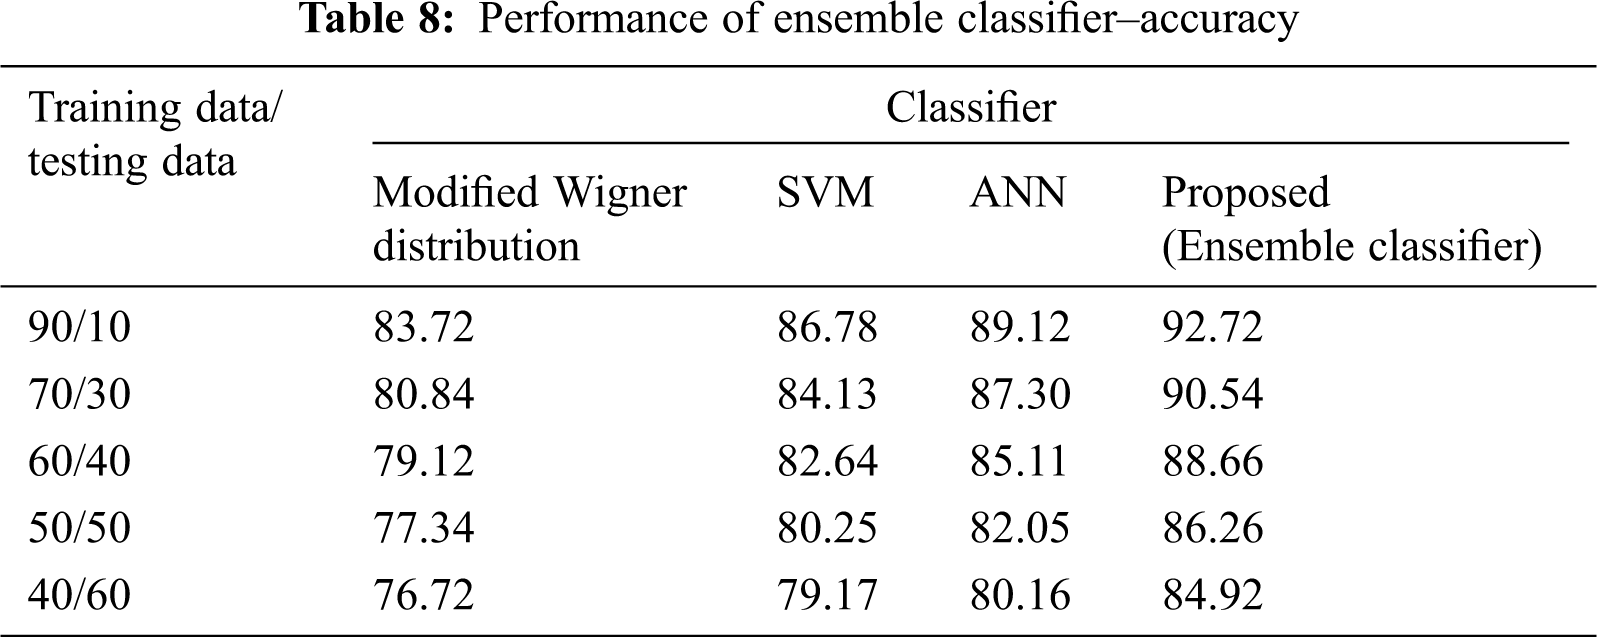
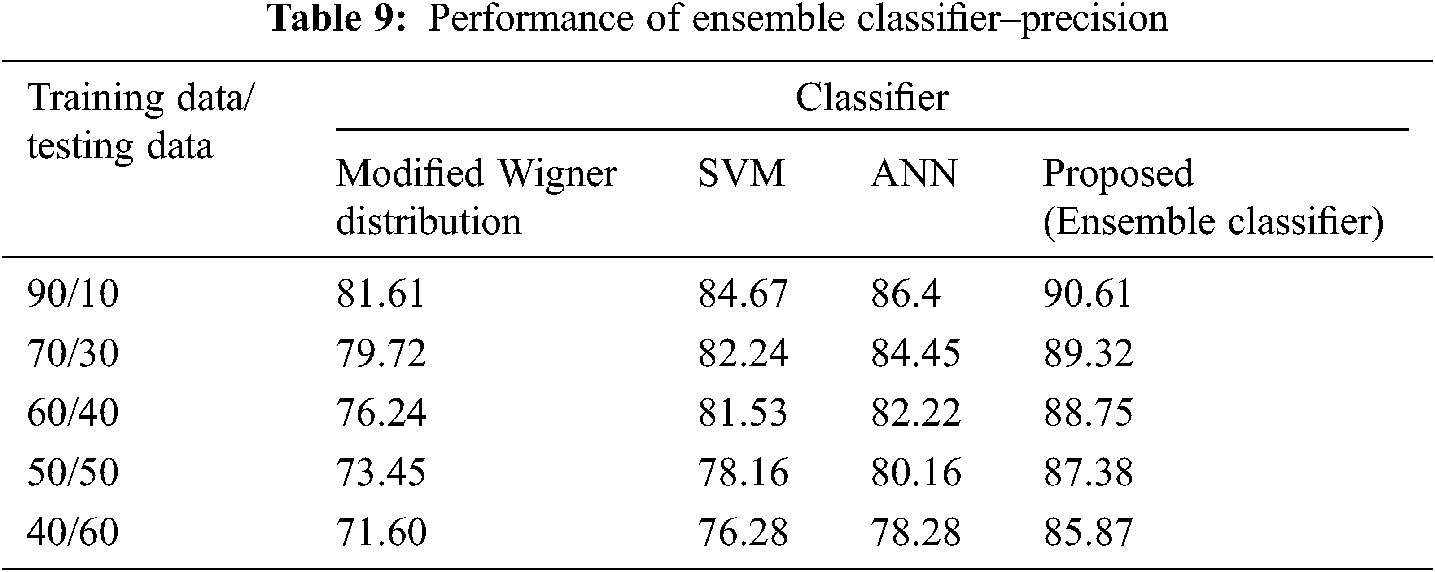
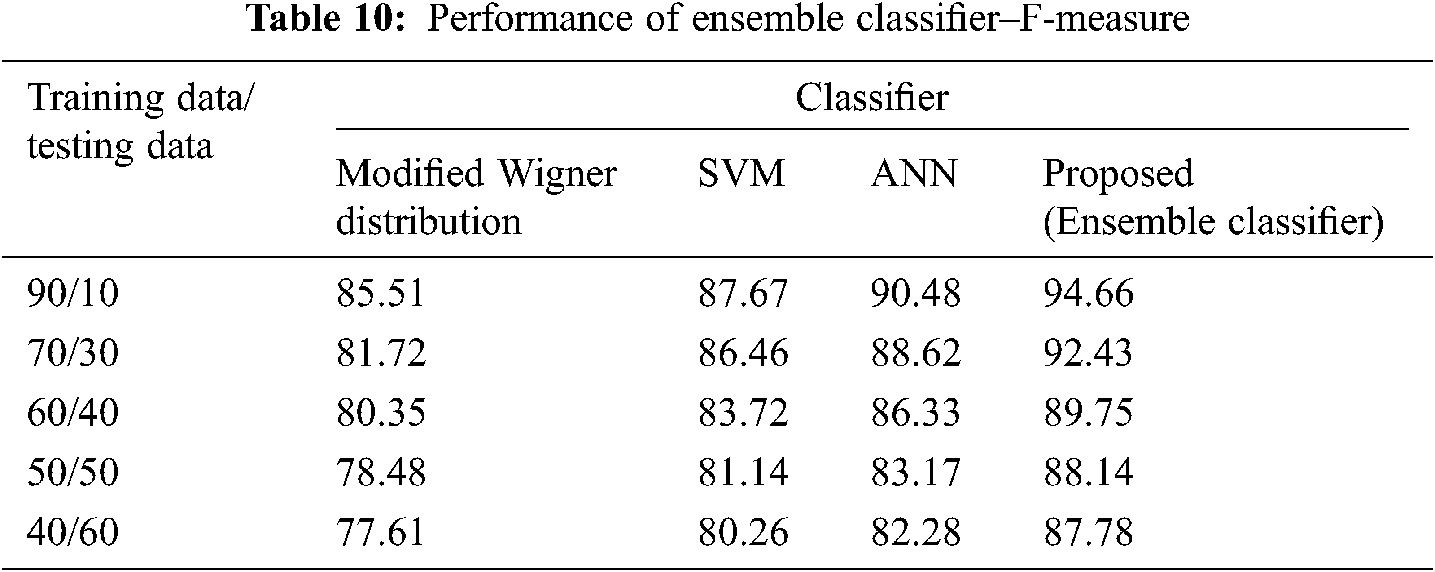
The novelty of efficient artifact removal by ICA coupled with ACAR and 1D-LDP visual descriptors and classified using Ensemble classifier makes this proposed paper an optimal and ideal tool for enabling automated epileptic detection of EEG signals at best and at the earliest too. The proposed strategy for automated EEG analysis is found to exhibit superior PSNR value compared with other existing algorithms. The proposed strategy also produces low MSE values with good computational speed. Performance with respect to accuracy, precision and F-measure is also highly better when compared with the existing strategies. Altogether, the proposed strategy has yielded augmented performance and results.
The future scope of the research includes a varied range of pathologies and to development of lightweight epileptic seizure detection and monitoring system with multi-modal data.
Ictal EEG may also be uninterpretable or difficult to read if movements generate excessive artifact. To enable the robotic epileptic detection, EEG signals can be combined with multi-modality images. So that it can improve the performance.
Acknowledgement: This research did not receive any specific grant from funding agencies in the public, commercial, or not-for-profit sectors.
Funding Statement: The authors received no specific funding for this study.
Conflicts of Interest: The authors declare that they have no conflicts of interest to report regarding the present study.
1. S. Supriya, S. Siuly and Y. Zhang, “Automatic epilepsy detection from EEG introducing a new edge weight method in the complex network,” Electronics Letters, vol. 52, no. 17, pp. 1430–1432, 2016. [Google Scholar]
2. M. Z. Parvez and M. Paul, “Epileptic seizure detection by exploiting temporal correlation of electroencephalogram signals,” IET Signal Processing, vol. 9, no. 6, pp. 467–475, 2015. [Google Scholar]
3. G. Wang, C. Teng, K. Li, Z. Zhang and X. Yan, “The removal of EOG artifacts from EEG signals using independent component analysis and multivariate empirical mode decomposition,” IEEE Journal of Biomedical and Health Informatics, vol. 20, no. 5, pp. 1301–1308, 2015. [Google Scholar]
4. F. Riaz, A. Hassan, S. Rehman, I. K. Niazi and K. Dremstrup, “EMD-Based temporal and spectral features for the classification of EEG signals using supervised learning,” IEEE Transactions on Neural Systems and Rehabilitation Engineering, vol. 24, no. 1, pp. 28–35, 2016. [Google Scholar]
5. R. C. Sharpley and V. Vatchev, “Analysis of the intrinsic mode functions,” Constructive Approximation, vol. 24, no. 1, pp. 17–47, 2006. [Google Scholar]
6. M. Zabihi, S. Kiranyaz, A. B. Rad, A. K. Katsaggelos, M. Gabbouj et al., “Analysis of high-dimensional phase space via poincaré section for patient-specific seizure detection,” IEEE Transactions on Neural Systems and Rehabilitation Engineering, vol. 24, no. 3, pp. 386–398, 2015. [Google Scholar]
7. D. Gajic, Z. Djurovic, S. Di Gennaro and F. Gustafsson, “Classification of EEG signals for detection of epileptic seizures based on wavelets and statistical pattern recognition,” Biomedical Engineering: Applications, Basis and Communications, vol. 26, no. 2, pp. 1450021, 2014. [Google Scholar]
8. P. K. Das, A. Mohapatra and M. R. Panda, “Epilepsy disorder detection from EEG signal,” International Journal of Computational Intelligence and Applications, vol. 1, no. 1, pp. 41–49, 2013. [Google Scholar]
9. A. K. Jaiswal and H. Banka, “Local pattern transformation-based feature extraction techniques for classification of epileptic EEG signals,” Biomedical Signal Processing and Control, vol. 34, pp. 81–92, 2017. [Google Scholar]
10. L. L. Chen, J. Zhang, J. Z. Zou, C. J. Zhao and G. S. Wang, “A framework on wavelet-based nonlinear features and extreme learning machine for epileptic seizure detection,” Biomedical Signal Processing and Control, vol. 10, pp. 1–10, 2014. [Google Scholar]
11. I. Guler and E. D. Ubeyli, “Multiclass support vector machines for EEG-signals classification,” IEEE Transactions on Information Technology in Biomedicine, vol. 11, no. 2, pp. 117–126, 2007. [Google Scholar]
12. L. Guo, D. Rivero and A. Pazos, “Epileptic seizure detection using multiwavelet transform based approximate entropy and artificial neural networks,” Journal of Neuroscience Methods, vol. 193, no. 1, pp. 156–163, 2010. [Google Scholar]
13. S. Chandaka, A. Chatterjee and S. Munshi, “Cross-correlation aided support vector machine classifier for classification of EEG signals,” Expert Systems with Applications, vol. 36, no. 2, pp. 1329–1336, 2009. [Google Scholar]
14. A. Subasi and M. I. Gursoy, “EEG signal classification using PCA, ICA, LDA and support vector machines,” Expert Systems with Applications, vol. 37, no. 12, pp. 8659–8666, 2010. [Google Scholar]
15. E. D. Ubeyli, “Least squares support vector machine employing model-based methods coefficients for analysis of EEG signals,” Expert Systems with Applications, vol. 37, no. 1, pp. 233–239, 2010. [Google Scholar]
16. E. D. Ubeyli “Analysis of EEG signals using lyapunov exponents,” Neural Network World, vol. 16, no. 3, pp. 257, 2006. [Google Scholar]
17. E. D. Ubeyli “Decision support systems for time-varying biomedical signals: EEG signals classification,” Expert Systems with Applications, vol. 36, no. 2, pp. 2275–2284, 2009. [Google Scholar]
18. E. D. Ubeyli, “Statistics over features: EEG signals analysis,” Computers in Biology and Medicine, vol. 39, no. 8, pp. 733–741, 2009. [Google Scholar]
19. Barua and S. Begum, “A review on machine learning algorithms in handling EEG artifacts,” in The Swedish AI Society (SAIS) Workshop SAIS, Stockholm, Sweden, vol. 14, pp. 22–23, 2014. [Google Scholar]
20. A. Flexer, H. Bauer, J. Pripfl and G. Dorffner, “Using ICA for removal of ocular artifacts in EEG recorded from blind subjects,” Neural Networks, vol. 18, no. 7, pp. 998–1005, 2005. [Google Scholar]
21. C. Zhao and T. Qiu, “An automatic ocular artifacts removal method based on wavelet-enhanced canonical correlation analysis,” in 2011 Annual Int. Conf. of the IEEE Engineering in Medicine and Biology Society, Boston, MA, USA, pp. 4191–4194, 2011. [Google Scholar]
22. N. P. Castellanos and V. A. Makarov, “Recovering EEG brain signals: Artifact suppression with wavelet enhanced independent component analysis,” Journal of Neuroscience Methods, vol. 158, no. 2, pp. 300–312, 2006. [Google Scholar]
23. M. K. Islam, A. Rastegarnia and Z. Yang, “A wavelet-based artifact reduction from scalp EEG for epileptic seizure detection,” IEEE Journal of Biomedical and Health Informatics, vol. 20, no. 5, pp. 1321–1332, 2015. [Google Scholar]
24. J. W. Kelly, D. P. Siewiorek, A. Smailagic and W. Wang, “Automated filtering of common-mode artifacts in multichannel physiological recordings,” IEEE Transactions on Biomedical Engineering, vol. 60, no. 10, pp. 2760–2770, 2013. [Google Scholar]
25. N. Mammone, F. La Foresta and F. C. Morabito, “Automatic artifact rejection from multichannel scalp EEG by wavelet ICA,” IEEE Sensors Journal, vol. 12, no. 3, pp. 533–542, 2012. [Google Scholar]
26. M. A. Klados, C. Papadelis, C. Braun and P. D. Bamidis, “REG-Ica: A hybrid methodology combining blind source separation and regression techniques for the rejection of ocular artifacts,” Biomedical Signal Processing and Control, vol. 6, no. 3, pp. 291–300, 2011. [Google Scholar]
27. G. L. Wallstrom, R. E. Kass, A. Miller, J. F. Cohn and N. A. Fox, “Automatic correction of ocular artifacts in the EEG: A comparison of regression-based and component-based method,” International Journal of Psychophysiology, vol. 53, no. 2, pp. 105–119, 2004. [Google Scholar]
28. H. Hallez, M. De Vos, B. Vanrumste, P. Van Hese, S. Assecondi et al., “Removing muscle and eye artifacts using blind source separation techniques in ictal EEG source imaging,” Clinical Neurophysiology, vol. 120, no. 7, pp. 1262–1272, 2009. [Google Scholar]
29. N. Chatlani, and J. J. Soraghan, “Local binary patterns for 1-d signal processing,” in European Signal Processing Conf., Aalborg, pp. 95–99, 2010. [Google Scholar]
30. Y. Kaya, M. Uyar, R. Tekin and S. Yildirim, “1D-Local binary pattern based feature extraction for classification of epileptic EEG signals,” Applied Mathematics and Computation, vol. 243, pp. 209–219, 2014. [Google Scholar]
31. A. L. Goldberger, L. A. Amaral, L. Glass, J. M. Hausdorff, P. C. Ivanov et al., “Physiobank, physioToolkit, and physioNet: Components of a New Research Resource for Complex Physiologic Signals,” vol. 101, no. 23, pp. 215–220, 2000. [Google Scholar]
 | This work is licensed under a Creative Commons Attribution 4.0 International License, which permits unrestricted use, distribution, and reproduction in any medium, provided the original work is properly cited. |