DOI:10.32604/iasc.2022.023449
| Intelligent Automation & Soft Computing DOI:10.32604/iasc.2022.023449 | |
| Article |
Efficient Urban Green Space Destruction and Crop Stress Yield Assessment Model
1Saveetha School of Engineering, Saveetha Institute of Medical and Technical Sciences, Saveetha University, Thandalam, Chennai, 602105, India
2Department of Electronics and Communication Engineering, College of Engineering & Technology, SRM Institute of Science and Technology, Vadapalani Campus, Chennai, 600026, India
*Corresponding Author: S. Srinivasan. Email: srinivasan.me.03@gmail.com
Received: 08 September 2021; Accepted: 11 October 2021
Abstract: Remote sensing (RS) is a very reliable and effective way to monitor the environment and landscape changes. In today’s world topographic maps are very important in science, research, planning and management. It is quite possible to detect the changes based on RS data which is obtained at two different times. In this paper, we propose an optimal technique that handles problems like urban green space destruction and detection of crop stress assessment. Firstly, the optimal preprocessing is performed on the given RS dataset, for image enhancement using geometric correction and image registration. Secondly, we propose the improved cat swarm optimization algorithm to optimize the greenery region with the help of vegetation index parameters like Normalized Difference Built-up Index (NDBI) & Normalized Difference Vegetation Index (NDVI). Thirdly, we use Conditional Principal Component Analysis (PCA) to reduce dimension of a response matrix & retain the dominant information to identify key vegetation indices and the classification of crops. Then, an optimal decision maker-based post classification method is introduced to differentiate area changes based on the overlay of two or more classified images. From the simulation results we observed and conclude that the performance of proposed crop classification, crop stress and yield assessments performed very effective compared to existing methods in terms of F-Measure, recall, precision & accuracy.
Keywords: Remote sensing; crop classification; crop stress assessment; green space destruction; machine learning; preprocessing
Green spaces are very important in defining the quality of the urban regions in which the greeneries like trees, bushes etc.… play a vital role in cleaning up the air, balancing water circulation and maintaining recreational areas. In the urban space planning of the cities, the access to green spaces is one of the parameters which would provide opportunities for recreational activities in urban environments [1,2]. Landscaping is one of the most important factors, which creates an adaptive environment with a natural cover [3] which transforms these demographic and spatial regions into urban landscapes acceptable from natural cover types, while business needs in cities and suburbs are increasingly transforming urban green spaces to receive information about these changes. Studies over the last two decades have shown that urban green spaces are rapidly disappearing or shrinking dangerously in urban areas [4]. The contributing factor to such demolition is urbanization [5,6]. Urbanization is the density of the city center or the external expansion of urban areas. The density of the urban center indicates a high population density and an increase in the built-in atmosphere associated with open spaces. Urban development is often associated with the development of urban boundaries, peri-urban landscapes, and urban areas of former agricultural land [7]. Rapid urbanization has turned many urban lands into structural structures and led to the excessive destruction of natural habitats, including green spaces.
Satellite image analysis with Remote Sensing (RS) techniques helps to accurately detect and control these changes. There are several reports examining land use change using satellite data, some of which will be mentioned [8,9]. Five techniques include: addition, subtraction, segmentation, policy module, and taxonomic analysis to identify landscape changes [10]. The technique of adding and subtracting images is the simplest of these techniques, and further analysis of PCI and classification shows excellent results for detecting changes [11,12], reduction and classification to study the full development of Massachusetts urban development and the resulting topographic changes. The PCI and mitigation techniques represent a topographic map of southern Tehran and that regression analysis with PCI shows excellent results. Therefore, based on previous studies on landscape change detection, it is clear that most researchers have used PCI techniques to detect landscape changes and to classify many temporary images that show results in quantitative form [13].
Remote Sensing [14–17] of vegetation is done by using passive sensors which is used for analyzing the ElectroMagnetic (EM) wave reflectance since the light reflection by the plants varies according to the type of plant, the amount of water in the tissues. The reaction of plants to EM spectrum is determined by morphological & chemical changes on the plants surface [18]. Understanding epistemological urban patterns and their dynamics on many levels is a real challenge for area management. Several techniques [19,20] The focus is on developing innovative taxonomic methods and techniques to improve taxonomic accuracy. The Support Vector Machine (SVM), which supports the classification and maximal capabilities of the multilayer perception neural network, worked better than the current traditional Machine Learning (ML) method classifiers.
This paper proposes an optimal technique that handles problems like urban green space destruction and detection of crop stress assessment. Firstly, the optimal preprocessing is performed on the given RS dataset, for image enhancement using geometric correction and image registration. Secondly, we propose the improved cat swarm optimization algorithm to optimize the greenery region with the help of vegetation index parameters like Normalized Difference Built-up Index (NDBI) & Normalized Difference Vegetation Index (NDVI). Thirdly, we use Conditional Principal Component Analysis (PCA) to reduce dimension of a response matrix & retain the dominant information to identify key vegetation indices and the classification of crops. Then, an optimal decision maker-based post classification method is introduced to differentiate area changes based on the overlay of two or more classified images.
The aim of this study is to determine the degradation that occurs in urban green space and crop stress assessment using image enhancement and geometry image correction using optimal pre-processing techniques. For each phase of crop growth, it is necessary to define a key factor analysis for quantitative assessment. The paper is organized as follows. In Section 2, we have listed out the previous urban destruction papers based on existing technology. In Section 3, the system model & problem methodology is presented. In Section 4, we demonstrate the proposed algorithm for urban green space destruction and crop stress assessment detection. In Section 5, we discuss the analysis of results followed by conclusions in Section 6.
Liu et al. [21] have provided an in-depth overview of the Leaf Area Index (LAI) assessment which is based on Hyper-Spectral (HS) methods. HS data reflect their potential & limitations when assessing LAI. The 3 types of approaches used to evaluate LAI are based on physical, statistical models & hybrid inversion. However, due to the simplicity of the LAI estimation and the methods used for spatial diversity, the resulting LAI values will change depending on the spatial resolution. Therefore, many models & inversion strategies are detailed out and this paper highlights the challenges related to the LAI.
Zhou et al. [22] have proposed 2 potato-based imaging which is used to determine the extent of potato damage in four hail damage conditions: 0% (control), 33%, 66%, and 99% at the 3 stages of TB onset. Crops damaged in the early stages of tuberculosis showed recovery from moderate to extensive damage, as envisaged by Green NDVI (GNDVI) values after 32 days of damage, corresponding to the final harvest. Overall, GNDVI rates are lower than other injuries for severe injuries. The results indicate that early-stage plant performance is well related to crop production.
Kishorekumar et al. [23] have proposed an algorithm for detecting the changes in the MS images using multiindex information and the advantages are: The complicated images have been represented by semantic information. Information codes can be specified directly in older classes, and changes can be fixed automatically using an unauthorized approach. In a multi-index info graphic map, plants, water and buildings are separated by advanced plant coding, standard water variation coding, and highly developed efficient morphological building coding. This algorithm checks for many temporary landscape ETM + images in Coimbatore, Tamil Nadu, India.
Leichtle et al. [24] have presented a physical approach for detecting illegal alterations focused on individual buildings. Primary component analysis is performed by a unique process to determine the number of associated primary components as a precursor to change detection. K-object clustering is used to distinguish between modified and irreplaceable buildings. The effect of visual geometry exclusion is measured when using VHR data obtained from different sensors. This workflow gives possible results in the sequence of calculating different characteristics of 0.8–0.9 and more, showing the relevance of detecting unauthorized changes in a dynamic urban environment.
Leichtle et al. [25] have explained the nature of class distribution and class inequality and the consequences of binary conversion detection programs based on VHR images in cities. A diagnostic framework is used for large-scale class inequality susceptibility analysis, which is particularly important in relation to the generation and distribution of image content and classes and generally unknown supervisory approaches. The change detection approach is based on object-oriented features which are calculated from two classes of clustering by K-means algorithms, genetic K algorithms, and Self Organizing Map (SOM) clusters.
Dalmiya et al. [26] have proposed the Structural Phase Congruency Histogram (SPCH) which describes the detection of automatic changes without significant loss of information. The yield of a particular characteristic depends on the structural characteristics of the image, which differ in visual intensity and brightness. The structural phase is linked to similarity histograms to create edge and angle characteristics. Using Linear Discrimination Analysis (LDA) to create the SPCH-LDA description reduces the size of the view vector, which is too strong for image scale variations.
Frick et al. [27] This paper proposes a methodology to estimate the various urban indicators such as green scale and soil ring is with the highest accuracy and is based on various sensors such as aerial stereo images, fast bird, sentinel 2, HRSC and LIDIN. This algorithm provides in-depth analysis of urban development and an understanding of the functional relationships between urban planning processes.
3 Problem Methodology and System Model
Li et al. have demonstrated databases which are measured at different times & at spatial scales, but are similar from the Community Weighted Means (CWM), Leaf Dry Matter Content (LDMC) of Specific Leaf Area (SLA).
Today, the protection of cultural heritage is a major issue that negatively affects the ecological and traditional characteristics that are subject to long-term human action, thus regulating archaeological features and changing the historical landscape. Loss of floor alignment above the tunnels can cause the surface to collapse and eventually flood areas to appear on the surface. Due to inadequate planning and management, rapid urban growth and massive land losses, especially in green space, have become a major challenge for sustainable urban development. The aim of this study is to determine the degradation that occurs in urban green space, crop stress and yield assessment. In this paper, we propose an optimal technique that handles problems related to urban green space destruction detection and crop stress assessment.
• First, the optimal preprocessing is performed on given RS image for data, image enhancement are geometric correction and image co-registration.
• Second, we propose the improved cat swarm optimization algorithm to optimize the radiometric information’s (vegetation index) are NDBI & NDVI.
• Third, we illustrate conditional principal component analysis to reduce dimension of a response matrix, retain the dominant information to identify key vegetation indices and their correlation with abiotic stress at each growth stage.
• Then, an optimal decision maker-based post classification method is introduced to differentiate area changes based on the overlay of two or more classified images.
We have to process the remote sensing images to extract the required parameters.
4.1 Optimal Data Preprocessing
Most real-world classifications require supervised study where the basic class probability and the conditional probability of the class are unknown. Therefore, in order to better represent the domain, the characteristics of several classes were introduced, resulting in properties that were unnecessary for the target concept. After creating the attributes, it first selects the subspecies and then processes the selected algorithm with the selected data. Fig. 1 represents the system model of proposed work. The characteristics selection stage may differ from the learning process, such as filtering models or re-learning methods to evaluate the quality of selected characteristics. Filter characteristic selection methods use a statistical scale and these methods are homogeneous, and it considers an independent or dependent variable Fisher score: High quality characteristics should give the same values to events of the same class and different values to events of different classes, where μji and nji are the mean and the variance of the i-th feature in the j-th class respectively, nj is the number of instances in the j-th class, and μi is the mean of the i-th feature special label indicator matrix, as follows.
The prediction model we used to evaluate the combination of features and to score based on sampling accuracy. In the case of pre-classification, a typical packaging model will perform the following steps:
i) Searching a subset of features,
ii) Evaluating the selected subset of features by the performance of the classifier,
iii) Repeating Steps 1 & 2 till it reaches the desired quality.
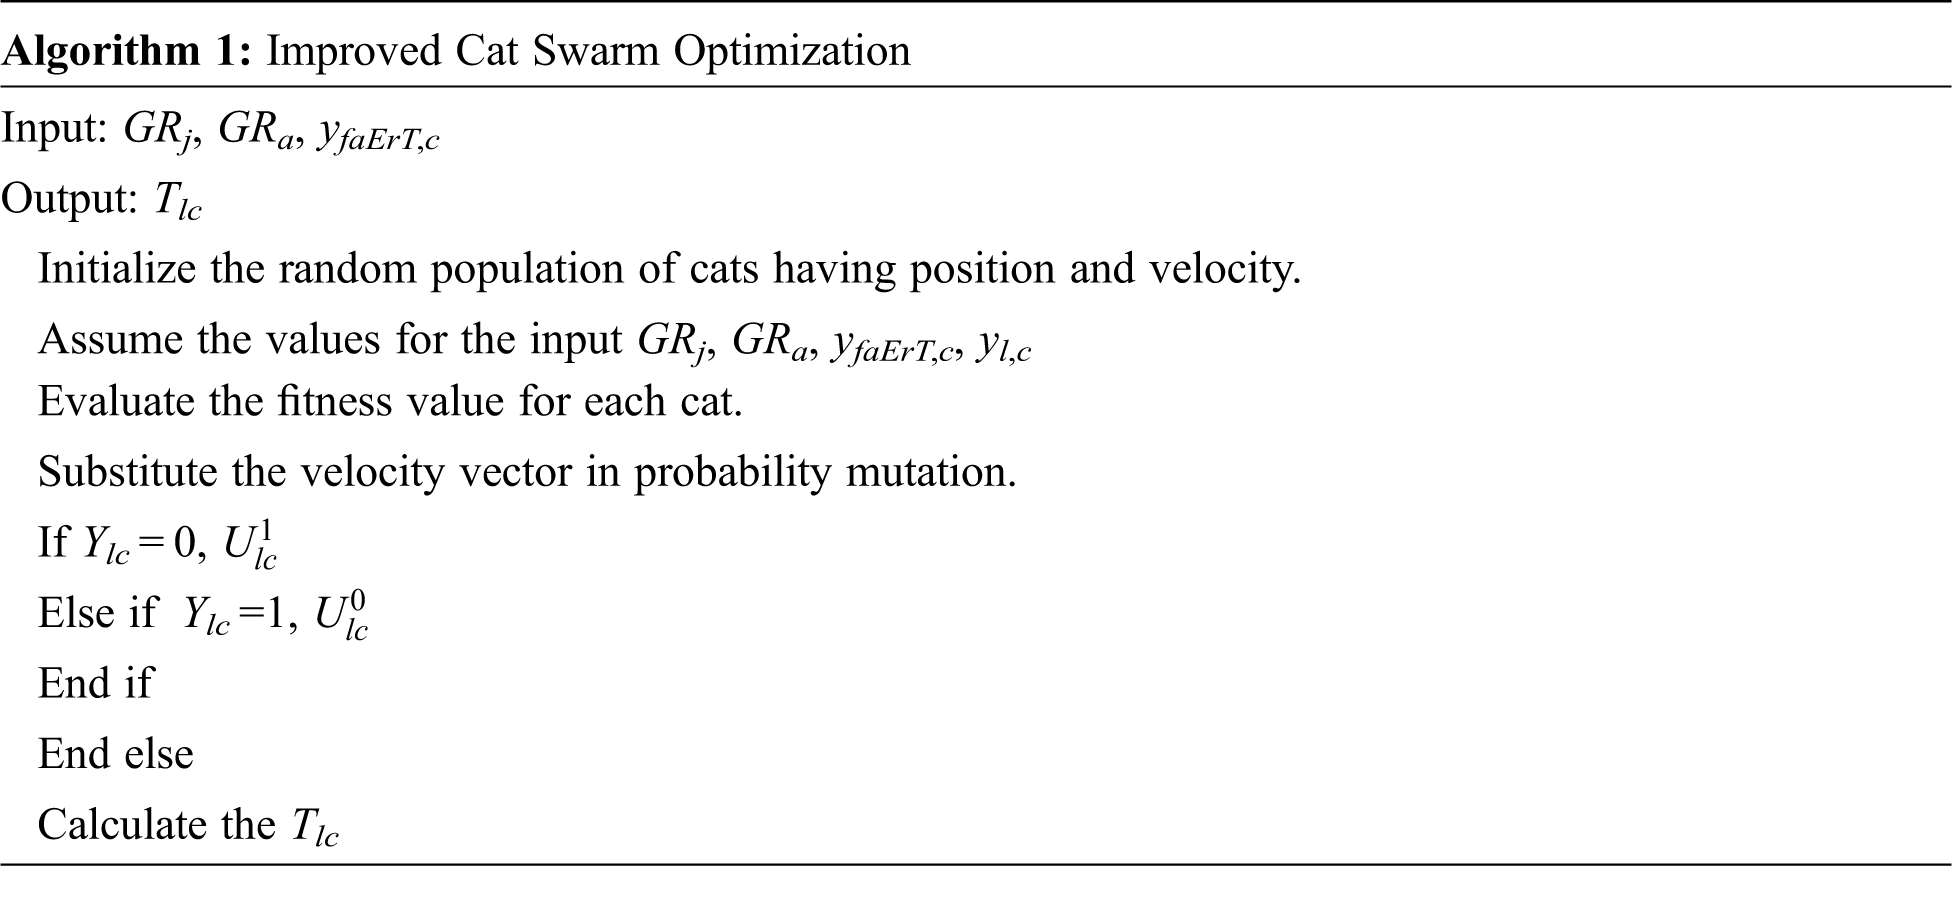
4.2 Optimization of Radiometric Information Using ICSO
A vegetation index is a number that measures plant biomass and/or plant capacity in a RS image. NDVI is very useful for monitoring global vegetation and it performs dense vegetation and makes the soil color more sensitive. NDBI is an index which refers to the most reflective urban areas in the Short-Wave infrared Region (SWR) compared to the Near- Infrared Region (NIR). Cat optimization is a method of group intelligence used to determine the behavior of cats. A new cat optimization algorithm was identified in the study of cat behavior. In this algorithm it is suggested that cats have a search mode and a tracking mode. In seeking mode, the cat moves slowly and close to its original posture. In each level, the cat moves at its own speed in tracking mode. The first parameter is the number of cats considered to solve the optimization problem. The position vector and velocity are calculated for each cat. The fitness value of each cat exercise activity is considered after assessing the condition of the cat. To determine the cat mode, each cat is assigned a flag. The complex ratio is used to combine the two methods in the algorithm and the parameter range is the interval [0, 1] that determines the percentage of cats in the seeking mode and the tracking mode. The appropriate solution for each cat is placed according to the corresponding cat and the process is repeated till the stop criteria is reached.
Seeking Mode
The seeking method is similar to a cat rest area. In this mode they look around and try to move on to the next level and it has four essential components: Seeking Memory Pool (SMP) Search, Selected Size, Range Search, Convertible Size Quantity, and Self-Position Consideration (SPC).
The explanation of the Seeking Mode is detailed below:
i) If the SPC flag is a copy of each cat’s current status SMP-1, one candidate will receive the current status of the other candidate. If the SPC flag is zero, make SMP copies of each cat’s, current status.
ii) Replace the old CDC dimensions and current values for each copy with a calculated plus or minus SRD percentage.
iii) The fitness value of all candidate’s scores is determined.
iv) If all the cats have same value for the exercise activity, assign the same value to all candidates, or the probability of each candidate is calculated as
where GRj indicates the jth, determine the cat exercise and the minimum solution GRa = GRmax and to determine the maximum solution the GRa = GRmin
v) Select it with the roulette wheel to move the candidate point. Then, the current status of the selected candidate will change.
Tracking Mode
In this mode, the next movement of the cat determines the speed and optimal position of the cat. This method is described in three stages:
i) Updated speed for each level using the following equation,
where yfaErT,c indicates the fitness value of the cat position and yl,c refers the cat’s current position in the c-th dimension. C1 is a constant value which is selected in the interval of [0, 2] and s1 is a uniform random value which lies in the range of [0, 1].
ii) Check the speed limit and if a new speed limit is not reached, set it to the limit.
iii) The position of the cat is updated.
The CSO Algorithm proposed a binary optimization algorithm. The level vector is BCSO, which collects zeros. There are some changes between CSO and PCSO due to the above change. BCSO has search mode and tracking mode. The PCSO search mode makes small changes to the current state of each cat. All BCSO values are zero. It is said that any change in the current state of the cat is a binary mutation. The other parameters are the same in civil society organizations and a continuous version of civil society. The BCSO search engine has five stages:
i) If the SPC flag is correct, the cat’s actual status may be a potential candidate and we require additional SMP-1 copies of each cat’s current status and have achieved our current status as one of the candidates. If the SPC flag is incorrect, create SMP copies of each cat’s current status.
ii) The difference between CSO and BCSO occurs at this stage. At this point, the BCSO values move to the PMO probability of the binary and SRD mutation.
iii) According to the cost function find the fitness values of all the candidates.
Then the step 4 and step 5 are as same as the CSO seeking mode steps.
In BCSO monitoring mode, cats are aiming for the best. The definition of speed is the difference between CSO and BCSO. Variation in the current and past state of the cat shows the speed of the CSO, but in BCSO the value of the speed of each measurement of the cat shifts to the probability of change. The probability of mutation is updated as follows. The
where
where s1 refers the random values in the range of [0, 1] and Z indicates the inertia. The d1 is a constant. The cat’s velocity is calculated using the cat’s current position.
Using the below equation, the parameter T is calculated by the probability of mutation.
where Tlc lies in the interval of [0, 1]. For each dimension, the new position of the cat is updated using the value of Tlc as follows,
The least velocity vector of
The database is compiled according to characteristics such as soil type, soil moisture, temperature, humidity, pH, sown area, N soil, B soil, K soil & precipitation. Among these characteristics, parameters such as soil type, topography, temperature humidity, sowing area, soil moisture, and pH play an important role in crop recommendation.
APY datasets: The APY database is very complex in terms of the properties of natural materials. There are five groups: shape, structure, plant, area, and material. It should be noted that the plant group is unusual and only the plant class exists.
Grid size dataset: Spatial data analysis requires adequate and attractive spatial resolution data. Administrative boundaries and NUTS are multifaceted by area.
Sample submission datasets: The sample submission package template includes new or updated data sets, interpreted CRF, submission components, and data review guide.
Here, we identified important indicators for crop growth under various conditions such as vegetation, environment and soil plowing. The image data from all the bands were corrected by arranging the pixel values associated with each white group of pixels. The corrected images are RGB (R, G, B) and CIR (NIR, R, G). This process matches the pixels associated with normal spectral images. In this study, the Enhanced Vegetation Index (EVI), LII, PCA, and random interaction ratios were moderate to poor. Therefore, EVI and LAI were considered ineffective in estimating yield and pressure variations compared to the other six. This incompatibility can be caused by the low ratio of blue stripe noise in the spectrum. In this study, Non-Linear Vegetation Index (NLI), Modified NLI (MNLI), Soil Adjusted Vegetation Index (SAVI), NDVI, Optimized Soil Adjusted Vegetation Index (OSAVI) and Modified SAVI (MSAVI) had strong correlations. However, the limitations of NLIs and SVIs affected by the optical reaction of soil properties were not determined by the MNLI. Overall, only MNLI and OSAV can be considered as effective substitutes and eliminating the effects of stress assessment.
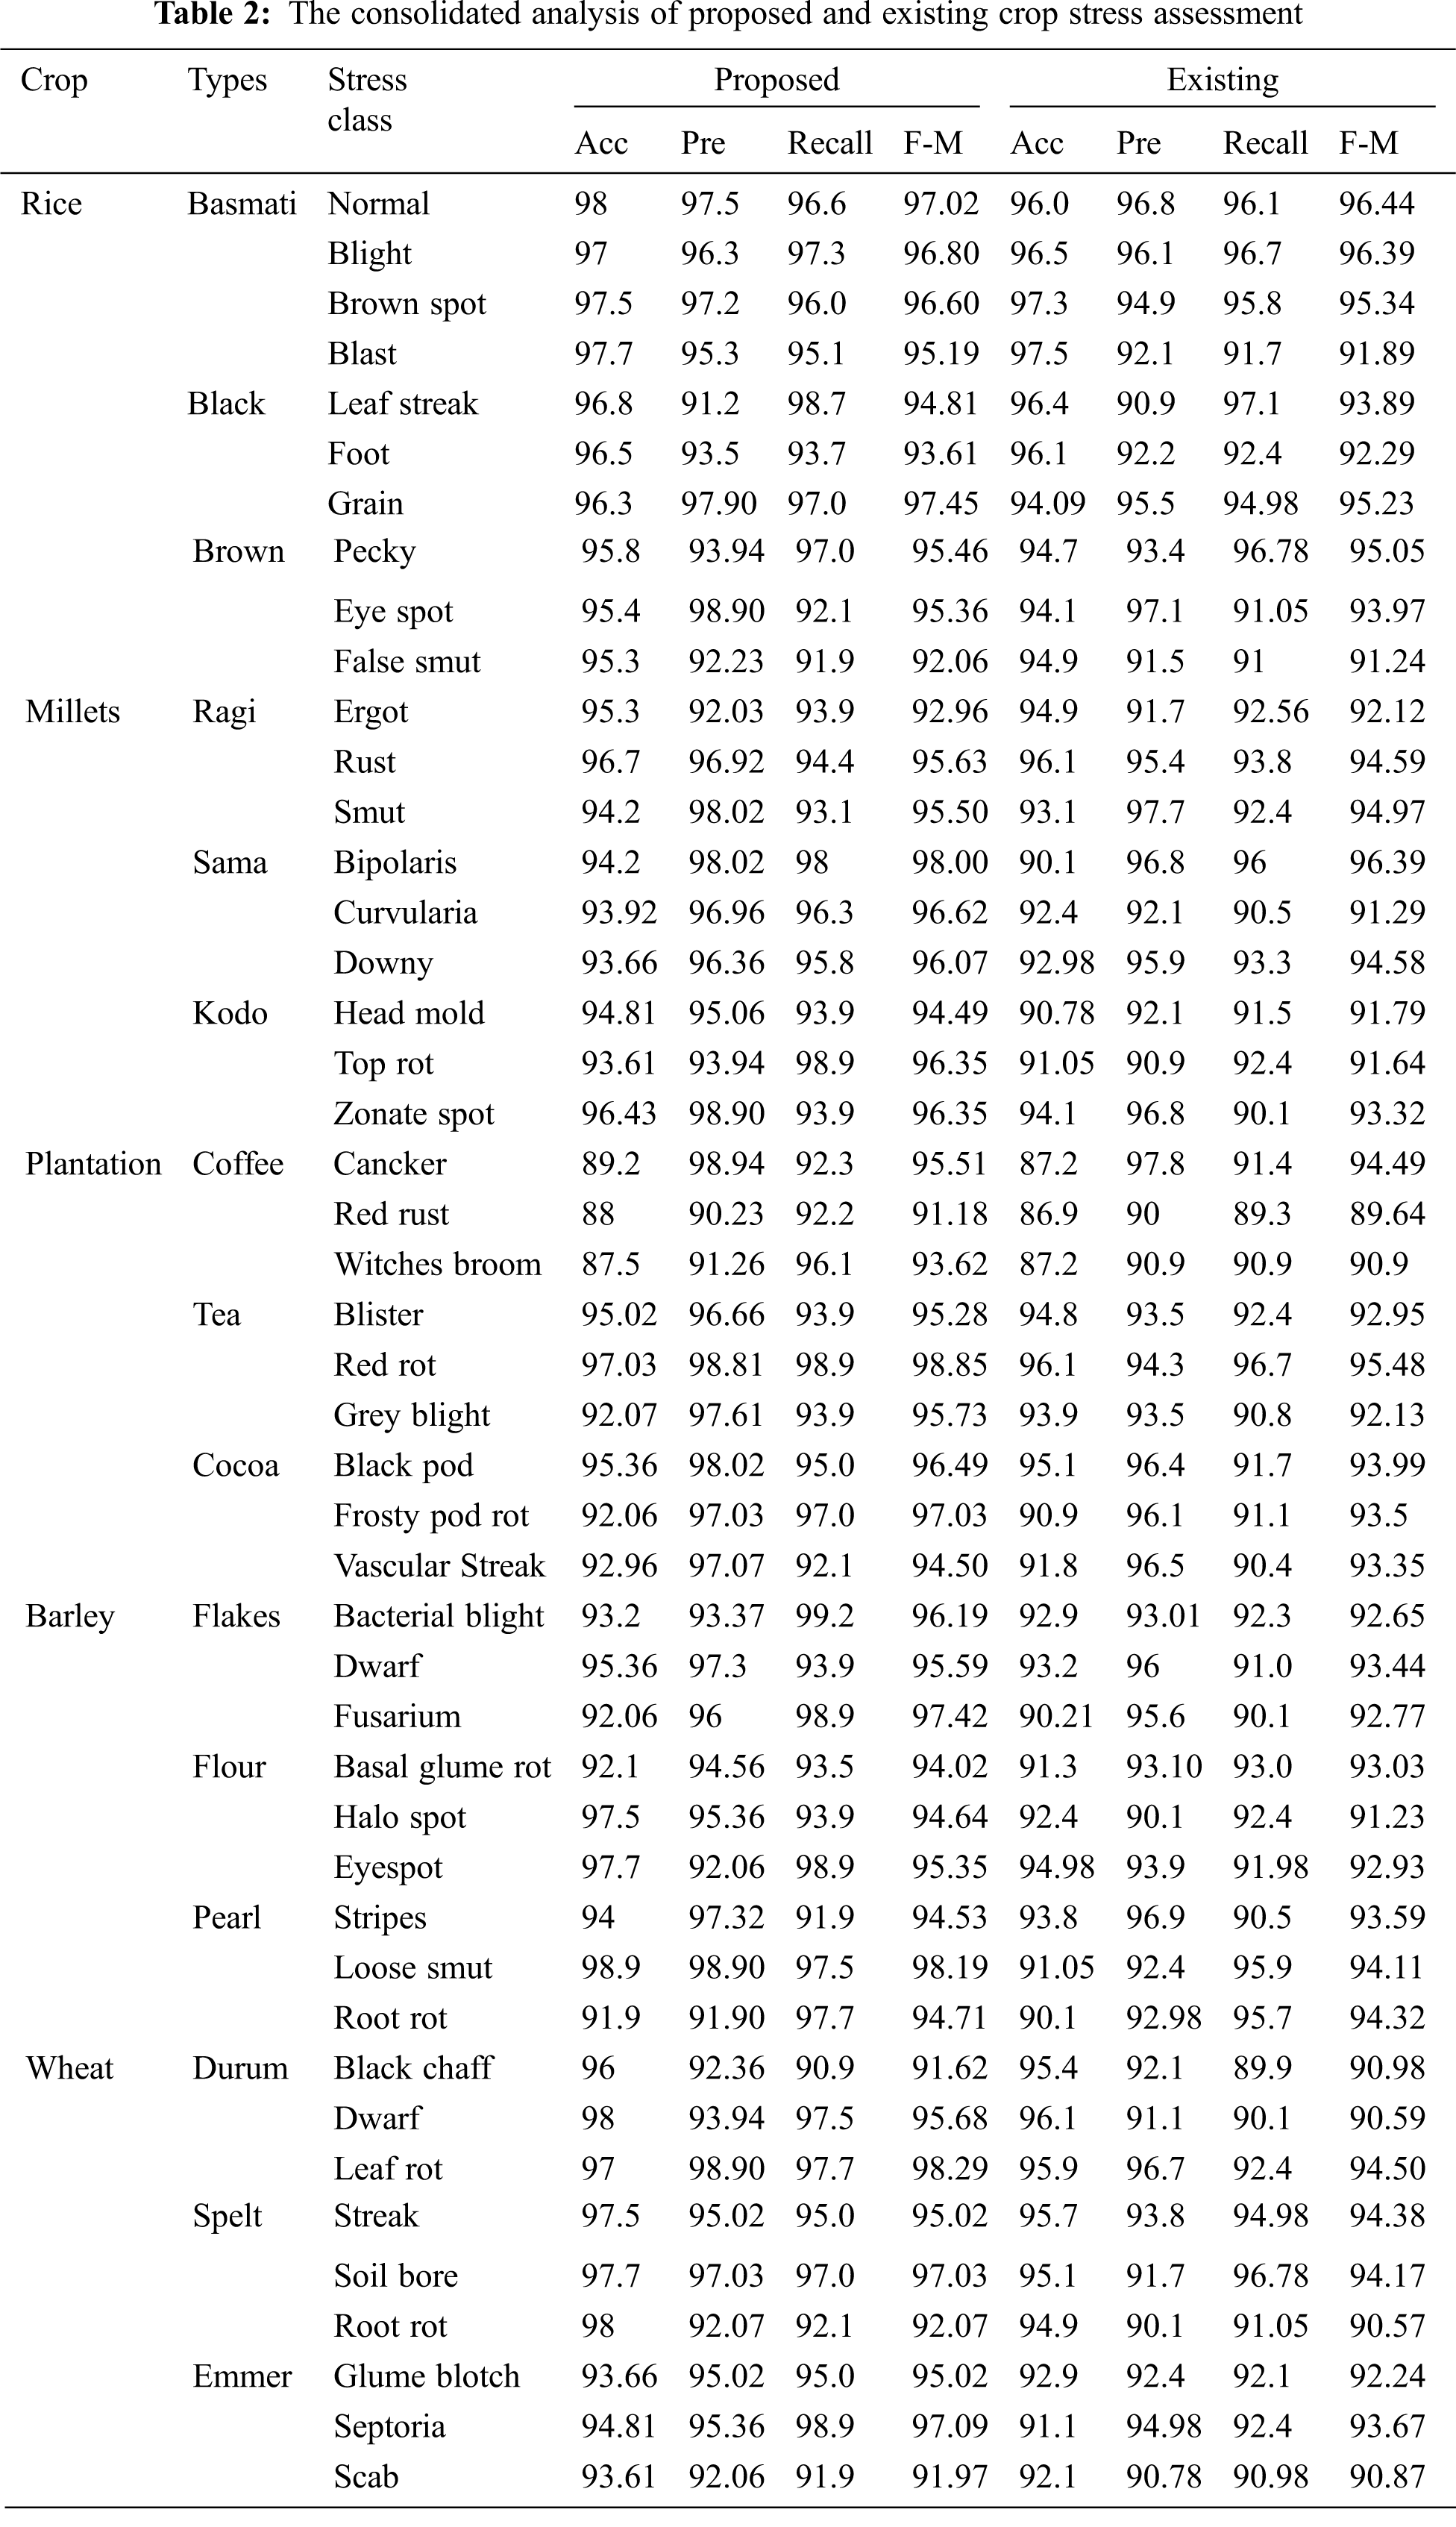
5.3 Comparative Analysis of the Existing and Proposed Crop Stress Assessment
Tabs. 1 and 2 represents the comparative analysis of the existing & proposed method for crop stress assessment. For the Rice crop, Fig. 2 represents the accuracy of proposed optimal technique which is 0.74%, 1.04% and 0.97% higher than the existing crop yield assessment for normal Basmati, Black and Brown respectively. Fig. 3 represents the precision of proposed optimal technique which is 1.66%, 1.39% & 1.06% higher than the existing crop stress assessment for Basmati, Black & Brown respectively. Fig. 4 denotes the recall of proposed optimal technique which is 1.22%, 1.72% & 0.78% higher than the existing crop yield assessment for Basmati, Black and Brown respectively. Fig. 5 indicates the F-measure of proposed optimal technique which is 1.44%, 1.55% & 0.92% higher than the existing crop stress assessment for Basmati, Black and Brown respectively.
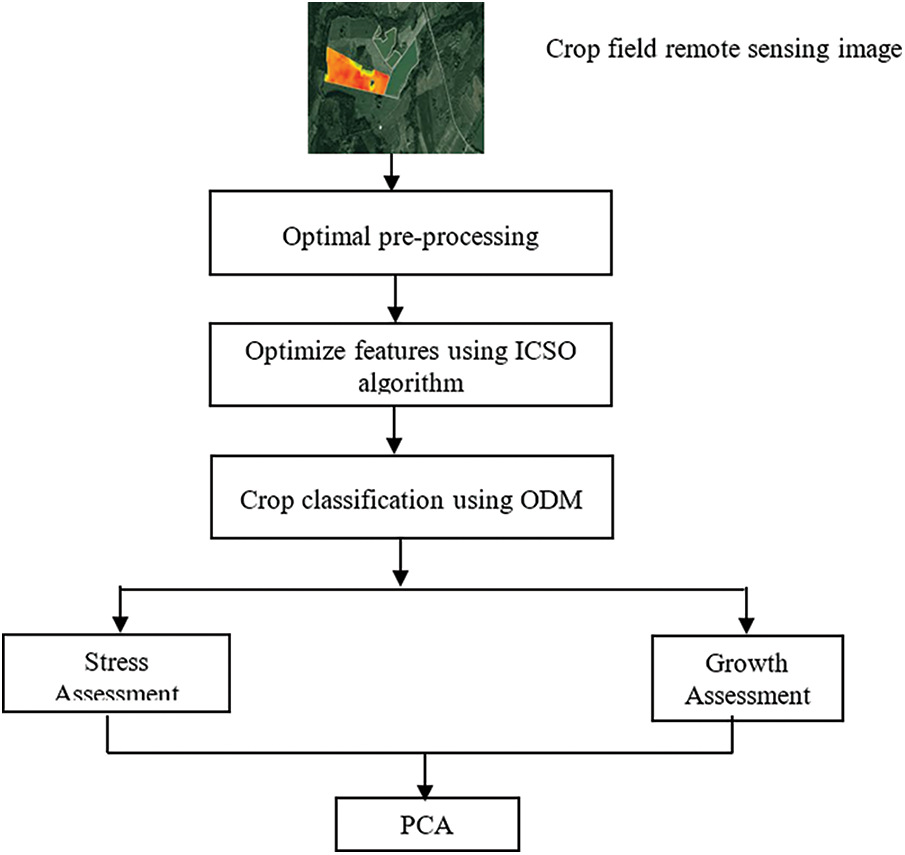
Figure 1: The system model of proposed work

Figure 2: Accuracy for various types of rice crop
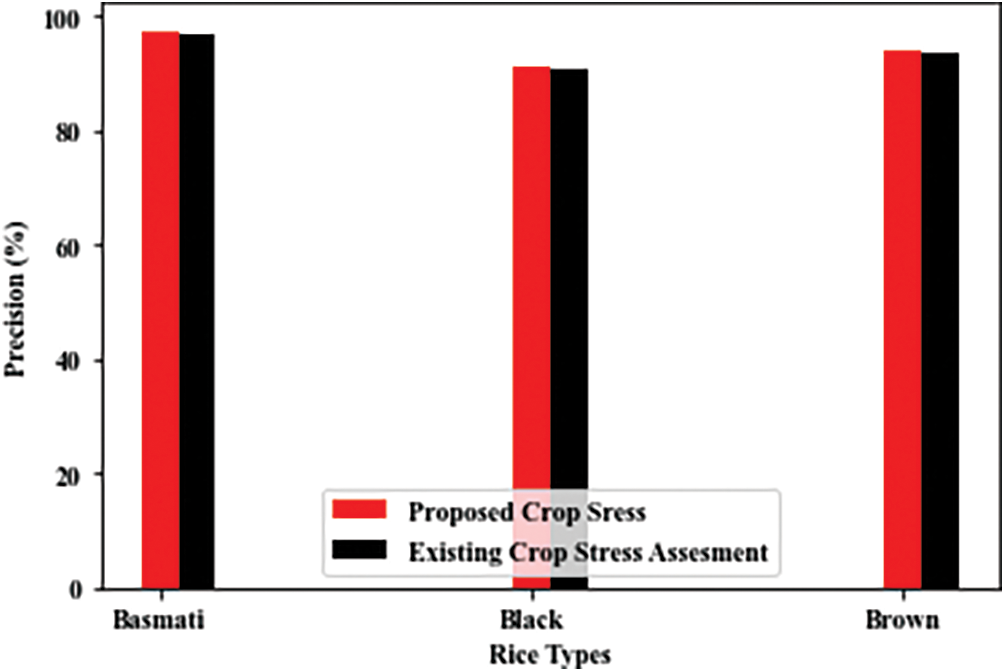
Figure 3: Precision for various types of rice crop

Figure 4: Recall for various types of rice crop

Figure 5: The F–measure for various types of rice crop
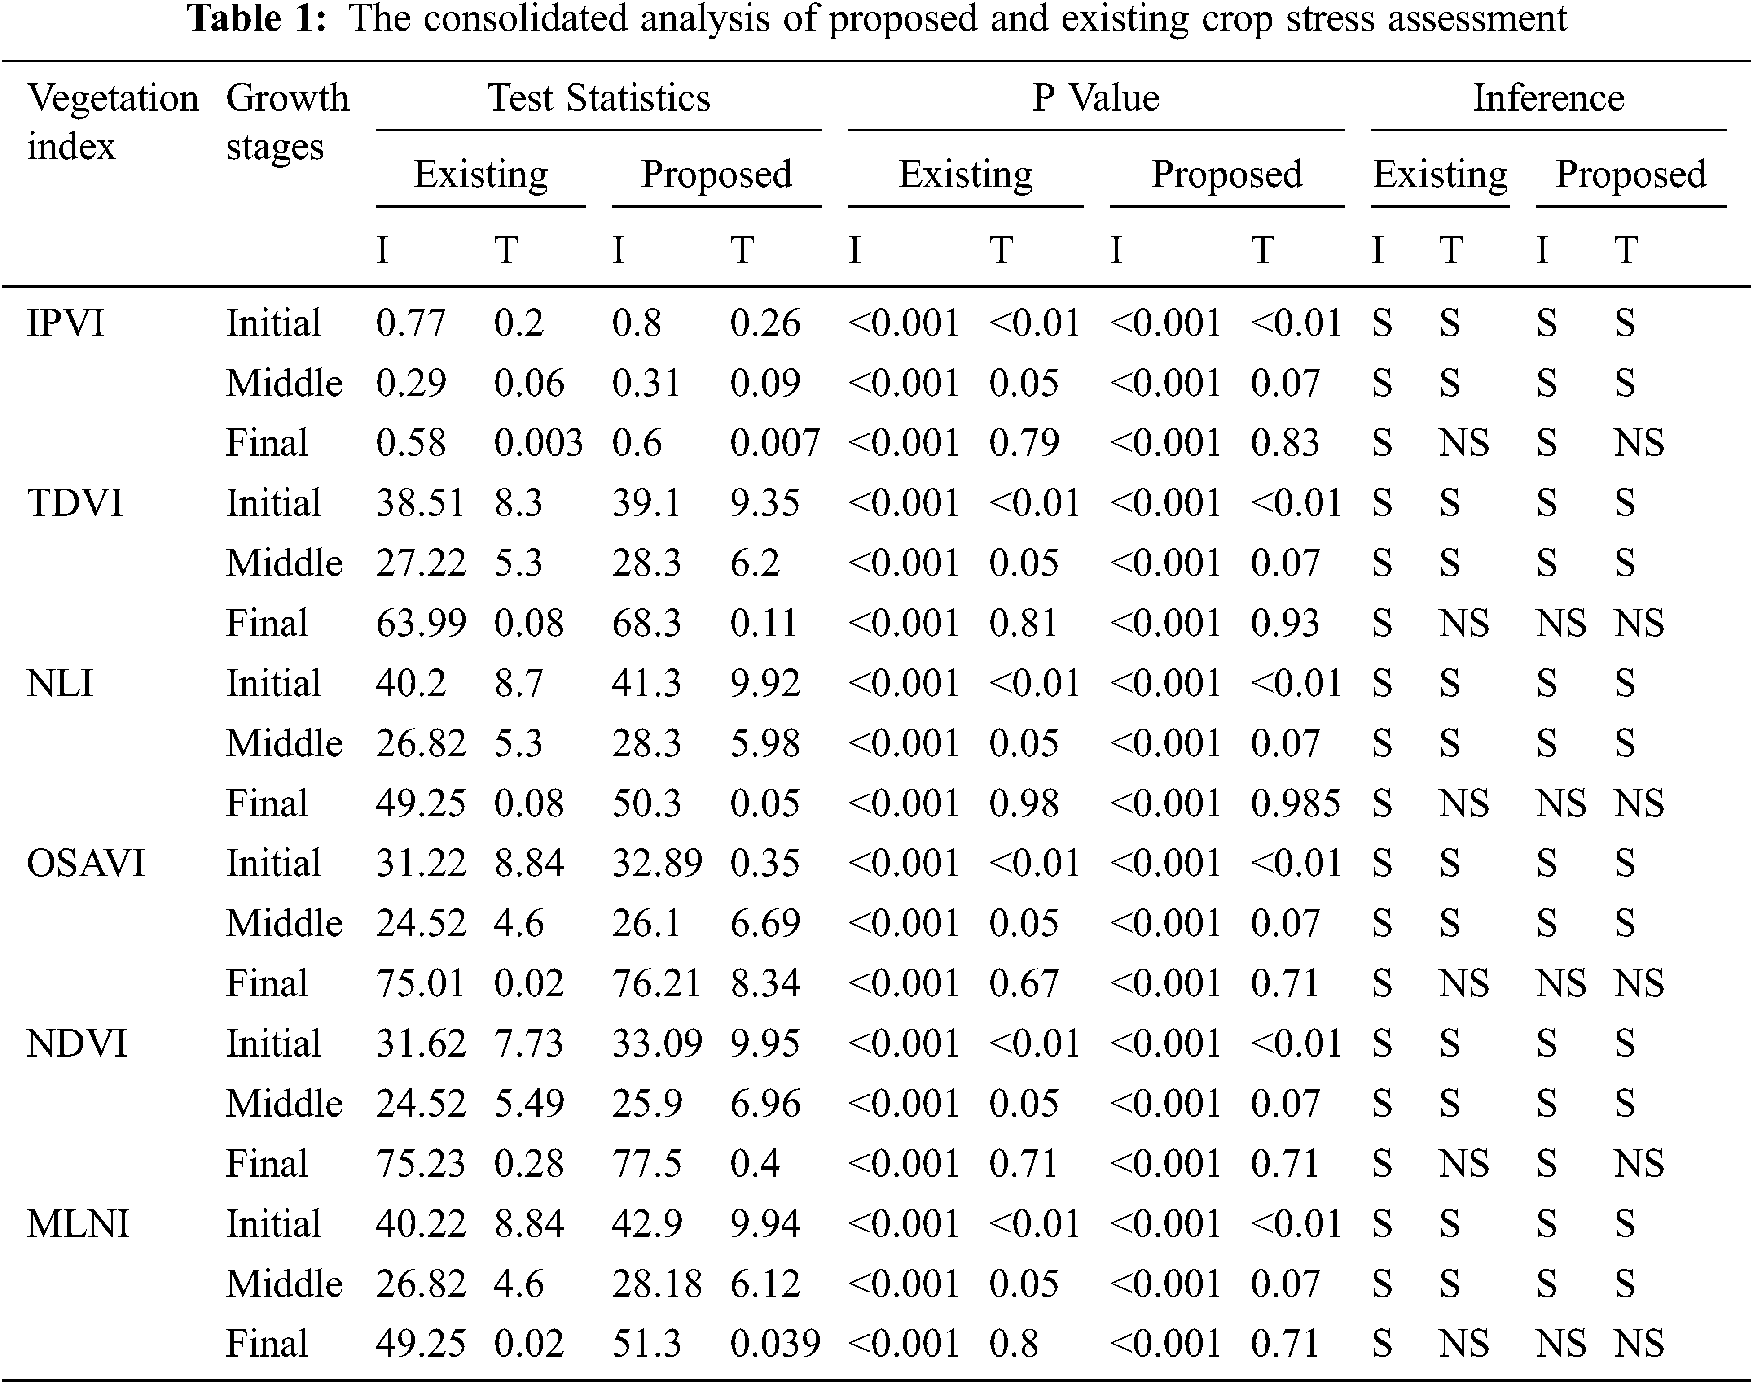
Here, we use some of the vegetation index for the test statistics such as NLI, NDVI, IPVI, OSAVI, TDVI and MLNI. The growth of the crops is categorized as three stages - Initial stage, Middle stage and final stage. The test statistics shows observed data. Here, ‘I’ indicates the Irrigation process and ‘T’ denotes the Tillage process. The P value is the probability data of the crop’s growth. Mostly, the growth of the crops in the irrigation process will be < 0.001. From that we infer two effects, one is significant effect which is indicated as S and other is non-Significant process which is referred as NS. The Final stage of the crop is mostly NS.
For the Millet crop, Fig. 6 refers the accuracy of proposed optimal technique which is 0.73%, 2.23% & 3.13% higher than the existing crop yield assessment for Ragi, Sama, and Kodo respectively. Fig. 7 denotes the precision of proposed optimal technique which is 0.75%, 2.24% and 2.82% higher than the existing crop growth assessment for Ragi, Sama, and Kodo respectively. Fig. 8 represents the recall of proposed optimal technique which is 0.94%, 3.55% and 4.41% higher than the existing crop yield assessment for Ragi, Sama, and Kodo respectively. Fig. 9 indicates the F- measure of proposed optimal technique which is 0.84%, 2.90% and 3.63% higher than the existing crop yield assessment for Ragi, Sama, and Kodo respectively.
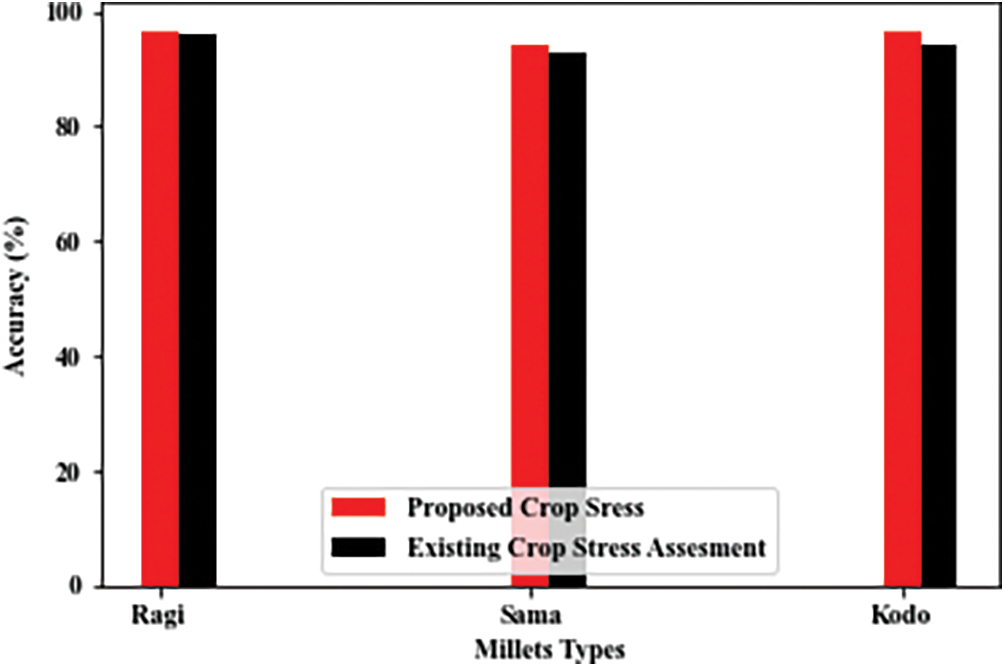
Figure 6: Accuracy for various millet crops
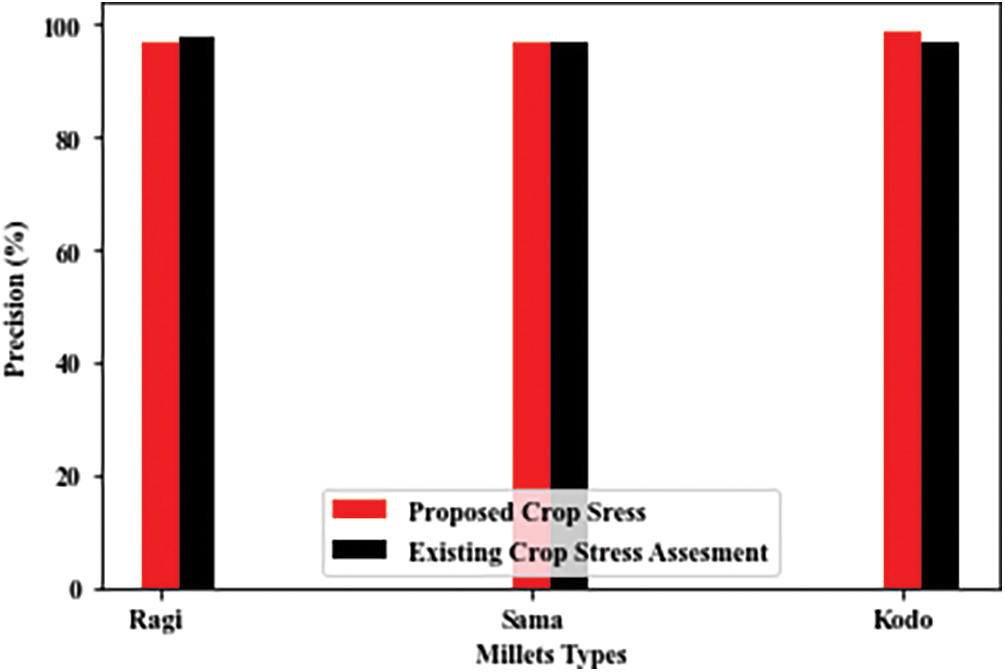
Figure 7: Precision for various millet crops
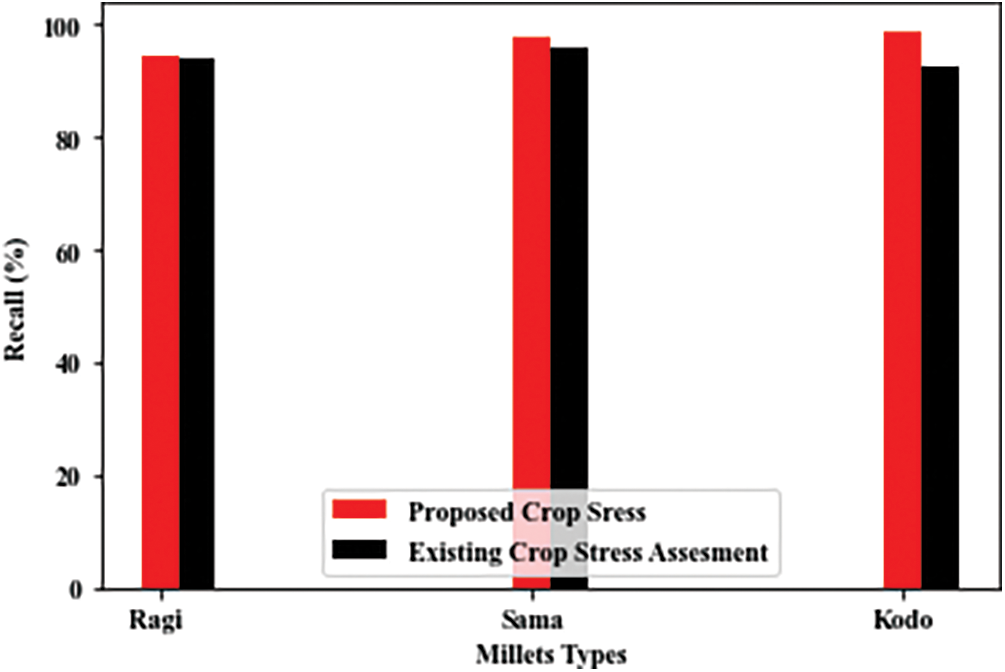
Figure 8: Recall measurement for various millet crops

Figure 9: F–Measure for various millet crops
For the Plantation crop, Fig. 10 represents the accuracy of proposed optimal technique which is 1.27%, 0.26% and 0.92% higher than the existing crop yield assessment for Coffee, Tea, and Cocoa respectively. Fig. 11 denotes the precision of proposed optimal technique is 0.60%, 4.01% and 1.06% higher than the existing crop yield assessment for Coffee, Tea, and Cocoa respectively. Fig. 12 indicates the recall of proposed optimal technique which is 3.18%, 2.39% and 3.80% higher than the existing crop yield assessment for Coffee, Tea, and Cocoa respectively. Fig. 13 represents the F-measure of proposed optimal technique which is 1.88%, 3.20% and 2.48% higher than the existing crop yield assessment for Coffee, Tea, and Cocoa respectively.
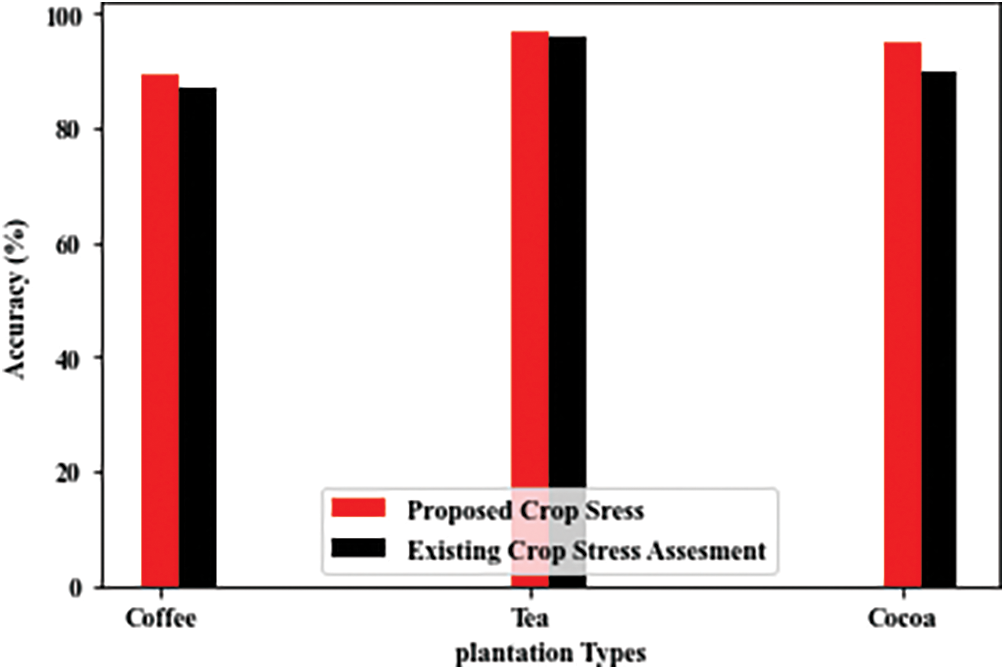
Figure 10: Accuracy for various plantation crop

Figure 11: Precision for various plantation crop
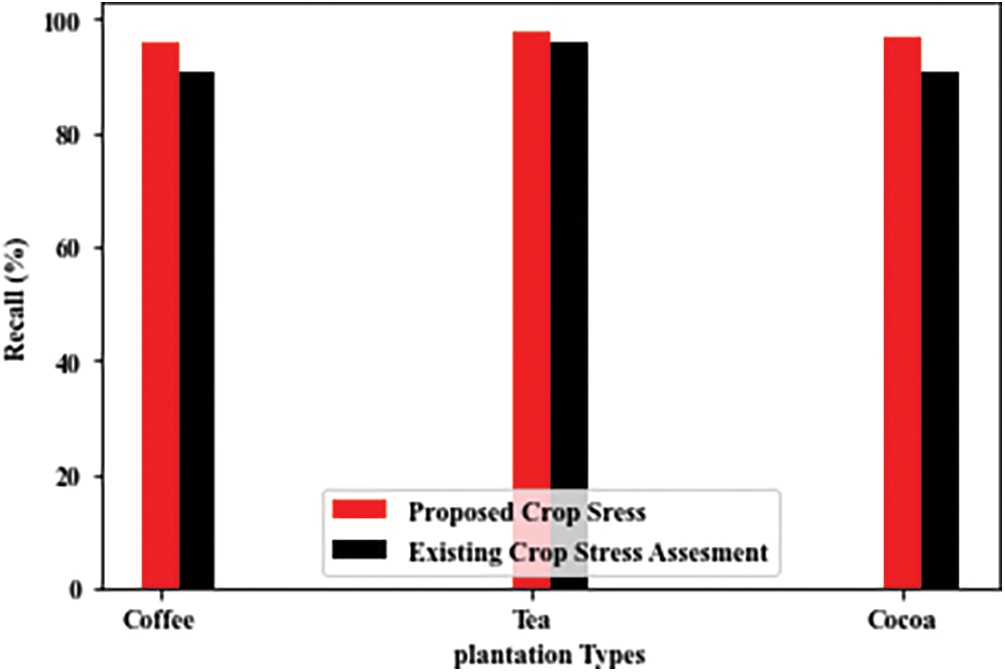
Figure 12: Recall measurement for plantation crops

Figure 13: F measure for plantation crops
For the Barley crop, Fig. 14 represents the accuracy of proposed optimal technique which is 1.53%, 2.96% and 3.36% higher than the existing crop yield assessment for flakes, flour and pearl respectively. Fig. 15 denotes the precision of proposed optimal technique which is 0.71%, 1.96% and 1.94% higher than the existing crop yield assessment for flakes, flour and pearl respectively. Fig. 16 indicates the recall of proposed optimal technique is which 6.31%, 3.06% and 1.73% higher than the existing crop growth assessment for flakes, flour and pearl respectively. Fig. 17 indicates the F-measure of proposed optimal technique which is 3.56%, 2.39% and 1.85% higher than the existing crop yield assessment for flakes, flour and pearl respectively.

Figure 14: Accuracy for various barley crops

Figure 15: Precision for various barley crops

Figure 16: Recall measurement for various barley crops

Figure 17: F–Measure for various barley crops
For the Wheat crop, Fig. 18 represents the accuracy of proposed optimal technique which is 1.23%, 2.55% and 2.11% higher than the existing crop yield assessment for durum, spelt and emmer respectively. Fig. 19 indicates the precision of proposed optimal technique which is 1.84%, 2.97% and 1.51% higher than the existing crop yield assessment for durum, spelt and emmer respectively. Fig. 20 represents the recall of proposed optimal technique which is 4.7%, 0.46% and 3.54% higher than the existing crop yield assessment for durum, spelt and emmer respectively. Fig. 21 denotes the F-measure of proposed optimal technique which is 3.29%, 1.75% and 2.54% higher than the existing crop yield assessment for durum, spelt and emmer respectively. In the figures from 2–21, the red color denotes the proposed system and black color represents existing system.
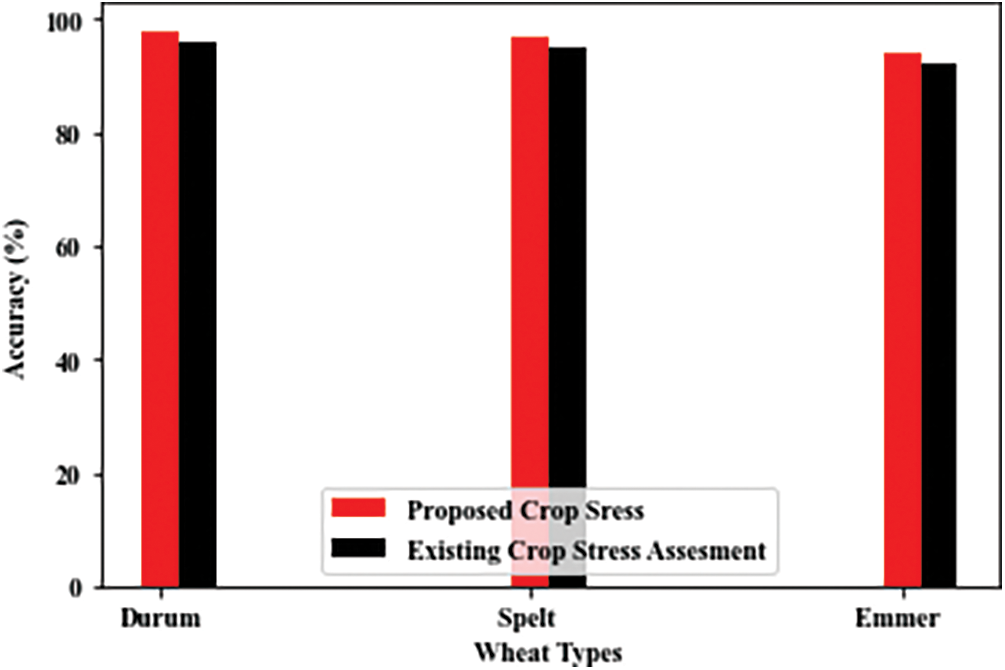
Figure 18: Accuracy for various wheat crops
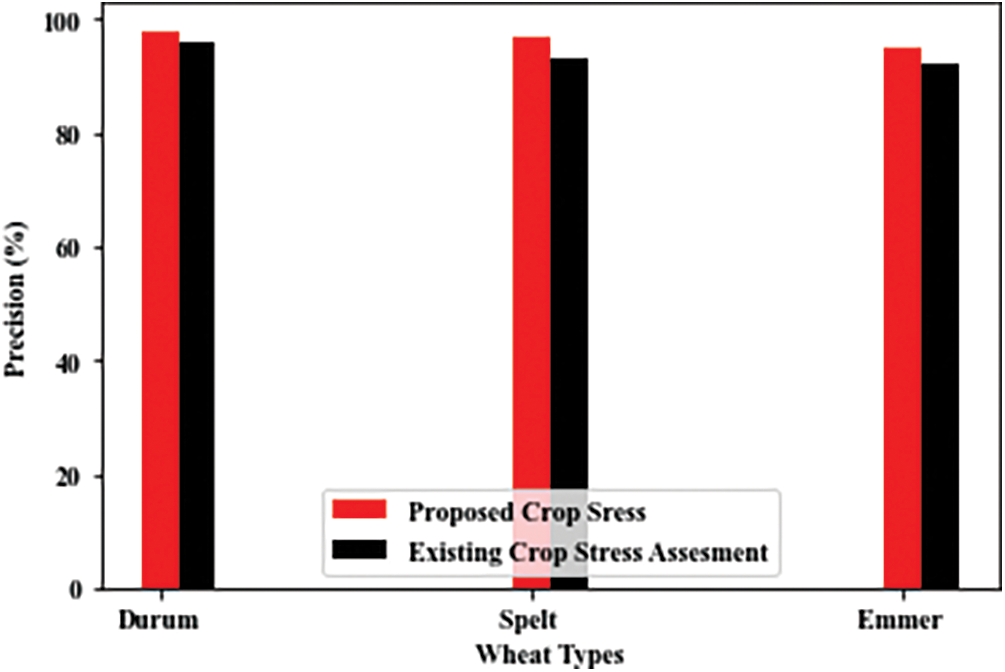
Figure 19: Precision for various wheat crops

Figure 20: Recall measurement for various wheat crops

Figure 21: F-Measure for various wheat crops
We have proposed an optimal technique that handles problems are urban green space destruction detection and crop stress assessment. Optimal preprocessing is performed on given RS image for data, image enhancement are geometric correction and image co-registration. An improved cat swarm optimization algorithm to optimize the radiometric information’s is NDBI & NDVI. A conditional principal component analysis is used to reduce dimension of a response matrix, retain the dominant information for identification of key vegetation indices and their relation with abiotic stress at each of the growth stages. Finally, an optimal decision maker-based post classification method was introduced to differentiate area changes based on the overlay of two or more classified images. This architecture and comprehensive process will really benefit the Indian agricultural sector. From the simulation results we observed and conclude that the performance of proposed crop classification, crop stress and yield assessments performed very effective compared to existing methods in terms of F-Measure, recall, precision & accuracy. In future, the deep learning models can be included to enhance the overall performance.
Funding Statement: The authors received no specific funding for this study.
Conflicts of Interest: The authors declare that they have no conflicts of interest to report regarding the present study.
1. L. Tao, G. Wang, W. Chen, X. Chen, J. Li et al., “Soil moisture retrieval from sar and optical data using a combined model,” IEEE Journal of Selected Topics in Applied Earth Observations and Remote Sensing, vol. 12, no. 2, pp. 637–647, 2019. [Google Scholar]
2. A. G. Kanatas and P. Constantinou, “City center high-elevation angle propagation measurements at L band for land mobile satellite systems,” IEEE Transactions on Vehicular Technology, vol. 47, no. 3, pp. 1002–1011, 1998. [Google Scholar]
3. B. Bechtel, L. See, G. Mills and M. Foley, “Classification of local climate zones using sar and multispectral data in an arid environment,” IEEE Journal of Selected Topics in Applied Earth Observations and Remote Sensing, vol. 9, no. 7, pp. 3097–3105, 2016. [Google Scholar]
4. F. Kong, H. Yin, N. Nakagoshi and Y. Zong, “Urban green space network development for biodiversity conservation: Identification based on graph theory and gravity modeling,” Landscape and Urban Planning, vol. 95, no. 1–2, pp. 16–27, 2010. [Google Scholar]
5. W. Su, C. Gu, G. Yang, S. Chen and F. Zhen, “Measuring the impact of urban sprawl on natural landscape pattern of the western taihu lake watershed, China,” Landscape and Urban Planning, vol. 95, no. 1–2, pp. 61–67, 2010. [Google Scholar]
6. M. Bouziani, K. Goïta and D. C. He, “Automatic change detection of buildings in urban environment from very high spatial resolution images using existing geodatabase and prior knowledge,” ISPRS Journal of Photogrammetry and Remote Sensing, vol. 65, no. 1, pp. 143–153, 2010. [Google Scholar]
7. C. Y. Jim and W. Y. Chen, “Habitat effect on vegetation ecology and occurrence on urban masonry walls,” Urban Forestry & Urban Greening, vol. 9, no. 3, pp. 169–178, 2010. [Google Scholar]
8. C. C. Konijnendijk, I. Lacan, J. R. McBride, H. Sjöman, A. B. Nielsen et al., “Ten years of urban forestry & urban greening–the stories behind the articles,” Urban Forestry & Urban Greening, vol. 10, no. 4, pp. 257–259, 2011. [Google Scholar]
9. M. W. Strohbach, E. Arnold and D. Haase, “The carbon footprint of urban green space—A life cycle approach,” Landscape and Urban Planning, vol. 104, no. 2, pp. 220–229, 2012. [Google Scholar]
10. M. M. M’Ikiugu, I. Kinoshita and Y. Tashiro, “Urban green space analysis and identification of its potential expansion areas,” Procedia-Social and Behavioral Sciences, vol. 35, pp. 449–458, 2012. [Google Scholar]
11. J. Colding, S. Barthel, P. Bendt, R. Snep, W. Knaap et al., “Urban green commons: Insights on urban common property systems,” Global Environmental Change, vol. 23, no. 5, pp. 1039–1051, 2013. [Google Scholar]
12. K. R. Thorp, G. Wang, A. L. West, M. S. Moran, K. F. Bronson et al., “Estimating crop biophysical properties from remote sensing data by inverting linked radiative transfer and ecophysiological models,” Remote Sensing of Environment, vol. 124, pp. 224–233, 2012. [Google Scholar]
13. F. Maselli, M. Chiesi, L. Brilli and M. Moriondo, “Simulation of olive fruit yield in tuscany through the integration of remote sensing and ground data,” Ecological Modelling, vol. 244, pp. 1–12, 2012. [Google Scholar]
14. Y. Li, Q. Zhou, J. Zhou, G. Zhang, C. Chen et al., “Assimilating remote sensing information into a coupled hydrology-crop growth model to estimate regional maize yield in arid regions,” Ecological Modelling, vol. 291, pp. 15–27, 2014. [Google Scholar]
15. M. E. Holzman, R. Rivas and M. C. Piccolo, “Estimating soil moisture and the relationship with crop yield using surface temperature and vegetation index,” International Journal of Applied Earth Observation and Geoinformation, vol. 28, pp. 181–192, 2014. [Google Scholar]
16. A. Ramoelo, S. Dzikiti, H. Deventer, A. Maherry, M. A. Cho et al., “Potential to monitor plant stress using remote sensing tools,” Journal of Arid Environments, vol. 113, pp. 134–144, 2015. [Google Scholar]
17. C. Santos, I. J. Lorite, M. Tasumi, R. G. Allen and E. Fereres, “Performance assessment of an irrigation scheme using indicators determined with remote sensing techniques,” Irrigation Science, vol. 28, no. 6, pp. 461–477, 2010. [Google Scholar]
18. M. Muslim, S. A. Romshoo and A. Q. Rather, “Paddy crop yield estimation in kashmir himalayan rice bowl using remote sensing and simulation model,” Environmental Monitoring and Assessment, vol. 187, no. 6, pp. 316, 2015. [Google Scholar]
19. M. H. Kharrou, M. L. Page, A. Chehbouni, V. Simonneaux, S. E. Raki et al., “Assessment of equity and adequacy of water delivery in irrigation systems using remote sensing-based indicators in semi-arid region, Morocco,” Water Resources Management, vol. 27, no. 13, pp. 4697–4714, 2013. [Google Scholar]
20. J. Zhou, L. R. Khot, H. Y. Bahlol, R. Boydston and P. N. Miklas, “Evaluation of ground, proximal and aerial remote sensing technologies for crop stress monitoring,” IFAC-PapersOnLine, vol. 49, no. 16, pp. 22–26, 2016. [Google Scholar]
21. K. Liu, Q. Zhou, W. Wu, T. Xia and H. Tang, “Estimating the crop leaf area index using hyperspectral remote sensing,” Journal of Integrative Agriculture, vol. 15, no. 2, pp. 475–491, 2016. [Google Scholar]
22. J. Zhou, M. J. Pavek, S. C. Shelton, Z. J. Holden and S. Sankaran, “Aerial multispectral imaging for crop hail damage assessment in potato,” Computers and Electronics in Agriculture, vol. 127, pp. 406–412, 2016. [Google Scholar]
23. R. Kishorekumar and P. Deepa, “Automatic change detection using multiindex information map on high-resolution remote sensing images,” Cluster Computing, vol. 21, no. 1, pp. 39–49, 2018. [Google Scholar]
24. T. Leichtle, C. Geiß, M. Wurm, T. Lakes and H. Taubenböck, “Unsupervised change detection in VHR remote sensing imagery–An object-based clustering approach in a dynamic urban environment,” International Journal of Applied Earth Observation and Geoinformation, vol. 54, pp. 15–27, 2017. [Google Scholar]
25. T. Leichtle, C. Geiß, T. Lakes and H. Taubenböck, “Class imbalance in unsupervised change detection–A diagnostic analysis from urban remote sensing,” International Journal of Applied Earth Observation and Geoinformation, vol. 60, pp. 83–98, 2017. [Google Scholar]
26. C. P. Dalmiya, N. Santhi and B. Sathyabama, “A novel feature descriptor for automatic change detection in remote sensing images,” The Egyptian Journal of Remote Sensing and Space Science, vol. 22, no. 2, pp. 183–192, 2019. [Google Scholar]
27. A. Frick and S. Tervooren, “A framework for the long-term monitoring of urban green volume based on multi-temporal and multi-sensoral remote sensing data,” Journal of Geovisualization and Spatial Analysis, vol. 3, no. 1, pp. 1–11, 2019. [Google Scholar]
 | This work is licensed under a Creative Commons Attribution 4.0 International License, which permits unrestricted use, distribution, and reproduction in any medium, provided the original work is properly cited. |