DOI:10.32604/iasc.2022.022976
| Intelligent Automation & Soft Computing DOI:10.32604/iasc.2022.022976 | |
| Article |
To Control Diabetes Using Machine Learning Algorithm and Calorie Measurement Technique
1Department of Computer Science and Engineering, University College of Engineering, Konam, Kanyakumari, 629004, India
2Department of Computer Science and Engineering, PSN College of Engineering and Technology, Tirunelveli, Tamil Nadu, 627152, India
3Department of Mathematics, Rohini College of Engineering and Technology, Kanyakumari, Tamil Nadu, 629401, India
*Corresponding Author: T. Viveka. Email: vivekatjournal24@gmail.com
Received: 24 August 2021; Accepted: 27 October 2021
Abstract: Because of the increasing workload, people are having several clinical examinations to determine their health status, resulting in limited time. Here, we present a healthful consuming device based on rule mining that can modify your parameter dependency and recommend the varieties of meals that will boost your fitness and assist you to avoid the types of meals that increase your risk for sicknesses. Using the meals database, the data mining technique is useful for gathering meal energy from breakfast, after breakfast, lunch, after lunch, dinner, after dinner, and bedtime for ninety days. The purpose of this study is to determine to mean random plasma glucose levels and h1bc levels using the Nathan, ADAG (A1C-derived average glucose), and DTTC (Dynamic Temporal and Tactile Cueing) methods. This system can identify and recognize food images, as well as keep track of the food items ingested by the user. Deep learning techniques are mostly utilized for picture recognition and categorization. The KNN (k-nearest neighbors algorithm) classification approach is used to determine if diabetes is normal, pre-diabetic, or chronic. This study employs deep learning and a smart camera app called “calorie mom” to track nutrition from meal photographs. In addition, the commonly used measures of divisions such as accuracy, sensitivity, uniqueness, and recalling diabetic dataset using Python 3 Jupyter Notebook were employed to evaluate the performance of a machine learning classifier.
Keywords: Data mining; random plasma glucose (RPM); calories; machine learning
Data mining is the extraction of patterns from huge datasets to evaluate information and comprehend the nature of data. Data mining applications can be developed to evaluate the efficacy of medical treatments. By comparing and contrasting causes, symptoms, and treatment options, data mining can provide a study of which courses of action are effective. For example, the outcomes of patient groups treated with different drug regimens for the same disease or condition can be compared to determine which treatments work best and are the most cost-effective. United Health Care has looked at its treatment record data in this manner to determine if there are any ways to cut costs while still providing quality care. Despite the relevance of data mining in the use of technology for accurate and reliable food quality and safety evaluation and control, data mining techniques and methodologies have been employed in the food sector for analyzing hyperspectral pictures. Clinical profiles have also been developed to convey information about physicians’ practice patterns to them. Diabetes is one of the world’s most serious and quickly spreading diseases. In addition to heart difficulties, it raises the risk of kidney sickness, blindness, nerve damage, and blood vessel damage [1]. According to current statistics, more than 80% of diabetics die as a result of heart or blood vessel illness. Repalli et al. [2] attempt to anticipate a patient’s diabetes by utilizing various data mining techniques and data analysis based on mining algorithms to generate predictions for patients. Diabetes mellitus can be managed by injecting insulin, changing dietary habits, and engaging in physical activities, however, there is a lack of a reliable monitoring system to visualize correct food intake. Diabetes should be identified in persons above the age of 30 according to doctors [3]. According to doctors, the majority of people are unaware that they have diabetes. As a result, experts suggest that diet and exercise are vital for sugar-free living. Kumar et al. [4] demonstrated the Fuzzy ID3 approach with diabetes data. The disease is estimated by the author using a computer, which collects data and uses classification methods to clustered data. Artificial intelligence, in particular, creates a sophisticated medical system for diagnosing diabetes patients [5]. When compared to other data mining techniques, the author’s extended classifier system (XCS) produces higher accuracy. Fico et al. [6] developed a system that provides realistic treatment guidance for diabetic patients and prompt management of their blood sugar levels, but it lacks good meal recommendations. With the recent emphasis on food as a health concern, the food imaging system will most likely be utilized to record regular meals. The study by Dubey et al. [7] sought to ascertain the association between triglyceride levels and HbA1c. HbA1c levels were found to be strongly associated with fasting and two-hour postprandial levels. Despite this, it has a better connection at a two-hour postprandial level. Alotaibi et al. [8] developed a diabetes management system that sends SMS reminders to patients, as well as an interface for recording readings and an artificial intelligence unit that maintains the degree of health. Fuzzy logic Food intake monitoring is the technique of calculating or quantifying the number of calories consumed by examining a person’s food intake throughout the day. As a result, the focus of this research is on effective methods for recognizing the type of food and its caloric value, as well as the calorie table [9]. Furthermore, it focuses on diabetes prognosis.
Fig. 1 gives an idea that meals that contain carbohydrates begin to digest quickly [10]. Most carbohydrates digestion takes place in the small intestine, and dietary carbohydrates are delivered from the stomach to the small intestine. Broking down the carbohydrate content to monosaccharides for absorption in the liver is how glucose is extracted from meals. This glucose mixes with blood and travels to the brain and other bodily cells via muscles. Zheng et al. [11] proposed a general framework for a meal detection system, to properly monitor and evaluate the diet. But reporting a person’s actual food intake is very difficult. Food artists also need to perform complex laboratory tests to accurately estimate food intake [12,13].
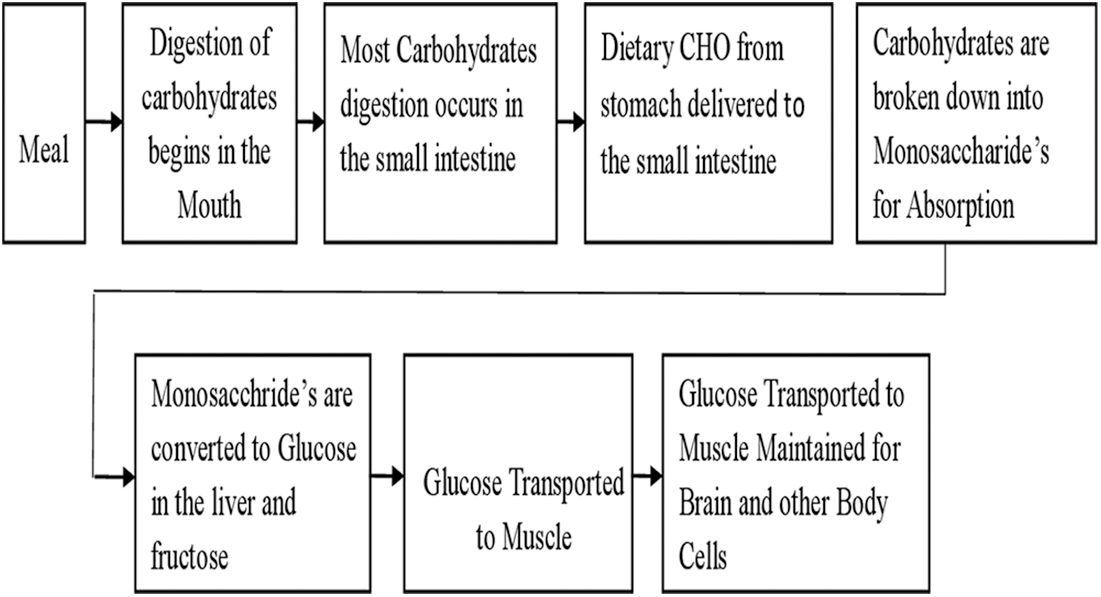
Figure 1: Conversion of meal into glucose
The food calorie is a revolutionary computation procedure that presents a system for measuring calories [14]. As a result of uploading an image of the food item, the user will be able to determine the number of calories indicated in the supplied food image. There have been a few ways that are being preferred for identifying food images, estimating the calorie content of food items, and also measuring the number of calories consumed by a specific person through examining their daily dietary data [15].
Several other methods as well as algorithms have been implemented to the related works to calculate the same. This is a system that can be able to detect as well as recognize the food image and keep the track of food items consumed by the user. State-of-the-art deep learning techniques are mainly used for image recognition and classification. We use a smart camera app “calorie mama” that is excelled in deep learning to track nutrition from food images [16,17] “Calorie Mama App” is powered by our Food AI API [18]. Food AI API is found on the latest innovations in deep learning and image classification technology to identify food items quickly and accurately. Step by step procedure as follows:
Step 1: Click on the image of the user food item (using a mobile phone).
Step 2: Detach the unwanted area (background) of the image and select the target area.
Step 3: Images are provided for training purposes and that are being sent for testing.
Step 4: User clicked food image feature is sent for extraction purposes (shape, size, and color).
Step 5: Categorize the given images into their corresponding categories. Then the name of the given food item is predicted.
Step 6: The purpose of confirming the predicted food item by the User.
• In the case of an incorrect prediction, the user will state the type of food.
• In the case of correct prediction, the system will prompt the user to present the exact amount of predicted objects to be consumed by the user. By using that output, the system calculates and generates the number of calories.
Step 7: Some standard amounts of calories are stored in a CSV file.
Step 8: This program meticulously records the foods ingested and generates a weekly statistical analysis to assist the user in controlling his or her consumption, mostly to prevent obesity-related disorders.
The database is created from the dataset stored in text files if any cluster contains more than ten items. The above steps emulate each food database classified as each cluster database containing several sub-nutritionists. The Mass of food items using mathematical equation M = ρV, where M is considered as the mass of food portion, ρ is density and V is the volume of food. Finally, the calorie of the given food item is estimated using a mass of food item and calorie value from Tab. 1 using the equation.
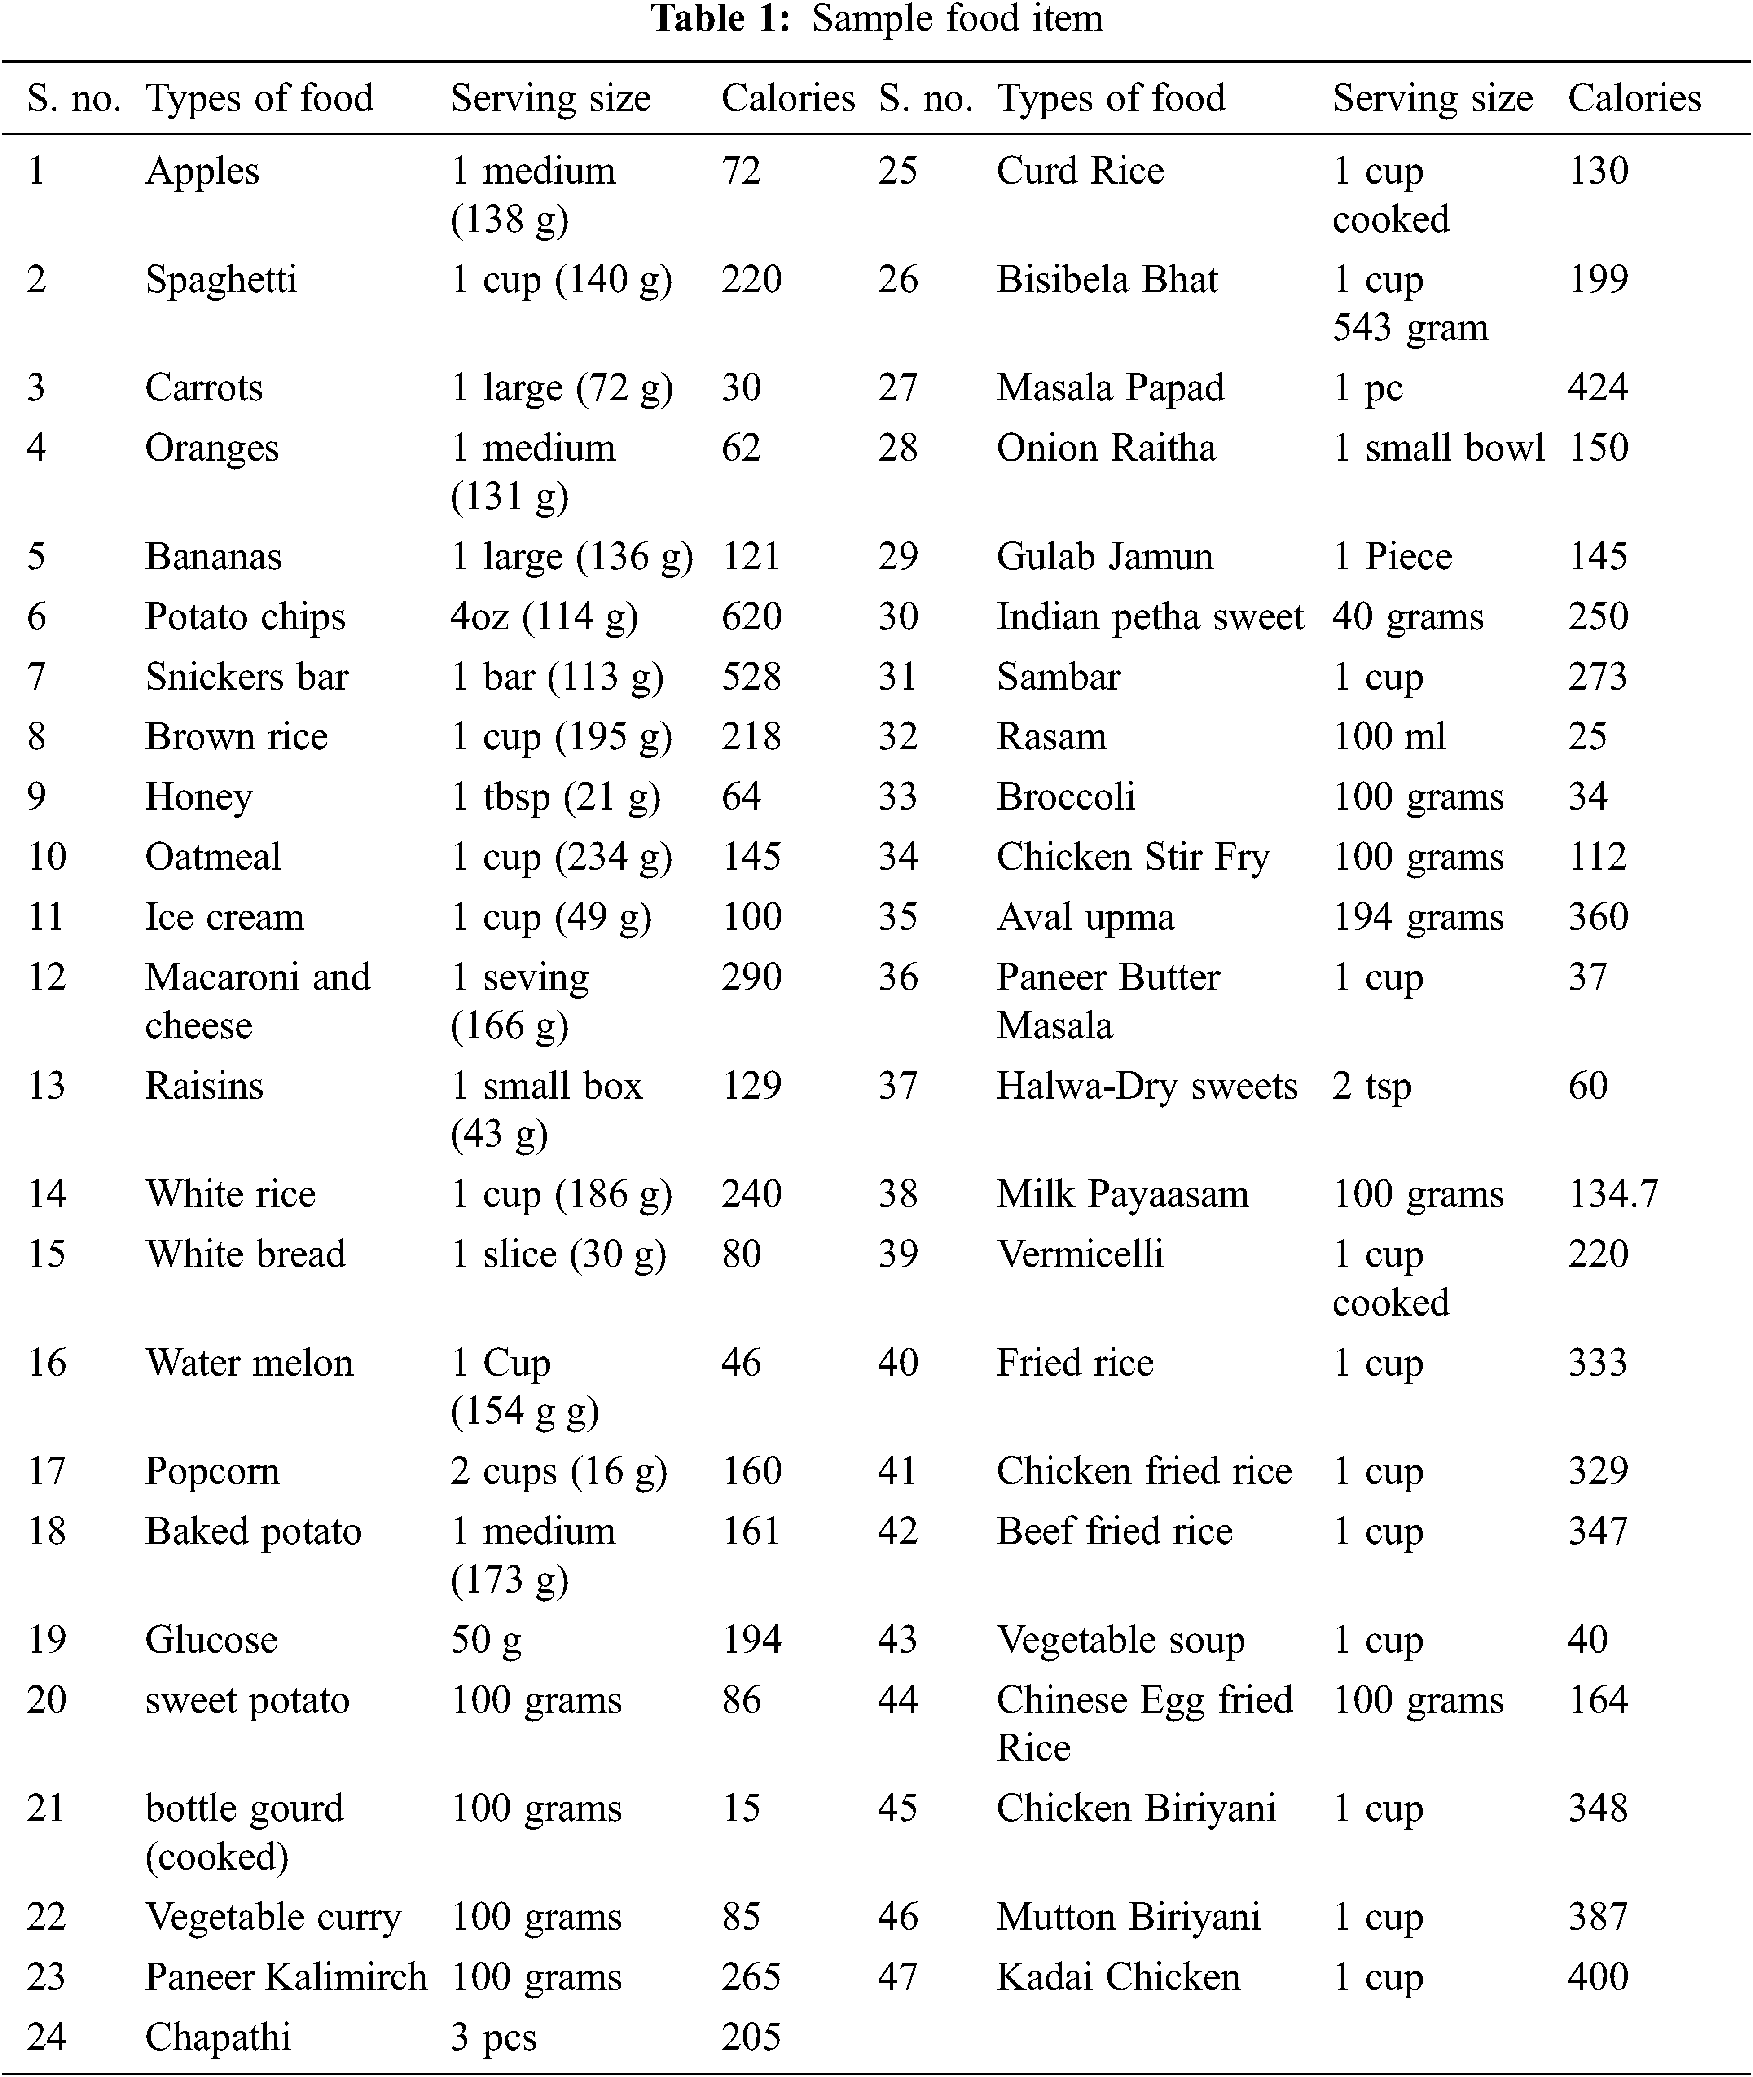
The above Tab. 1 flashes different sub-factors of food items. A sample record has been mentioned. In this study, a rule-based knowledge representation and reasoning are being followed. Next, we find day-wise average sum calories by using the following algorithm
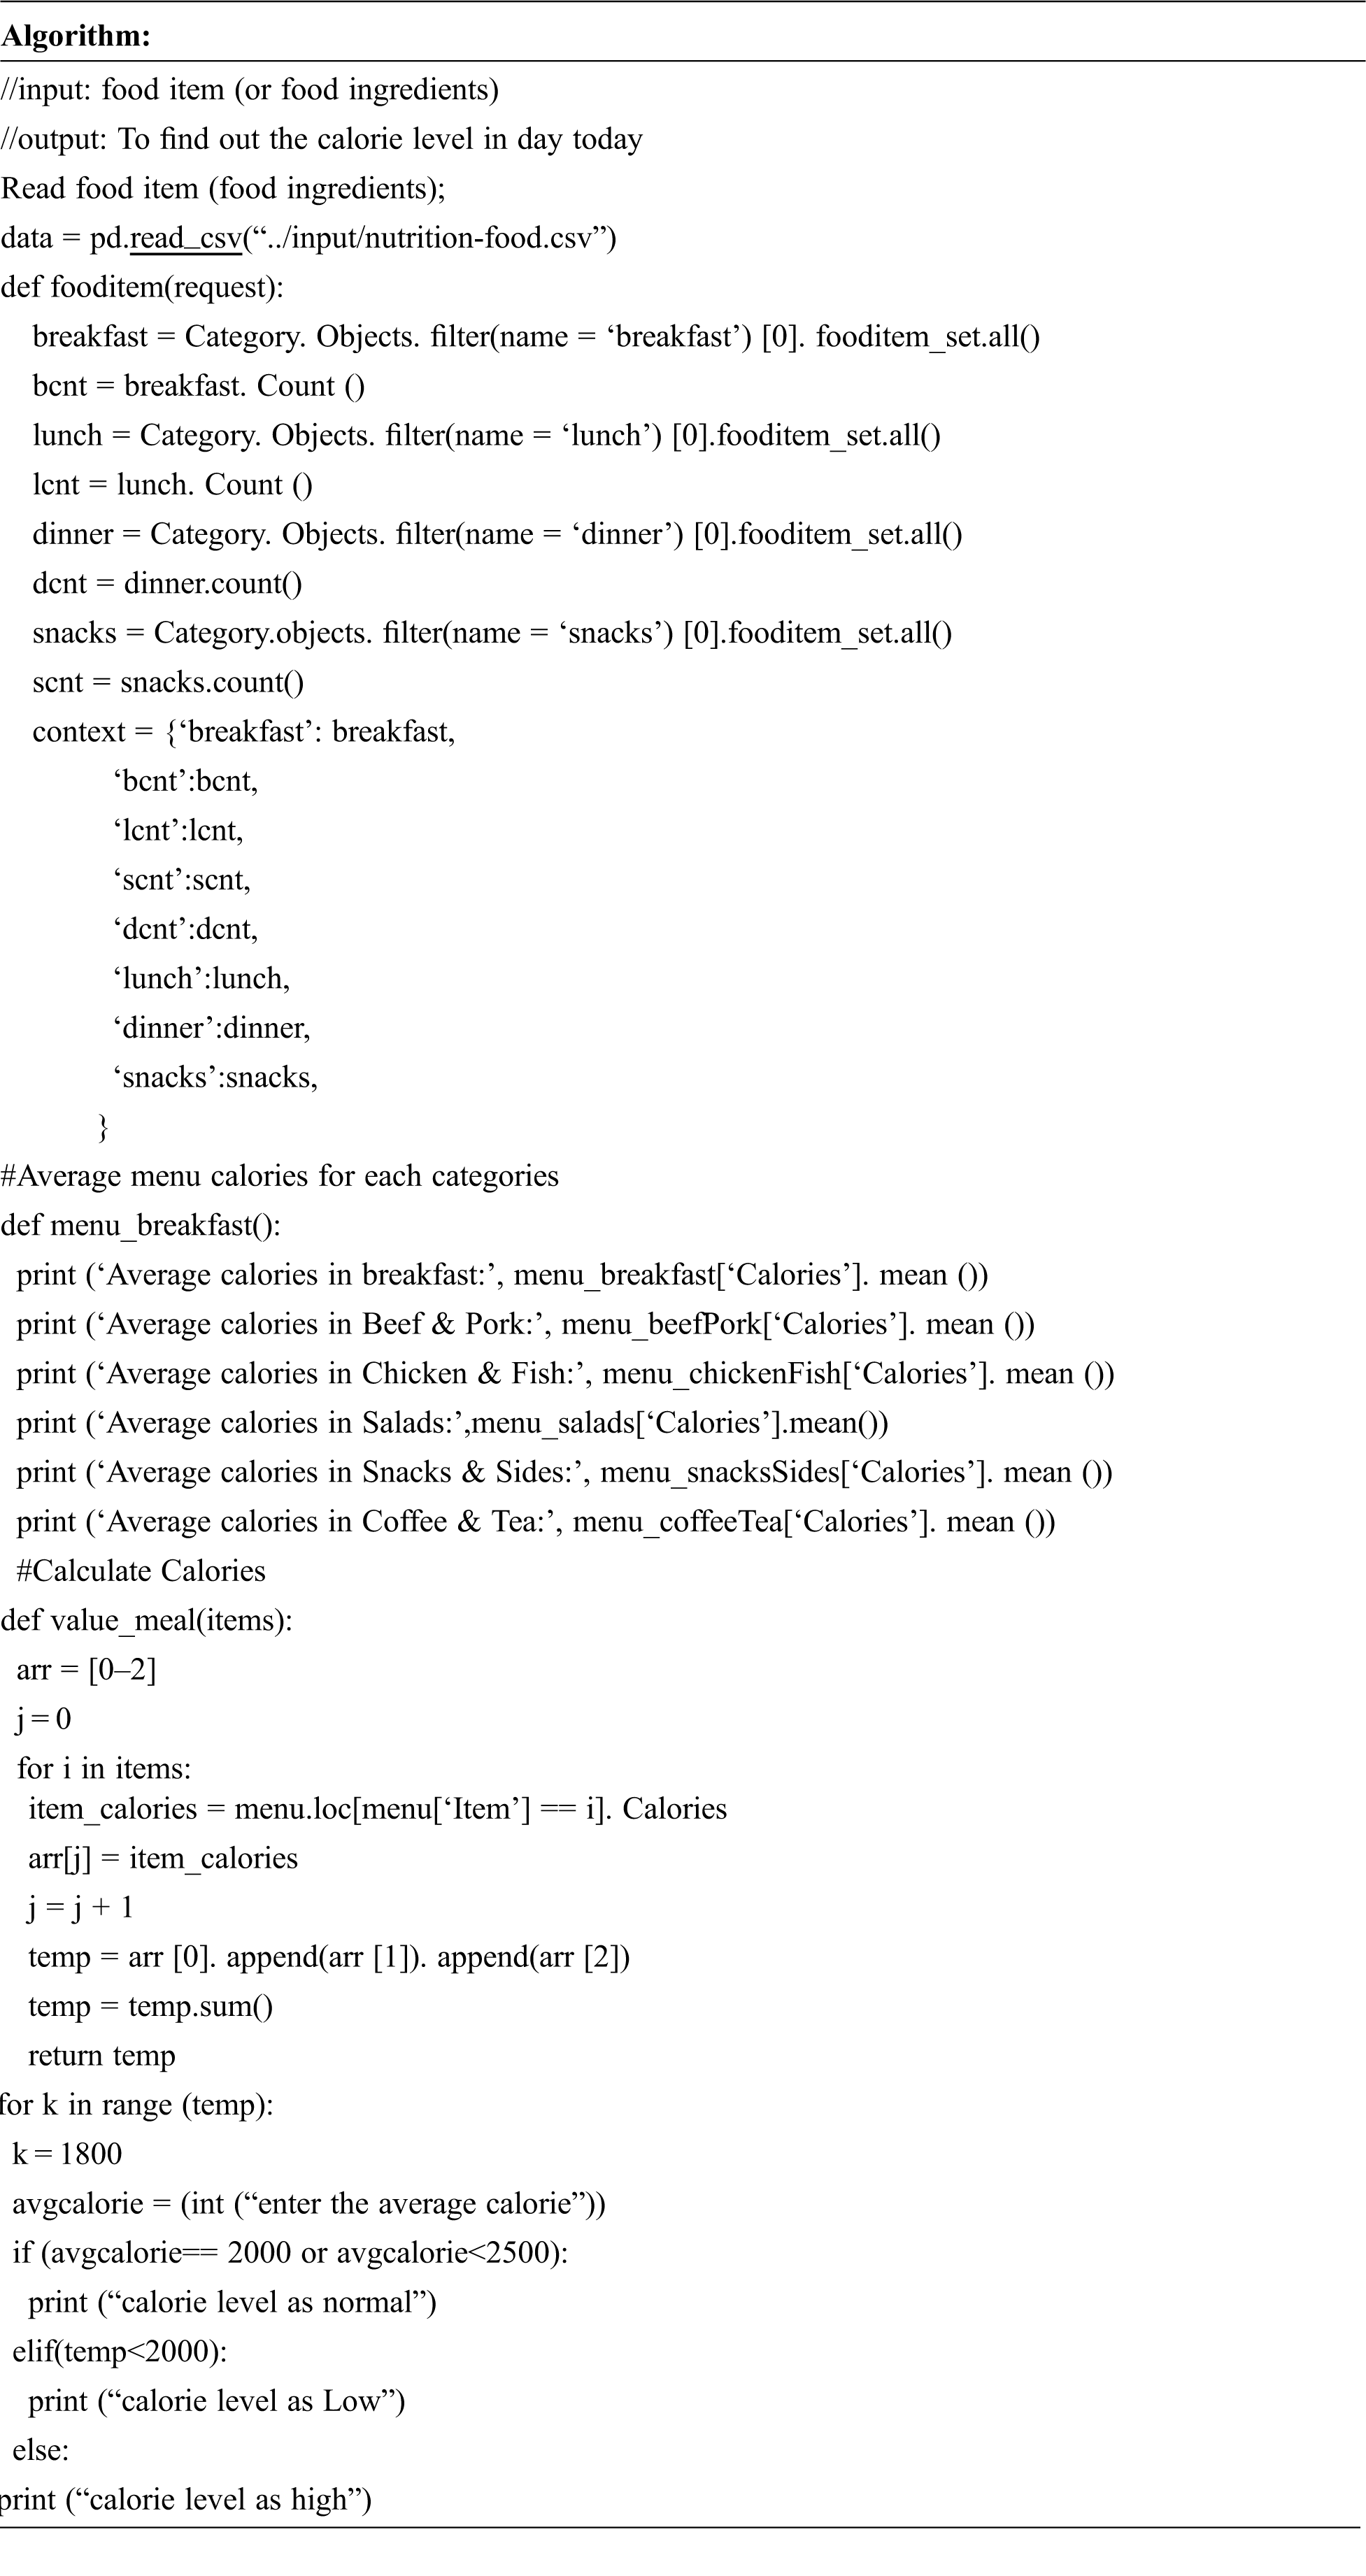
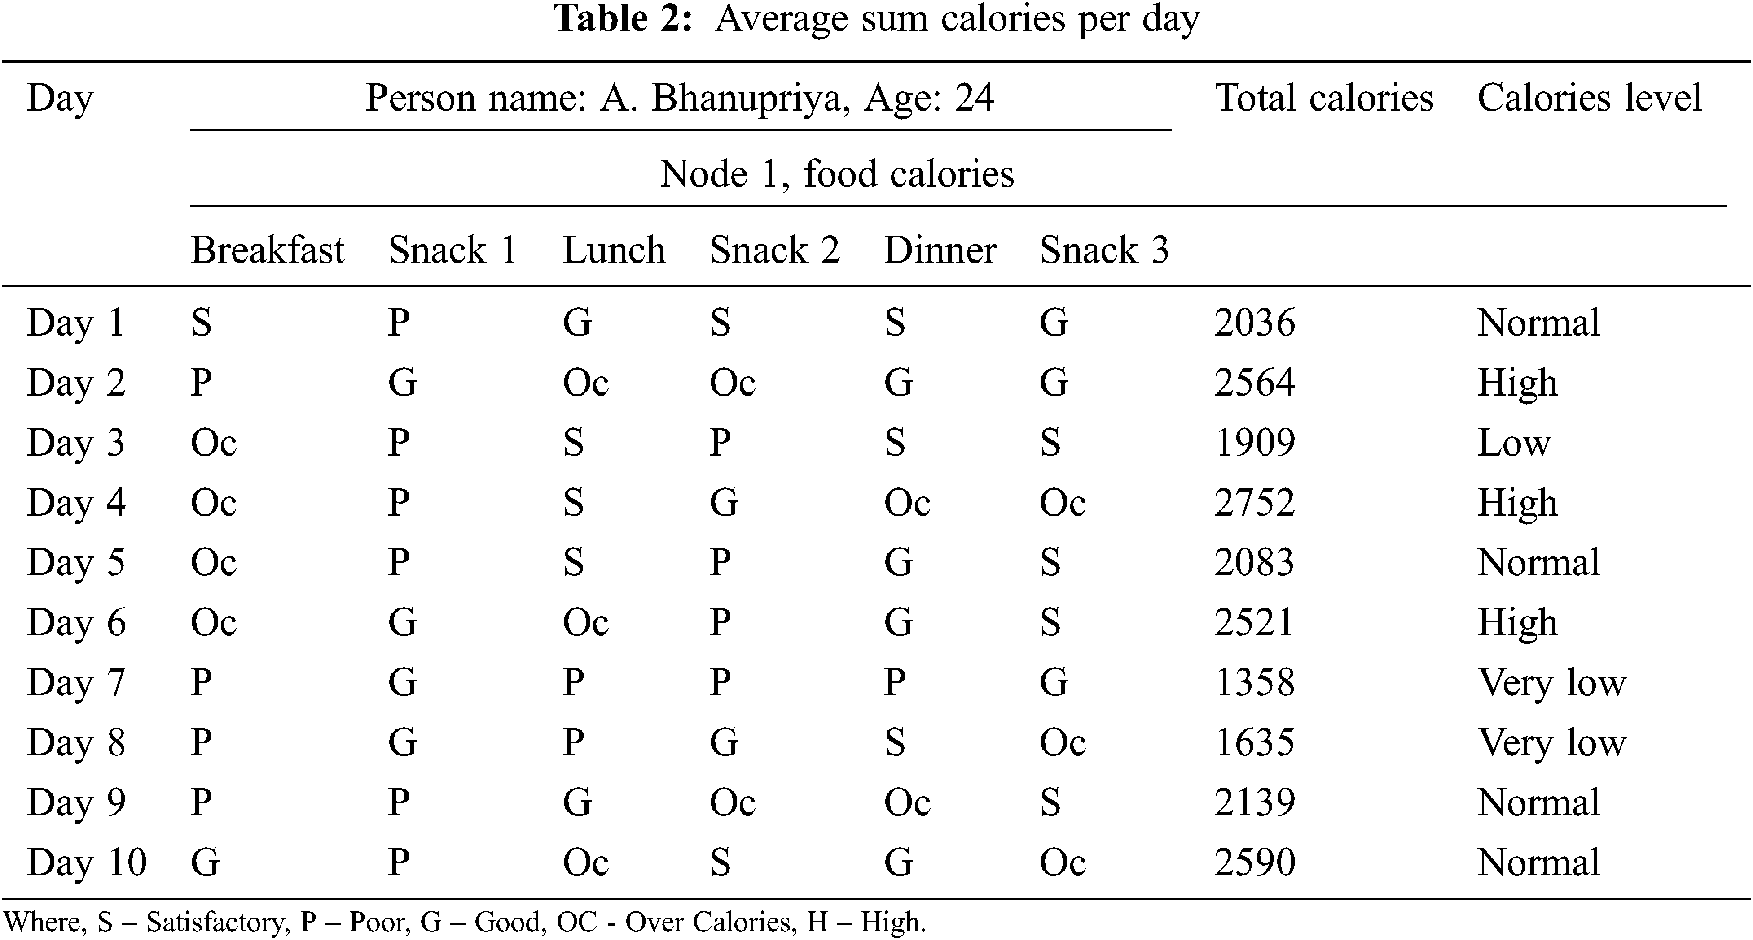
In Tab. 2, the calorie level for food items should be calculated for 90 days, but it has been limited to 10 days due to space constraints. If breakfast, lunch, dinner, and snacks levels are satisfactory, the calorie level will be normal, and if they are good, the calorie level will be normal. If they are poor, the calorie level will be very low. If they are over calories, the calorie level is high. On the day if the Breakfast = Satisfied, Snacks 1 = poor, lunch = good, snacks 2 = S, Dinner = S, snacks 3 = good, then the calorie level is normal [19].
2.2 Machine Learning Techniques
Machine learning, like artificial intelligence, is recognized for practicing distributing ideas from other connected domains. There has recently been an upsurge in the number of experiments and studies in the field of food classification that use machine learning/deep learning approaches. Aizawa et al. proposed a Bayesian framework-based incremental learning strategy for food image recognition and estimate. Bossard et al. employed Random Forest to achieve a classification accuracy of 50.67 percent on the Food-101 test set by mining discriminative components. The random forest model is used to cluster the superpixels in the training dataset. The field’s main focus is learning, i.e., attaining skills or knowledge from experience. Rajesh et al. involved various methods of algorithms such as ID3, C4.5, LDA. Now Pace, K-NN to diagnose diabetes for a given database. The author concludes that C4.5 with a lower error rate of 0.0938 and higher accuracy is the best algorithm 91%. Robert et al. preferred a framework concentrated mainly on the diabetes management problem into sub-goals: Developing a Tensor flow neural network model for food categorization. This approach will allow users to input a specific food image to prompt whether the selected meal is suggested or encouraged for eating, as well as it will apply the KNN algorithm for recommended meals. Raising diabetes inquiries with the help of cognitive sciences and an answer chatbot, tracing user activity, user location, and recorded blood sugar level measurements [20,21]. Machine learning algorithms have also been used to diagnose other types of chronic diseases. The study uses machine learning algorithms to predict treatment efficacy in diabetic patients. Based on drug use, the study predicted treatment results in patients with mild to severe diabetes. Most commonly it is the integration of useful feedback from historical data. Some of the Machine learning algorithms are given below:
Some of the Machine learning algorithms are given below:
The naive Bayesian technique takes the dataset as input and, using Bayes’ theorem, performs the analysis as well as forecasts the class label. It estimates a probability of class based on the supplied input data and assists in predicting the unknown data sample of the class. It is a considerable classification strategy that is well-suited to massive datasets.
2.2.2 Support Vector Machine (SVM)
The supervised learning method is utilized in the discriminative classification technique. This approach can be used for both regression and classification. The sole rationale behind the SVM, which will be divided into two classes, is determining a hyper line between the datasets. There are two processes to identifying the proper or ideal hyper line in data space and carefully mapping the items to the given bounds.
The random forest’s main reason for being is a bagging approach for developing random sample attributes. Furthermore, the process for locating the root node and splitting the feature node that receives access randomly distinguishes the decision tree algorithm from the random forest algorithm.
2.2.4 K Nearest Neighbour (KNN)
This classification technique was utilized to distinguish the new sample, which was based on a similarity or distance metric.
It is a supervised learning technique that has certain advantages for both classification and regression issues, but it is generally preferred for classification problems. This classifier is also tree-structured, with the inner nodes representing database features, the branches representing end rules, and each leaf node representing the end.
The learning models are executed in Jupyter Notebook. Knowledge here occurs is represented in the mode of condition-action pairs: IF this condition happens, THEN some action will happen. The below Fig. 2 shows the training database is given as input and the testing database is finding calories using rules to detect intake of calories.
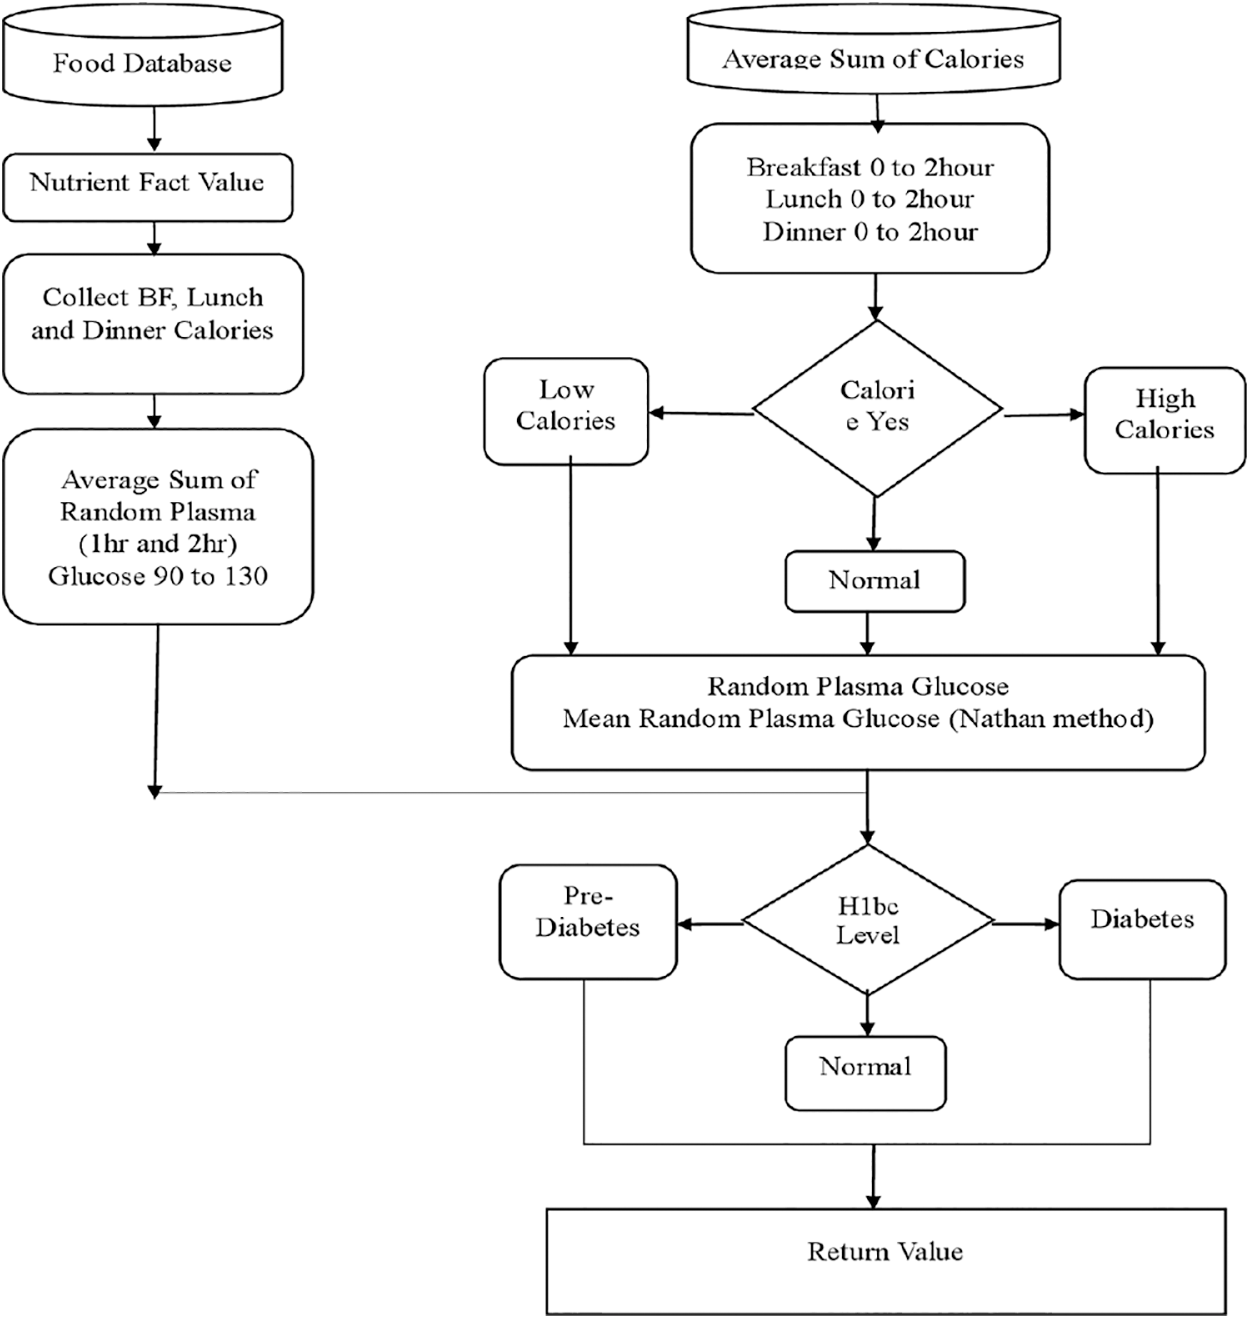
Figure 2: Random plasma glucose flow chart
Fig. 2 shows the flow chart for mean random plasma glucose level from the food database containing several sub-nutritionists which classify the food items within dairy, Beverage, Eggs, Meat, and Poultry, Snacks groups based on nutrients. The measuring level is based on calories of food intake. The user eats a meal 3 or >3 times (breakfast, lunch, dinner, etc.) and the associated nutritional values are recorded or stored in the user profile from day 1 to 90. Man’s daily caloric requirement varies from person to person. A baby needs 1,000 calories a day, while an active male between the ages of 16 and 18 needs up to 3,200 calories. For a woman, the daily caloric requirement can range from 200 to 2300 depending on the woman’s physical activity.
Calculate the average total calories for those days using a value from the user database and the calorie level determined by the above criteria. Calculate mean random plasma glucose level using zero, one, and two hour rpm, and then use Nathan, ADAG, and DTTC formulas to obtain h1bc level.
3.1 Developing a Theoretical Model for a Human’s Blood Glucose Level
To obtain the blood glucose level G(t) blatantly, solve the differential equations
Let us consider another differential equation
where, C represents the attention of carbohydrates, and G represents the awareness of glucose inside the blood. When time is zero, the bottom price of the glucose rate is zero. The initial conditions are C (0). = A0 and G (0) = G0. The first-order linear differential equation is:
From Eq. (2)
Therefore,
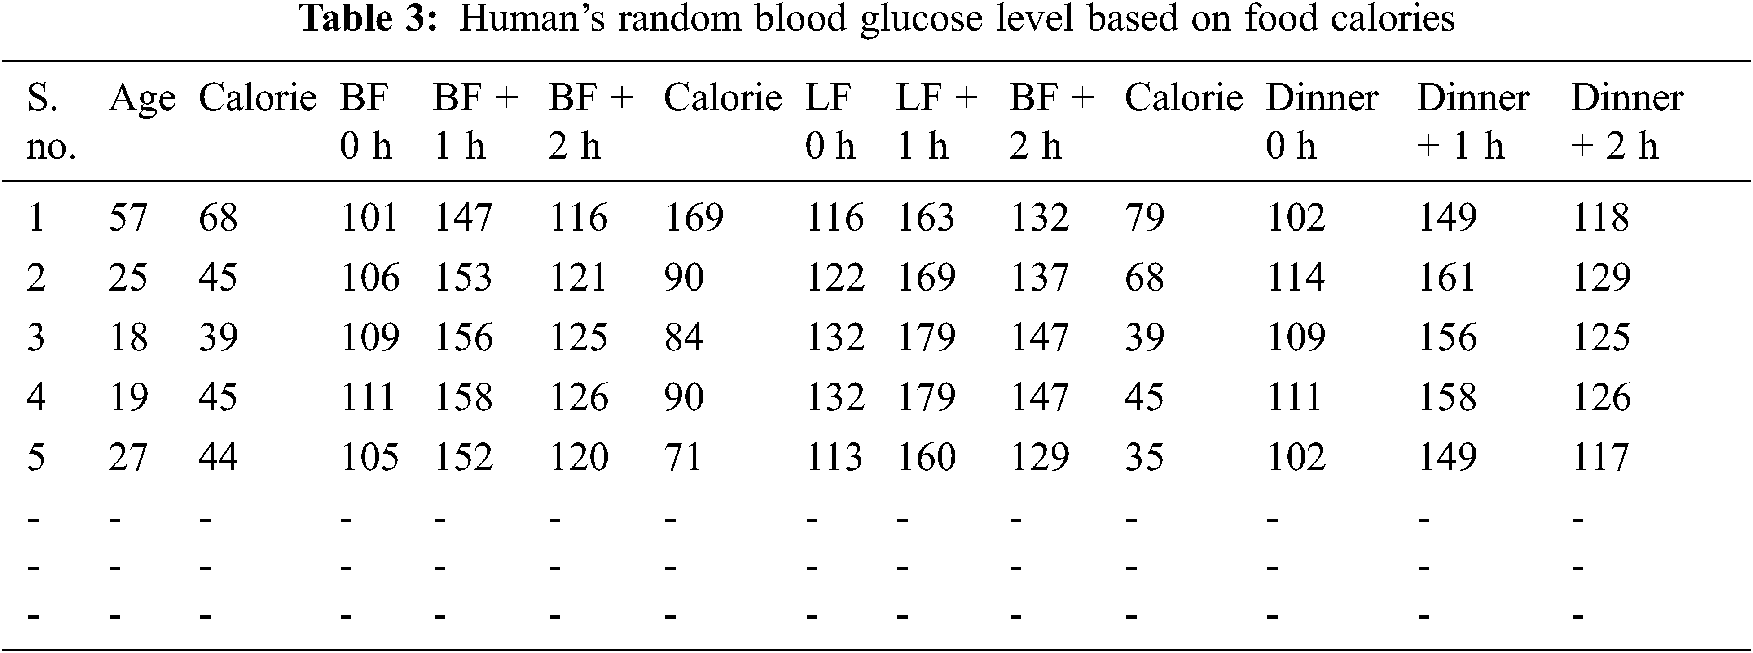
For calculating the random plasma glucose zero-hour, one hour and two hours are
where C represents calorie and B represents Age. Tab. 3 shows the human’s random blood glucose level based on food calories.
Next, we find the h1bc level by Nathan, DTTC, and ADAG formulas.
If the h1bc level is less than 5.7 then the health condition is “Normal”, If the h1bc level is between 5.7 and 6.4 then the health condition is moved to “Pre-diabetes” and If the h1bc level is greater than 6.4 then the health condition moves to diabetes level. Tab. 4 shows the comparison of age and diabetes.
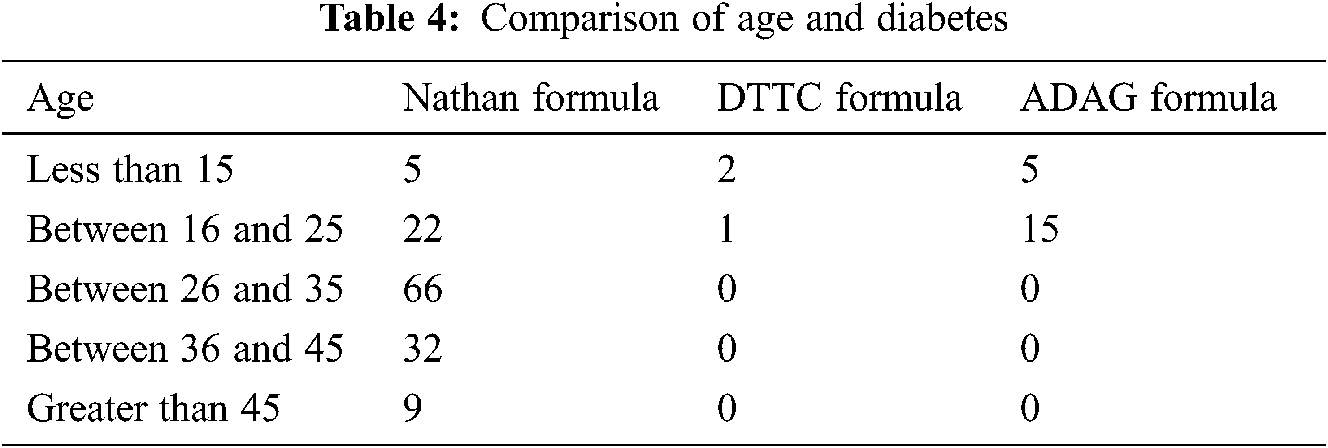
3.2 Comparison of the Proposed Methodologies Based on Age and Diabetic Level
Nathan’s formula performs effectively in predicting several diabetes cases, as shown in Figs. 3a and 3b. As a result, the Nathan formula outperforms the ADAG and DTTC formulae. The widely used metrics of stratification measures including accuracy, sensitivity, and uniqueness, as well as the recall diabetes dataset, are utilized to analyze the execution of a classifier based on machine learning. The classification models were analyzed and compared to obtain the optimal model for prediction of the diabetes diseases. Here, Accuracy is the ratio of precisely classified events to the total events, mathematically:
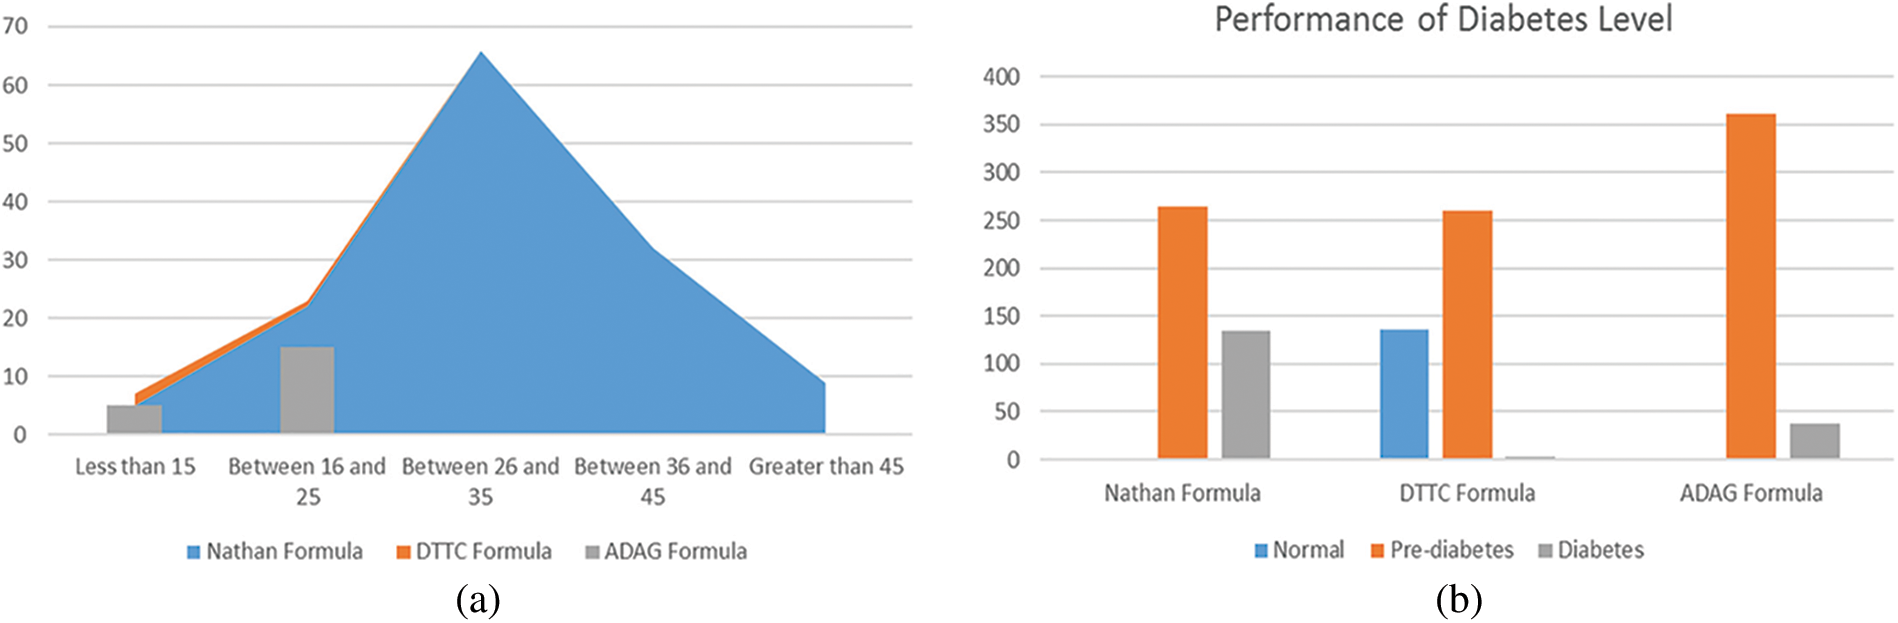
Figure 3: (a) Comparison of age and diabetes, b) Performance of diabetes level
Sensitivity (or) Recall is also called TN rate. It indicates that the precisely classified negative cases can be determined by:
Specificity is also called TP rate that indicates the precisely identified positive cases, it can be determined by:
Precision is the proportion of accurately predicted positive cases and it can be determined by:
The error rate is also called misclassification rate that projects the incorrect classified cases, and it can be determined by:
This model will be estimated by using a confusing matrix, which presents the number of correct and incorrect predictions.
The experiments are implemented instantaneously in Jupyter Notebook and it is proven that this magnificent environment strikes out the barriers of elevating the environment for implementing machine algorithms that are written in Python. It applies tensor flow back end. The results in Tab. 5 show that the machine learning algorithms do a good job of classifying the dataset. The Nathan formula only predicts an increase in diabetes cases. As a result, the Nathan formula outperforms the ADAG and DTTC formulas (s). Random Forest (92%) and Decision Tree (91%) ensembles are found to perform exceptionally well, greatly boosting accuracy without and with cross-validation (CV).
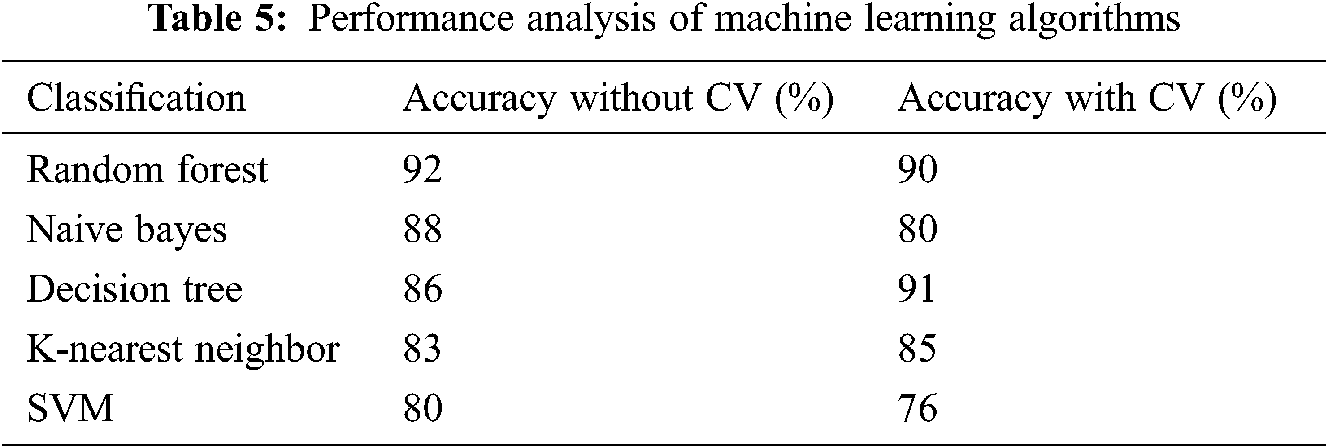
Diabetes is a lifestyle disease that influences millions of human beings worldwide each year. But their inability to access their diet accurately raised the development of this system. Prediction of diabetes level is implemented using classification-based association rule mining algorithms. The application of machine learning thus enhances vigorously in all domains. As a result, it is discovered that the healthcare sector is not an exception. Random Forest (92%) and Decision Tree (91%) ensembles are found to perform extremely well and improve the accuracy without and with cross-validation significantly.
This work can be expanded to engage actual time medical information gathered from various cancer centers and transformed into desktop applications, thus the doctors can make use of this as an aiding tool in their diagnosis.
Acknowledgement: The authors with a deep sense of gratitude would thank the supervisor for his guidance and constant support rendered during this research.
Funding Statement: The authors received no specific funding for this study.
Conflicts of Interest: The authors declare that they have no conflicts of interest to report regarding the present study.
1. A. A. Aljumah, M. G. Ahamad and M. K. Siddiqui, “Application of data mining: Diabetes health care in young and old patients,” Journal of King Saud University-Computer and Information Sciences, vol. 25, no. 2, pp. 127–136, 2013. [Google Scholar]
2. P. Repalli, “Prediction on diabetes using data mining approach,” Oklahoma State University, vol. 1, pp. 1–13, 2011. [Google Scholar]
3. M. S. Panahi, N. M. Yazdani and A. Y. Seqerlou, “Design and implementation of an expert clinical system for initial detection of blood fat disease,” Frontiers in Health Informatics, vol. 2, no. 3, pp. 13–15, 2013. [Google Scholar]
4. P. S. Kumar and V. Umatejaswi, “Diagnosing diabetes using data mining techniques,” International Journal of Scientific and Research Publications, vol. 7, no. 6, pp. 705–709, 2017. [Google Scholar]
5. Z. Akata, F. Perronnin, Z. Harchaoui and C. Schmid, “Good practice in large-scale learning for image classification,” IEEE Transactions on Pattern Analysis and Machine Intelligence, vol. 36, no. 3, pp. 507–520, 2013. [Google Scholar]
6. G. Fico, A. Fioravanti, M. T. Arredondo, J. Gorman, C. Diazzi et al., “Integration of personalized healthcare pathways in an ICT platform for diabetes management: A small-scale exploratory study,” IEEE Journal of Biomedical and Health Informatics, vol. 20, no. 1, pp. 29–38, 2014. [Google Scholar]
7. D. Dubey, S. Kunwar and U. Gupta, “Mid-trimester glycosylated hemoglobin levels (HbA1c) and its correlation with oral glucose tolerance test (World health organization 1999),” Journal of Obstetrics and Gynaecology Research, vol. 45, no. 4, pp. 817–823, 2019. [Google Scholar]
8. M. M. Alotaibi, R. S. Istepanian, A. Sungoor and N. Philip, “An intelligent mobile diabetes management and educational system for Saudi Arabia: System architecture,” in Proc. Biomedical and Health Informatics, Valencia, Spain, pp. 29–32, 2014. [Google Scholar]
9. C. Chatfield and D. L. Prothero, “Box-jenkins seasonal forecasting: Problems in a case study,” Journal of the Royal Statistical Society. Series A (General), vol. 136, no. 3, pp. 295–336, 1973. [Google Scholar]
10. J. Zhang, M. Chen, E. Hu and L. Wu, “Data mining model for food safety incidents based on structural analysis and semantic similarity,” Journal of Ambient Intelligence and Humanized Computing, vol. 3, pp. 1–15, 2020. [Google Scholar]
11. M. Zheng, B. Ni and S. Kleinberg, “Automated meal detection from continuous glucose monitor data through simulation and explanation,” Journal of the American Medical Informatics Association, vol. 26, no. 12, pp. 1592–1599, 2019. [Google Scholar]
12. K. Rajesh and V. Sangeetha, “Application of data mining methods and techniques for diabetes diagnosis,” International Journal of Engineering and Innovative Technology, vol. 2, no. 3, pp. 224–229, 2012. [Google Scholar]
13. R. A. Sowah, A. A. B. Addo, S. K. Armoo, F. K. Saalia, F. Gatsi et al., “Design and development of diabetes management system using machine learning,” International Journal of Telemedicine and Applications, vol. 2020, pp. 1–7, 2020. [Google Scholar]
14. V. Jaiswal, “A new approach for recommending healthy diet using predictive data mining algorithm,” International Journal of Research and Analytical Reviews, vol. 6, no. 2, pp. 58–65, 2019. [Google Scholar]
15. R. Sundarasekar and A. Appathurai, “Efficient brain tumor detection and classification using magnetic resonance imaging,” Biomedical Physics & Engineering Express, vol. 7, no. 5, pp. 055007, 2021. [Google Scholar]
16. M. Reshma and B. P. Shan, “A clinical decision support system for micro panoramic melanoma detection and grading using soft computing technique,” Measurement, vol. 163, pp. 108024, 2020. [Google Scholar]
17. D. R. Ramji, C. A. Palagan, A. Nithya, A. Appathurai and E. J. Alex, “Soft computing-based color image demosaicing for medical image processing,” Multimedia Tools and Applications, vol. 79, no. 15, pp. 10047–10063, 2020. [Google Scholar]
18. A. Appathurai, R. Sundarasekar, C. Raja, E. J. Alex, C. A. Palaganet al., “An efficient optimal neural network-based moving vehicle detection in traffic video surveillance system,” Circuits, Systems, and Signal Processing, vol. 39, no. 2, pp. 734–756, 2020. [Google Scholar]
19. I. M. Ahmed, A. M. Mahmoud, M. Aref and R. Salem, “A study on expert systems for diabetic diagnosis and treatment,” Recent Advances in Information Science, vol. 5, pp. 363–367, 2012. [Google Scholar]
20. H. Wu, S. Yang, Z. Huang, J. He and X. Wang, “Type 2 diabetes mellitus prediction model based on data mining,” Informatics in Medicine Unlocked, vol. 10, pp. 100–107, 2018. [Google Scholar]
21. S. A. M. Dezfuli, S. R. M. Dezfuli, S. V. M. Dezfuli and Y. Kiani, “Early diagnosis of diabetes mellitus using data mining and classification techniques,” Jundishapur Journal of Chronic Disease Care, vol. 8, no. 3, pp. 223–228, 2019. [Google Scholar]
 | This work is licensed under a Creative Commons Attribution 4.0 International License, which permits unrestricted use, distribution, and reproduction in any medium, provided the original work is properly cited. |