DOI:10.32604/iasc.2022.022423
| Intelligent Automation & Soft Computing DOI:10.32604/iasc.2022.022423 | |
| Article |
Adaptive XGBOOST Hyper Tuned Meta Classifier for Prediction of Churn Customers
1Department of Computer Science and Engineering, SRK Institute of Technology, Vijayawada, 521108, India
2Department of Information Technology, PVP Siddhartha Institute of Technology, Vijayawada, 520007, India
3Department of Computer Science and Engineering, Seshadri Rao Gudlavalleru Engineering College, Gudlavalleru, 521356, India
4Department of Information Technology, Seshadri Rao Gudlavalleru Engineering College, Gudlavalleru, 521356, India
5Department of Computer Science and Engineering, SRKR Engineering College, Bhimavaram, 534204, India
6Department of Computer Science and Engineering, Eswar College of Engineering, Narasaraopeta, 522601, India
*Corresponding Author: B. Srikanth. Email: cse.srikanthb@gmail.com
Received: 07 August 2021; Accepted: 29 October 2021
Abstract: In India, the banks have a formidable edge in maintaining their customer retention ratio for past few decades. Downfall makes the private banks to reduce their operations and the nationalised banks merge with other banks. The researchers have used the traditional and ensemble algorithms with relevant feature engineering techniques to better classify the customers. The proposed algorithm uses a Meta classifier instead of an ensemble algorithm with an adaptive genetic algorithm for feature selection. Churn prediction is the number of customers who wants to terminate their services in the banking sector. The model considers twelve attributes like credit score, geography, gender, age, etc, to predict customer churn. The project consists of five modules as follows. First is the pre-processing module that identifies the missing data and fills the value with mean and mode. Second is the data transformation module where, the categorical data is converted into numerical data using label encoding to fasten the computations. The converted numerical data is normalized using the standard scalar technique. The feature selection module identifies the essential attributes using DragonFly and Firefly (Hybrid Fly) algorithms. The classification module designs an intelligent Meta learner, which combines the Ensemble Algorithm Extreme Gradient Boosting (XGBOOST) with base classifiers as “Extra Tree Classifier” and “Logistic Regression” to predict the churn customers.
Keywords: Meta classifier; hybrid fly; hypertune estimators; xgboost; extra tree classifier; label encoding
The customers’ churn decision depends on the offers and benefits provided by the organization. To automate the process of finding the churn customers, the proposed algorithm uses machine learning [1] concepts with few important limitations from the previous works, as shown in Tab. 1.
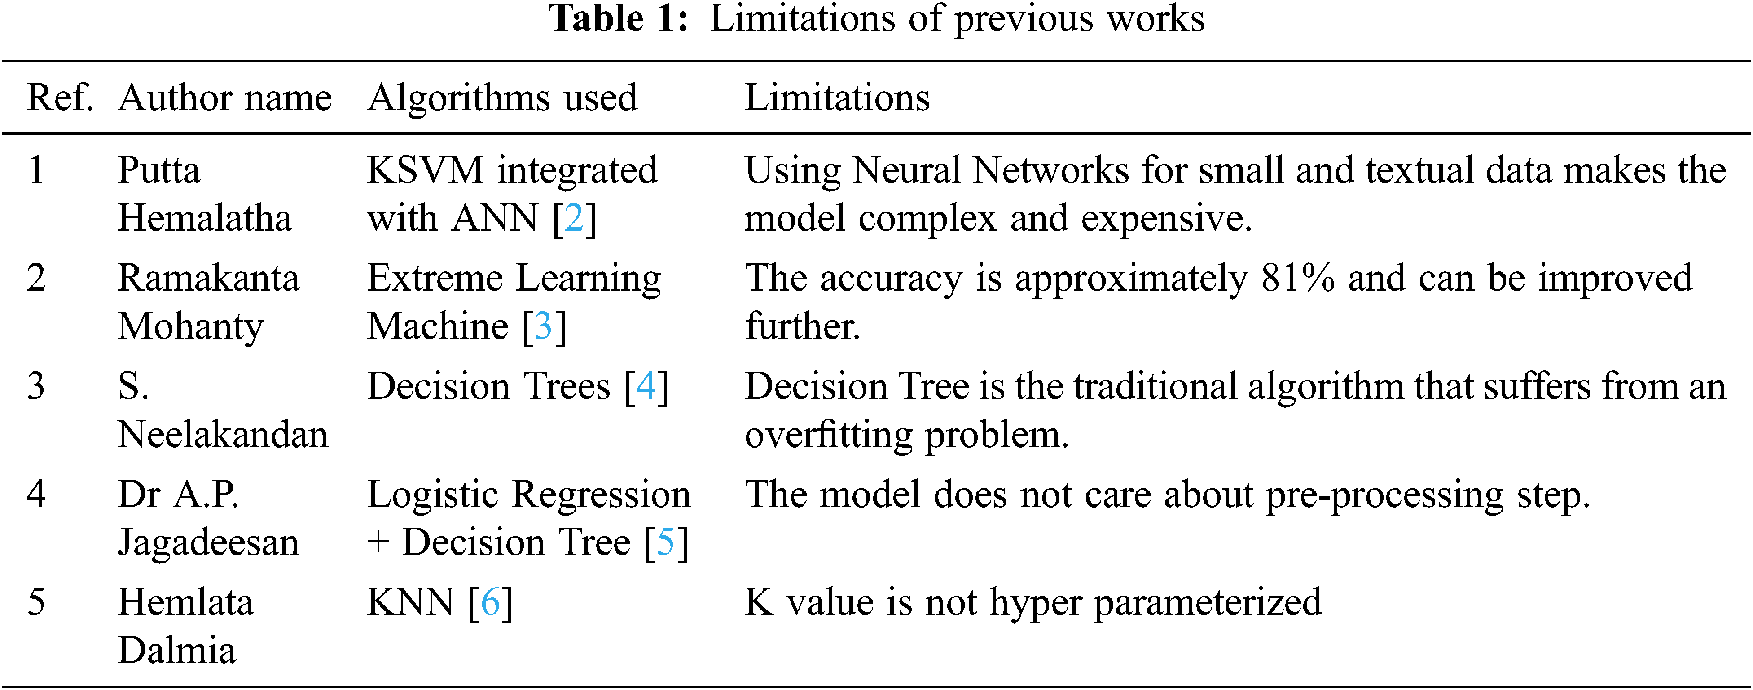
From the above limitations, few research gaps are identified and solutions are given by the proposed method as follows.
The system needs an algorithm to support the hyper tuning of the estimators that quickly adapt to the environment for self-learning as autonomous system.
Deep Learning algorithm is good in nature, but it makes the process complicated and hence the algorithm should be automatic, dynamic and straightforward.
To solve overfitting problem, the system needs an algorithm to adjust the training data and generate good decision rules to produce the tree of good depth.
The accuracy is mainly dependent on pre-processing and feature selection processes. Blindfolded traditional approaches are suitable to handle this problem. The algorithm needs some data exploration mechanisms to decide the data cleaning techniques that is applied simultaneously to decide population characteristics.
The approach used by organizations to identify customers who are likely to churn is known as the binary classification job. Binary classification tasks interpret questions as input and the results are either yes or no. Customer deflection likelihood is most common in SaaS (software as a service) and membership-based (fee-based) firms that charge on monthly, yearly, quarterly and ongoing basis. Mostly, creating a customer outreach model that yields reliable data for churn prediction is the first step in deflection probability analysis.
The exploration of diverse machine learning and statistical models for progress in prediction, authors have analyzed the virtue of customer churn rate in data. The experiment shows a comparative result of testing the parameters like accuracy, specificity and sensitivity of the algorithms such as Random Forest, ANN (Artificial Neural Networks), GLM (Generalized linear model) and XG – Boost (extreme gradient boosting) [7] over the data set. This paper is mainly suitable for the commercial banks to evade customer churn and preserve the advances and deposits held by the SB (Saving’ Bank) customers. Predictive algorithm compared the models and stated that Random Forest [8] had shown the best churn prediction of 78% with a high predictive score from the experimented dataset.
This model uses Multi-Layer Perceptron in Artificial Neural Network (ANN) [9] for customer churn prediction and resulted in the best accuracy compared to the traditional machine learning methods with graphical representation. For better computation of the deployed model, the researchers have segmented the dataset into three parts namely a training set, a testing set and a validation set. The feature scaling is used to improve the algorithm’s computation time. The model deployed in python and Multilayer Perceptron with ANN showed 97.53% and 97.36% of efficiency respectively.
With the use of clustering and classification models, the authors developed a predictive algorithm to determine the circumstances for customer churning in telecom sector [10]. The proposed model initially categorizes churn customers using the Random Forest classification algorithm with an accuracy of 88.63% and later uses a cosine correlation to produce grouped retention. Random Forest generally uses decision trees in classification and handling nonlinear data effectively. With the associated features, the deployed model works best on the dataset. This study uses Attribute Selected Classifier for rule generation [11] and accessible visualization.
The Principal Component Analysis (PCA) establishes the features for all the indiscriminate datasets segregated from the training dataset. The key component of this development is to evaluate a better prediction model for the client churning in the telecom sector.
The research proves that the deep learning algorithm model is better than the general machine learning algorithms and ANN concepts in churn prediction. For this research, the experiment was carried out on RapidMiner Studio using two unique datasets [12]. The experimental analysis using Deep Neural Networks (DNN) [13] is carried out on hidden layers using a rectifier function and on activation layers and output stage, a sigmoid operation is used. This experiment has three main research objectives such as the Activation Function, Batched sizes and training algorithms. In the first analysis, variant combinations of active functions are used at the hidden and output layers to identify the accuracy. The second observation is to calculate the impact on the considered training deep neural network on batch size. At last, multiple training algorithms are compared with different training parameters for determining the efficiency. The proposed heuristic observation will increase the productivity of hyperparameter tuning in DNN churn model [14–17].
The proposed algorithm is carried out on a moving window that authorizes complex detection, series and dependencies based on the chosen transactions at particular time. This experiment also focused on reducing the noise data by eradicating inappropriate dependencies that arise due to the absence of analysis through time dimension. Rather than Principal Component Analysis (PCA) [18–20], the Boruta algorithm [21,22] is used for the feature selection process for dimensionality reduction problem. This developed research can derive substantial patterns from factual customers transmit and transactional data [23,24] authenticated by the financial institutions.
The main focus of this study is to detect the churned customers in banking sector and to take preventive measures to protect them from exiting. The proposed system consists of five modules, as outlined in Fig. 1.
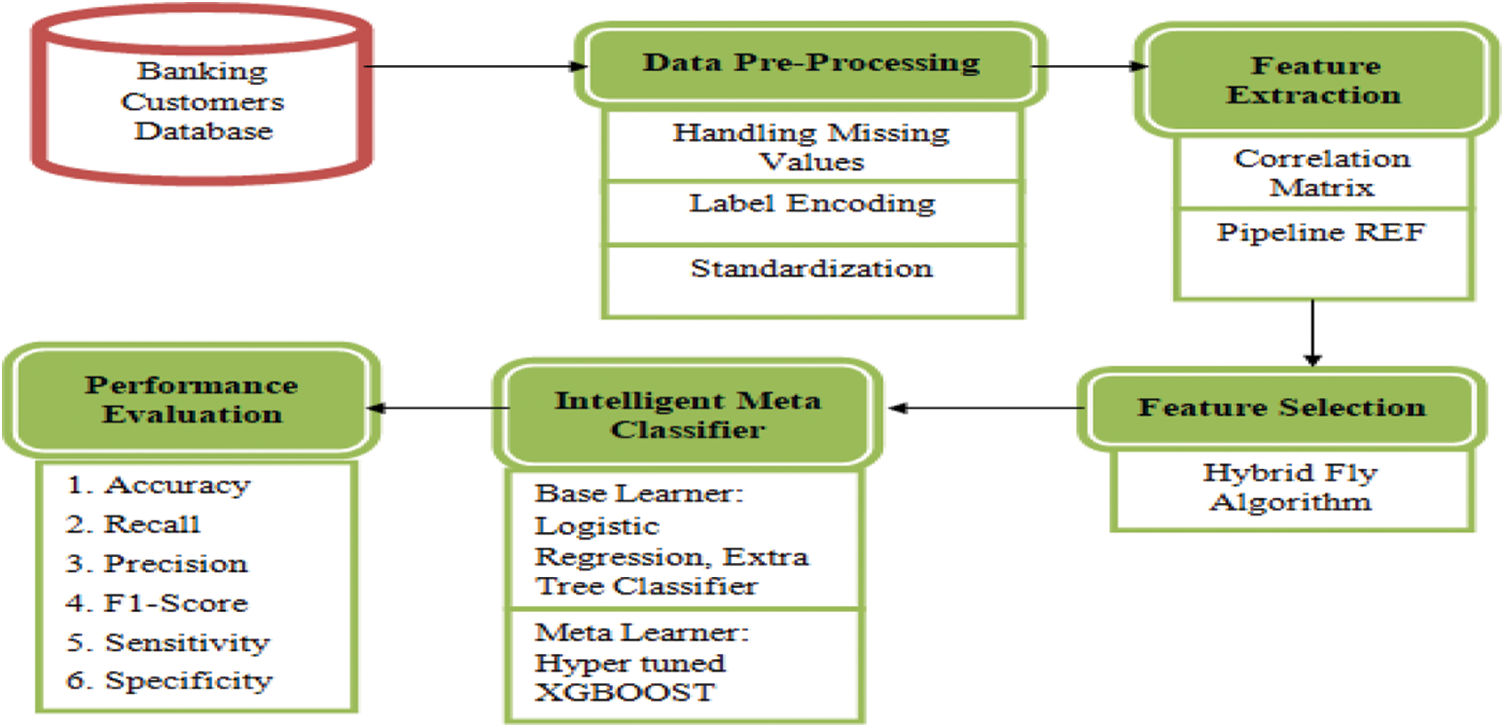
Figure 1: An overview of five modules in predicting the churn customers in banking industry
The churn modeling dataset contains 12 attributes and 1 class label of 50000 customers detail for training. The detailed description of the dataset is given in Tab. 2.
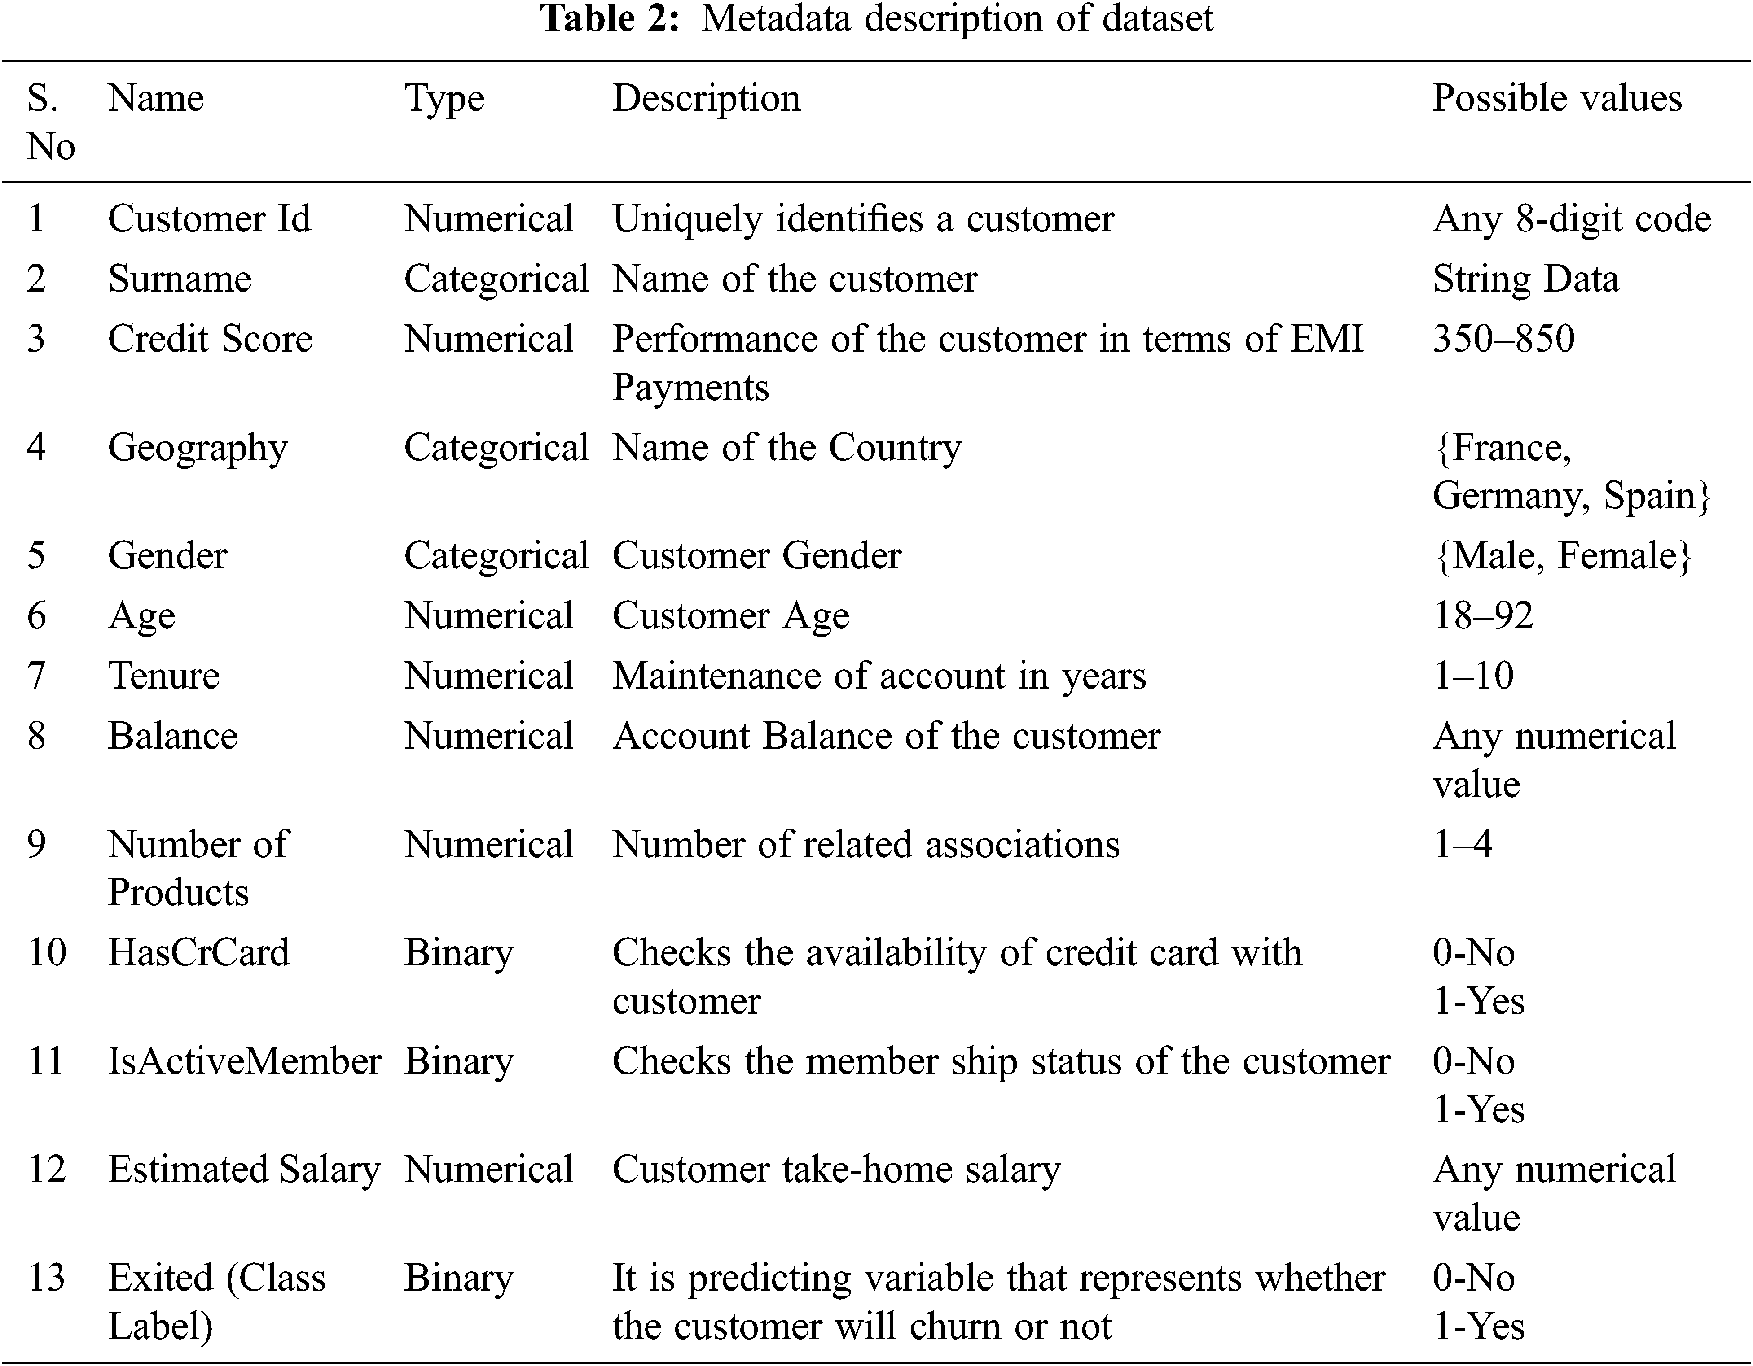
The basic principle of any machine learning algorithm is that it works efficiently with numerical and binary data rather than categorical data. To design an accurate system, the null values are removed before converting the categorical data to numerical data. In the above dataset, an empty value in age attribute is filled with a mean value of the age.
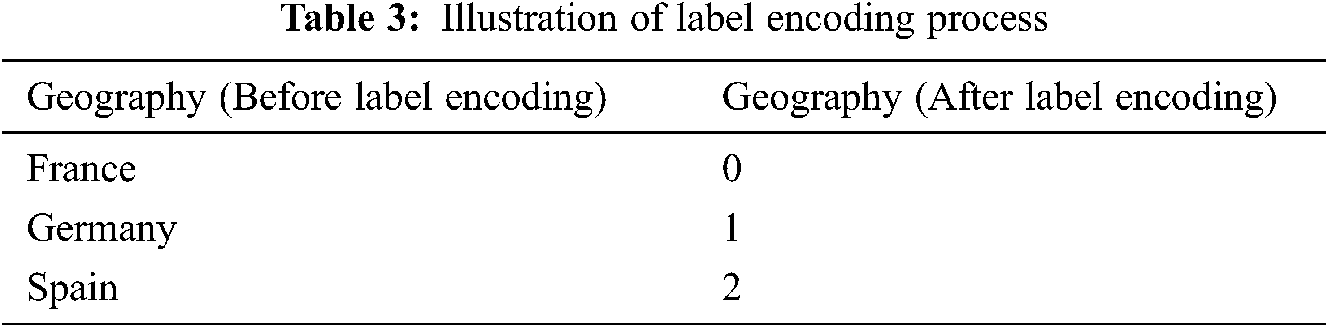
It describes the process of converting the categorical data into numerical data with an encoding technique known as “Label Encoding,” which assigns a numerical value from 0 to n-1. The conversion process is illustrated with an example as follows. Suppose an attribute known as “Geography” has three different values represented ranging from 0 to 2 numerical values based on the sorted data as illustrated in Tab. 3.
The churn modeling dataset contains a total of 3 categorical data elements. By applying the data transformation process on these elements, the obtained numerical values of a sample set are shown in Fig. 2.
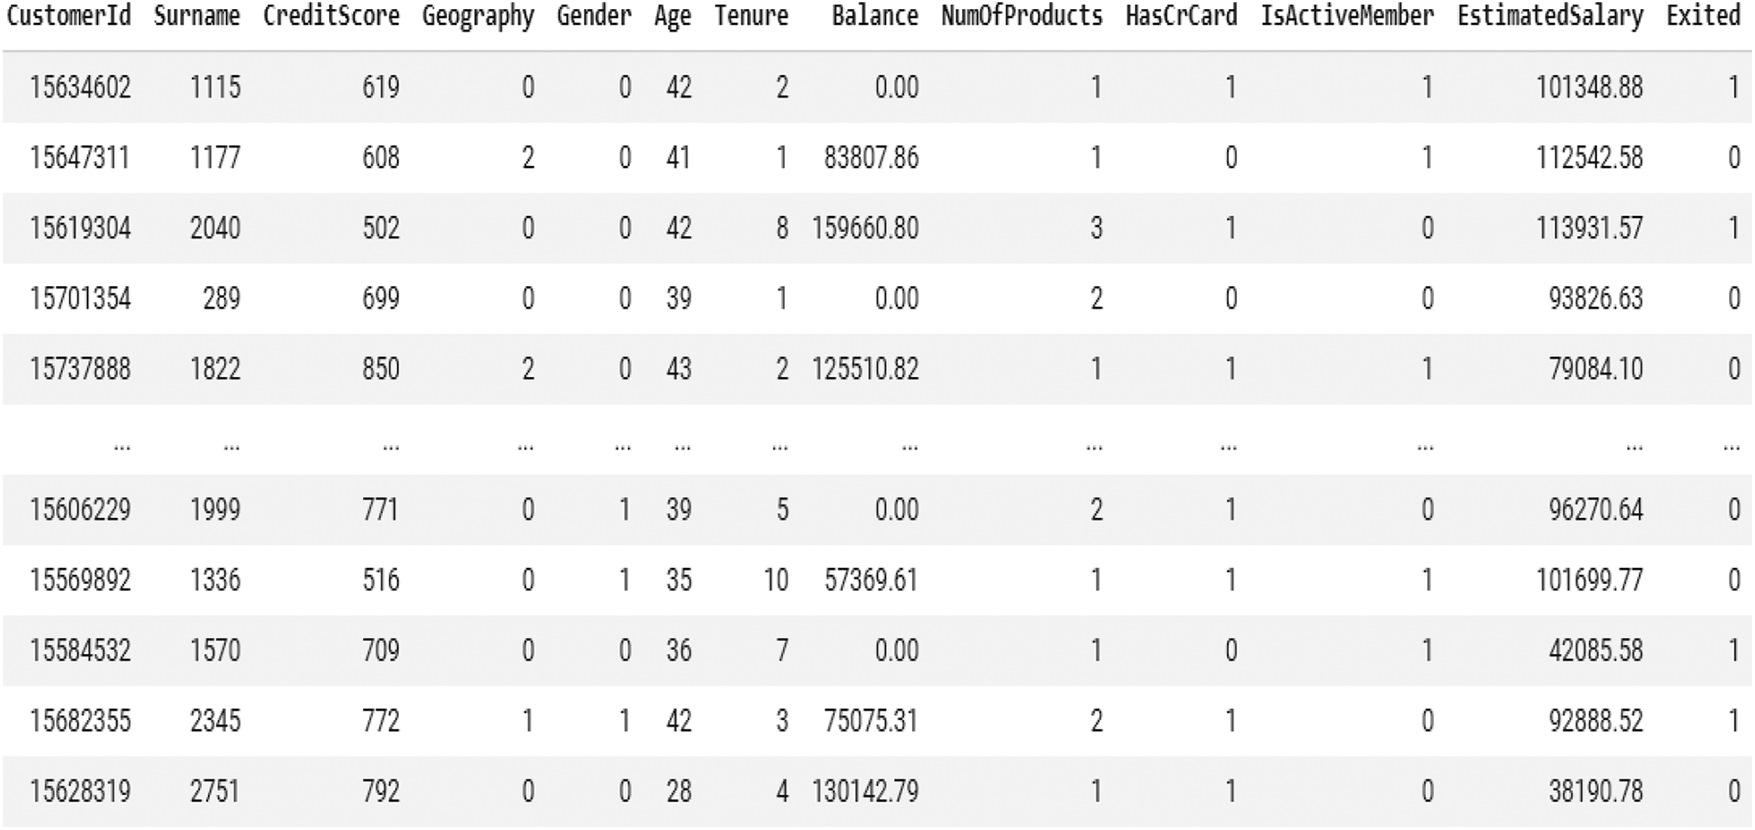
Figure 2: Dataset after label encoding mechanism
The obtained data are numerical values, but still there are few attributes like credit score, age and estimated salary have wide range of possible values. This problem is addressed by the popular standardization technique known as “Standard Scalar,” that redistributes the mean and standard deviation always to be 0 and 1 respectively. The redistributed values are computed for every possible values in the attribute as represented in Eq. (1).
where A[i]_New denotes the newly computed values of the attribute
A[i]_old denotes the current instance value
μ(A[i]_old) denotes the mean value of ith attribute
σ(A[i]_old) denotes the standard deviation of ith attribute
From the above sub-modules, the pre-processing stage is illustrated as an algorithm below.
Pseudocode for Pre-Processing:
Input: Bank_Data Load the Churn Modelling Dataset as a set of features
Output: Transformed and Standardized data
Begin:
1. if Bank_Data.isnull().sum()!=0
a. for i in len(Bank_Data):
Bank_Data[i] simpleImputer(strategy=’mean’)
2. for c in Bank_Data.colums:
a. if Bank_Data.dtypes[c]==object:
Bank_Le_Data[c] LabelEncoder.fit(Bank_Data[c].astype(str))
b. Bank_Sc_Data[c] StandardScalar.fit_transform(Bank_Le_Data[c])
End
This is the crucial step in machine learning process, as all attributes are not important for the classification of churn customers. In the previous studies, the relation and strength of the attributes are measured using the correlation matrix. The correlation matrix acts as the key decision-maker to measure the strength of the relation between two attributes by computing its rank using Spearman’s mechanism. The proposed system tries to identify the direction of impact on the attributes and their rank order relationship between them. The results obtained for the correlation matrix are represented in Fig. 3.
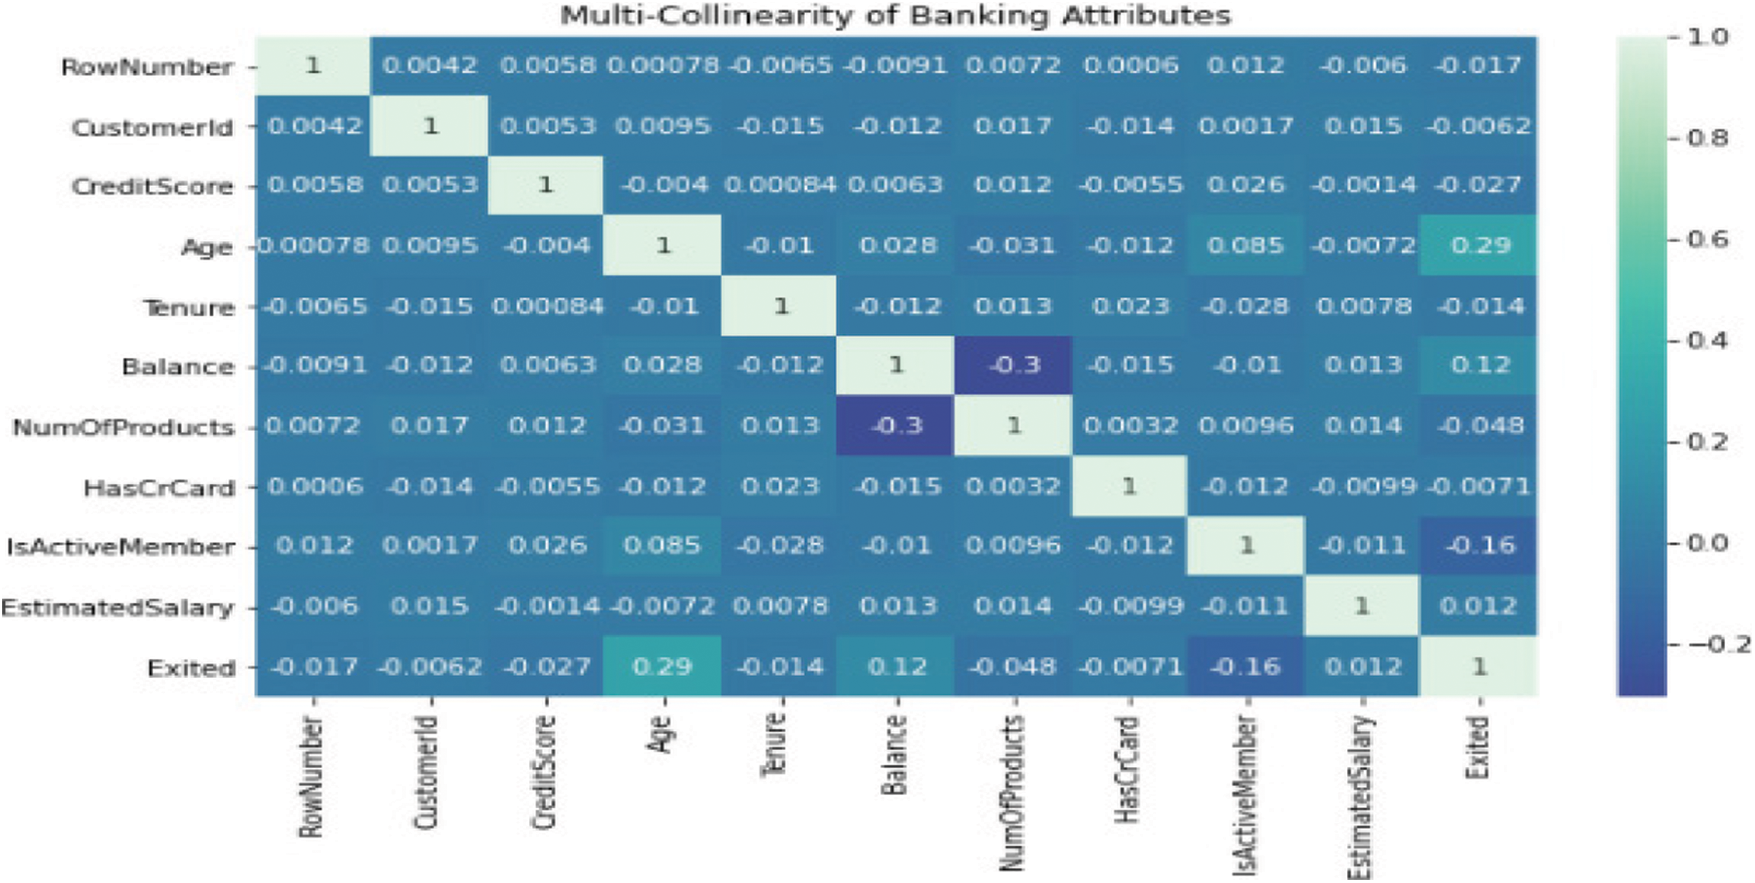
Figure 3: Correlation Matrix using Spearman’s Mechanism
From the above matrix, it is observed that very few elements are correlated. The proposed system implements pipelined architecture of REF with Random Forest algorithm, which computes the accuracy for every individual feature and publishes the one with the highest accuracy as the number of features to be selected. The output for various attributes vs. accuracy is plotted as “Box Plot” in Fig. 4.
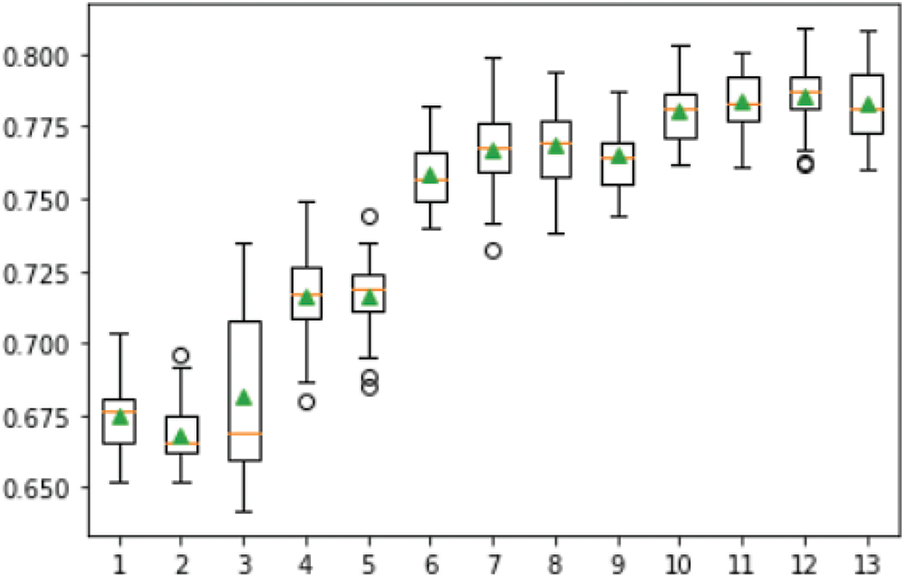
Figure 4: Number of features vs. accuracy
From Fig. 4, it is observed that all the selected attributes have the highest accuracy compared to the other values.
The proposed system has identified the important attributes by designing a novel hybrid adaptive genetic algorithm known as “Dragonfly + Firefly.” The Dragonfly algorithm is the dimensionality reduction technique in large-scale industries that is purely based on the Bayesian Optimization technique and helps improve the performance by evaluating the features in parallel. The Firefly algorithm also reduces the multiple objectives concerned with the improvement of accuracy and reduction of error rate. The dynamic dragonfly creates sub swarms and moves in their favorable direction.
Pseudo Code for Hybrid Fly Algorithm:
Input: Bank_Data Load the Churn Modelling Dataset as a set of features along with labels
Output: Reduced Set of Features with their corresponding index
Begin:
1. Bank_train_x,Bank_train_y,Bank_test_x,Bank_test_y split_and_test(test_size=0.2)
2. Bank_valid_data crossfold(labels, k=5)
3. Initialize number of flies,n and iterations, itr
4. [sel_feat,Nf] BDA(Bank_Data,labels,Bank_valid_data,n,itr)
5. hyb_model_acc jx-firefly(sel_feat,label,Bank_valid_data)
End
The initial dataset contains 12 attributes, but this hybrid feature selection model has identified four important attributes with unique characteristics to identify the churn customers in the banking sector. The results of every iteration with their selected features with Particle Swarm Optimization (PSO), are shown in Fig. 5.
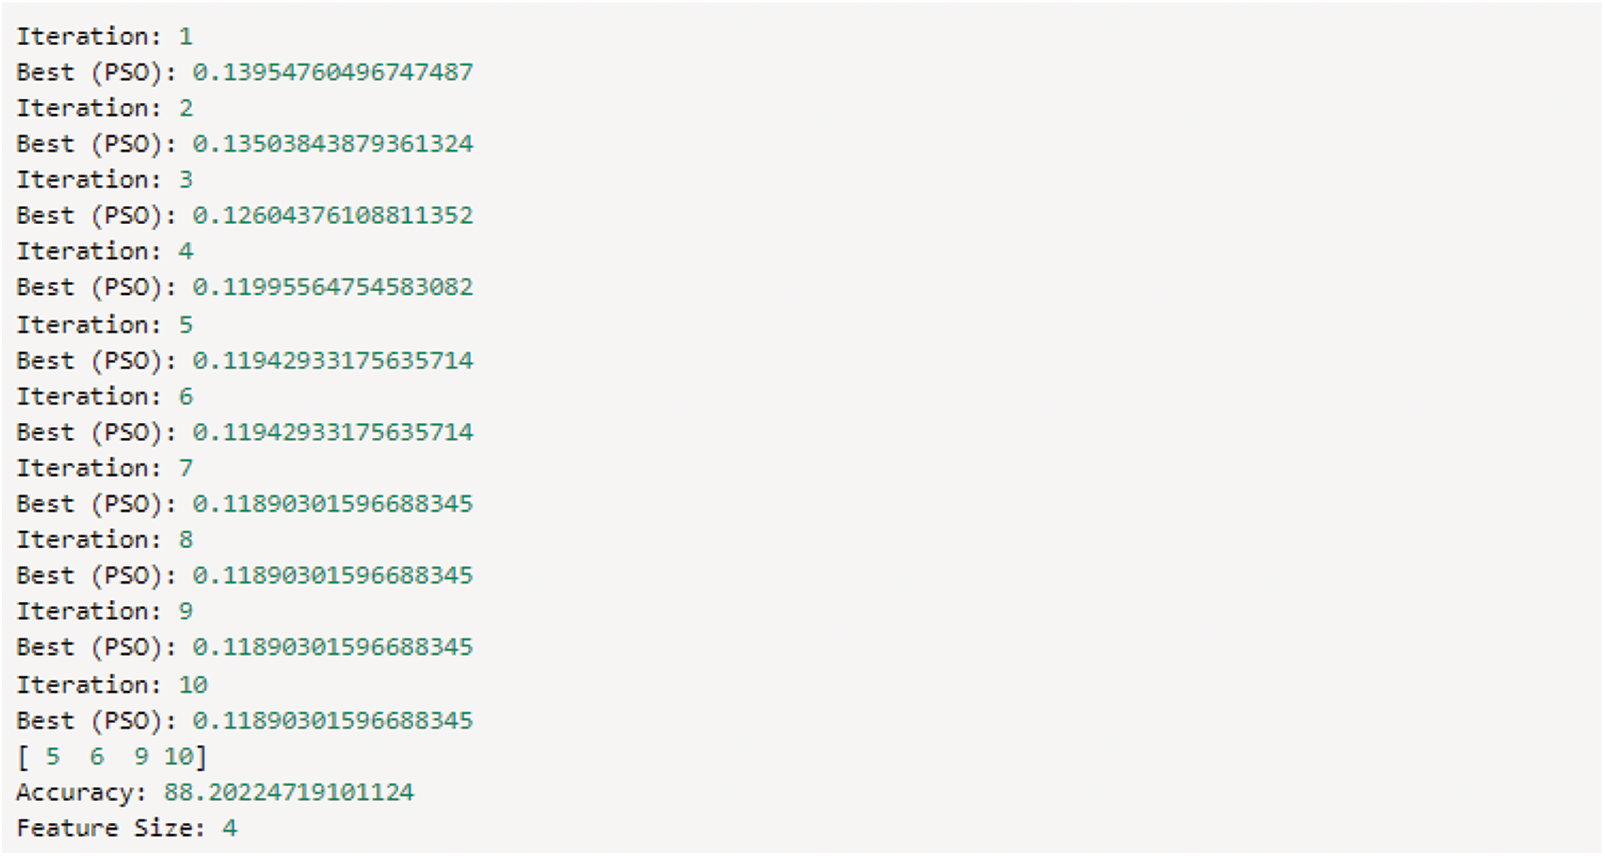
Figure 5: Feature selection with accuracy
Fig. 6 represents the performance of the fitness function associated with each iteration. As the representation values are gradually decreasing at four, the value remains constant.
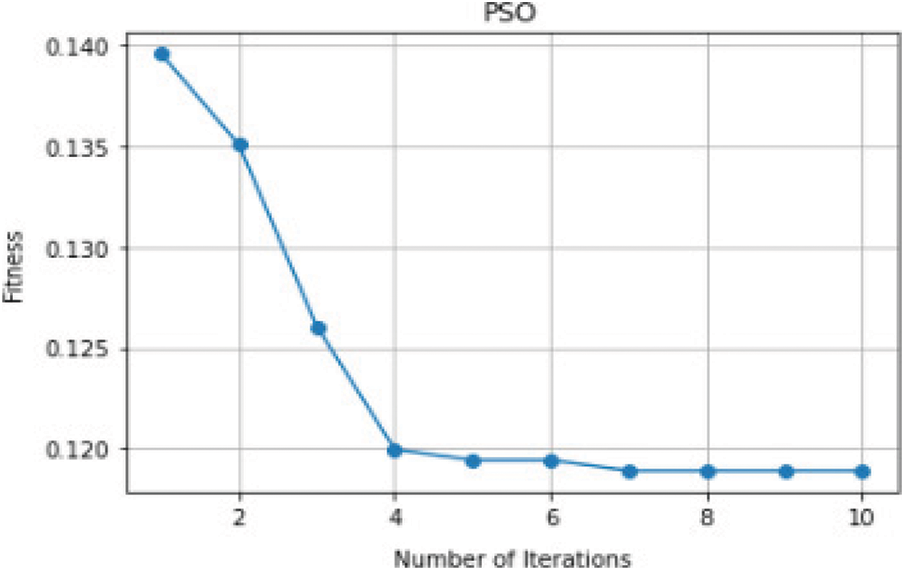
Figure 6: Number of iterations vs. fitness function
3.4 Intelligent Meta Classification
The traditional algorithms like SVM, DT and NB have ruled the prediction systems. On introduction of machine learning algorithms, the ensemble algorithm came into existence, but still the problem of overfitting remains unsolved in few real-time applications. Hence, the proposed system designed a meta classifier of two-step approach that defines the base classifiers and the obtained results are integrated with the meta classifier. The proposed algorithm defines the base classifiers such as logistic regression, a traditional algorithm and an extra tree classifier, an ensemble algorithm. The meta classifier is constructed as XGBOOST. The outline of the prediction system is represented in Fig. 7.
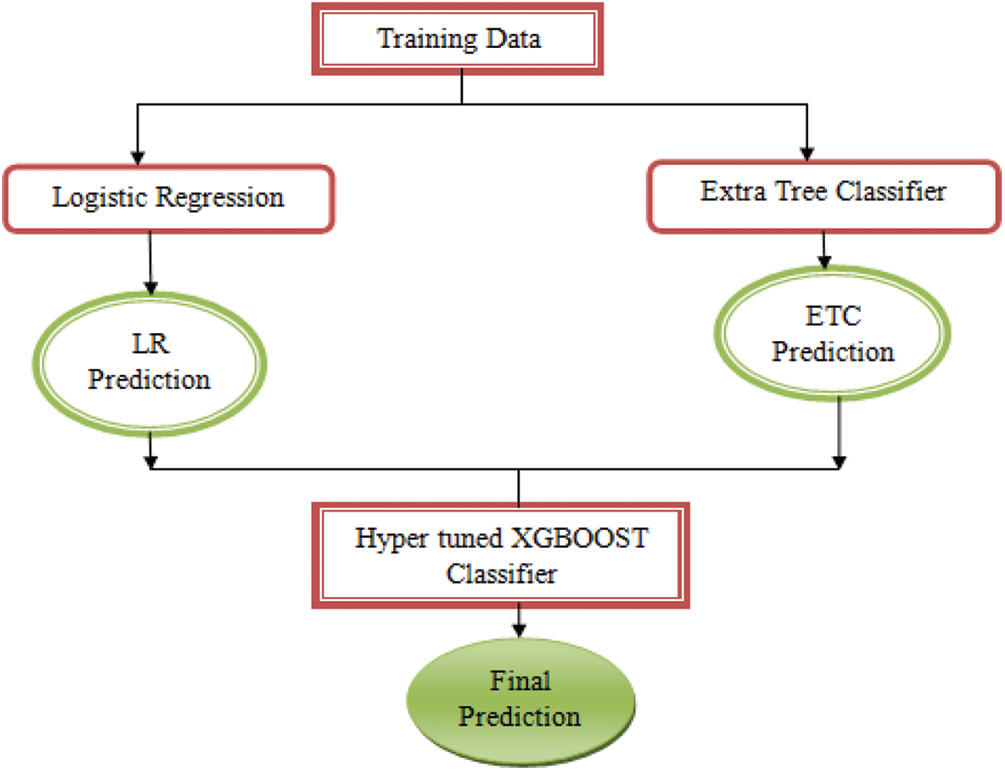
Figure 7: The proposed prediction system
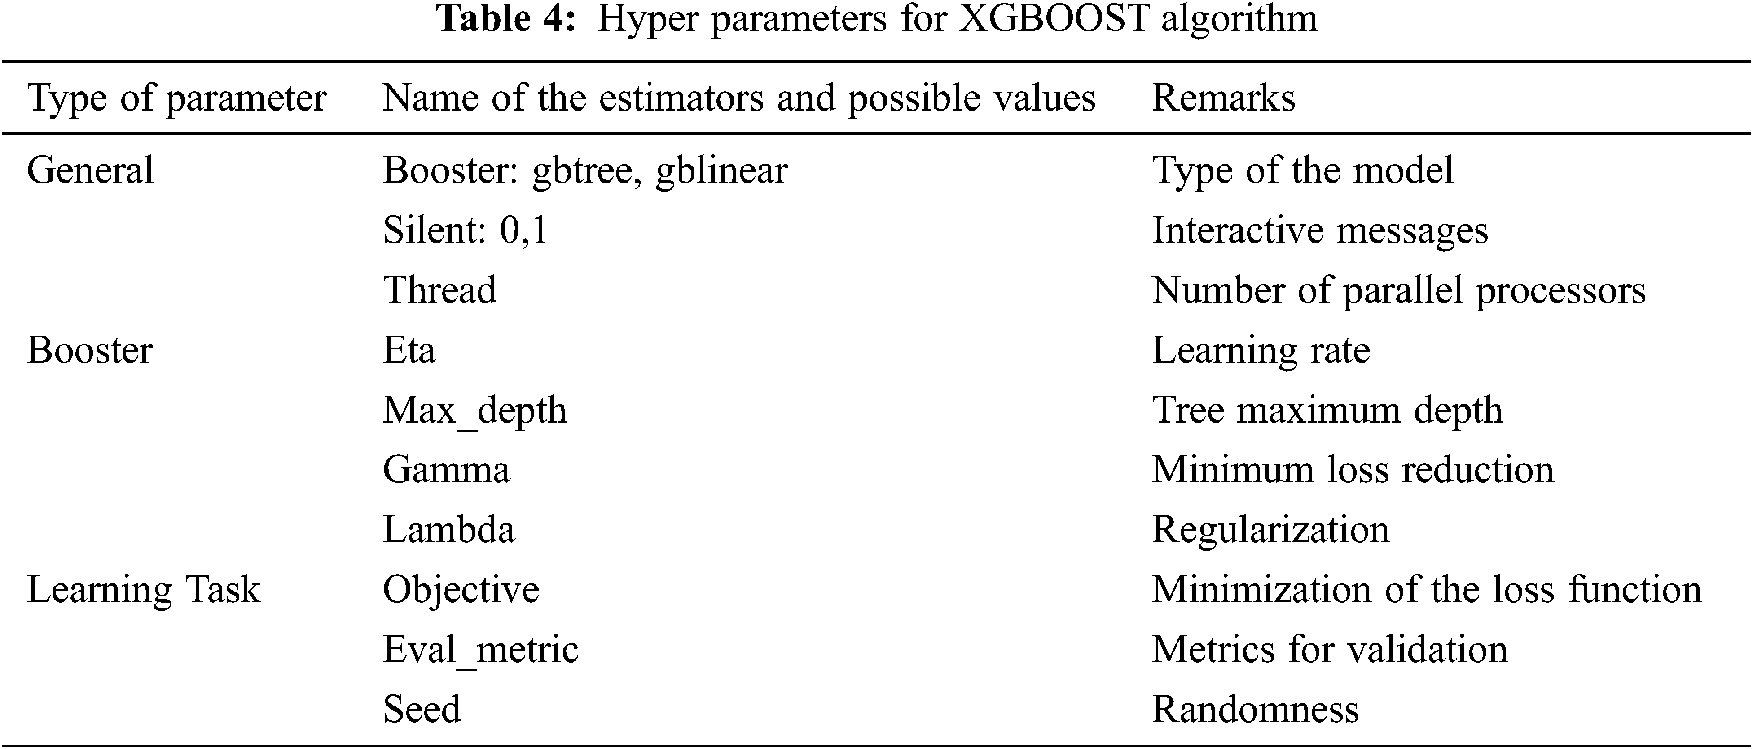
The advantage of this meta classifier architecture is that it applies many algorithms in parallel on the training dataset and collect the predictions from every individual algorithm separately. With the collected predictions, in the second level of architecture, it applies an ensembled algorithm, which is hyper tuned to predict the final class label of the record. With this 2-layered architecture, the accuracy and true positive rate of the prediction system improves. The hyper tune of the algorithm plays a vital role in determining the good estimators based on the application data. The performance of the XGBOOST algorithm depends on the three sets of parameters passed. These parameters are given in Tab. 4.
Pseudo code for Meta Classifier:
Input: Bank_Data Load the Churn Modelling Dataset as a set of features along with labels
Output: Return Evaluation Metrics
Begin:
1. Bank_train_x,Bank_train_y,Bank_test_x,Bank_test_y split_and_test(test_size=0.2)
2. Result_LR Logistic_Regression.fit(Bank_train_x,Bank_train_y)
3. Predict_LR Result_LR.predict(Bank_test_x)
4. Result_Xtree ExtraTreeClassifier.fit(Bank_train_x,Bank_train_y)
5. Predict_Xtree Result_Xtree.predict(Bank_test_x)
6. Res_XGB XGBClassifier(base_score=0.8, booster=‘gbtree’, gamma=1,
learning_rate=0.25, max_depth=5, objective=‘multi:softprobability’)
7. Result_XGB Res.fit(Result_LR,Result_Xtree)
8. Predict_XGB Result_XGB.predict(Bank_test_x)
9. print accuracy, recall, precision, f1-measure
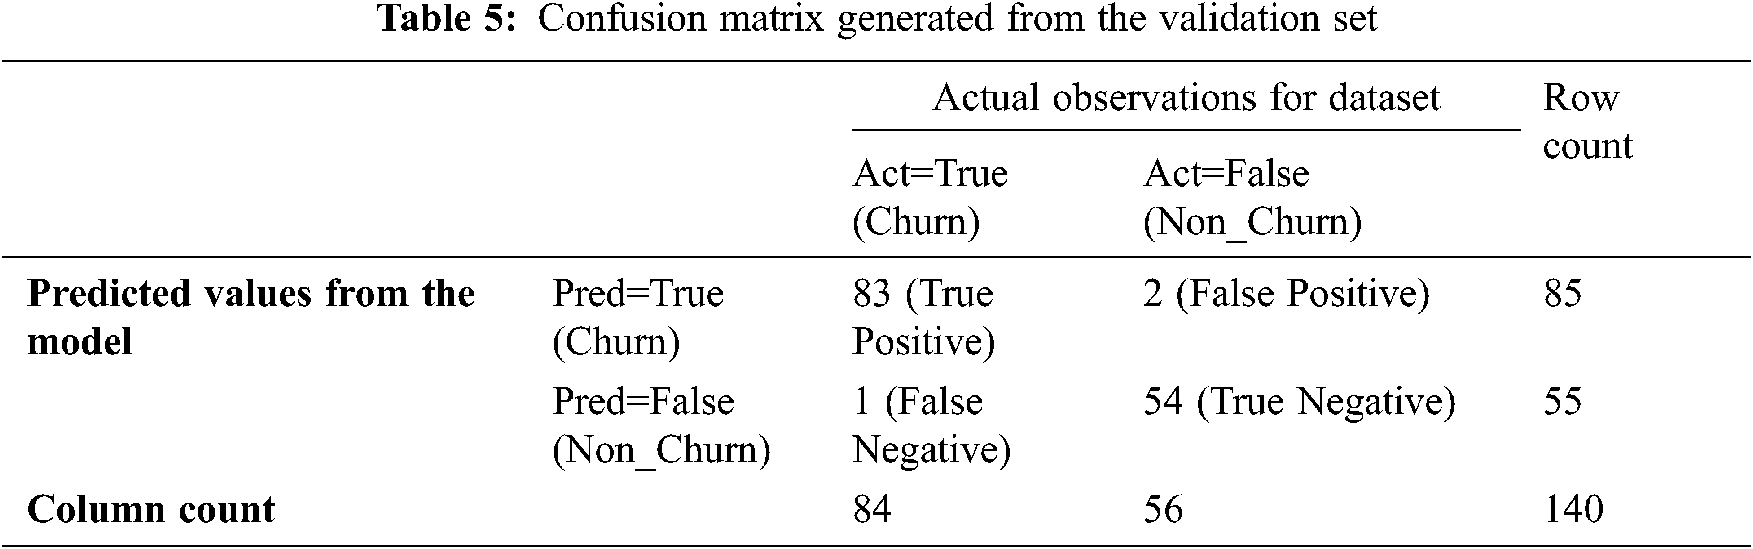
The proposed model is measured using various parameters like accuracy, recall, etc. The computation of parameters and the results obtained are discussed in this section. The proposed model used 140 dataset records for validation. The generation of the confusion matrix is illustrated in Tab. 5.
(i) The computation of accuracy is the crucial element that decides the model’s reliability. Accuracy is given by the fraction of true predictions only. Either it can be a positive label or a negative label.
(ii) The precision is defined as the ratio of only predicted positive labels among all the true and false positive labels identified and it is given by,
(iii) The recall is defined as the ratio of only predictive positive labels among all the positive and negative values estimated and it is given by,
=
= 98.8%
(iv) The ratio of twice the value of precision and recall to the summation of recall and precision, is the traditional F-measure and it is represented by,
=
= 98.21%
The performance of the proposed system is compared to the previous systems in Tab. 6.
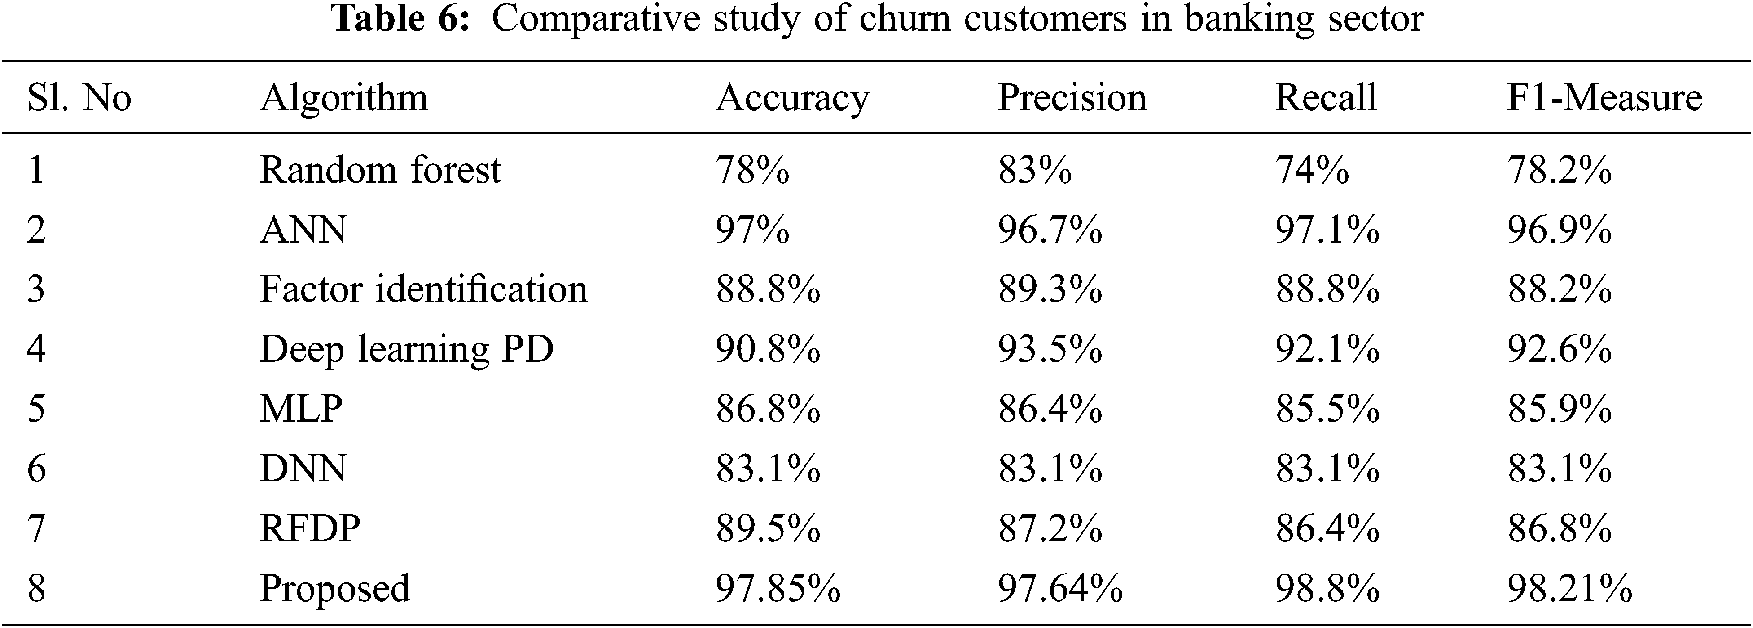
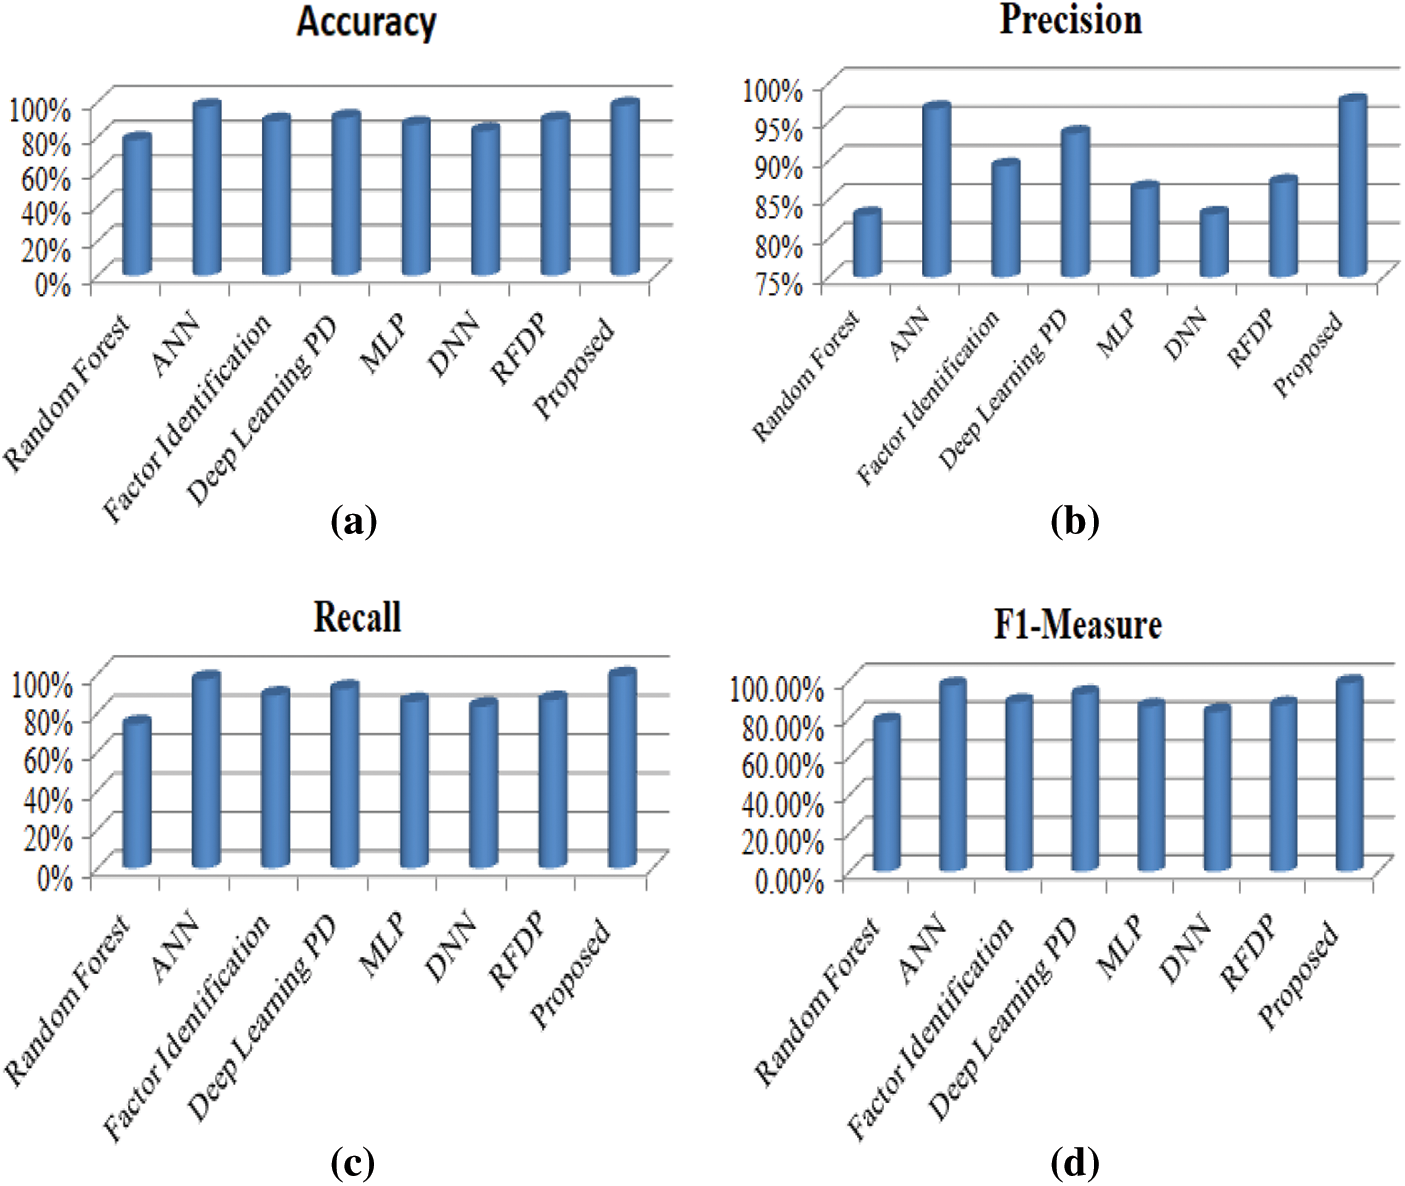
Figure 8: (a) Accuracy evaluation (b) Precision evaluation (c) Recall evaluation (d) F1-Measure evaluation
Fig. 8 clearly states that the proposed model has a better performance in all the aspects compared to the existing methods. The Meta-Learning algorithm combined with ensemble bagging algorithm known as "Extra Tree Classifier" with boosting algorithm “XGBOOST” gives us more accuracy than the traditional approaches with 97.85% of accuracy. This algorithm accurately finds the customers’ who churns from the banking sector, represented by the sensitivity (Truly Predicted Class Labels) of 98.8%. The main advantage of this algorithm is to identify the important features using the Hybrid Fly algorithm.
The customers’ retention ratio is the crucial element in private organizations, especially in banking industry. Hence, the proposed system designed a hybrid fly algorithm, an important segment to identify the crucial characteristics that act as a decision-maker to predict the churn customers. All the existing studies either used correlation or recursive methods to analyze the strength of the attributes, but the proposed algorithm uses swarm intelligence, that identifies the strength based on its working environment. The second major element of the algorithm is meta classifier, that allows many algorithms to run in parallel and improve the execution times of the model. As it involves the majority voting scheme, the model’s reliability is considered to be more accurate. The hyper tuning parameters help the model to select its decision rules and threshold values that automatically makes the system to adjust their estimator values. As the dataset contains a huge amount of data, working on desktop applications, supported by the CPU requires more computation time. Hence, it is better to work in a cloud environment with Big Data tools like Apache Spark. The system can be further extended to offer different loan schemes and credit cards to the customers who wants to terminate from the banking sector.
Funding Statement: The authors received no specific funding for this study.
Conflicts of Interest: The authors declared that they have no conflicts of interest to report regarding the present study.
1. Y. Deng, D. Li, L. Yang, J. Tang and J. Zhao, “Analysis and prediction of bank user churn based on ensemble learning algorithm,” in IEEE Int. Conf. on Power Electronics, Computer Applications, Shenyang, China, pp. 288–291, 2021. [Google Scholar]
2. T. Zhou, F. Wang and Z. Yang, “Comparative analysis of ANN and SVM models combined with wavelet preprocess for groundwater depth prediction,” Water, vol. 9, no. 10, pp. 781–792, 2017. [Google Scholar]
3. C. Saravana Kumar, “An authentication technique for accessing de-duplicated data from private cloud using one time password,” Int. Journal of Information Security and Privacy (IJISP), vol. 11, no. 2, pp. 1–10, 2017. [Google Scholar]
4. S. Neelakandan and D. Paulraj, “A gradient boosted decision tree-based sentiment classification of twitter data,” Int. Journal of Wavelets, Multiresolution and Information Processing, vol. 18, no. 4, pp. 2050027, 2020. [Google Scholar]
5. G. R. Kumar, K. V. Sheshanna, S. R. Basha and P. K. K. Reddy, “An improved decision tree classification approach for expectation of cardiotocogram,” Lecture Notes on Data Engineering and Communications Technologies, vol. 62, no. 1, pp. 1–7, 2021. [Google Scholar]
6. H. Dalmia, C. V. S. S. Nikil and S. Kumar, “Churning of bank customers using supervised learning,” Innovations in Electronics and Communication Engineering. Lecture Notes in Networks and Systems, vol. 107, no. 1, pp. 1–9, 2020. [Google Scholar]
7. V. Prashant and P. Hemalatha, “Churn prediction for savings bank customers: A machine learning approach,” Journal of Statistics Applications & Probability, vol. 9, no. 3, pp. 535–547, 2020. [Google Scholar]
8. J. Srikanth, “Accessing the data efficiently using prediction of dynamic data algorithm,” Int. Journal of Computer Applications, vol. 116, no. 22, pp. 39–42, 2015. [Google Scholar]
9. I. Ullah, B. Raza, A. K. Malik, M. Imran, S. U. Islam et al., “A churn prediction model using random forest: analysis of machine learning techniques for churn prediction and factor identification in telecom sector,” IEEE Access, vol. 7, no. 2, pp. 60134–60149, 2019. [Google Scholar]
10. T. Xu, Y. Ma and K. Kim, “Telecom churn prediction system based on ensemble learning using feature grouping,” Applied Science, vol. 11, no. 4, pp. 474–486, 2021. [Google Scholar]
11. P. Lalwani, M. K. Mishra, J. S. Chadha and S. Pratyush, “Customer churn prediction system: A machine learning approach,” Computing, vol. 15, no. 2, pp. 1–24, 2021. [Google Scholar]
12. A. Ramanathan and S. Janarathanan, “Prediction search of topics based on timestamp and interest of domain with advertising,” Int. Journal of Engineering and Computer Science, vol. 4, no. 12, pp. 15387–15391, 2015. [Google Scholar]
13. T. Ravichandran, “An efficient resource selection and binding model for job scheduling in grid,” European Journal of Scientific Research, vol. 81, no. 4, pp. 450–458, 2012. [Google Scholar]
14. P. Ładyżyński, “Direct marketing campaigns in retail banking with the use of deep learning and random forests,” Expert Systems with Applications, vol. 134, no. 1, pp. 28–35, 2019. [Google Scholar]
15. B. Gulluoglu, E. Arifoglu, A. Karahoca and D. Karahoca, “Customer segmentation for churn management by using ant colony algorithm,” Global Journal of Computer Sciences: Theory and Research, vol. 10, no. 1, pp. 18–26, 2020. [Google Scholar]
16. R. Yahaya, O. A. Abisoye and S. A. Bashir, “An enhanced bank customers churn prediction model using a hybrid genetic algorithm and k-means filter and artificial neural network,” in IEEE 2nd Int. Conf. on Cyberspac (CYBER NIGERIA), Abuja, Nigeria, pp. 52–58, 2021. [Google Scholar]
17. J. Dias, P. Godinho and P. Torres, “Machine learning for customer churn prediction in retail banking,” Lecture Notes in Computer Science, vol. 12251, pp. 576–589, 2020. [Google Scholar]
18. I. Kaur and J. Kaur, “Customer churn analysis and prediction in banking industry using machine learning,” in Sixth Int. Conf. on Parallel, Distributed and Grid Computing (PDGC), Waknaghat, India, pp. 434–437, 2020. [Google Scholar]
19. J. Liu, “Analysis for clients churn of credit cards in model construction in banking industry,” Proceedings of Business and Economic Studies, vol. 3, no. 2, pp. 56–65, 2020. [Google Scholar]
20. M. Rahman and V. Kumar, “Machine learning based customer churn prediction in banking,” in 4th Int. Conf. on Electronics, Communication and Aerospace Technology (ICECA), Coimbatore, India, pp. 1196–1201, 2020. [Google Scholar]
21. S. Satpathy, S. Debbarma, S. C. Sengupta Aditya and K. D. Bhattacaryya Bidyut, “Design a FPGA, fuzzy based, insolent method for prediction of multi-diseases in rural area,” Journal of Intelligent & Fuzzy Systems, vol. 37, no. 5, pp. 7039–7046, 2019. [Google Scholar]
22. D. Paulraj, “An automated exploring and learning model for data prediction using balanced CA-SVM,” Journal of Ambient Intelligence and Humanized Computing, vol. 12, no. 5, pp. 4979–4990, 2021. [Google Scholar]
23. E. S. Madhan and R. Annamalai, “A novel approach for vehicle type classification and speed prediction using deep learning,” Journal of Computational and Theoretical Nanoscience, vol. 17, no. 5, pp. 2237–2242, 2020. [Google Scholar]
24. S. B. Priya, M. Rajamanogaran and S. Subha, “Prediction of chest diseases using transfer learning,” Machine Learning for Healthcare Applications, vol. 199, no. 2, pp. 1–10, 2020. [Google Scholar]
 | This work is licensed under a Creative Commons Attribution 4.0 International License, which permits unrestricted use, distribution, and reproduction in any medium, provided the original work is properly cited. |