DOI:10.32604/iasc.2022.017691
| Intelligent Automation & Soft Computing DOI:10.32604/iasc.2022.017691 | |
| Article |
Bidirectional Long Short-Term Memory Network for Taxonomic Classification
1Department of Information Technology, College of Computer and Information Sciences, Princess Nourah Bint Abdulrahman University, Riyadh, Saudi Arabia
2Department of Electronics and Electrical Communications Engineering, Faculty of Electronic Engineering, Menoufia University, Menoufia, 32952, Egypt
3Department of Computer Science and Engineering, Faculty of Electronic Engineering, Menoufia University, Menoufia, 32952, Egypt
4Ministry of Education, Riyadh, Saudi Arabia
*Corresponding author: Naglaa. F. Soliman. Email: nfsoliman@pnu.edu.sa
Received: 07 February 2021; Accepted: 23 September 2021
Abstract: Identifying and classifying Deoxyribonucleic Acid (DNA) sequences and their functions have been considered as the main challenges in bioinformatics. Advances in machine learning and Deep Learning (DL) techniques are expected to improve DNA sequence classification. Since the DNA sequence classification depends on analyzing textual data, Bidirectional Long Short-Term Memory (BLSTM) algorithms are suitable for tackling this task. Generally, classifiers depend on the patterns to be processed and the pre-processing method. This paper is concerned with a new proposed classification framework based on Frequency Chaos Game Representation (FCGR) followed by Discrete Wavelet Transform (DWT) and BLSTM. Firstly, DNA strings are transformed into numerical matrices by FCGR. Then, the DWT is used instead of the pooling layer as a tool of data compression. The benefit of using the DWT is two-fold. It preserves the useful information only that enables the following BLSTM training, effectively. Besides, DWT adds more important details to the encoded sequences due to finding effective features in the DNA fragments. Finally, the BLSTM model is trained to classify the DNA sequences. Evaluation metrics such as F1 score and accuracy show that the proposed framework outperforms the state-of-the-art algorithms. Hence, it can be used in DNA classification applications.
Keywords: Deep learning; BLSTM; DWT; FCGR; DNA; taxonomic classification
Deoxyribonucleic Acid (DNA) is the most important chemical compound in living cells, bacteria, and some viruses [1]. It is composed of a long sequence of nucleotides that is long, but finite with four characters {A, C, T, G}, only. The DNA classification increases the understanding of the relationships between different species, and helps to explain how these relationships evolved over the years. It also improves the understanding of how the whole life system kingdom works [2]. When sequencing a new genome, its function and structure are among the most critical questions. Each new DNA sequence is compared to those in well-known databases via a similarity function [3]. Therefore, genome function and structure can either be inferred from the highest similarity values with well-known sequences, or they can be classified into known sequence groups by using machine learning or DL techniques [4,5]. Recently, several architectures have been developed based on DL for DNA sequence classification [6,7].
The DNA sequences are considered as textual data. Hence, sequence classification depends on analyzing this textual data. Consequently, Recurrent Neural Networks (RNNs) are suitable candidates to tackle this issue [8]. The RNNs are usually selected to represent sequential and contextual information through the patterns as in speech recognition, natural language processing, and sentiment analysis [8,9]. The primary purpose of RNNs is learning the long-term dependency, but in practice, it is challenging to keep information for a long time. The simplified version of an RNN, as shown in Fig. 1, has an internal status ht, which is a summary of the sequence seen before at (t − 1), and is used in conjunction with the new input xt as follows:
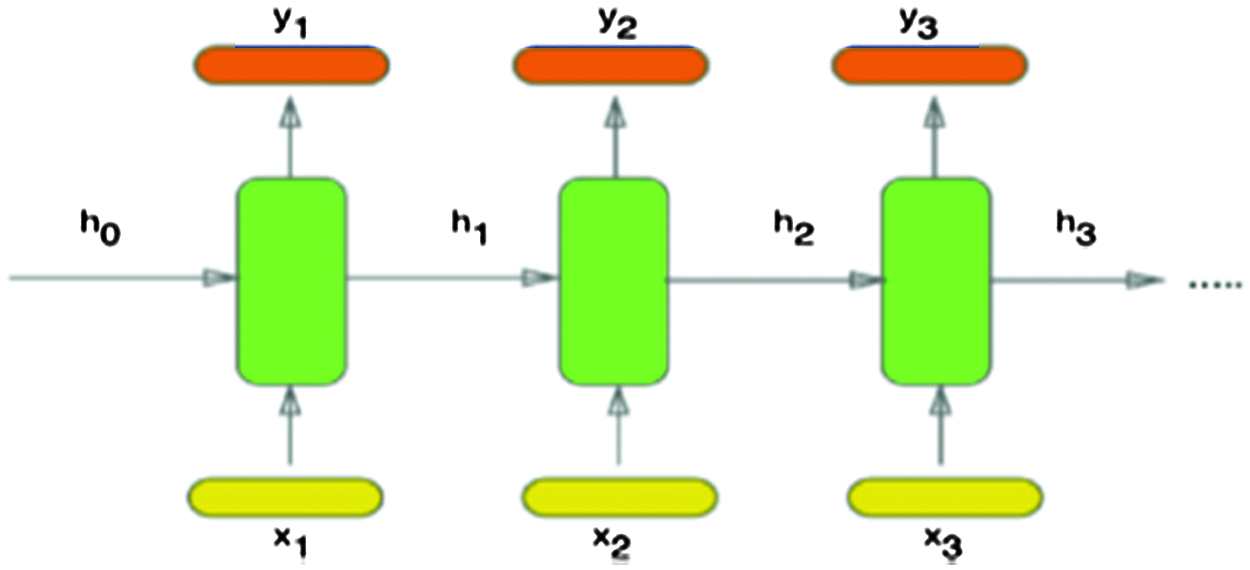
Figure 1: Architecture of an RNN [12]
where
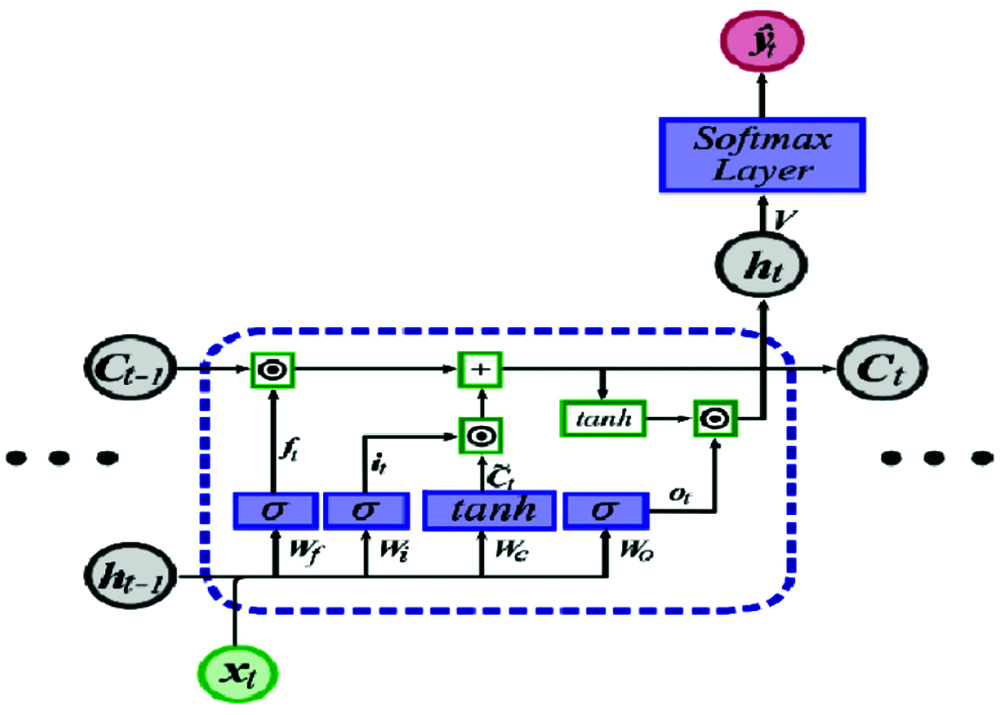
Figure 2: LSTM unit [12]
The output for the current unit is calculated as follows:
where xt is the input, ht−1 is the previous cell output, ct−1 is the previous cell memory, ht is the current cell output, ct is the current cell memory,
The above equations can be simply written in the form of Eq. (9).
The BLSTM allows learning from a long-range context in both paths. This means that the BLSTM is used for learning from the past and future contextual information in two paths with two sub-layers for the current label. These layers capture information from forward and backward hidden sequences
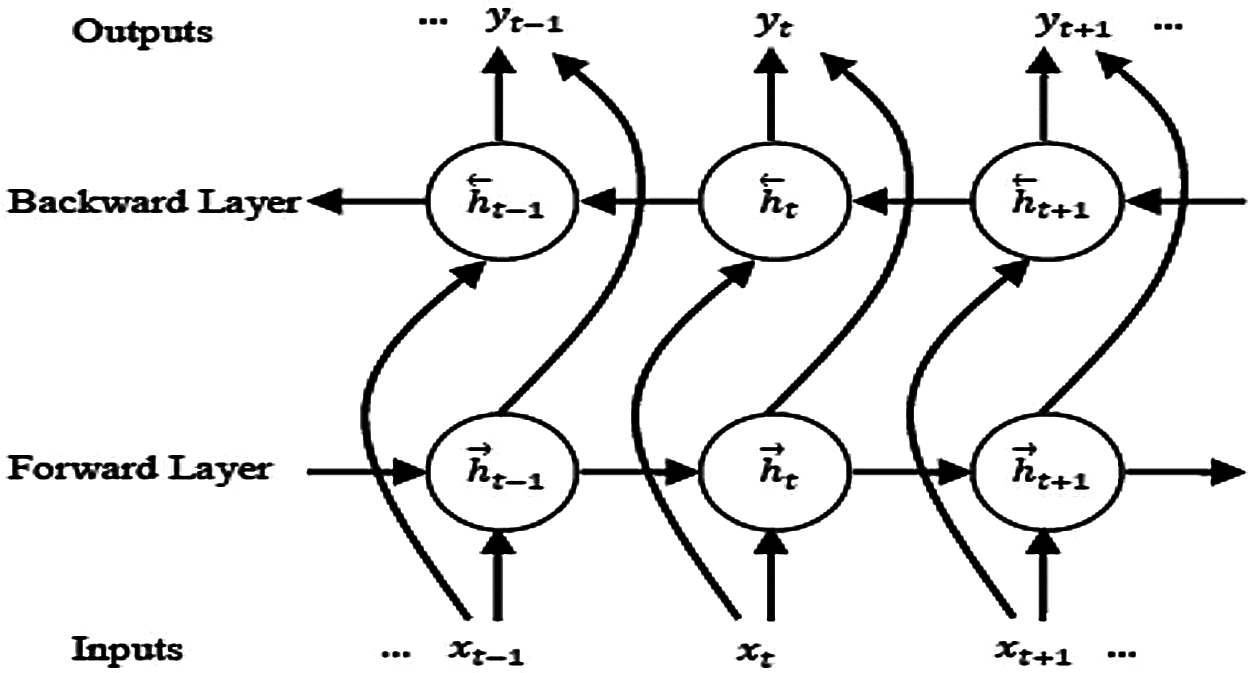
Figure 3: Architecture of a BLSTM model
A more detailed discussion about the bidirectional concept and its relevant subjects is given in [11].
The DNA sequences obtained for bacteria need to be in a format that is valid for classification. This means that they need to be pre-processed into vectors using methods to understand them. Meanwhile, data imbalance leads to the frequent overfitting of classifiers. The inappropriate data pre-processing can directly lead to a numeric bias and signal loss. We shall try to use a BLSTM network as the choice for DL. Besides, we shall select the best way for pre-processing of sequences. We may use different sequence pre-processing tools, such as one-hot coding and FCGR followed by DWT, to enhance the accuracy and facilitate the training process of DL architectures. Experiments reveal that the choice of suitable pre-processing stages with the BLSTM classifier has a significant impact on the accuracy. The DWT is able to reduce the size of high-dimensional data and add more details. Hence, the visual representation approaches have been used to reduce the amount of data without compromising the integrity of the actual reads, and therefore the accurate prediction is guaranteed. Besides, FCGR is a suitable numerical representation for DNA sequence classification.
Moreover, the experiments showed that the BLSTM with FCGR followed by DWT can achieve higher accuracy than those of the state-of-the-art methods [4,9,12]. The main objective of this work is to present BLSTM-based methods for classifying DNA sequences and to study the impact of different data pre-processing methods on the final accuracy of classification. This objective may be expressed in terms of few targets:
a) Ensuring that FCGR methods (image representation) can generate more details of DNA sequences not revealed in the text representation as in hot-coding.
b) Introducing a long-term relationship of DNA sequences through BLSTM architectures that depend on the past and future contextual information in two directions with two sub-layers for the current label.
c) Investigating the effect of DWT on the accuracy of the created models.
The rest of this paper is organised as follows. Sections 2, 3, and 4 present the related work, the common stages of data pre-processing over the training dataset, and details of the dataset used. Section 5 offers the experimental design. In Section 6, we present the results and discussions. Finally, the concluding remarks and future work are provided in Section 7.
Rizzo et al. [11] presented a DNA sequence classification technique depending on CNNs with spectral representation of DNA sequences. Each DNA sequence is initially analysed using a k-mers sliding window of some length that shifts one character to the right each iteration. This process generates sequence substrings, which are called k-mers, which means subsequences of size k. This method does not consider the position of k-mers in the original sequence. The results revealed that the CNN approach based on spectral representation provides very similar good results between 95% and 99% for all taxonomic levels. Giosue Lo Bosco and Mattia Antonino Di Gangi [9] proposed an LSTM model and a CNN model based on character-level one-hot coding for bacterial classification. The sequences are encoded by one-hot coding followed by word embedding to obtain a continuous vector representation of each subsequence. The main feature of this method is the consideration of the positions of k-mers in the original sequence, which is the main difference between this model and the previous one in [11]. After that, a subsampling method based on max-pooling is used to embed the original high-dimensional data into a low-dimensional space. Finally, the CNN model or LSTM model is selected for the classification stage. In the LSTM model, the classification is implemented without delivering a priori information. The analysis shows the dominance of CNNs in the four simplest classification tasks, although the efficiency degrades poorly for the last one, where the LSTM performs better.
Moreover, Rizzo et al. [4] suggested a novel algorithm that depends on CNNs with FCGR. The FCGR is utilized to convert the original DNA sequence to an image before feeding it to the CNN model. This method is considered as an expansion of k-mers spectral representation, and it was reported to be efficient. Several research works have been devoted to the utilization of BLSTM with bioinformatics. In [12], the authors employed the BLSTM and the CNN to capture long-term dependencies between sequence motifs in DNA. This combination is called DeepSite. In addition, the BLSTM is used in several applications, where the authors in [13] presented WaveNets that are autoregressive and that combine causal filters with dilated convolutions to allow their receptive fields to grow the pipeline of word segmentation and character recognition stages.
The character-based description of the DNA sequences is readable and understandable for humans [14], but it is an issue for machines, particularly in numeric machine learning. There are several stages of data pre-processing such as mapping, data reduction, and data transformation. They do not require a conventional order, but the only condition is at the establishment using the raw dataset and at the end using the prepared training and testing set. Data reduction for mining of high-dimensional data, as in the case of genomics, may be computationally expensive. When dealing with this type of data, it is vital to find ways to create a more compact data representation than the raw data to enhance the model performance. Data reduction techniques are used to condense the data without compromising the actual reads integrity. However, several approaches provide data pre-processing to tackle the problem of high-dimensional data. In this paper, two data pre-processing approaches are applied: numerical representation of DNA sequences and data reduction, where DNA sequences are encoded, and then data reduction is applied.
3.1 Numerical Representation of DNA Sequences
Choosing one of the numerical representation techniques to be used in association with ML depends on the application. In genomic classification, k-mers representation methods such as one hot coding and FCGR are usually used for encoding DNA sequences, and they are reported to be efficient. These methods split each DNA sequence into several subsequences. The length of each subsequence equals k. The one-hot coding is based on the text representations intended to maintain each character position in the DNA sequence. In this method, the DNA nucleotides are mapped as binary vectors with A = (1 0 0 0), G = (0 1 0 0), C = (0 0 1 0), and T = (0 0 0 1). This coding was used for DNA classification to obtain high classification rates with RNNs. With FCGR method, a matrix containing the frequency of the k-mers obtained from the DNA sequences can be generated [4]. The FCGR changes patterns into pictures to be highlighted. This method mainly divides the CGR square into sub-squares of side 2−k to yield the number of different k-mers. The CGR localizes the nucleotides of DNA sequences to the unit square. Each nucleotide is located at the edges, and it has the following axes:
To construct the CGR matrix, let a sequence M consist of N nucleotides, M={M1, M2, ..…,MN}. The first point X0 is typically located at the centre of the square. Then, the next point Xn+1 is repeatedly located halfway between the previous mapped point Xn and the segment joining the vertex corresponding to the read letter Mn+1. Coordinates of successive points are provided by:
This mapping is considered numerical and graphical mapping. The representation techniques may change from method to method, but we can expect to find that the image representation techniques may generate much more information than the text representation. In the previous work of the authors of [15], FCGR was used for data representation with k-mers = 6, and it was reported to be efficient. The details of FCGR are explained in [15].
It has been found that the data sequence varies with time in most cases, but in few instances, data may differ with space position points. The difference in the location of nucleotide bases can be treated as a signal in time series. Currently, Digital Signal Processing (DSP) plays an essential role in this field. However, the problem of organising and visualising these large datasets is still a serious issue. There is a growing interest in the utilization of wavelet transform to analyse biological sequences and molecular biology-related signals. In [16], discrete transforms such as Discrete Fourier Transform (DFT) and DWT have been widely used to predict protein-coding regions and analyze DNA sequences. The authors of [16] described a feature selection method based on wavelet analysis and a genetic algorithm. The DWT is the most common algorithm applied to compress and extract features in DSP [17]. The reason for applying DWT emerges from its broad and practical use for feature extraction, decorrelation, ordering, and dimensionality reduction purposes in the fields of speech and image processing.
Wavelet transform is still an effective tool for analyzing and processing of signals, especially for the case of non-stationary signals such as bio-signals [16,17]. It plays an important role in solving the problems of time and frequency resolutions. Wavelet processing can be often used to compress or de-noise a signal without an appreciable degradation. The sequence is analyzed at different frequency bands with different resolutions by decomposing the signal into a coarse approximation and a detail information using low-pass and high-pass filters. As shown in Fig. 4, the discrete signal X of length M is first passed through a high-pass filter
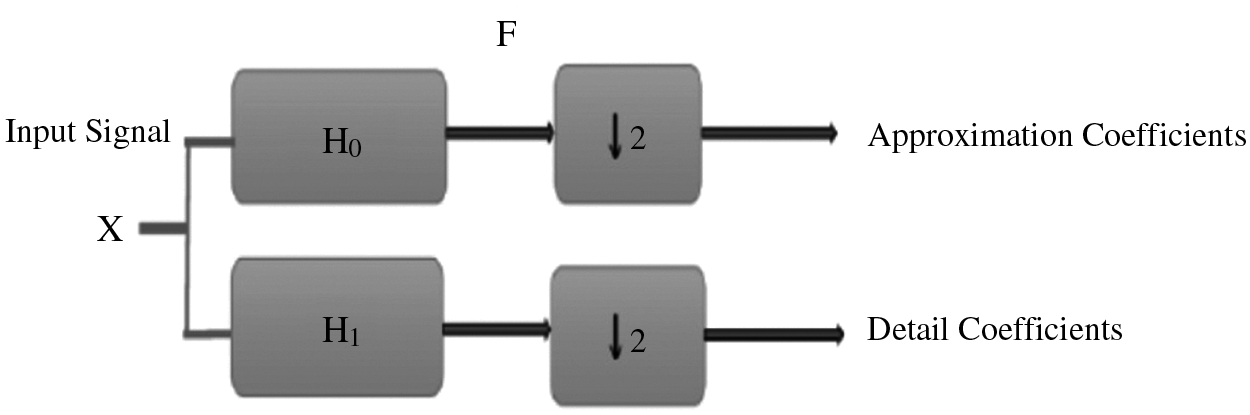
Figure 4: Structure of sub-band coding
The 1-D wavelet transform can be extended to a two-dimensional (2-D) wavelet transform. In the 2-D transform, we apply a 1-D transform on all input signal columns, and then repeat it on all rows. In 2D-DWT, the image X at level j is decomposed into four components: an approximation at level j + 1 and details in three orientations (horizontal, vertical, and diagonal) as shown in Fig. 5.
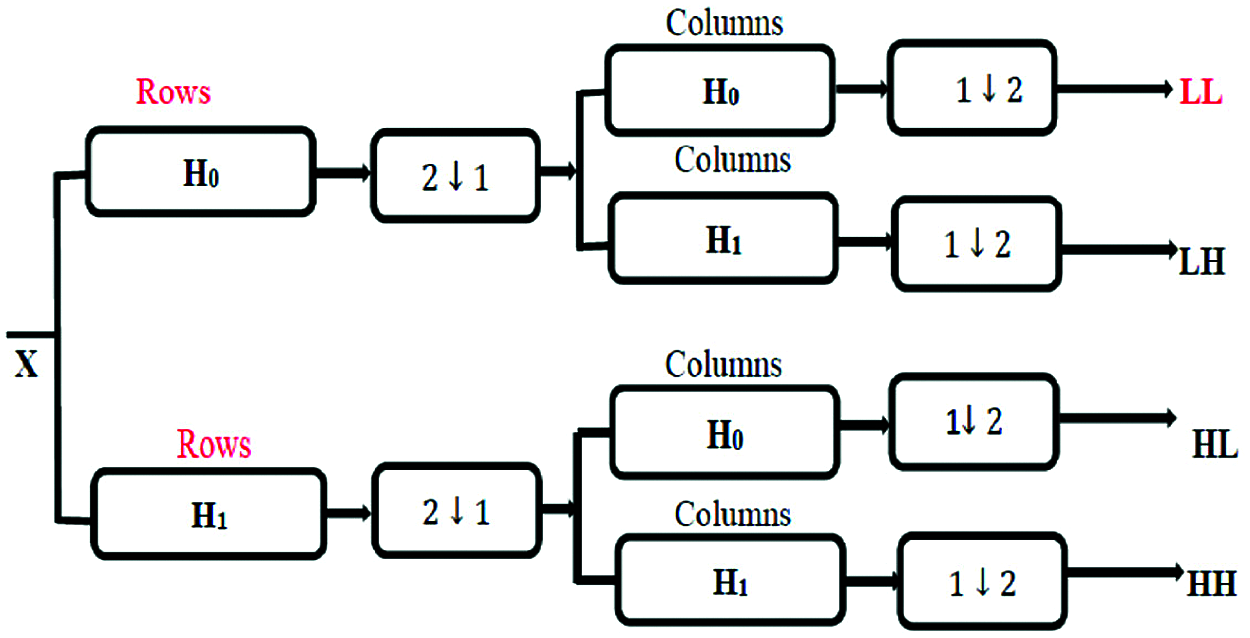
Figure 5: 2D-DWT bands
where X is the input image, LL represents the approximation coefficients, LH represents the horizontal details, HL represents the vertical details, and HH represents the diagonal details. The proposed DWT reduces the dimensions of features by performing the single-level 2-D wavelet decomposition. The decomposition is performed to extract the approximation coefficients (LL). Fig. 6 displays a visual example of the proposed DWT layer.
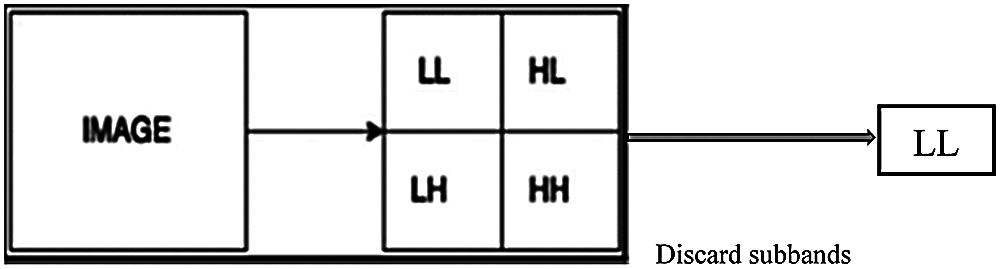
Figure 6: The proposed DWT layer
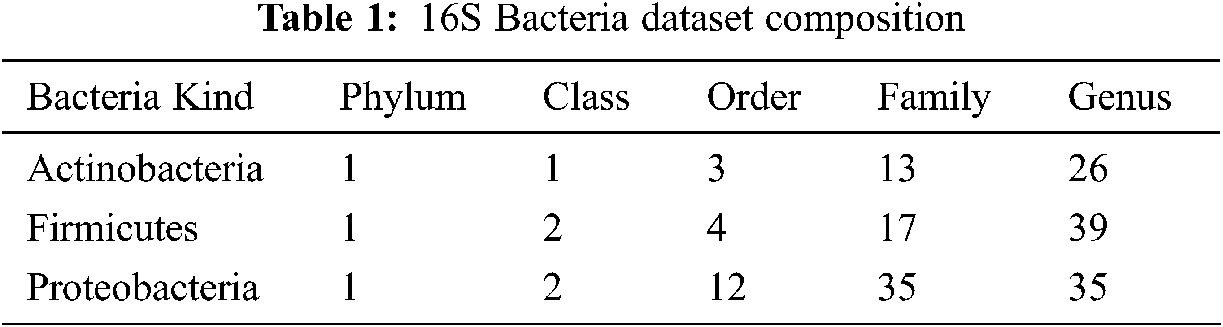
Data is obtained from the Ribosomal Database Project (RDP) [18] Release 11. The RDP repository contains aligned and marked bacterial sequences, archaea, and fungi and tools to analyse these sequences further. The bacterial genome contains a record for smaller sub-units of ribosomes RNA (16 s RNA), and it is helpful as a general genetic marker. It is often used to determine bacterial diversity, perform identification, and estimate genetic similarity, and it is the basis for molecular taxonomy [18]. Two different sequences are used for comparison: full-length sequences with a length of approximately 1200–1500 nucleotides, and 500 bp DNA sequence fragments. A total of 2000 sequences have been chosen from the three most popular phyla of bacteria from phylum to genus (see Tab. 1).
The proposed framework is composed of two major processes: DNA sequence pre-processing and the BLSTM classifier. Fig. 7 shows the structure of the proposed framework to classify bacterial DNA sequences into taxonomic levels. The BLSTM is implemented by using MATLAB 2018a. The pre-processing stage consists of conversion of the DNA sequence into a two-dimensional numerical matrix followed by a data reduction layer. Firstly, the DNA sequence dataset that contains a finite number of characters is converted into a two-dimensional numerical matrix to be appropriate for processing with DWT. Such matrix comprises information about the specific position of each nucleotide in the sequence. This conversion is performed by two approaches as follows:
• First approach. We segment the original DNA sequence to a number of subsequences using a tool called nmercount containing {’A’, ‘C’, ‘G’, ‘T’, ‘-’} characters, nmers = 4. This is followed by applying one-hot coding on all subsequences. Finally, we use the DWT.
• Second approach. We segment the original format of the DNA sequence to a number of subsequences with kmers = 6 followed by constructing CGR as explained, previously. Finally, we apply the DWT. The encoded data is divided into two subsets: the training set including 70% of the original data and the testing set including the other 30% of the data. Two experiments were performed after preparing the different data subsets as follows:
Experiment 1: We feed the encoded DNA sequences obtained with the first approach to the BLSTM model. This encoding process provides a dataset that is similar in complexity to that used in the text classification problem. Fig. 8 shows an example of transforming a DNA sequence by the first approach.
• Experiment 2: We feed the encoded DNA sequences obtained with the second approach to the BLSTM. This encoding process is conducted to achieve high accuracy and speed up the next classification step. Figs. 9 and 10 show examples of pre-processing by FCGR, and then single-level 2-D wavelet implementation is implemented.
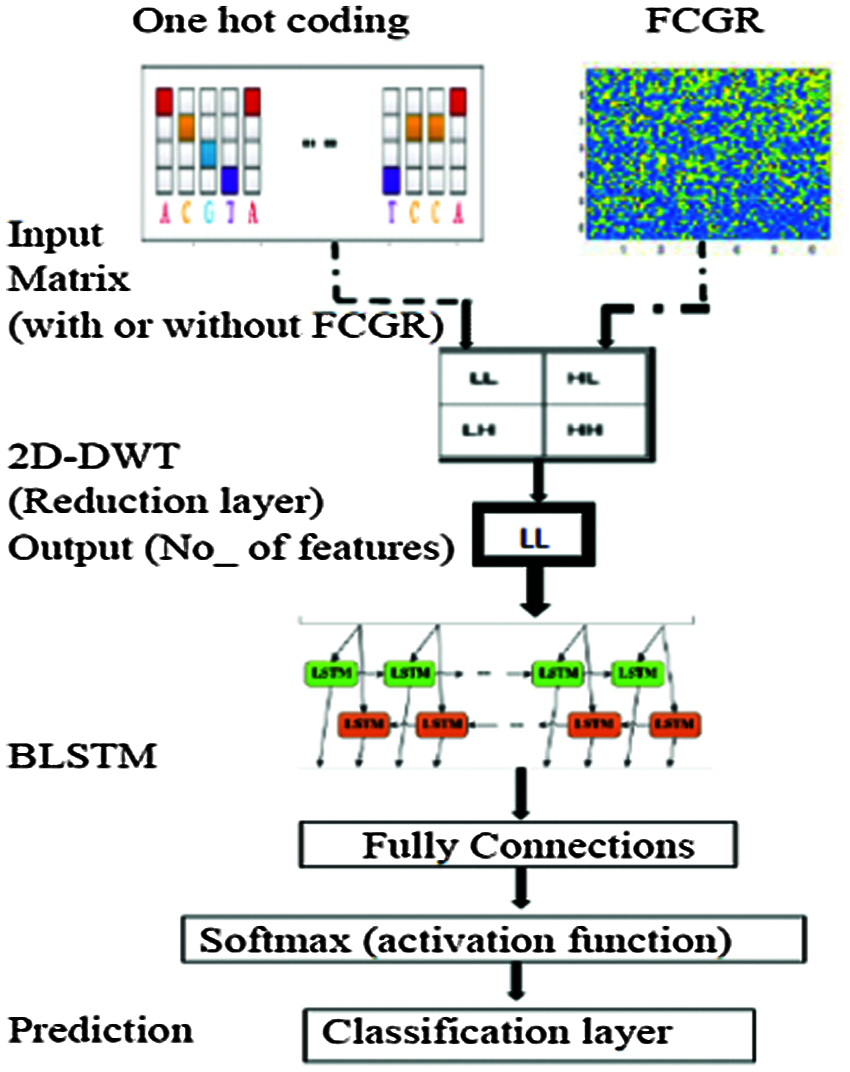
Figure 7: Structure of the proposed BLSTM model
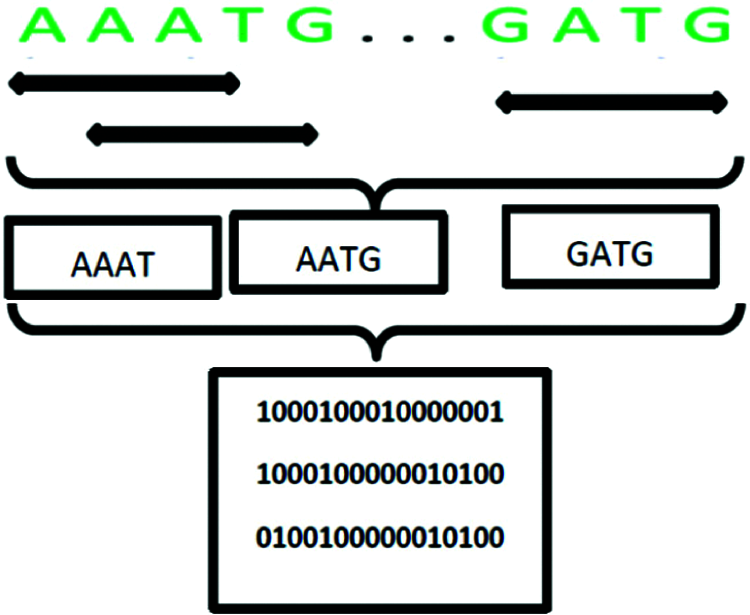
Figure 8: Example of transforming a DNA sequence with the first approach
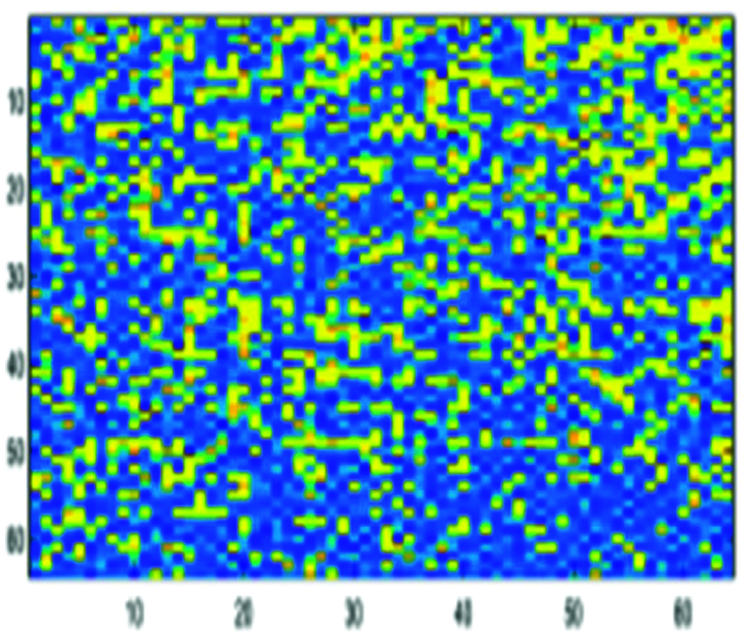
Figure 9: Encoded DNA sample by the FCGR method
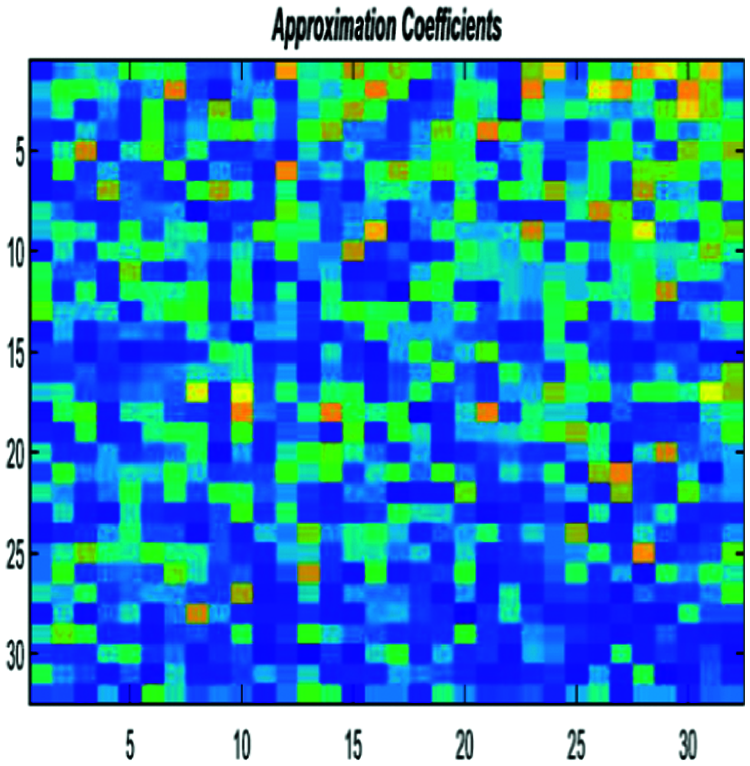
Figure 10: Encoded DNA sample by the FCGR method after DWT
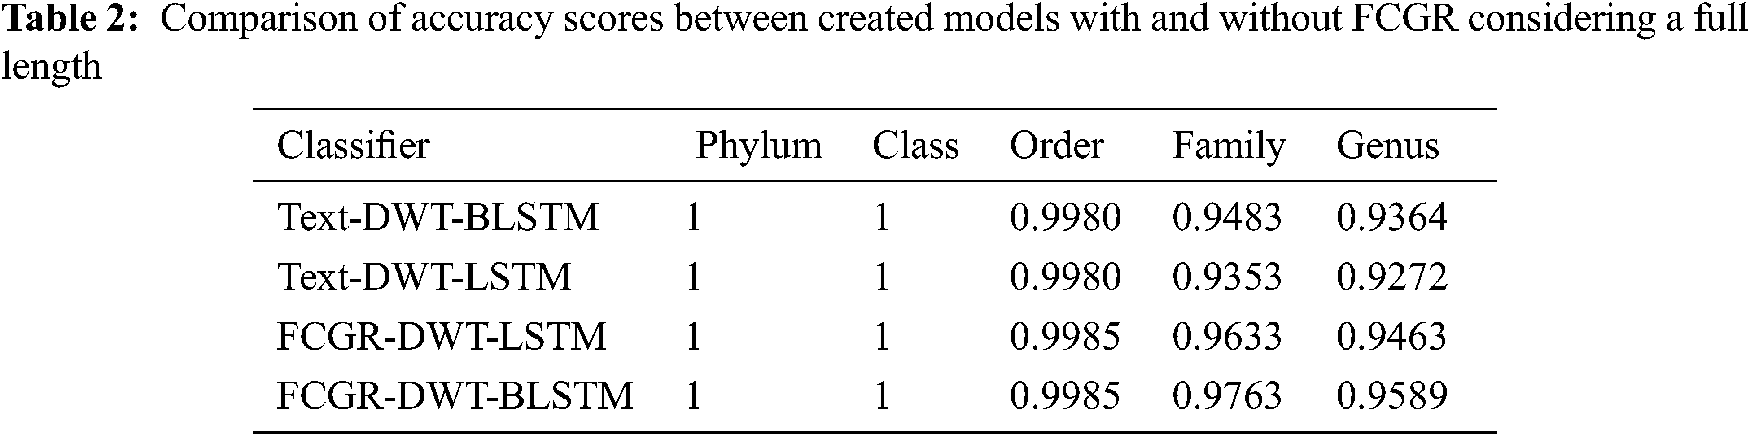
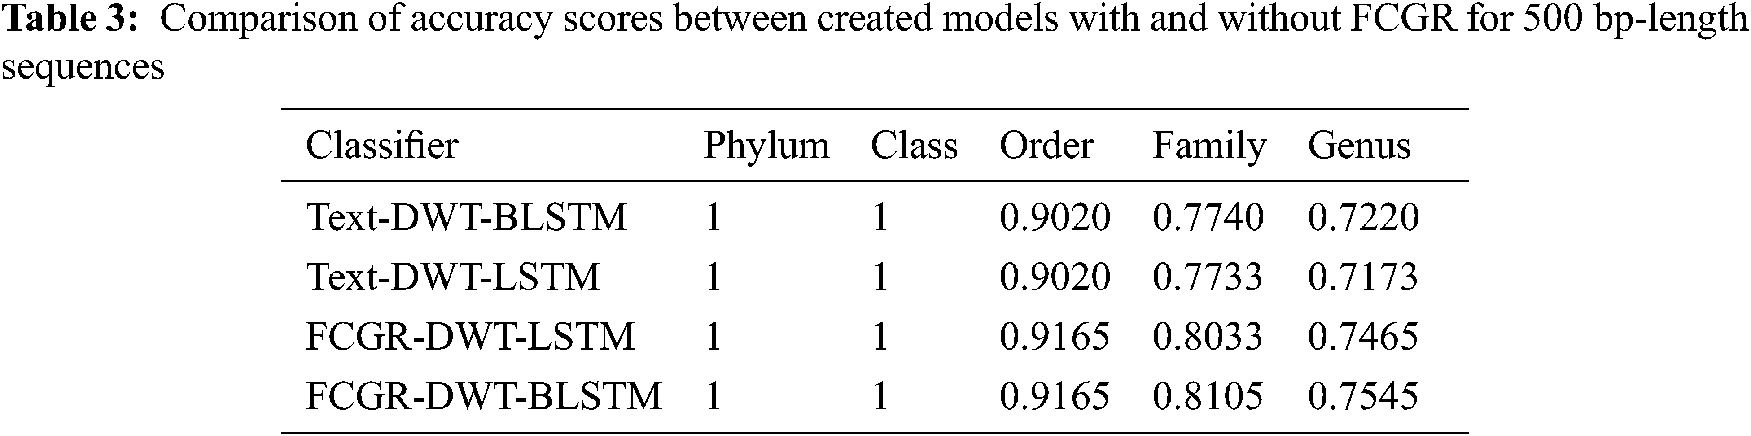
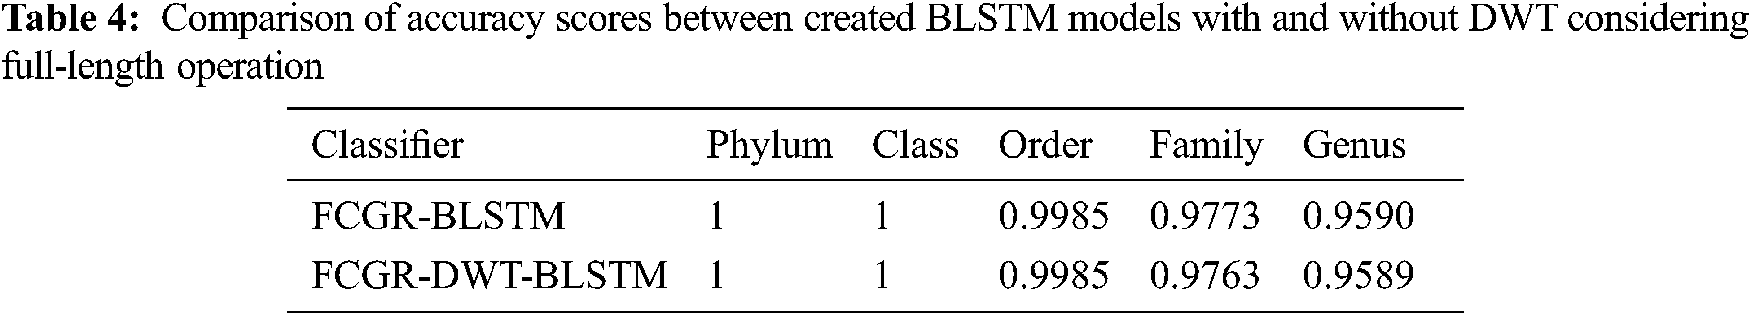
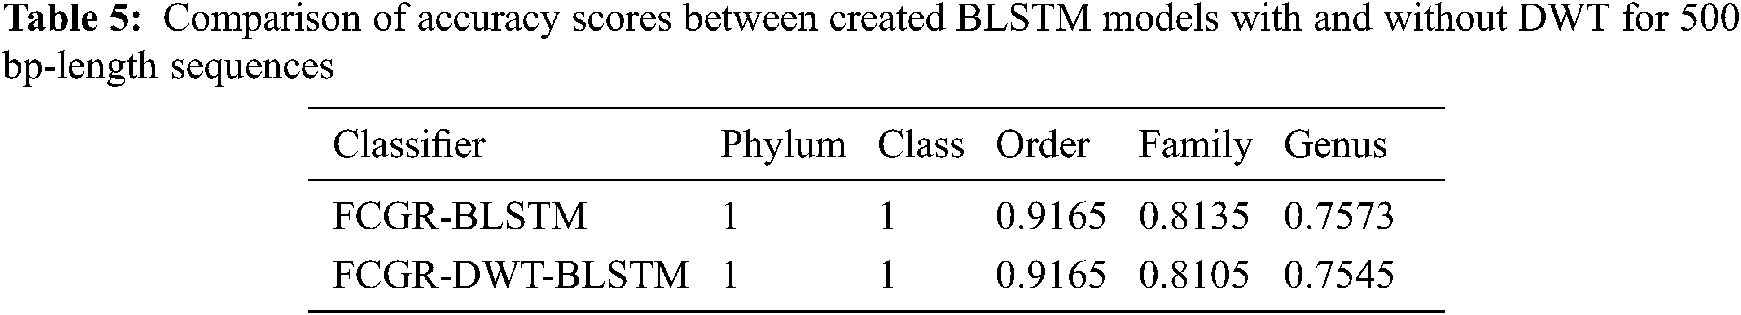
The accuracy levels of different models based on LSTM and BLSTM with different data pre-processing techniques are presented for comparison. The first treatment depends on processing of the dataset as text using DWT in the so-called Text-DWT-BLSTM and Text-DWT-LSTM. The second treatment depends on dataset processing with FCGR in the so-called FCGR-DWT-BLSTM and FCGR-DWT-LSTM. Firstly, a comparison between the two traetments considering the full-length DNA sequence and 500 bp-length sequences is introduced. The classification performance is presented in Tabs. 2 and 3. From these tables, it is clear that the FCGR-DWT-BLSTM outperforms the other models, especially at the family and genus level. Moreover, this model needs less running time. Besides, Figs. 11a and 11b illustrates a comparison between models based on F1 score. Therefore, the FCGR followed by the DWT is preferred as a pre-processing method. In addition, a comparison of the proposed FCGR-DWT-BLSTM and FCGR-BLSTM without using DWT is presented in Tabs. 4,5. It can be seen clearly that the FCGR-BLSTM gives slightly better accuracy than that of the FCGR-DWT-BLSTM. Besides, the FCGR- BLSTM has a longer processing time than the FCGR-DWT-BLSTM by about 56 mins.
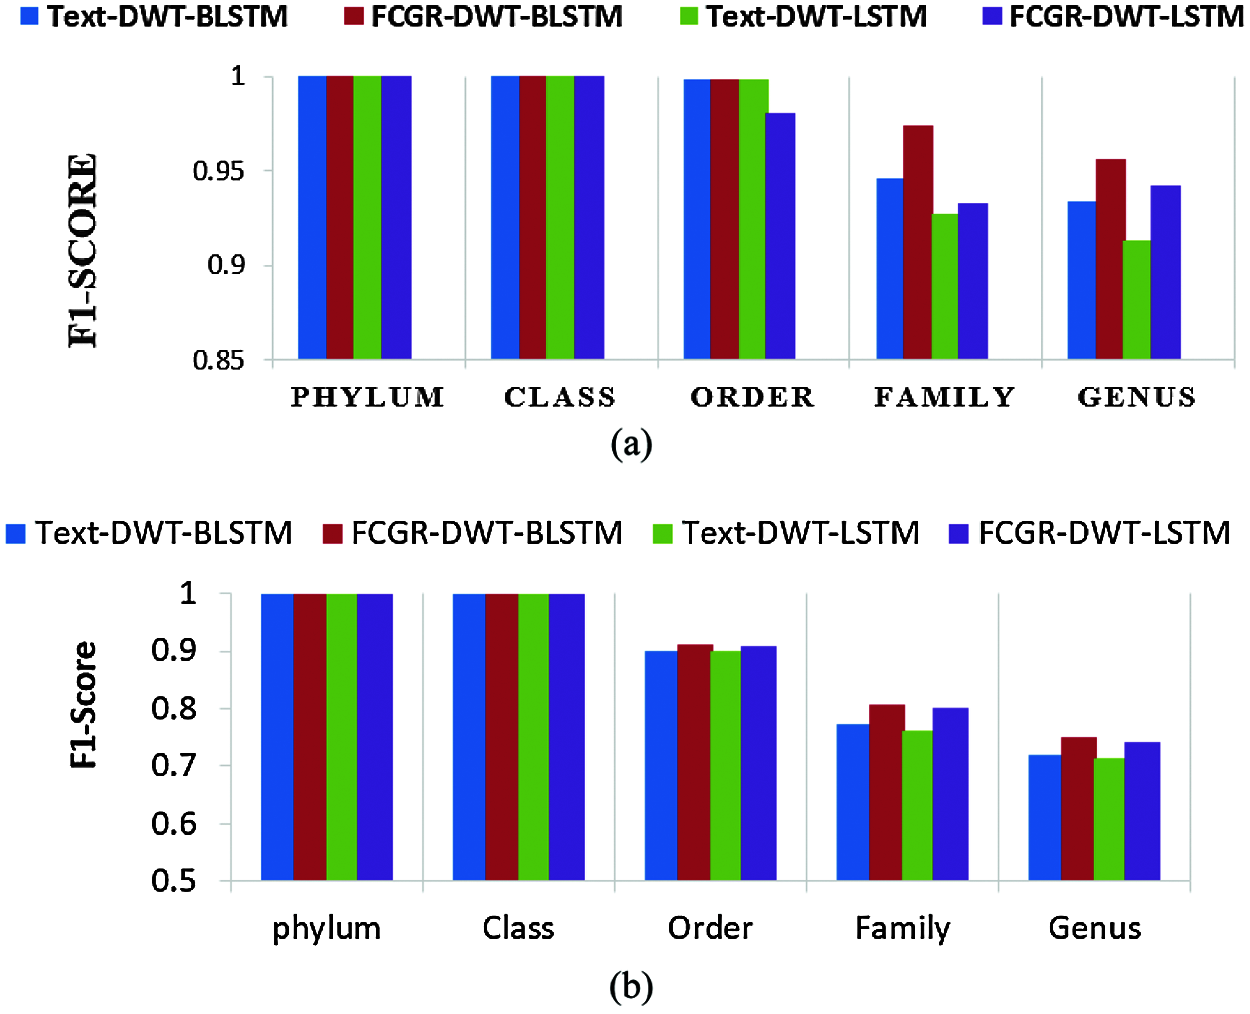
Figure 11: Comparison of F1 scores between the created models; (a) Full length, (b) 500 bp-length sequences
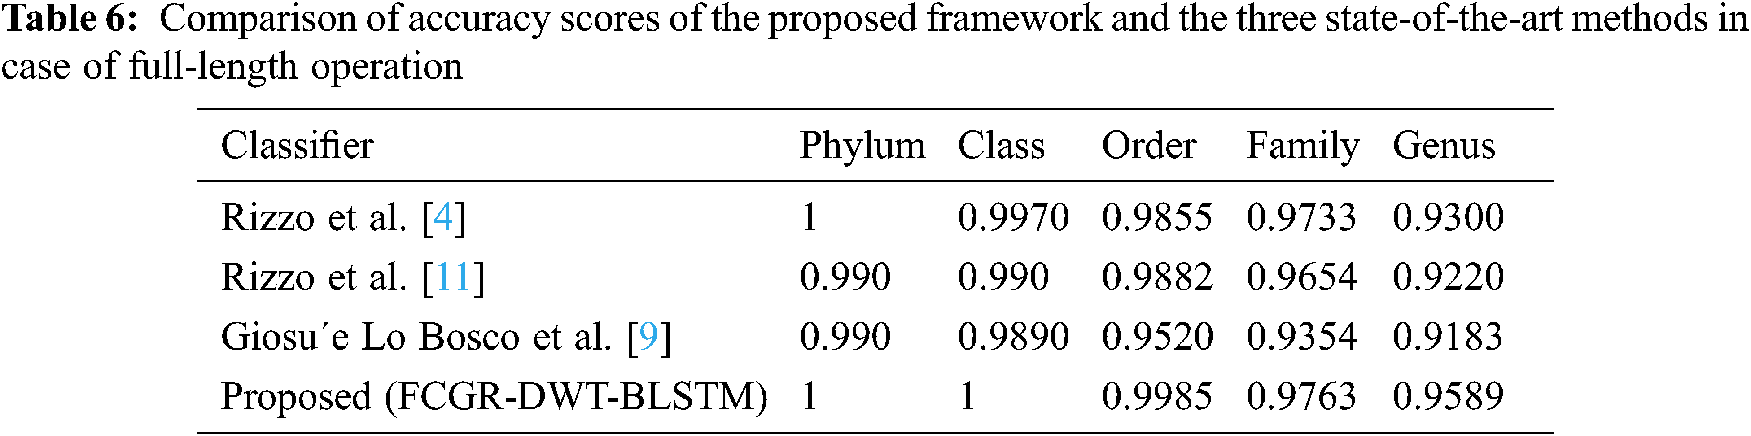
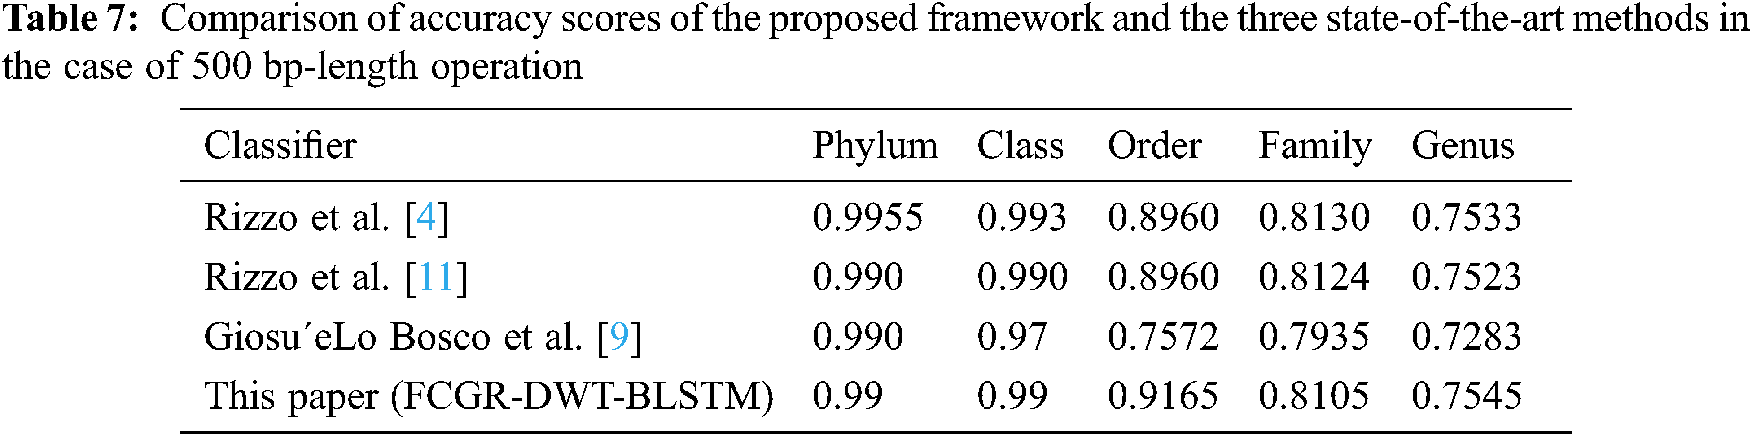
A comparison is presented between the proposed FCGR-DWT-BLSTM and three state-of-the-art methods based on DL for Rizzo et al. [4,11] and Giosue Lo Bosco and Mattia Antonino Di Gangi [9]. The input data fed to the models has the same length in the training and testing phases. The simulation results are given in Tabs. 6 and 7, and Fig. 12a,b. Tabs. 6 and 7 illustrate that the highest accuracy for the proposed FCGR-DWT-BLSTM. Rizzo et al. model [4] and the proposed model give the highest values at the genus level. Compared to Rizzo et al. model [4], the proposed model gives a slightly better accuracy from 75.33% to 75.45%. The proposed model has a longer processing time than that of Rizzo et al. [4] by about 37 mins on average. This paper confirms that FCGR followed by the DWT is suitable to be applied for numerical representation in DNA classification applications. In this paper, SGD with Momentum (SGDM) is the selected optimizer, and it was implemented in all models.
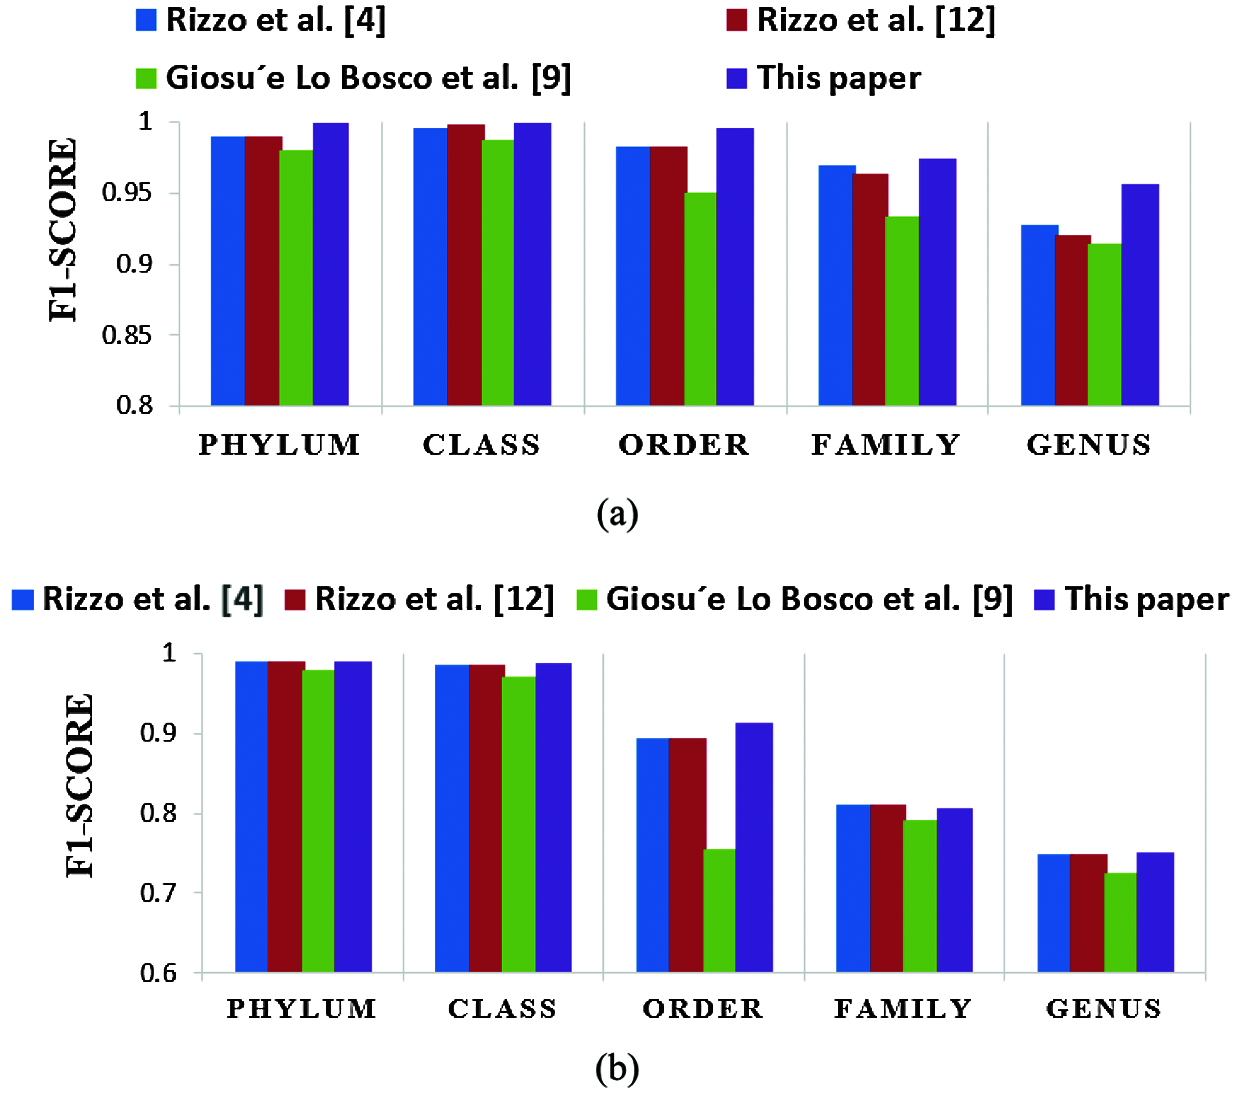
Figure 12: Comparison of F1 scores of the proposed framework and the three state-of-the-art methods in case of (a) Full-length operation, and (b) 500 bp-length operation
This paper has introduced an approach for solving the bacterial sequence multi-classification problem based on the BLSTM. Two data structure representation methods for the pre-processing phase have been utilized: one-hot coding and FCGR. Both are followed by DWT for data reduction. The experimental results proved that selecting the appropriate data pre-processing method is an essential key in classification tasks based on the BLSTM. According to the obtained results, the accuracy of the proposed FCGR- DWT-BLSTM reaches 95.89%, and 75.45% for full-length and 500 bp-length sequences at genus level. Despite these accuracy levels, it has less running time compared with other models. Finally, the proposed DWT-BLSTM has been copmared to three state-of-the-art methods based on DL. The system evaluation revealed superiority of the DWT-BLSTM implementation over other methods. This study confirms that FCGR with k-mers = 6 followed by DWT is suitable for effective mapping of DNA sequences with the proposed BLSTM to achieve the best performance. We will try to use the proposed models in the classification of COVID-19 images in order to reach the best trade-off between high accuracy and low execution time. Future research directions may include more accurate pre-processing of DNA signals using multi-dimensional DSP-based features.
Acknowledgement: The authors would like to thank the support of the Deanship of Scientific Research at Princess Nourah bint Abdulrahman University.
Funding Statement: This research was funded by the Deanship of Scientific Research at Princess Nourah Bint Abdulrahman University through the Fast-track Research Funding Program.
Conflicts of Interest: The authors declare that they have no conflicts of interest to report regarding the present study.
1. B. Alberts, “Molecular Biology of the Cell,” 4th ed, New York, USA: Garland Science, 2002. [Google Scholar]
2. M. Goodman, C. A. Porter, J. Czelusniak, S. L. Page, H. Schneider et al., “Toward a phylogenetic classification of primates based on DNA evidence complemented by fossil evidence,” Molecular Phylogenetics and Evolution, vol. 7, no. 3, pp. 585–598, 1998. [Google Scholar]
3. A. Zielezinski, S. Vinga, J. Almeida and W. Karlowski, “Alignment-free sequence comparison: Benefits, applications, and tools,” Genome Biology, vol. 18, no. 1, pp. 186–201, 2017. [Google Scholar]
4. R. Rizzo, A. Fiannaca, M. Rosa and A. Urso, “Classification experiments of DNA sequences by using a deep neural network and chaos game representation,” in Proc. Int. Conf. on Computer Systems and Technologies-CompSysTech, Palermo, Italy, pp. 222–228, 2016. [Google Scholar]
5. G. Acetoab, D. Ciuonzoa, A. Montieria and A. Pescapè “MIMETIC: Mobile encrypted traffic classification using multimodal deep learning,” Computer Networks, vol. 165, pp. 106–144, 2019. [Google Scholar]
6. Z. Zhou, L. Liu, S. Jere, J. Zhang and Y. Yang, “RCNet: Incorporating structural information into deep RNN for MIMO-oFDM symbol detection with limited training,” arXiv preprint arXiv:2003.06923, 2020. [Google Scholar]
7. F. Xie, P. Xiao, D. Chen, L. Xu and B. Zhang “miRDeepFinder: A miRNA analysis tool for deep sequencing of plant small RNAs,” Plant Molecular Biology, vol. 80, no. 1, pp. 75–84, 2012. [Google Scholar]
8. Y. Ma and C. Principe, “A taxonomy for neural memory networks,” IEEE Transactions on Neural Networks and Learning Systems, vol. 31, no. 6, pp. 1–17, 2020. [Google Scholar]
9. G. Bosco and M. Gangi, “Deep learning architectures for DNA sequence classification,” in Proc. 11th Int. Workshop Fuzzy Logic and Soft Computing Applications, Naples, Italy, pp. 162–171, 2017. [Google Scholar]
10. C. Xiong, S. Merity and R. Socher, “Dynamic memory networks for visual and textual question answering,” in Proc. Int. Conf. on Machine Learning, Palermo, Italy, pp. 2397–2406, 2016. [Google Scholar]
11. R. Rizzo, A. Fiannaca, L. Rosa and M. Urso, “A deep learning approach to DNA sequence classification,” in Proc. Int. Meeting on Computational Intelligence Methods for Bioinformatics and Biostatistics (CIBB LNCS), Shenzen, China, Springer, Heidelberg, vol. 98, pp. 129–140, 2016. [Google Scholar]
12. Y. Zhang, S. Qiao, S. Ji and Y. Li “Deepsite: bidirectional LSTM and CNN models for predicting DNA–protein binding,” in Int. Journal of Machine Learning and Cybernetics, Cairo, Egypt, Springer, vol. 11, pp. 841–851, 2019. [Google Scholar]
13. V. Aaron, O. Sander, D. Heiga, K. Simonyan, O. Vinyals et al., “Wavenet: A generative model for raw audio,” arXiv:1609.03499, 2016. [Google Scholar]
14. N. Yu, X. Guo, F. Gu and Y. Pan, “Signaling: An ontology of DNA as signal for comparative gene structure prediction using information-coding-and-processing techniques,” IEEE Transactions on Nanobioscience, vol. 15, no. 2, pp. 119–130, 2016. [Google Scholar]
15. M. Samia, N. F. Soliman, S. Eldin, N. A. Ismail, E. M. El-Rabaie et al., “Bacterial classification with convolutional neural networks based on different data reduction layers,” Nucleotides and Nucleic Acids, vol. 39, no. 4, pp. 493–503, 2019. [Google Scholar]
16. M. E. Maros, D. Capper, D. T. Jones, V. Hovestadt, A. Deimling et al., “Machine learning workflows to estimate class probabilities for precision cancer diagnostics on DNA methylation microarray data,” Nature Protocols, vol. 15, no. 2, pp. 479–512, 2020. [Google Scholar]
17. E. Cheever, G. Overton and D. Searls, “Fast Fourier transform-based correlation of DNA sequences using complex plane encoding,” Bioinformatics, vol. 7, no. 2, pp. 143–154, 1991. [Google Scholar]
18. Medical dataset, https://rdp.cme.msu.edu. 11 May 2020. 2020. [Google Scholar]
 | This work is licensed under a Creative Commons Attribution 4.0 International License, which permits unrestricted use, distribution, and reproduction in any medium, provided the original work is properly cited. |