DOI:10.32604/iasc.2022.022953
| Intelligent Automation & Soft Computing DOI:10.32604/iasc.2022.022953 | |
| Article |
Integration of Renewable Energy Sources into the Smart Grid Using Enhanced SCA
School of Electrical Engineering-SELECT, Vellore Institute of Technology, VIT-Vellore, 632014, India
*Corresponding Author: K. Ravi. Email: k.ravi@vit.ac.in
Received: 24 August 2021; Accepted: 27 September 2021
Abstract: The usage of energy in everyday life is growing day by day as a result of the rapid growth in the human population. One solution is to increase electricity generation to the same extent as the human population, but this is usually practically impossible. As the population is increasing, the need for electrical usage is also increasing. Therefore, smart grids play an important role in making efficient use of existing energy sources like solar, wind and battery storage systems. By managing demand, the minimization of power consumption and its consequent costs. On the load side, residential and commercial types use a large amount of the total energy produced by renewable energy sources. As a result, in this work, we use DSM (Demand-side Management) to schedule various appliances on loads to minimize energy consumption. Smart grid plays a major role in the integration of renewable energy sources as well as in the minimization of cost of energy (COE). Smart meters like advanced metering infrastructure are also used to reduce load demand. Therefore, in this work, an Enhanced sine cosine algorithm (ESCA) is proposed to solve the optimization problem. The proposed method consists of loads like residential and commercial types. The proposed method considered the comparison with the Genetic Algorithm (GA) and Ant colony optimization (ACO). Simulation results were carried out by using MATLAB software. The results show the Enhanced sine cosine algorithm (ESCA) is best when compared to other algorithms like GA and ACO in the minimization of the cost of energy.
Keywords: Solar energy; wind energy; battery storage system; sine cosine algorithm; cost minimization; smart grid
Renewable Energy Sources
Because of the tremendous increase in population and energy consumption, renewable energy sources such as solar PV and wind energy systems are becoming more prominent. As they provide several benefits to both people and the environment. These resources are friendly and emit less carbon dioxide than other conventional energy sources, including heavy crude, coal, oil and gas. According to the IPCC in 2007, carbon dioxide levels are anticipated to rise 40–110% in 2030. The main objective is to reduce the emissions of carbon dioxide and reduce the air impacts of these hazardous emissions. This, in turn, contributes to controlling the rise in global temperature [1,2]. As a result, the renewable energy percentage is projected to increase from 18 per cent in 2007 to 23 per cent in 2035. A hybrid energy system consists of two or more different energy sources for the production of the most efficient energy from renewable energy resources (solar and wind) [3,4].
In renewable energy sources, solar and wind are the two sources which produce efficient energy. Owing to their non-polluting aspect, they also protect the ecosystem. These sources of energy contribute to reducing worldwide greenhouse gas emissions. They often contribute to making the energy mix flexible by reducing the consumption of fossil fuels, which are confined to themselves. Furthermore, because of the availability of renewable energy sources to produce power for traditional power generation systems in remote areas, there is a greater program promoting the use of renewable energy sources. In renewable sources, solar PV has several advantages over wind energy systems, such as less maintenance, no mechanical components and very simple installation. But on the other side, wind energy is cheaper, particularly on a large scale. However, wind energy requires trained operational and maintained employees [5,6]. Fig. 1 shows the overview of the integration of renewable energy sources with smart grid and utilization of loads like residential and commercial loads, whereas the smart grid has advantages of two-way communication between the generation of power and utilization of load, using of smart appliances like smart meters.
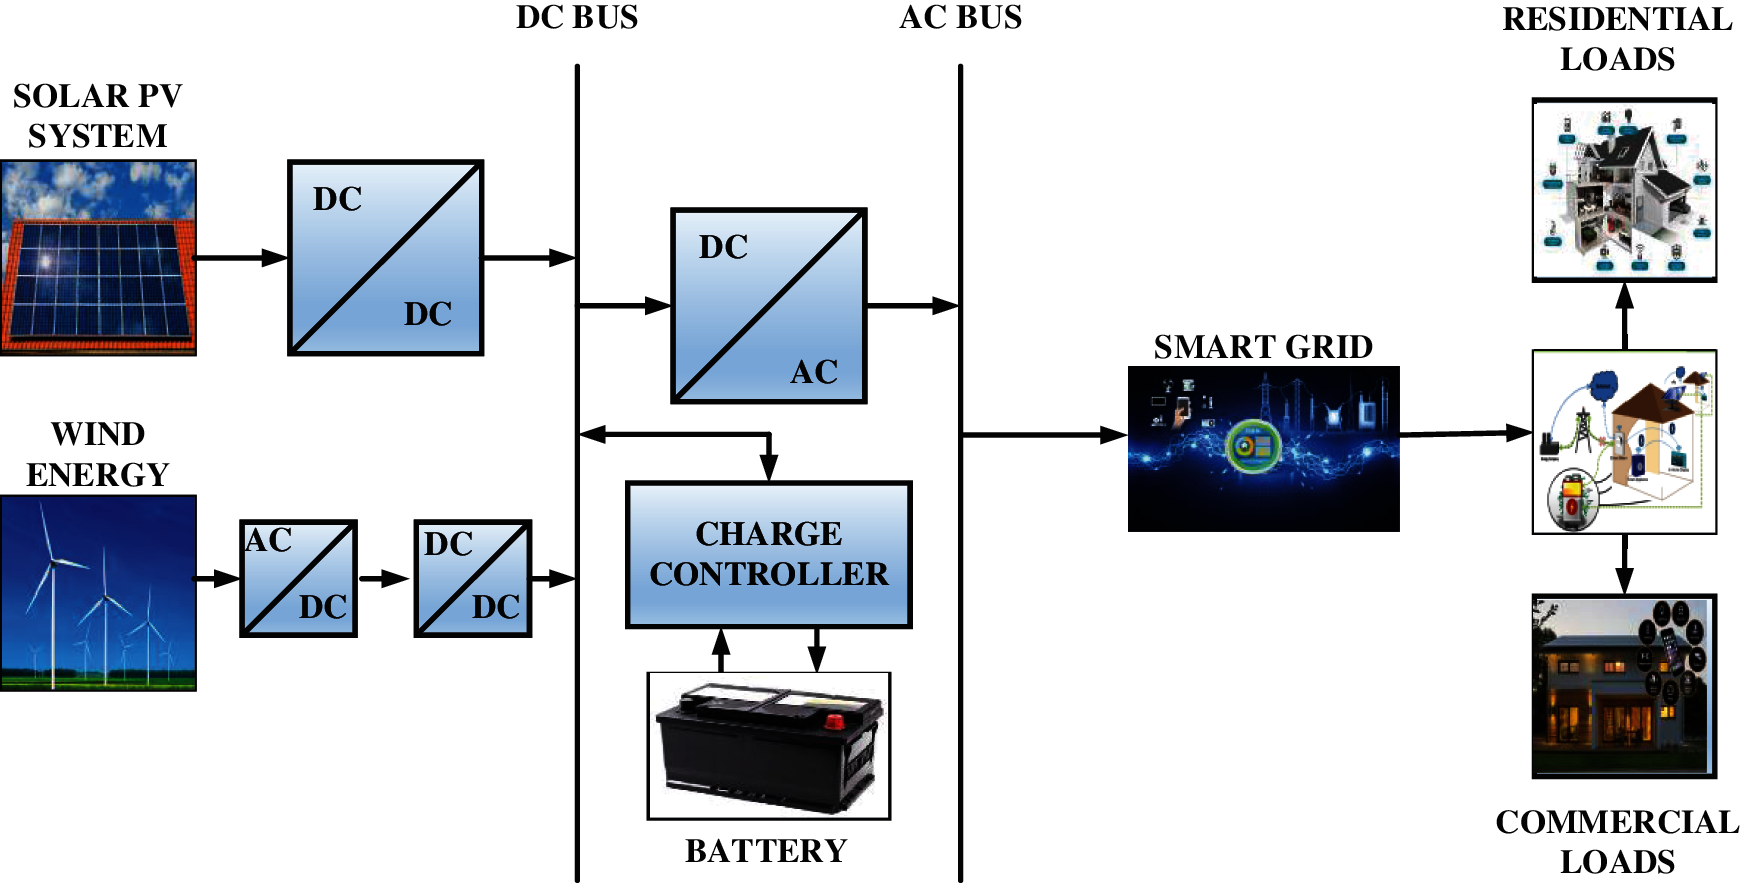
Figure 1: Block diagram of renewable energy sources with smart grid
When renewable energy resources have an intrinsic discontinuity, a backup energy system is typically used in collaboration with both solar PV and wind energy systems to maintain a continuous power supply. Two sources give backup for renewable energy sources. One is a diesel generator and the other is a battery storage system. However, diesel generators require fuel, which leads to high costs because fuel prices are higher than in the past, as well as an increase in environmental pollution. Whereas the battery storage system is more efficient than the diesel generator. The generation of power varies in solar PV and wind energy systems due to seasonal changes. Hence, the battery storage system is more beneficial than a diesel generator in terms of season changes for backup energy systems. Hybridized renewable energy sources which combine two sources of energy, such as solar PV and wind energy system setup, give better performance than the individual renewable energy source implementation in terms of consistency, precision, effectiveness and overall cost [7].
There are several benefits of batteries as a backup, such as output efficiency, high energy and extended service life. Lithium-ion is regarded to be the finest energy storage solution compared to other battery types, particularly for renewable energy.
With smart appliances and technologies, modern technology has made it possible for the safe and successful use of energy resources. It is essential to properly utilise sources of energy in the housing, commercial and manufacturing sectors by utilising smart appliances, such as smart meters, smart washing machines, smart fans, and smart refrigerators, smart lights, smart security alarms and smart air conditioners etc. Fig. 1 shows the block diagram of renewable energy sources with the smart grid which can be applicable for commercial and domestic loads. Apart from traditional electrical grids, the smart grid ensures optimal energy utilization more efficiently and cost-effectively. A smart grid is a sophisticated structure made up of several segments. Smart grid demand-side management provides an opportunity in which devices are predetermined set on time-based energy costs. It is an economic incentive that convinces consumers to shift appliances from peak to off-peak time slots. Demand-side management includes two features. One is energy management and the second is demand management or demand response. Energy management is concerned with the efficient use of energy. Demand response can be accomplished from two programs, a pricing-based program and an incentive-based program. When an incentive-based program detects a peak, the utility will wirelessly turn the condition of the recipient’s device from on to off by delivering a quick note to a load unit, an energy management controller.
As a result, the utility will significantly decrease the maximum to the appropriate amount. In the pricing base, the customer is advised to use their equipment during certain hours as off-peak hours. Consumers can reduce the cost of electricity and power consumption through an integrated connection of a smart meter with the utility. By intelligent planning of appliances, energy usage can be reduced to 10%-25%. This means that planning will be effective on the aim and energy resources. The smart grid frequently incorporates renewable energy sources to simplify and clear the operation.
2.1 Utilization of Renewable Energy for Smart Grid Scalability
In a renewable electricity ecosystem, smart grids afford significant DRES (Distributed renewable energy sources), outlet and play benefits as well as the ability to accommodate future energy requirements through interconnecting regional generation units within the system [8]. Smart grids will have the capacity to organise renewable power via power control techniques, enabling further DRES usage across energy sources [9]. To ensure system reliability, smart grids employ load demands that seem to be dynamic but are also frequency-controlled. Incorporation of minimal extent renewable sources of energy (RES) involves challenges along with transients and voltage unbalance, and therefore requires system coordination [10]. Smart grids address several difficulties with minimizing disturbances as well as admitting that consumers can manage overall energy demand. Using this technique, distributed generation plus backup might be used for supplying the system in distributed sections. Wind or solar power remain widely implemented renewable energy technologies mainly because of their abundant supply across the environment, although they are inconsistent, they are driving the market growth in power generation. Electric cars have been used as power storage, either regaining control by fuelling vehicles whenever supply increases or reducing load requirements [11]. Merging renewable power generation sources alongside plug-in hybrid electric vehicles (PHEVs) seems to have a considerable influence on overall resources and benefits by reducing fuel usage and carbon intensity [12]. The loads are applicable for residential loads like Tv, Refrigerators, lighting bulbs, water pump motors, household appliances and electronic appliances like laptops, mobile phones and DC types of loads etc, smart meters will help in minimizing the usage of cost as per the requirement of the load.
The impact of durability and adaptability on maintaining and performance of rapidly developing digital distribution networks has been expanding rapidly. Both the viability and economic implications of automation systems are confirmed using actual assessment and surveillance, including management of various components together at the power plant, distributor, and level of utility. Technology and devices such as smart meters (SMs) are being adopted to achieve a self-efficient distribution model [13,14].
Smart meters are most often used to estimate the induced power and also to automatically maintain their input whenever possible by using appropriate one-way interaction with the developing premise in automated meter reading (AMR) [15,16]. While connecting SMs using various new features, major functional improvements occur through the process and even a concept called Advanced or enhanced metering incorporation (AMI) was developed [17]. In linking additional SMs, the update included based on time-coordinated readings, an elevated information gathering device, distant software, and multiple information systems. Mostly as a solution, SM is designed with the following approaches.
1) Estimations as well as data analysis during actual and non-real periods. (e.g., voltages and currents).
2) Using a two-way communication system to send/receive information to certain other smart meters.
3) Operational capability, i.e., reconfigurable characteristics both online or manually.
4) Accessibility in management, i.e., the ability to perform system control virtually or regionally.
2.3 Smart Metering in Smart Grid Applications
Several SM features listed so far have gained numerous advantages through establishing an energy-efficient solution for electricity grid monitoring and controlling. A large number of current studies rely upon time-varying supply-side control by utilizing power demand information to construct consumer behaviour which always shows buyers intentions. SMs on the other hand, are often used in communication systems, including energy analysis and optimization. Smart meters are different types such as digital meters, smart payment meters, Prepaid energy meters [PPEM].
A smart meter is essentially a forum for consumers and utilities to interact and to communicate in a two-way manner. A Smart meter serves as a conduit between the smart home and the service provider (power supply). After a certain amount of time has passed, the smart meter transmits messages to the utilities, the server reminding it of the current load, prior information and so on. The smart grid becomes increasingly recognisable throughout every day to meet the daily electricity demand. A dedicated and valuable energy system is also accessible to meet the current demand of the consumer. The smart grid plays a significant role in reducing the energy costs of the consumer [18].
3.1 Model of Solar Photovoltaic System (PV)
The input power of solar photovoltaic (PV) is considered from the total radiation is given by [19].
Here IT = Total solar radiation (kW/m2) and IB is beam solar radiation and ID is diffuse solar radiation (kW/m2). The tilt angle is considered on the longitude and latitude of the geographical location. Here the total output depends on all radiations and their location.
The output power of solar photovoltaic is calculated with the surface area A/m2 with the below formula [20].
Here, the hourly generated power is kW = PPVS(t), the efficiency of the system is η
3.2 Model of (WES) Wind Energy System
The following equations show to calculate wind speed with hub height.
Here v(h) is wind velocity of hub height, v(hr) is wind velocity of reference height.
The generated power of wind energy system is with
Here air density is represented as ρA (1.2 kg/m3), the swept area of the rotor in a wind turbine is denoted as (AS) and the co-efficient of power for a model of a wind turbine is given is Cp, generator efficiency is represented as ηg, v is wind velocity (m/s). Prated is for rated power, vrated is rated velocity of wind and remaining are cut-out and cut-in speed of wind turbine respectively.
3.3 Model of ESS (Energy Storage System)
Batteries play a major role in the energy storage system from different energy sources like renewable and non-renewable. The combined energy sources from renewables can be stored and utilized by batteries. They charge the battery when the load demand is less and they discharge the energy when the generation of power is low. This is based on the load demand. Here the total time is given t for renewable energy and PV, WES (wind energy system) (WT) is represented in the below equation.
Here NPV is the total number of PV panels and NWT is the total number of wind turbines.
The battery power is calculated by the following equation.
Eq. (6) represents the charging and discharging of the battery. The positive is a representation of charging of a battery and the negative is the representation of discharging of a battery. The state of charge (SOC) of a battery can be used to calculate the operation of discharging and charging using the equation below [22].
Here, vbus is the bus voltage and is the efficiency of the battery. The efficiency of different types of batteries varies because different materials are used in them, such as li-ion batteries and lead-acid batteries, and the efficiency changes based on all characteristics.is the step time for one hour, and the battery’s lifetime is determined by the charging and discharging cycles of the battery; the battery’s lifetime is calculated using the following equation [23,24].
Here Ncycles is the total number of full cycles of s battery until the failure of the battery.
The load considered for the system is around 150 kW, Battery 50 kW, Renewable energy sources like solar and wind is 100 kW.
3.4 Operational Strategy of Renewable Energy System
The operational strategy of renewable energy systems is classified into three types, which are as follows:
Type 1:
Type 2:
Type 3:
The main objective of this work paper is to reduce the cost of energy (COE) from renewable energy sources, and it is given as follows
Here, 8760 (hours) is considered for time for one year.
The combination of energy sources like solar, wind and battery were used to minimize the cost of energy by demand-side management, whenever the load is needed for commercial and domestic purposes it will operate as per the operational strategy of the renewable energy system as explained in the above section.
In the field of optimizing, Holland introduced a breakthrough concept in 1977 in which evolutionary ideas in nature were replicated on a computer for resolving optimization issues [25]. Since then, the GA algorithm has revolutionised to approach problems. In the diverse field of study, researchers are challenged to come up with solutions to complex issues. The overall concept of the GA algorithm is fairly simple. This method was primarily inspired by Darwin’s theory of evolution. In GA, a given optimization task is started by producing a set of random solutions. Paradigms derived from nature may be simplistic, yet powerful in optimising problems, as demonstrated by the GA algorithm. After the GA method was proposed, the subject of stochastic optimization methods received more interest. As a result of success, several years after GA was invented, PSO (Particle Swarm Optimization) was developed [26].
The PSO algorithm imitates the communal and individualized behaviour of foraging herds, groups of fish, flocks of birds. The optimization process, like the GA method, begins with a collection of randomly generated solutions. Besides the collection of solutions, there is indeed a set of velocity values that are suitable for protecting and specifying the amount of activity caused by particles during the test, when a particle is optimising its velocity is adjusted depending on the best solution and it is discovered so far, and best solutions are saved for results, hence the success of PSO algorithm is mainly due to this factor only. As a result of GA and PSO algorithms evolution, various other algorithms have been invented and suggested as well.
A sine cosine algorithm was developed by Mirjalili in [27]. An initial number of random solutions is used in population-based optimization approaches to begin the performance analysis. An objective function evaluates this random collection periodically, and a system of regulations form the foundation of an optimization method. Due to the stochastic nature of population-based approaches, there is no assurance that a solution will be found in a just single run of the algorithm. The chance of finding the optimal global rises when the number of possible variables and optimization cycles, iterations is sufficient or increased. Because of the difference among the algorithms in the field of stochastic population-based optimization, the method of enhancement is divided into two sections exploration and exploitation [28]. During the first phase, an optimization algorithm rapidly merges the random solutions into a unique solution with a greater incidence of unpredictability to find suitable opportunities in the solution space. However, there are incremental modifications to random solutions throughout the exploitation phase, and slight differences are far lower than during the exploration phase [29].
The below positional updating equations are used in this study. For both phases, the following questions have been posed:
Here
Pi is the position of the destination point in i-th dimension.
r1, r2 and r3 are random numbers.
In the following, these two analytical solutions are integrated to create the following formula:
Here r4 is a random number in the range of [0,1]
SCA has four major parameters, as shown by the above equations as r1, r2, r3 and r4. Here, the r1 parameter specifies the location of the next position (direction of movement) that can be either inside or outside the area between the solution and destination. The r2 parameter specifies the distance between the direction of destination in outside or inside. The r3 parameter is a random weighting parameter for the destination, if the destination (r3 > 1) then it is emphasized (enhanced) and if (r3 < 1) then it is deemphasized. The r4 parameter swaps between sine and cosine elements in an equal manner in Eq. (12).
Fig. 2 shows the effects of sine and cosine elements which are considered in Eqs (10) and (11). These equations consist of sine and cosine elements. Hence, they are named Sine Cosine Algorithm (SCA). Fig. 2 represents the proposed equations that create a region in the search space between two solutions. Although a two-dimensional version is shown in Fig. 2, it should be emphasized that this formula may be expanded to multiple dimensions. The cyclical structure of the sine and cosine increases the possibility of one solution being relocated around the other. This ensures that the space defined by the two solutions is exploited. Solutions must be able to check beyond the region amongst their respective destinations while exploring the computational complexity. The SCA algorithm improves over PSO and genetic algorithm (GA) due to its unique optimization techniques and conceptual benefits, as well as other current algorithms in the majority of the cases, and it’s been used to solve a variety of real issues.
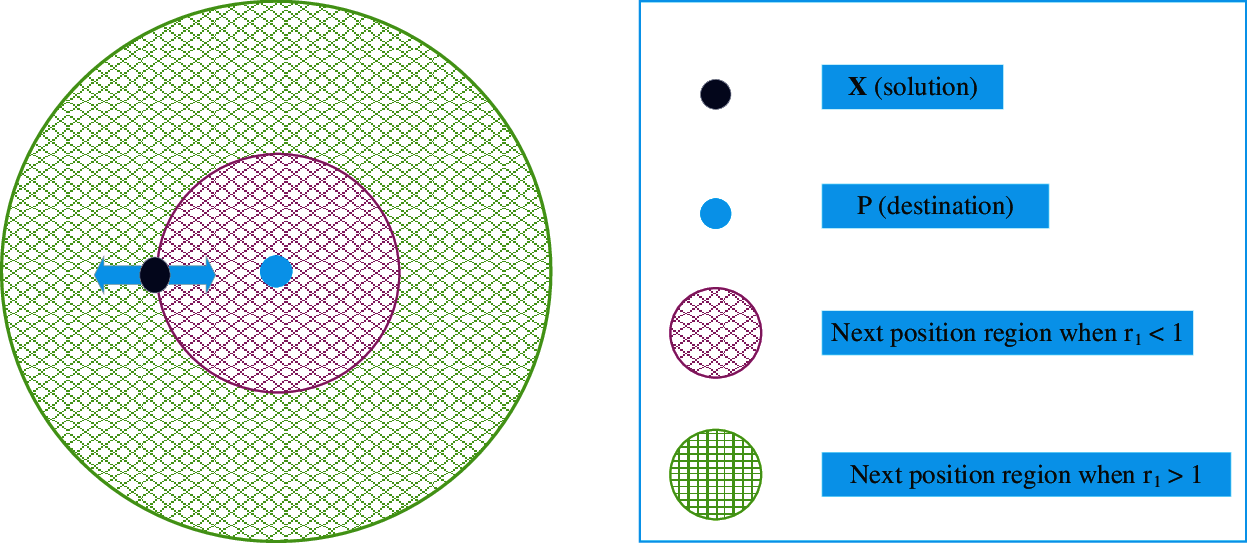
Figure 2: Effects of sine and cosine
Fig. 3 shows the conceptual representation of the sine and cosine equations impacts on the range of [−2,2], Fig. 3 represents how altering the range of sine and cosine components needs a solution to update its location outside or within the region between itself and other responses. A random number is defined for r2 in the range of [0, 2π] in Eq. (12). As a result, this method ensures both exploration and exploitation of the objective function. A balancing equation is required for an algorithm to balance both exploration and exploitation and to converge to the global optimum solution. To balance Eqs. (10)–(12), the following formula is employed.
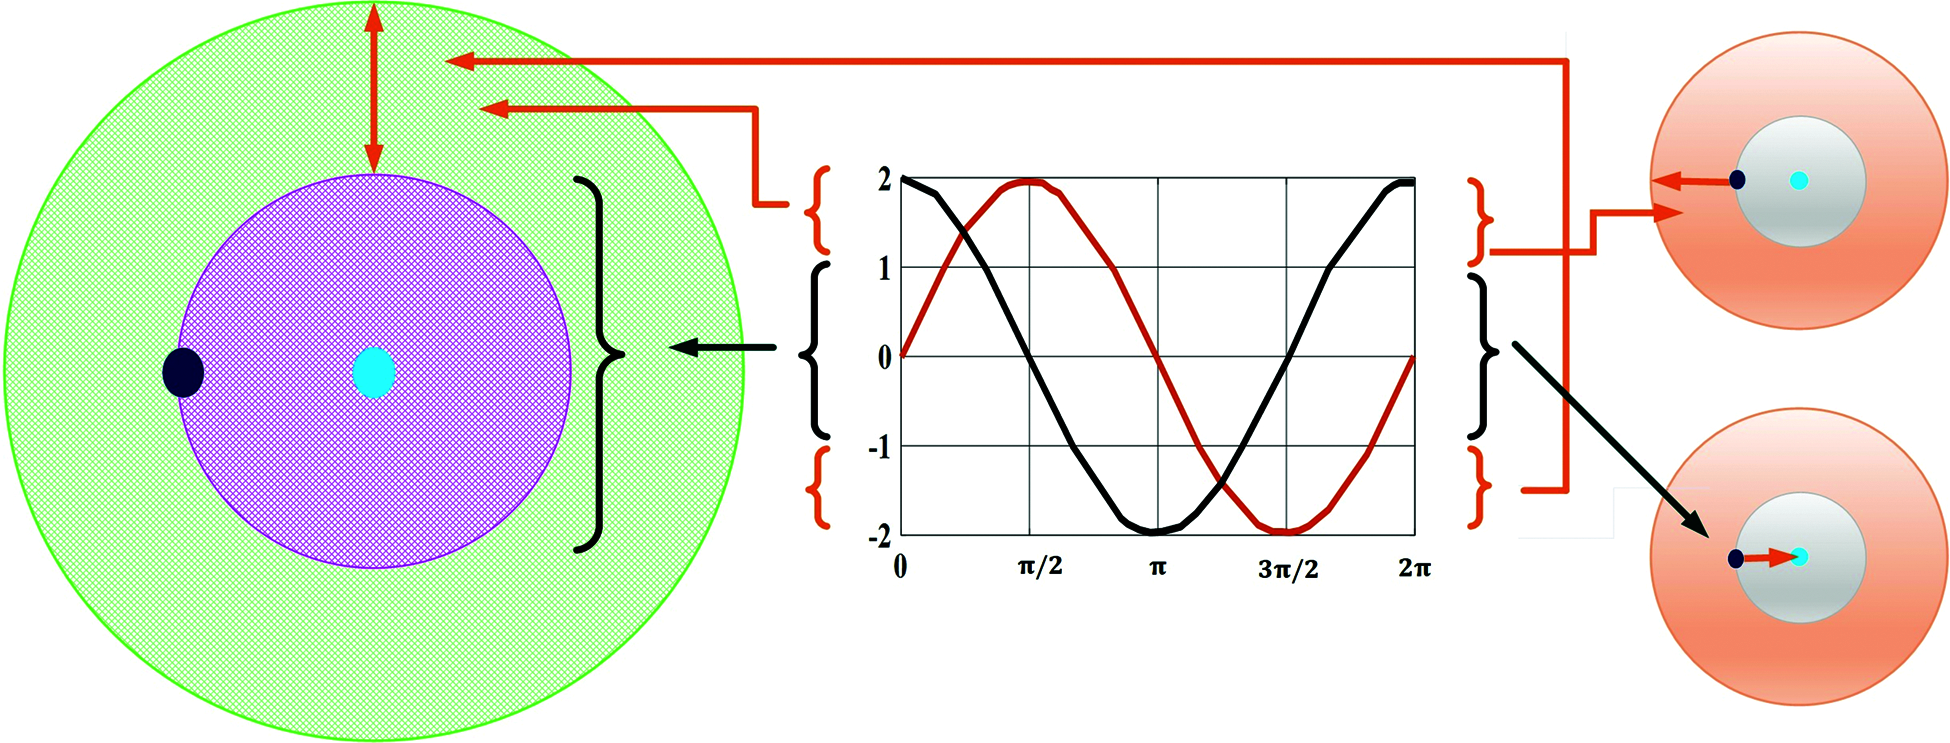
Figure 3: A conceptual representation of the sine and cosine equations impacts on the range of [−2, 2]
Here, a represents constant, T represents the maximum number of iterations and t represents the current iteration.
As the number of iterations increases, the range of the sine and cosine functions decreases. Fig. 3 shows the SCA discovers a solution while searching for a solution where the sine and cosine functions are in the range of [1, 2] and [−2, −1], although for ranges [−1, 1] this method exploits the search space.
Fig. 4 shows the flow chart of the sine cosine algorithm (SCA) [30], it represents the steps followed in the optimization process. Many test cases must be used to confirm the effectiveness of a method in the field of optimization combining meta-heuristics and optimization computation. This is because of the algorithms’ stochastic character. A collection of random solutions is used to begin the optimization process in the SCA algorithm. The algorithm subsequently stores the best solutions discovered so far, identifies them as the target position, and moves on to the next step. It is only after the individual’s ideal position has been updated that the algorithm adjusts its next-generation position. Other solutions are updated concerning it, Furthermore, when the iteration counter increases, the limits of sine and cosine functions are adjusted to maximise the exploitation of the search space. In its default mode of operation, SCA ends the optimization process when its iteration counter reaches its maximum number of iterations. Furthermore, some other termination conditions, like the total number of function evaluations or the precision of the derived optimal solution, might be evaluated. The major purpose of having combinatorial optimization techniques is to be able to function in an untenable optimal solution to examine certain potential areas of this space region.
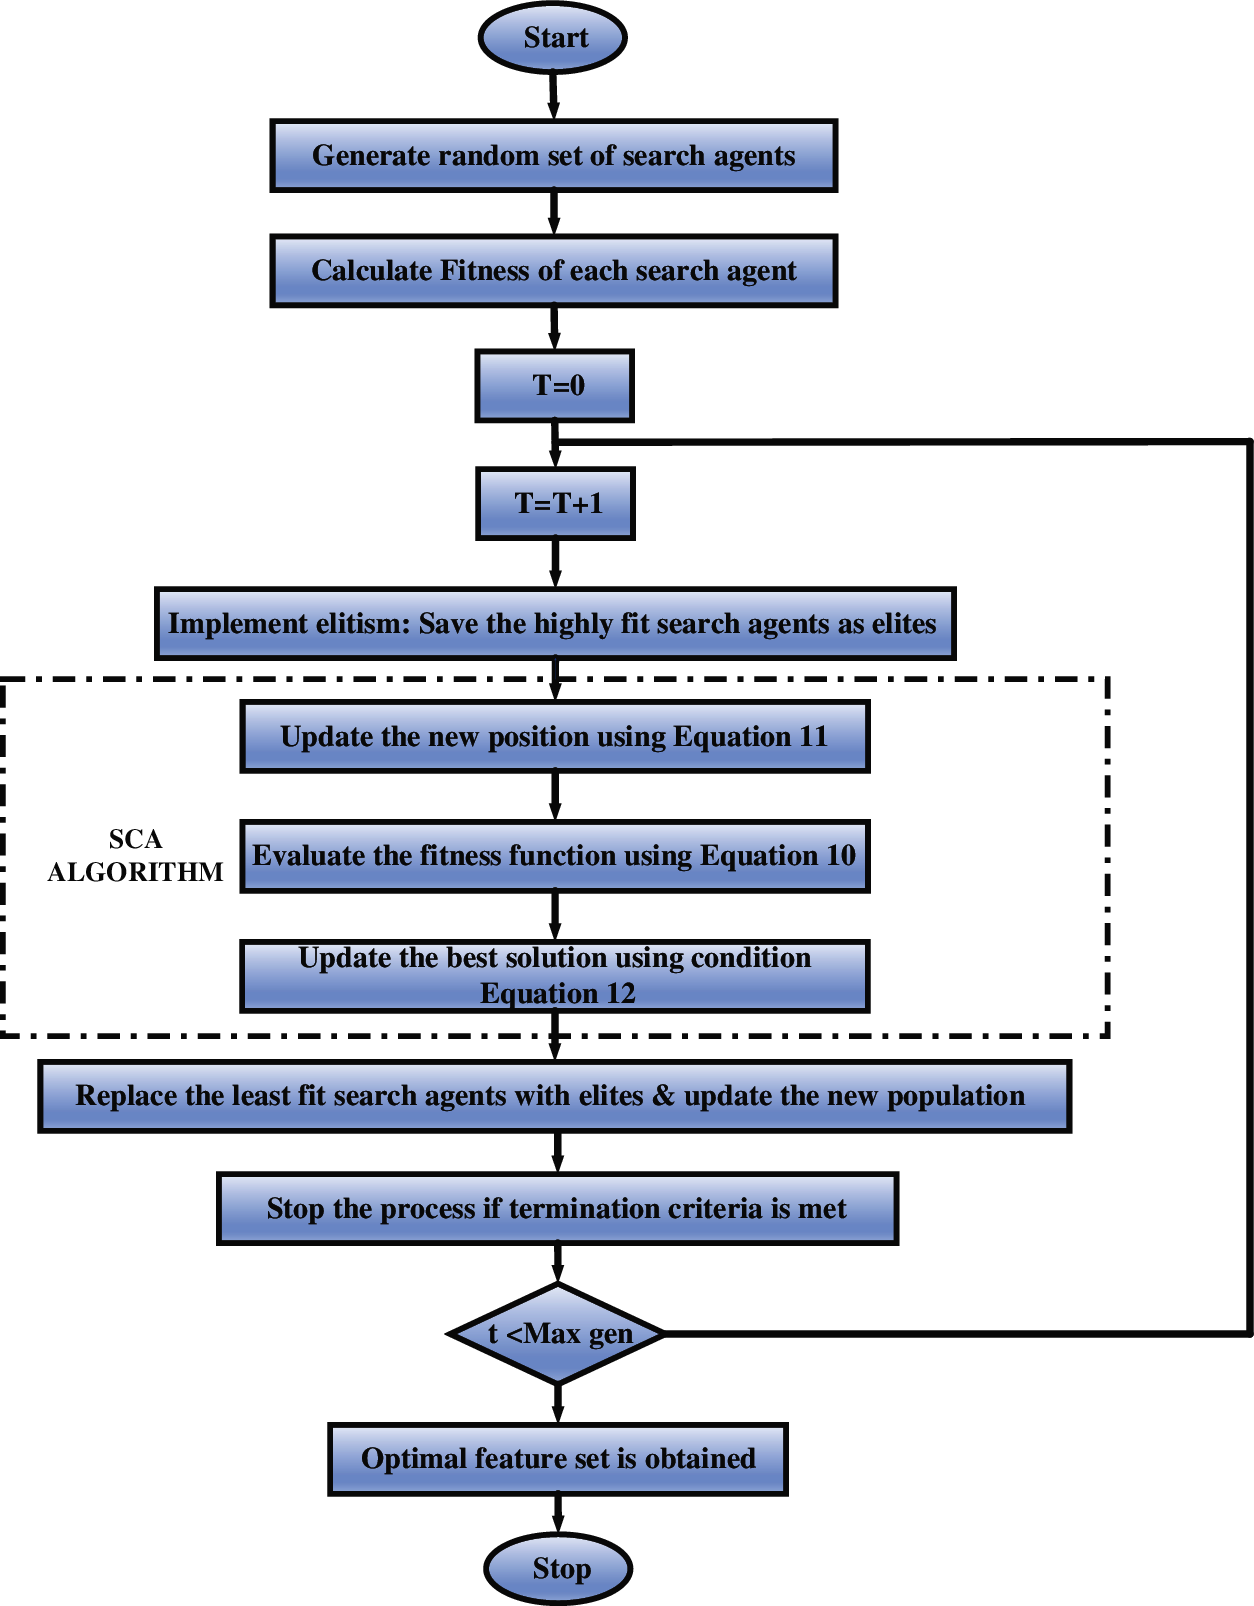
Figure 4: Flow chart of sine cosine algorithm (SCA)
4.2 Importance of Sine Cosine Algorithm (SCA)
The proposed scheme might effectively estimate the best solution of optimization techniques employing the above service providers for the aforementioned reasons:
• About individual-optimization types of algorithms, SCA develops as well as enhances a collection of randomized solutions to a specific issue, therefore it aims at raising exploration and minimization of local optima.
• Once the cosine and sine algorithms obtain an expected value higher than 1 or even lower than −1, distinct segments of solution space are analyzed.
• Whenever the sine and cosine values are present around −1 and 1, desirable sections of the solution space are explored.
• The SCA methodology employs an adjustable range in the sine and cosine co-efficient to gently switch between exploring and exploiting.
• The finest estimation of the optimum solution is maintained as a parameter by the desired location, which has never been reduced throughout the optimization process.
• Although the responses of SCA periodically upgrade their positions in response to a globally optimal solution up to this point, there is a possibility for enhancement that depends on the best locations of metaheuristic algorithms.
• Unless the proposed SCA approach considers optimization issues like a black box, it might easily apply to challenges in a variety of areas with appropriate error execution.
Step 1: Randomly generate the search agents and the size of the population. Initially, set the number of iterations, the autonomous evolution algebra, the iteration count, and any other variables as needed.
Step 2: Evaluate every population and compute the fitness value of each separately for the individual search agent.
Step 3: Update new position by using Eq. (11) and evaluate fitness function by using Eq. (10), and update the best solution by using the combined equation that is Eq. (12).
Step 4: Replace the least fit search agents with the best individual in the population and update the new population, if it reached the condition then for the next step otherwise to step 2.
Step 5: It stops the iterations if the criteria are met otherwise it will take to step 2 again, and if met to criteria the final optimal feature criteria are obtained.
Fig. 5 shows the total cost of energy at average load demand. But the load will be the same as before unscheduled loads with other algorithms. After scheduling the loads with algorithms depending on the cost of high and low, it will change. The average load demand is considered at normal hours when there is no need for an additional power supply. The average cost of load demand is considered to be 100$ (USD). The load will be the same after scheduling with algorithms and the cost will vary from each other. Fig. 5, shows Enhanced SCA gives less cost of energy when compared to other algorithms such as GA and ACO. SCA has around 90$ (USD) in average load demand. The cost will vary due to demand hours of the day, but the load supply will be the same to satisfy the load demand.
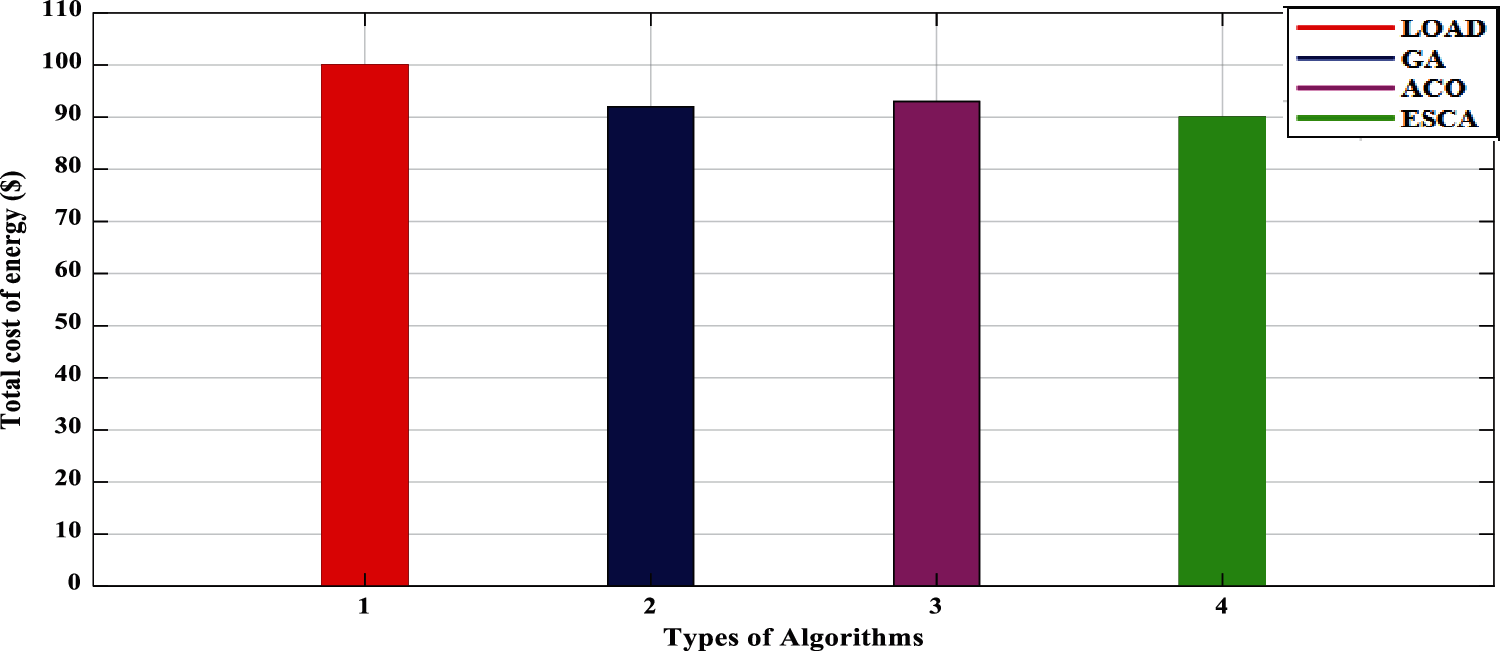
Figure 5: Total cost of energy on average load demand
Fig. 6 shows the total cost of energy for the maximum load demand where the consumption of load will be high due to the peak hours of the day. As the load demand is increased, the consumption of electricity also increases with it. The cost considered at the time of the maximum load demand is 135$. The total cost of energy by using enhanced SCA is around 105$ on maximum load demand. The load demand varies from morning, afternoon and night. The maximum load demand will be in the afternoon to evening, around 12 pm to 8 pm, including domestic and commercial purposes. When compared to GA and ACO, Enhanced SCA (ESCA) gives the best results in minimization of the total cost of energy in Fig. 5 as the total cost of energy on average demand as well as on maximum load demand in Fig. 6.
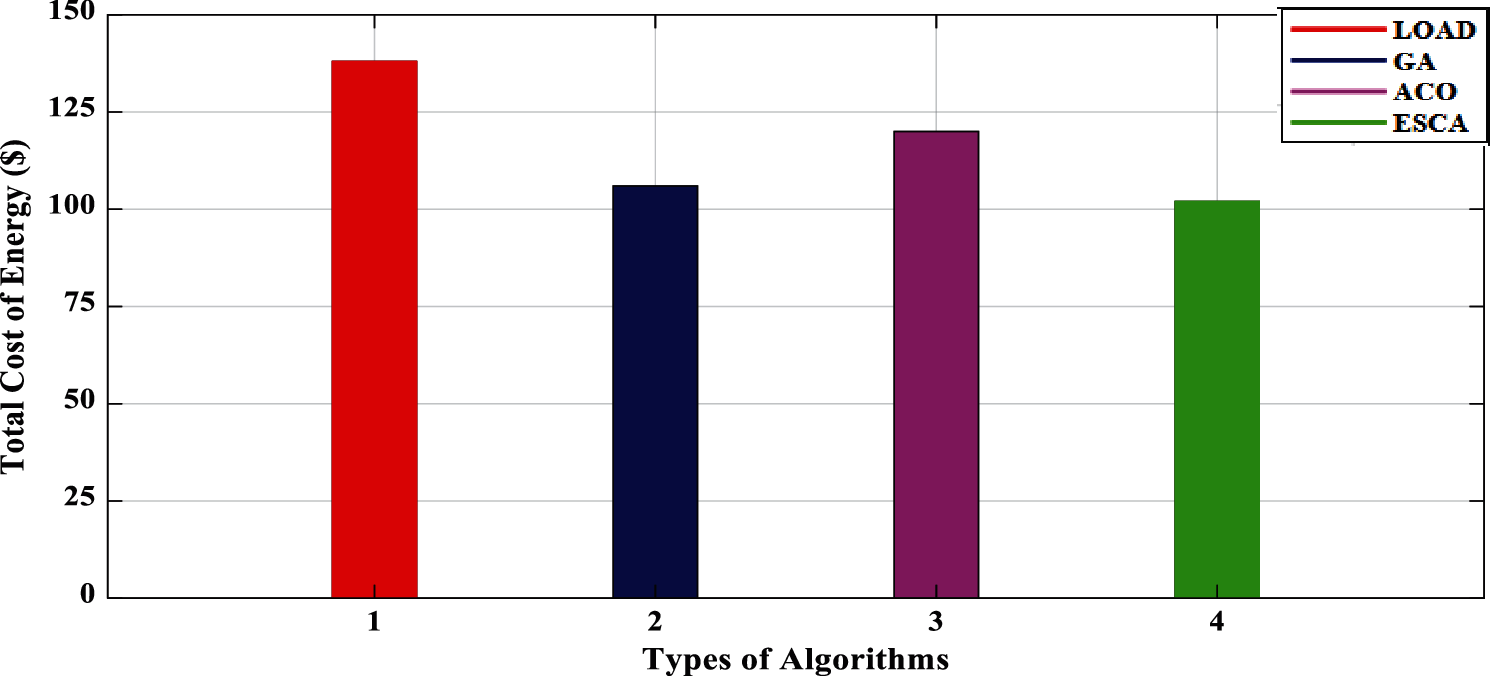
Figure 6: Total cost of energy on maximum load demand
Fig. 7 shows the peak average ratio (PAR), PAR depends on its value if Peak average ratio increased or decreased then it affects the grid stability. Grid stability will change if PAR is changing but in the cost minimization, it does not affect the stability of the grid. Fig. 7 shows the comparison of PAR with other algorithms. However, Enhanced SCA (ESCA) having less PAR scenario when compared with the GA and ACO.
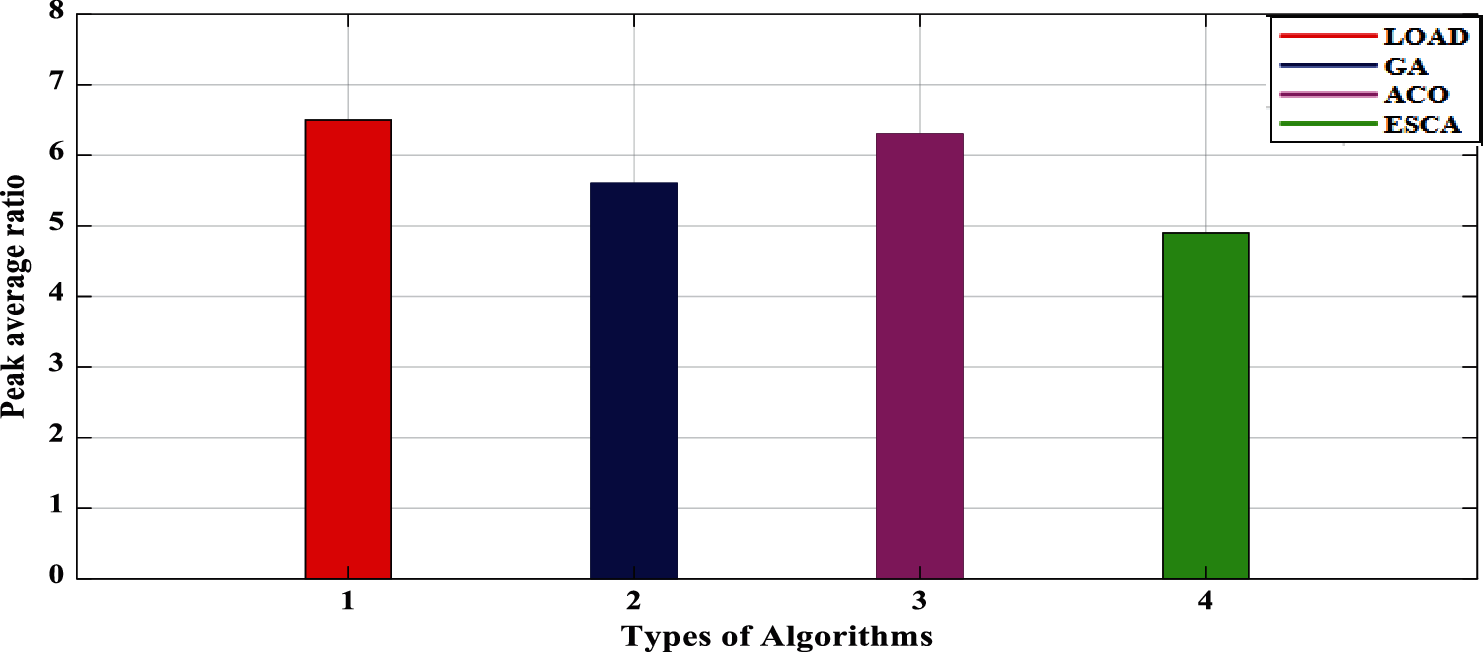
Figure 7: Peak average ratio (PAR)
Fig. 8 shows the cost of energy (COE) per hour. It shows every hour cost in a day (24 h). The cost of energy varies from load to other algorithm techniques. The cost of energy depends on the utilization load in hours, such as normal hours, as well as peak hours in a day depending on the load demand. Fig. 8 gives the results of applied algorithms with load in a day (24 h). By adjusting particular loads to specific low-demand hours, the suggested algorithms efficiently reduce the cost of energy usage without affecting their performance. As per the results, the cost of energy (COE) has been minimized by applying algorithms and the proposed method, Enhanced SCA (ESCA), gives the best results in the minimization of the cost of energy in a day when compared to GA and ACO algorithm techniques. As a result, the PAR is reduced and user comfort is increased, resulting in a reduction in consumption load. However, PAR is reduced it doesn’t have any effect on the stability of the grid because the cost of price is related to the load demand.
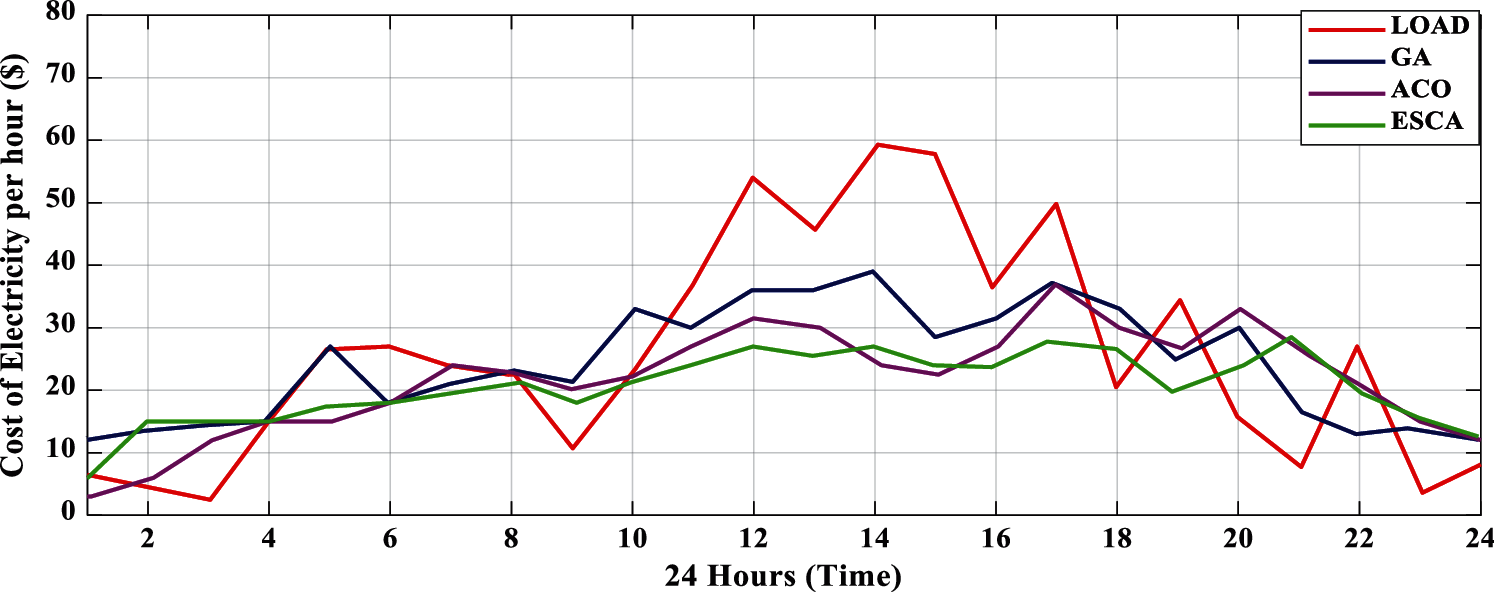
Figure 8: Cost of energy per hour
Fig. 9 shows the load with renewable energy sources and batteries. It shows how renewable energy sources are satisfying the load demand with PV and wind energy systems along with battery storage management. The combination of PV and wind energy systems is used to show the load demand and the battery will depend on the demand for load with charging and discharging of power. Fig. 9, shows that the stored energy from the battery is used in the daytime as per load requirement in peak hours, and the extra energy stored in the daytime is used in the nighttime from 4 pm to 10 pm to reduce the cost of electricity. Hence, renewable energy sources with batteries can reduce the cost of energy (COE) by using the proposed method of Enhanced SCA (ESCA) when compared with GA and ACO.
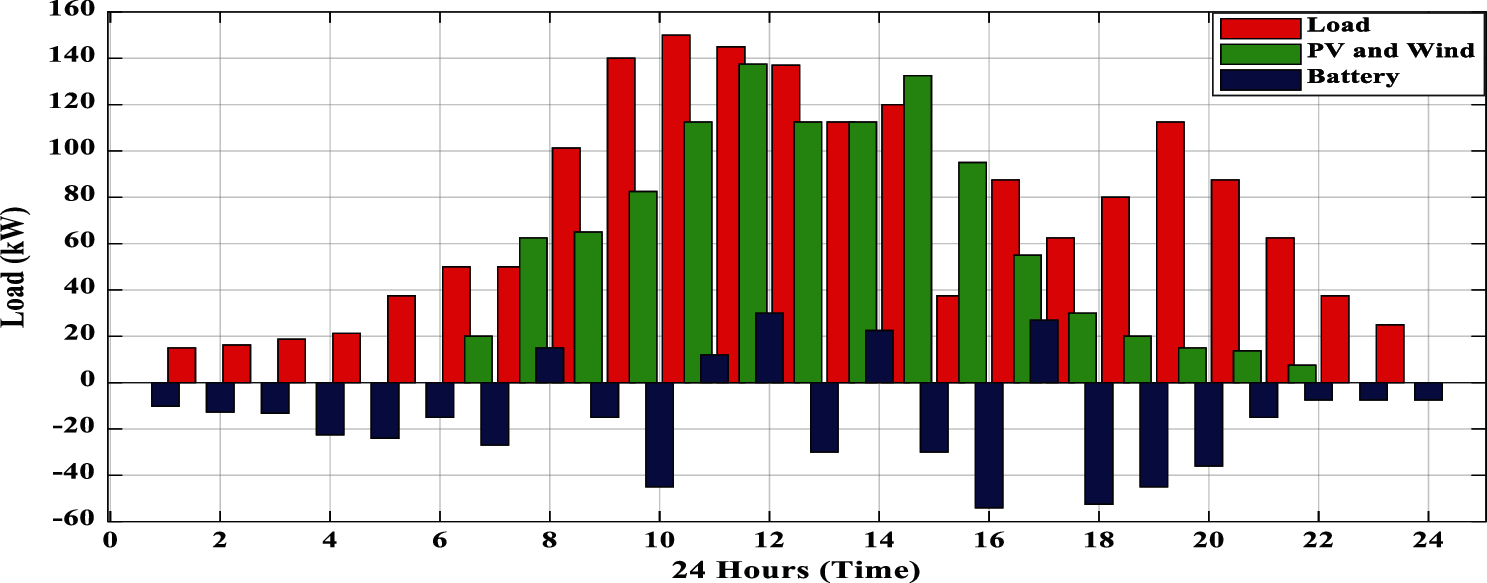
Figure 9: Load with renewable energy sources and battery
Fig. 10 shows the results of the load profiles of maximum load profile and average load profile. The maximum curve of the load profile is due to the high usage of power in domestic as well as commercial. The consumption of load will be more due to peak hours for domestic purposes, like from 6 am to 11 am, and 4 pm to 10 pm approximately. While in commercial purposes, like from 10 am to 5 pm, such as schools, institutions, and business centres etc. The average load profile depends on the load with normal usage of electrical appliances for domestic as well as commercial purposes. When there are no peak hours, the average load consumption will be used. Fig. 10 curve shows the difference between the maximum load demand and the average load demand in a day (24 h). The curve graphs show the maximum load demand is around 140 kW and the average load demand is around 120 kW in peak hours. The rest of the load demand varies between the periods of 100 kW to 140 kW.
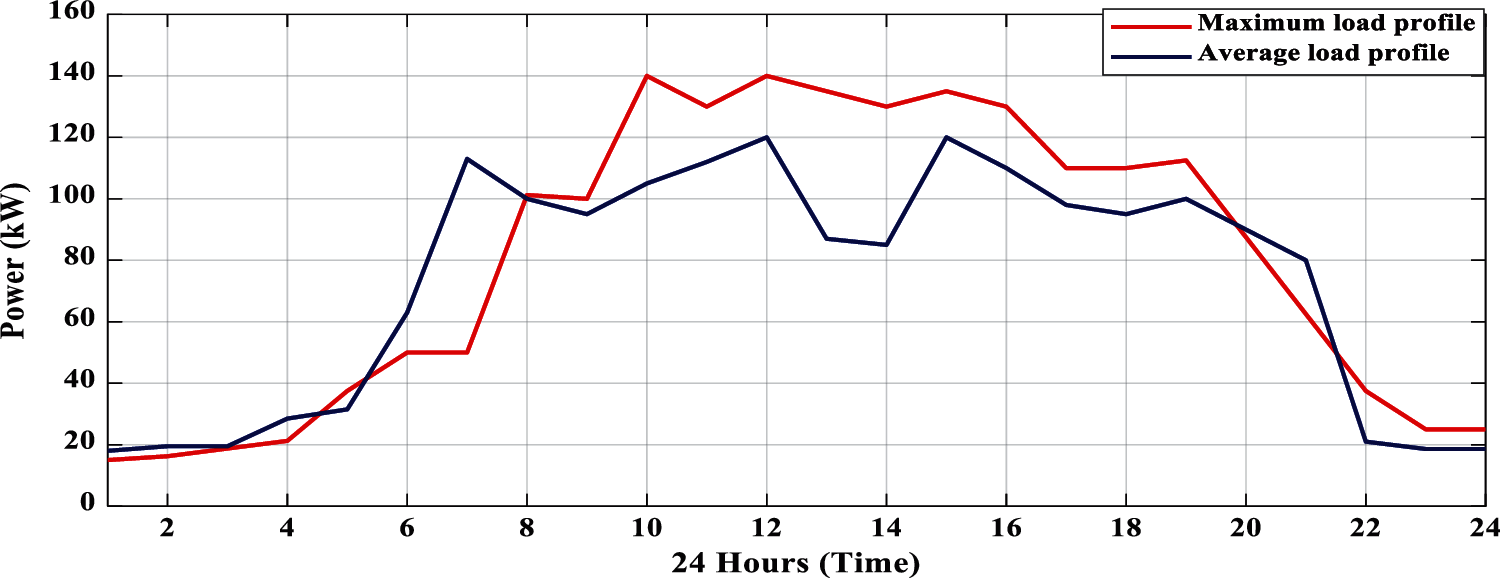
Figure 10: Maximum and average load profile of the load
Fig. 11 shows the consumption of hourly load by using different algorithms. The different algorithms like GA, ACO, and the proposed algorithm method Enhance SCA (ESCA). The graph results show the consumption of load with the GA method and ACO method. The actual load consumption in peak hours is about 140 kW, whereas the other GA and ACO also reduced the consumption of the hourly load, which gives results in reducing the cost of energy (COE). When compared to the above two methods, the proposed method ESCA is best at minimization of cost of energy with less consumption of the hourly load. The graph results in Fig. 11 show the ESCA consuming around 115 kW in peak hours when compared to actual load and other methods like GA and ACO.
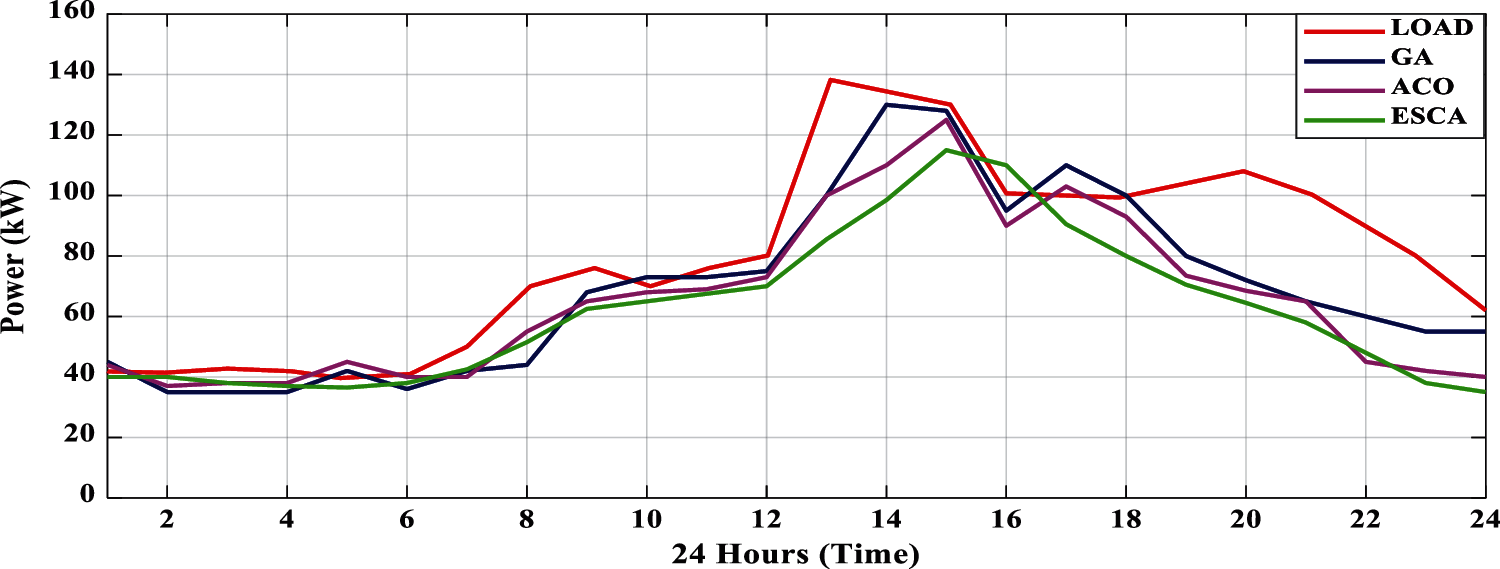
Figure 11: Consumption of hourly load by using different algorithms
Tab. 1 shows the comparison of loads and their cost of energy (COE) per-hourly load, the table shows the minimization of cost of energy when compared with other algorithms like GA and ACO with the proposed algorithm method Enhanced SCA (ESCA).
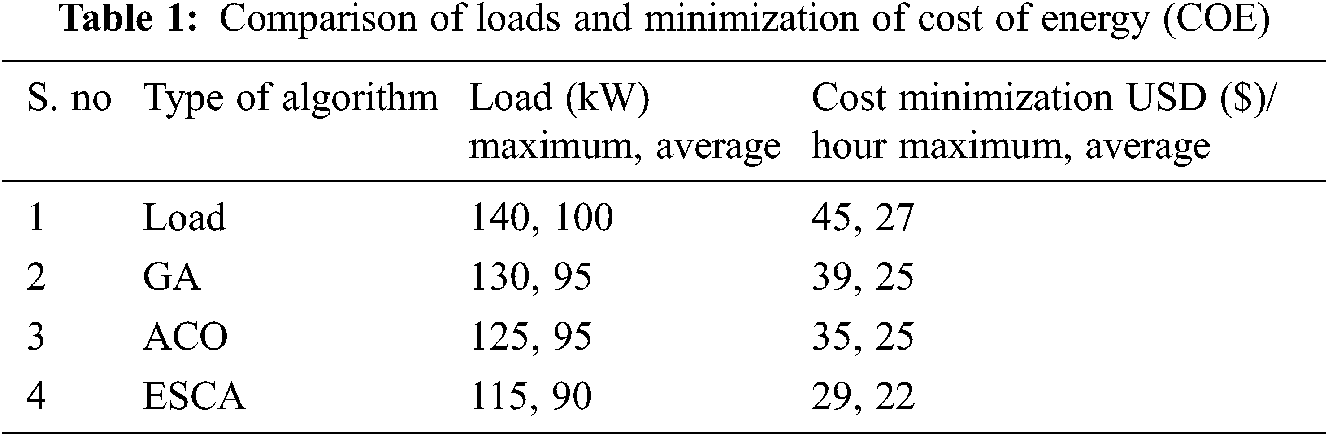
The further scope of the proposed method can be applicable with hybridization of optimization techniques like integration with other algorithm methods to improve the efficiency as well to minimize the cost of energy along with different energy sources with the smart grid integration.
In this research, the load is considered with renewable energy sources and batteries. It shows how renewable energy sources are satisfying the load demand with PV and wind energy systems along with battery storage management. A demand-side management method for the energy optimal solution is discussed. Different algorithm techniques are applied in the optimization process to get the best solution. As per the results, the proposed method, Enhanced SCA (ESCA), gives the best results in minimization of cost of energy (COE) and also in less consumption of hourly load than other methods like GA and ACO. However, the cost of energy can be reduced by using the part of the smart grid with the help of smart meters for domestic and commercial purposes. The smart grid also plays a major role in the integration of renewable energy sources with battery storage systems. The advantages of smart are clear above with the help of smart meters. Apart from smart meters, the consumption of the hourly load is managed by using different algorithms. Algorithms like GA, ACO, and the proposed algorithm method Enhance SCA (ESCA) are used in this work. The consumption load will be more due to peak hours for domestic purposes, like from 6 am to 11 am, and 4 pm to 10 pm approximately. The proposed method, ESCA, is best at minimization of the cost of energy with less consumption of the hourly load. The ESCA consumes around 110 kW in peak hours when compared to actual load and other methods like GA and ACO. Grid stability will change if PAR (Peak average ratio) changes, but cost minimization does not affect the stability of the grid.
Acknowledgement: Authors are thankful to the management of Vellore Institute of technology, VIT-Vellore. And this work is carried out in the lab of Digital Simulation Lab (DSL) from the School of Electrical Engineering (SELECT), VIT-Vellore, Tamil Nadu, India.
Funding Statement: The authors received no specific funding for this study.
Conflicts of Interest: The authors declare that they have no conflicts of interest to report regarding the present study.
1. A. M. Hemeida, M. H. El-Ahmar, A. M. El-Sayed, H. M. Hasanien, S. Alkhalaf et al., “Optimum design of hybrid wind/PV energy system for remote area,” Ain Shams Engineering Journal, vol. 11, no. 1, pp. 11–23, 2020. [Google Scholar]
2. I. M. Syed, “Near-optimal standalone hybrid PV/WE system sizing method,” Solar Energy, vol. 157, pp. 727–734, 2017. [Google Scholar]
3. F. H. Fahmy, N. M. Ahmed and H. M. Farghally, “Optimization of renewable energy power system for small scale brackish reverse osmosis desalination unit and a tourism motel in Egypt,” in Proc. Int. Conf. on Electrical Engineering ICEENG, Military Technical College, Cairo, Egypt, vol. 8, pp. 1–14, 2012. [Google Scholar]
4. S. S. Singh and E. Fernandez, “Modeling, size optimization and sensitivity analysis of a remote hybrid renewable energy system,” Energy, vol. 143, pp. 719–731, 2018. [Google Scholar]
5. A. Khiareddine, C. B. Salah, D. Rekioua and M. F. Mimouni, “Sizing methodology for hybrid photovoltaic/wind/hydrogen/battery integrated to energy management strategy for pumping system,” Energy, vol. 153, pp. 743–762, 2018. [Google Scholar]
6. K. Anoune, M. Bouya, A. Astito and A. B. Abdellah, “Sizing methods and optimization techniques for PV-wind based hybrid renewable energy system: A review,” Renewable and Sustainable Energy Reviews, vol. 93, pp. 652–673, 2018. [Google Scholar]
7. B. G. Sujatha and G. S. Anitha, “Enhancement of PQ in grid connected PV system using hybrid technique,” Ain Shams Engineering Journal, vol. 9, no. 4, pp. 869–881, 2018. [Google Scholar]
8. N. Phuangpornpitak and S. Tia, “Opportunities and challenges of integrating renewable energy in smart grid system,” Energy Procedia, vol. 34, pp. 282–290, 2013. [Google Scholar]
9. K. Sharma and L. M. Saini, “Performance analysis of smart metering for smart grid: An overview,” Renewable and Sustainable Energy Reviews, vol. 49, pp. 720–735, 2015. [Google Scholar]
10. F. Benzi, N. Anglani, E. Bassi and L. Frosini, “Electricity smart meters interfacing the households,” IEEE Transactions on Industrial Electronics, vol. 58, no. 10, pp. 4487–4494, 2011. [Google Scholar]
11. S. C. Yip, W. N. Tan, C. Tan, M. T. Gan, and K. Wong, “An anomaly detection framework for identifying energy theft and defective meters in smart grids,” International Journal of Electrical Power & Energy Systems, vol. 101, pp. 189–203, 2018. [Google Scholar]
12. S. Karimulla and K. Ravi, “Optimal measuring and energy planning of smart grid considering the battery lifetime by using FFA,” Turkish Journal of Computer and Mathematics Education (TURCOMAT), vol. 12, no. 6, pp. 2324–2337, 2021. [Google Scholar]
13. Y. Jiang, C. C. Liu and Y. Xu, “Smart distribution systems,” Energies, vol. 9, no. 4, pp. 297, 2016. [Google Scholar]
14. S. Karimulla and K. Ravi, “A review on importance of smart grid in electrical power system,” in Proc. Int. Conf. on Computation of Power Energy Information and Communication ICCPEIC, Melmaruvathur, India, pp. 22–27, 2019. [Google Scholar]
15. D. Alahakoon and X. Yu, “Smart electricity meter data intelligence for future energy systems: A survey,” IEEE Transactions on Industrial Informatics, vol. 12, no. 1, pp. 425–436, 2015. [Google Scholar]
16. S. Karimulla and K. Ravi, “Utilization of renewable energy sources using smart grid technology,” in Proc. Int. Conf. on Computation of Power Energy Information and Communication I-CASIC Springer Singapore, Vellore, India, pp. 2009–2018, 2021. [Google Scholar]
17. R. R. Mohassel, A. Fung, F. Mohammadi and K. Raahemifar, “A survey on advanced metering infrastructure,” International Journal of Electrical Power & Energy Systems, vol. 63, pp. 473–484, 2014. [Google Scholar]
18. S. Chakraborty, S. Das, T. Sidhu and A. K. Siva, “Smart meters for enhancing protection and monitoring functions in emerging distribution systems,” International Journal of Electrical Power & Energy Systems, vol. 127, pp. 106626, 2021. [Google Scholar]
19. A. B. Kanase-Patil, R. P. Saini and M. P. Sharma, “Development of IREOM model based on seasonally varying load profile for hilly remote areas of uttarakhand state in India,” Energy, vol. 36, no. 9, pp. 5690–5702, 2011. [Google Scholar]
20. S. Rajanna and R. P. Saini, “Development of optimal integrated renewable energy model with battery storage for a remote Indian area,” Energy, vol. 111, pp. 803–817, 2016. [Google Scholar]
21. S. Sanajaoba and E. Fernandez, “Maiden application of cuckoo search algorithm for optimal sizing of a remote hybrid renewable energy system,” Renewable Energy, vol. 96, pp. 1–10, 2016. [Google Scholar]
22. S. Upadhyay and M. P. Sharma, “Selection of a suitable energy management strategy for a hybrid energy system in a remote rural area of India,” Energy, vol. 94, pp. 352–366, 2016. [Google Scholar]
23. R. Dufo-López and J. L. Bernal-Agustín, “Techno-economic analysis of grid-connected battery storage,” Energy Conversion and Management, vol. 91, pp. 394–404, 2015. [Google Scholar]
24. A. S. Ogunjuyigbe, T. R. Ayodele and O. A. Akinola, “Optimal allocation and sizing of PV/Wind/Split-diesel/Battery hybrid energy system for minimizing life cycle cost, carbon emission and dump energy of remote residential building,” Applied Energy, vol. 171, pp. 153–171, 2016. [Google Scholar]
25. J. H. Holland and J. S. Reitman, “Cognitive systems based on adaptive algorithms,” In Pattern-Directed Inference Systems, Academic Press, New York, NY, USA, pp. 313–329, 1978. [Google Scholar]
26. R. C. Eberhart and J. Kennedy, “A new optimiser using particle swarm theory in proceedings of the sixth international symposium on micro machine and human science,” in Proc. Sixth Int. Symposium on Micro Machine and Human Science ISMMHS, Nagoya, Japan, pp. 39–43,. 1995. [Google Scholar]
27. S. Mirjalili, “SCA: A sine cosine algorithm for solving optimization problems,” Knowledge-Based Systems, vol. 96, pp. 120–133, 2016. [Google Scholar]
28. M. Črepinšek, S. H. Liu and M. Mernik, “Exploration and exploitation in evolutionary algorithms: A survey,” ACM Computing Surveys (CSUR), vol. 45, no. 3, pp. 1–33, 2013. [Google Scholar]
29. S. Karimulla and K. Ravi, “Solving multi objective power flow problem using enhanced sine cosine algorithm,” Ain Shams Engineering Journal, (Article in press) 2021. [Google Scholar]
30. R. Sindhu, R., Ngadiran, Y. M. Yacob, N. A. Zahri and M. Hariharan, “Sine–cosine algorithm for feature selection with elitism strategy and new updating mechanism,” Neural Computing and Applications, vol. 28, no. 10, pp. 2947–2958, 2017. [Google Scholar]
 | This work is licensed under a Creative Commons Attribution 4.0 International License, which permits unrestricted use, distribution, and reproduction in any medium, provided the original work is properly cited. |