DOI:10.32604/iasc.2022.022833
| Intelligent Automation & Soft Computing DOI:10.32604/iasc.2022.022833 | |
| Article |
IoT-EMS: An Internet of Things Based Environment Monitoring System in Volunteer Computing Environment
1Department of Computer Science and Engineering, Parala Maharaja Engineering College (Govt.), Berhampur, 761003, India
2Department of Computer Science and Engineering, National Institute of Technology, Warangal, 506004, India
3Department of Computer Science and Engineering, SRM University, Amaravati, 522502, India
4Department of Computer Science and Engineering, Taylor’s University, Subang Jaya, 47500, Malaysia
5Department of Computer Science, College of Computers and Information Technology, Taif University, Taif, 21944, Saudi Arabia
*Corresponding Author: N. Z. Jhanjhi. Email: noorzaman.jhanjhi@taylors.edu.my
Received: 20 August 2021; Accepted: 22 September 2021
Abstract: Environment monitoring is an important area apart from environmental safety and pollution control. Such monitoring performed by the physical models of the atmosphere is unstable and inaccurate. Machine Learning (ML) techniques on the other hand are more robust in capturing the dynamics in the environment. In this paper, a novel approach is proposed to build a cost-effective standardized environment monitoring system (IoT-EMS) in volunteer computing environment. In volunteer computing, the volunteers (people) share their resources for distributed computing to perform a task (environment monitoring). The system is based on the Internet of Things and is controlled and accessed remotely through the Arduino platform (volunteer resource). In this system, the volunteers record the environment information from the surrounding through different sensors. Then the sensor readings are uploaded directly to a web server database, from where they can be viewed anytime and anywhere through a website. Analytics on the gathered time-series data is achieved through ML data modeling using R Language and RStudio IDE. Experimental results show that the system is able to accurately predict the trends in temperature, humidity, carbon monoxide level, and carbon dioxide. The prediction accuracy of different ML techniques such as MLP, k-NN, multiple regression, and SVM are also compared in different scenarios.
Keywords: Environment monitoring; IoT-EMS; machine learning; internet of things; arduino
Environment monitoring is the task of recording atmospheric parameters over a period of time and at a specified location [1–5]. Results of such monitoring will help government and non-government organizations to take necessary actions and decisions about how the environment will affect the human life and in what ways can humans safeguard the ecosystem. Besides government organizations and non-government organizations, this information can be harnessed and accessed by many people, as weather impacts several activities such as: agriculture, industries, marketing, transportation, construction, and numerous scientific and commercial applications. Regardless of its application, measurement of weather has to be reliable and accurate. Quality and precision of sensors is another important criterion to determine the accuracy and reliability of gathered data. The forecasting of weather using physical models of the atmosphere are vulnerable to perturbations, and inconsistent when used to capture trends over large periods of time. Here, ML techniques help to decide which are stable in generating more accurate forecasts. Machine learning is an artificial intelligence (AI) application that provides ability to a system to work automatically by learning and improving from the past experiences without being explicitly programmed [6–9]. The quality of our environment depends upon the variation in the environmental parameters which is difficult to measure due to uncertainties and complex atmospheric processes. ML algorithms, owing to their stability and independency of the complex physical processes of the atmosphere, provide better data analysis results. IoT interconnects the physical devices that enables the objects such as software, sensors, actuators, electronic devices, etc. which are assimilated in a network for exchanging the data [10–14]. IoT creates a platform which integrates physical world with the computer-based system. This platform provides an efficient, accurate, and economic approach towards environment monitoring and also reduces human interference. This phenomenon comprises of tiny machines which have the ability to sense, respond, collect data and compute, and connect to the Internet.
For monitoring type of applications using IoT nowadays volunteer computing [15–18] plays an important role where the volunteers share the resources, here resources are the memory, computing platform, network, etc. of IoT devices, to perform certain or many applications, for ex. environment monitoring, etc. The IoT device which shares its resource for such computations for doing a particular task is known as a volunteer for completion of the task. So, this concept is helpful in dealing with the conditions where resources are a constraint. Therefore, this concept better suits our environment monitoring where the volunteers who have resources or sensors to monitor the environment at a particular place or location needs to join the network for computing the things collaboratively and send the data to a centralized server. For monitoring of environment using IoT, sensors are being deployed in the environment to detect parameters (e.g., temperature, Humidity, CO, and CO2). The main aim of this paper is to design an effective IoT-EMS that measures the atmospheric parameters using appropriate sensors and to analyze the gathered data stored in the MySQL web server database. To the best of our knowledge very few works have been done in this area. Amongst the available open-source platforms in terms of specification, price, and development tools, Arduino is best available. In this research, Arduino is used as the main base platform and an open-source hardware/software platform to build network of objects that can sense and control the system. The Arduino environment comprises of three things such as Arduino board, Arduino IDE, and Arduino compatible shields with their libraries. The main contribution in this paper is stated as follows:
• In order to achieve a low budget IoT based environment monitoring system (IoT-EMS) in volunteer computing environment, inexpensive sensor components are used for measuring the parameters. We have mainly taken temperature and humidity sensor, carbon monoxide sensor, and carbon dioxide sensor for building the system.
• The measured parameters are transmitted to the microcontroller device, which are then sent to the MySQL web database server using the Quad Band GSM/GPRS SIM800 add-on shield for Arduino.
• The values stored in the database can be periodically used for analysis and such a statistical computing is performed using the R programming and RStudio.
• In this work, the gathered data using the IoT-EMS is analyzed using four ML algorithms such as support vector machine (SVM), k-Nearest Neighbor (k-NN), multilayer perceptron (MLP), and multiple regression, as these techniques work well for smaller datasets. At last, the accuracy of these techniques is also compared.
The rest of the paper is organized as follows. Section 2 presents the related works based on environment monitoring using machine learning. Section 3 presents the architecture of IoT-EMS. Section 4 presents the machine learning approaches used for analyzing the data gathered from IoT-EMS. Section 5 presents the dataset and its feature used for analysis. Section 6 presents the system model describing the working of IoT-EMS. Section 7 presents the results and discussion. Section 8 presents the conclusion of the work.
Related works include several discrete techniques used to perform weather forecasts and air pollution monitoring using IoT and ML techniques [19–21]. While much of the current forecasting technology involves simulations based on physics and differential equations, many new approaches from the AI domain mainly used machine learning techniques [22–24]. In most of the research works, only two popular ML models were used such as Classification and Regression. It was observed that, three most popular ML techniques associated with those two models were SVM, MLP and k-NN. One such work [24] compared the accuracy of the weather forecasts from traditional physical models of the atmosphere with those from the ML techniques. A linear regression model and a variation on functional regression model were used. It was observed that both the ML based models were outperformed by professional weather forecasting services, with the discrepancy between both diminishing rapidly for forecasts of later days and for even longer time scales the ML models could outperform professional ones. Rao et al. [25] presented an application of SVM for weather prediction of a single day. It is done by taking the maximum temperature values of previous n days and estimate the maximum temperature of a location. The performance of the system is observed for 2 to 10 days using the optimal kernel functions. SVM performs consistently better than MLP trained with back propagation algorithm. Yun et al. [26] proposed a novel approach to predict the maxima and minima of a temperature using the SVM approach. This method does not use the IoT design to grab the temperature information. Xiaojun et al. [27] proposed an environment monitoring system for a room to provide comfort to the users using Zigbee based wireless sensor network (WSN). The gathered data from a room is used to control the air condition in the room using ML algorithms. This method only focuses in room energy consumption control strategy. Saad et al. [28] proposed a neural network (NN) based air quality monitoring and forecasting system using low-cost hardware. This system forecasts the trends in the air quality. Saad et al. [29] proposed an indoor air quality monitoring system using MLP, k-NN, and linear discriminant analysis (LDA). During the course of experimentation, it is observed that a linear regression-based kernel was used for model building in SVM which could solve linear problems. However, for nonlinear problems, Radial Basis Function (RBF) or Gaussian kernel function is employed. This motivated us to use multiple linear regression model and its associated algorithm for better comparison of results with that from the non-linear ones. In this work, we use two algorithms for classification (k-NN and MLP) and two regression-based algorithms (SVM and multiple linear regression). Performance of the models built on top of these algorithms are compared and optimal model (one from each classification and regression-based models) is determined.
This section describes about the building blocks of IoT-EMS those are used for the design such as platform, sensors, and GSM/GPRS modules.
Arduino [30] is an open-source platform for designing computers that can control the physical entities. This computing platform is based on a development board consisting of a micro-controller for writing programs and controlling the objects. It takes input from the physical world and take decisions according to the system model output. Arduino board is powered with a regulated supply of 5 V. 3.3 V is generated by the board voltage regulator and the current draw is maximum 50 mA. It consists of a ATmega 8-bit microcontroller, flash memory of 32 KB, SRAM of 2 KB, EEPROM of 1 KB, and frequency of 16 MHz. It has 6 analog pins and 14 input/output digital pins. Fig. 1 shows the Arduino Uno board used for the design of IoT-EMS.
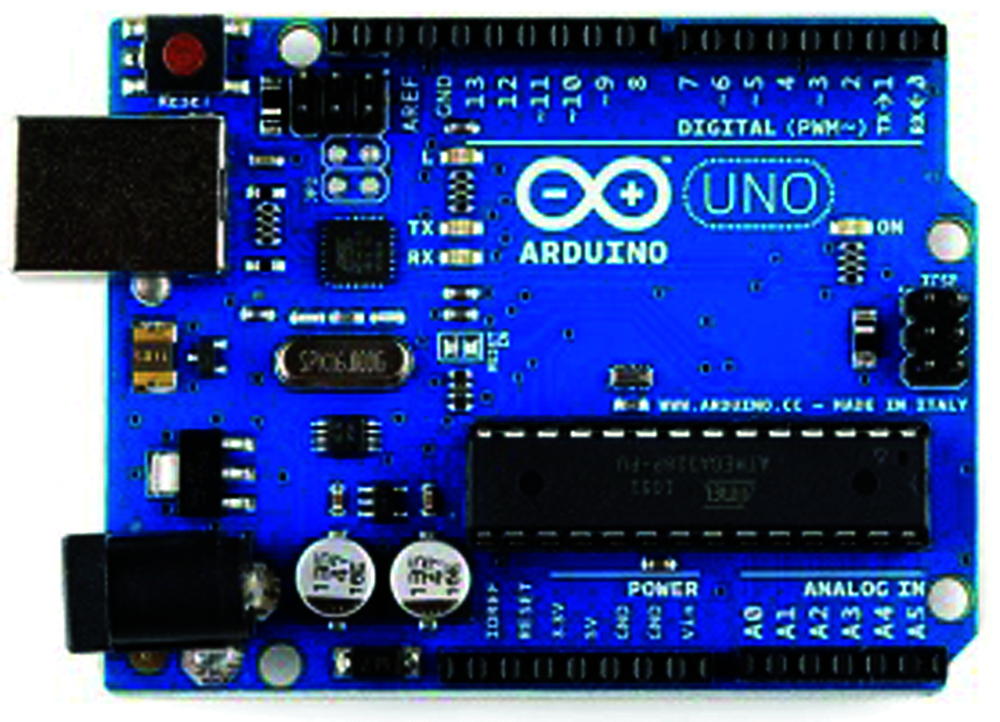
Figure 1: Arduino uno used for the design of IoT-EMS
3.2 SIM800 GSM/GPRS Quad Band Arduino Shield
The Arduino GSM shield [31] connects the Arduino board with the Internet by using the GPRS technology. This shield operates at a voltage of 5 V. It uses a M10 radio modem for communication. M10 is a quad-band GSM/GPRS module that operates at frequencies of GSM 850, EGSM 900, DCS 1800, and PCS 1900 MHz It supports TCP/UDP and HTTPS protocols for data communication. The maximum downlink and uplink data rate is 85.6 kbps. It supports a SIM slot for GSM/GPRS service. Fig. 2 shows the SIM800 GSM/GPRS Quad Band Arduino Shield with Arduino Uno for the design of IoT-EMS.
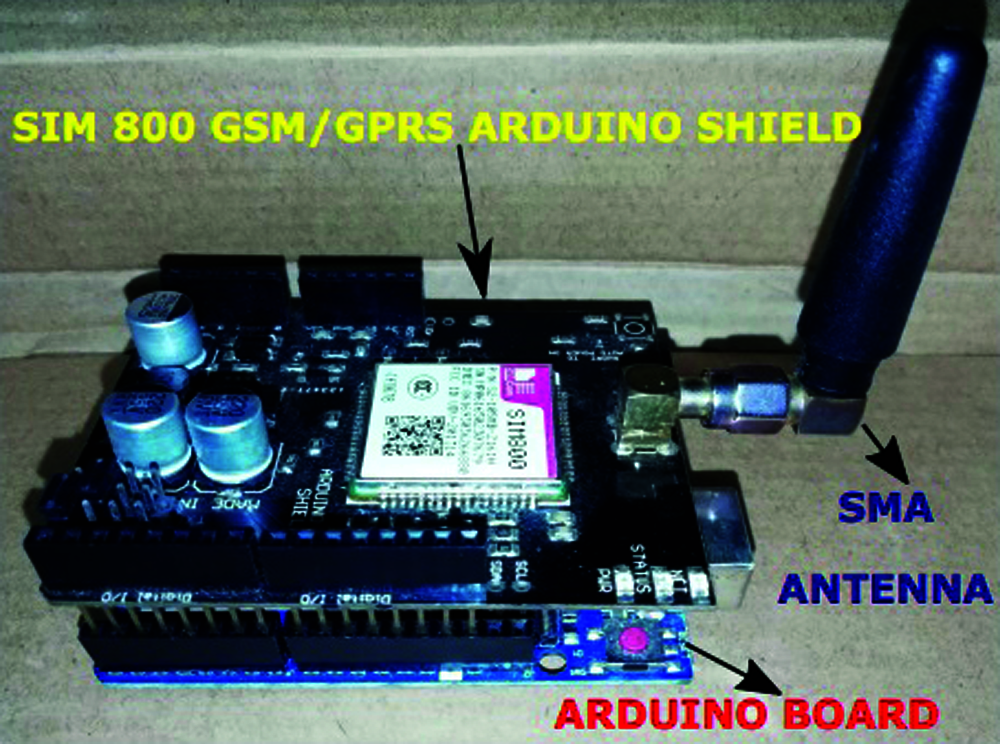
Figure 2: Embedding SIM800 GSM/GPRS quad band arduino shield with arduino uno for the design of IoT-EMS
The IoT-EMS mainly use three types of sensors such as temperature and humidity sensor, CO sensor, and CO2 sensor. These four parameters are the primary environmental factors which changes the quality of the environment. The ATmega 8-bit microcontroller controls the communication by receiving the data from the sensors periodically. The 3 sensors are briefly discussed as follows: 1) DHT11 [32]: DHT11 sensor is a low-cost sensor module mainly used for measuring the temperature and humidity at a location. It consists of a humidity sensor and a thermistor to measure the air. It works at 3–5 V power supply. The maximum current draw is 2.5 mA. It measures 20–80% humidity with a accuracy of 5%, and it can measure the temperature from 0–50 degree centigrade with an accuracy of ±2 degree centigrade. The module used has 3 pins such as power (Vcc), Data, and Ground (Gnd). Fig. 3a shows the DHT11 sensor used for the design of IoT-EMS. MQ-7 [33]: It is a low cost sensor used for measuring CO concentrations in the air. It can measure CO concentrations from 20 to 2000 ppm. It works at 5 V. MQ-7 consists of two circuits: 1) heating circuit and 2) signal output circuit for detecting the change in the surface resistance of the sensor. To get the desired reading of CO concentration sensitivity adjustment is really needed using calibration. Fig. 3b shows the MQ-7 sensor used for the design of IoT-EMS. MQ-135 [34]: This low-cost sensor is mainly used for detecting the air quality in the surrounding. The operating voltage of the sensor is ±5 V. This module has 4 pins such as Vcc, Gnd, digital out, and analog out. It can detect gases such as NH3, NOx, alcohol, Benzene, smoke, CO2, etc. It uses SnO2 as a resistance material to detect the gases in the environment. Fig. 3c shows the MQ-135 sensor used for the design of IoT-EMS.

Figure 3: Sensors used in this model. 3a: DHT11 temperature sensor, 3b: MQ-7: CO sensor, 3c: CO2 sensor
In this section, methodology is described on the basis of system model, its workflow, basic functionality of modules and environment monitoring part.
The system model mainly describes about the network model and the main building blocks as well as the workflow of the blocks. Fig. 4 shows the network model architecture where the network is divided into three planes. The planes are described as follows: 1) Device Plane: Lower plane is the device plane where the volunteers share their IoT device in a location to monitor the environment using specific sensors. The volunteers may be people or any specific person who deploy the device at a specific location to monitor the environment parameters such as temperature, humidity, carbon dioxide and carbon monoxide. 2) Edge Plane: Edge plane consists of edge devices which receives the data sensed by the IoT devices in the proximity. They receive the data and send this data to the cloud for analysis using machine learning models. The functioning of this layer mainly done by the edge agent which controls the communication between IoT devices and cloud server. 3) Cloud Plane: Cloud plane consists of a cloud server, it receives the data and process it using machine learning algorithms to analyze the data for pollution. It provides the environment monitoring application. In this model, the IoT device of a volunteer embedded with the required sensors sensed the readings and transfer it periodically to the edge devices in the proximity. It is assumed that the volunteers in the network have already joined the network for performing the monitoring. Afterwards, the edge devices receive the data and transfer it to the edge gateway to forward the data to the cloud server. These functions are totally controlled by an edge agent. Cloud server receives the data and use ML models for analysis of the data for environment pollution monitoring.
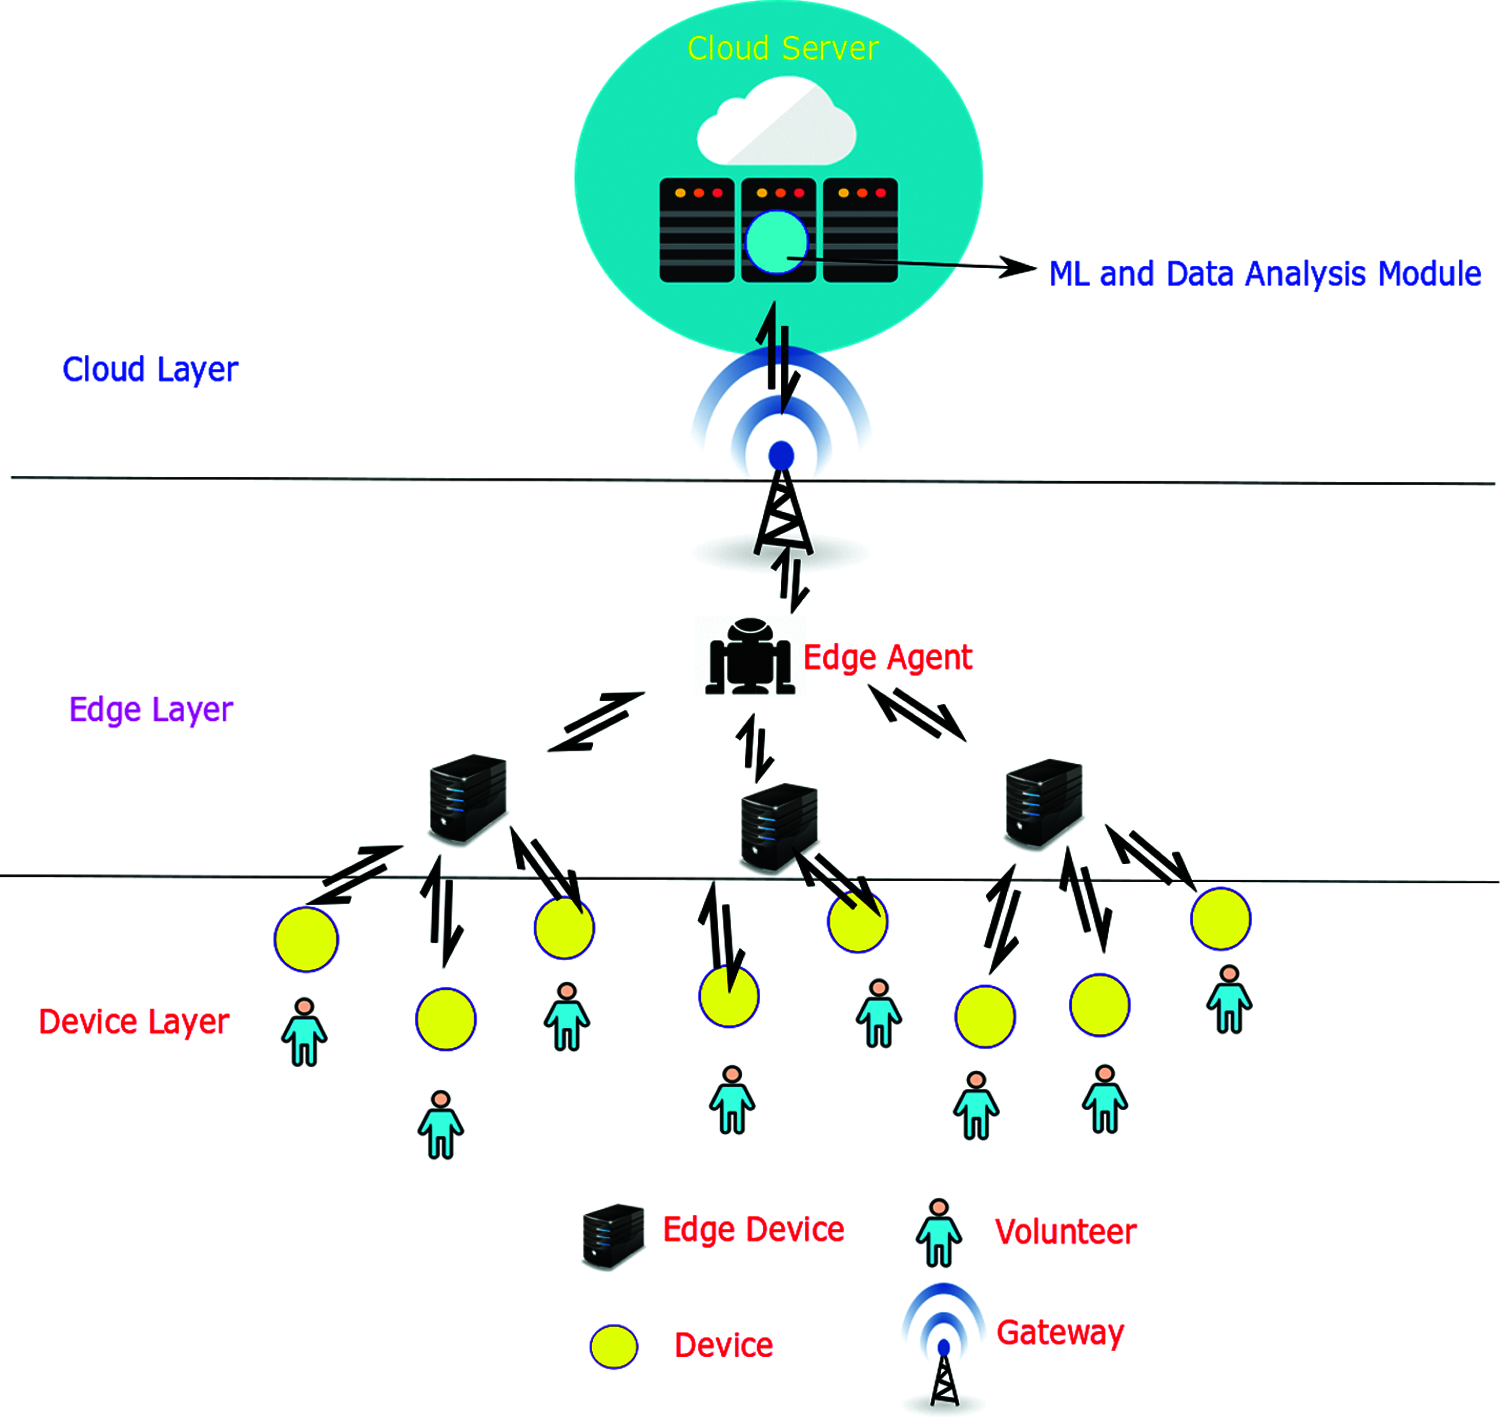
Figure 4: IoT-EMS model in volunteer computing environment
4.2 Data Gathering and Analysis
The entire work done in this paper is divided into data gathering and data analysis parts. Therefore, in this section firstly we have discussed about the different methodologies used in the analysis of the gathered data. Out of the many choices available, four most popular machine learning techniques are used for analyzing the gathered data. The ML techniques are briefly discussed as follows.
Multilayer Perceptron: MLP [35] is a class of artificial feed-forward neural network that uses a supervised learning technique for training called as Back-propagation algorithm. It comprises of a set of computing units called as neurons that are linked to each other. The network contains many intermediary layers between its input and output layers, and this intermediary layer is called as hidden layer. It is called as hidden because it is not directly exposed to the input. Hidden layers increase the computing power. This network uses many types of activation functions such as linear, sigmoid (logistic), and hyperbolic tangent function. Back-propagation is used in the feed forward network. Back-propagation is done in four steps as follows:
A. Initialize the weights and rate of learning.
B. Feed Forward Stage: In the feed forward stage, each input receives signal and forward it to the hidden layers. After receiving the signal, the hidden units calculate activation function and sends the signal to the output. For the given input data, the output unit calculates the activation function for getting the desired response.
C. Back propagate the errors: The results are compared with the desired or target values, the associated error is calculated. Then it is distributed back to all the units in the previous layer.
D. Update the bias and weight.
k-Nearest Neighbor: k-NN [35] is one of the simplest data mining algorithms and is the most common classification method used in machine learning. It works on the idea of classifying new objects based on attributes and training samples, using the k nearest neighbor. The k-NN classifier learns by resemblance, that is done by comparing given test sample with the available training samples which are similar. Performance of k-NN algorithm is greatly affected by the selection of k. If k value is too small, then classifiers may be affected by overfitting because of the noise present in the training dataset. If the k value is too large, then the classifier may not be able to classify the test sample accurately. k-NN is called as the lazy learner as it stores the dataset. Actual computation starts at the time of prediction. For a given new test case, its prediction made by searching similar instances in the training dataset was stored. The k most similar instances are used to make the prediction for the given test case.
Support Vector Machine: Popularly known as kernel machine or Support Vector Networks, the Support Vector Machine (SVM) was originally developed by Vladimir Vapnik and his team at AT & T Bell Laboratories in 1963. SVMs [35] are supervised learning models that are further associated with learning algorithms used in data analytics and resulting primarily in regression and classification-based analysis. Vapnik proposed a method to create non-linear classifiers by applying kernel-trick to the maximum-margin hyperplanes. SVM gained most of its popularity due to its phenomenal performance in handwriting and pattern recognition. SVM is a machine learning tool based on statistical learning theory. The principal technique behind SVMs is that it tries to map the primal data X into a higher dimensionality feature space termed as F through a non-linear mapping function known as kernel trick. It aims to generate the most optimal/best possible separating hyper plane in the feature space.
Support Vector Regression (SVR) is another supervised learning tool that can be used for estimation of tasks. It is an addition to the widely recognized SVM based classification. In this paper, we applied non-linear SVR to predict the maximum temperature at a location. About 10,000 instances of time series data of maximum temperature at a module-based location is taken for testing. The data is divided into training and test sets where the training set is used to build the SVR model. The model is used to subsequently predict the maximum temperatures at that location and the test set is used to analyze the accuracy of the non-linear SVR model.
Multiple Regression: Multiple regression [35] is a statistical approach used to derive the response of a criterion from different independent variables. It is basically the combination of different features used to decide the effect on the outcome. It describes about the relationship between the inputs and the output. It is an extended model of linear regression. The general mathematical equation for multiple regression is shown as follows:
where, y is the response,
Real world time-series data is gathered from a outdoor location at Berhampur city of Odisha, India. In this work, the dataset contains four features namely Carbon Dioxide (CO2), Humidity, Temperature, and Carbon Monoxide (CO). In addition to that, indexing and time-stamp features are also collated to each of the records. Sensors captures each data record from the environment at an interval of 5 s and the IoT-EMS is synchronized to upload the data readings to the database server at the same rate. In this experiment, we have recorded 10,000 instances of all the parameters.
The real-world databases are vulnerable to noisy and missing data. Therefore, the data is preprocessed using cleaning and transformation of the data. This improves the speed, accuracy, and efficiency of the ML algorithms for analysis. The missing value of any field or record is replaced with the mean of the values for that particular field or record. The data, while being fed to SVM and Multiple Regression algorithms are normalized using Z-score normalization. On contrary, Z-score normalization when applied to MLP and k-NN yields negative values. Therefore, min-max normalization is used which forces the data to be in the range of 0–1.
The system model mainly describes about the design of IoT-EMS and the data gathering part. In this design, a quad band GSM/GPRS SIM800A shield is connected to the Arduino board. This is done by connecting the Tx and Rx pins to digital pins D7 and D8 respectively. For detection of the environmental parameters: CO2, Humidity, Temperature, and CO, the respective sensors are used along with the Arduino and the GSM/GPRS shield to read analog data and convert it into digital readings. A breadboard is used as an interface between GSM/GPRS shield on top of Arduino and the sensors. Vcc and Gnd of all the sensors are common. System model is represented in Fig. 5.
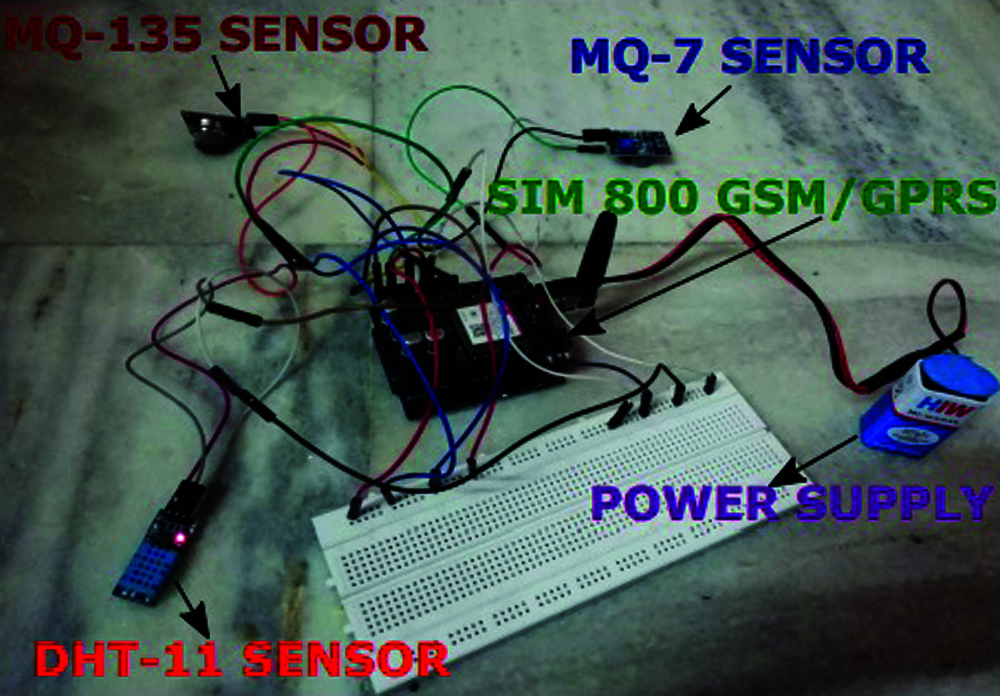
Figure 5: IoT-EMS designed for monitoring the environment
The 5 V pin of GSM/GPRS on top of Arduino is shorted to a row in the breadboard, and the same is done with the Gnd pin. Now Vcc and Gnd pins of each of the sensors are connected to the respective slots in the breadboard. The analog data pin of MQ-135 (reads CO2) is given to A5 analog pin of the GSM/GPRS module. Fig. 5 shows the connection of modules for the design of IoT-EMS and Fig. 6 shows the flowchart of IoT-EMS implementation. Similarly, the data pins of DHT-11 and MQ-7 are fed into A2 and A0 analog pins of the hybrid micro-controller respectively. Two such modules are set-up to be installed at two different geographic locations. A 9 V battery is used to supply power to the model and is connected to the DC jack of the Arduino that powers the GSM/GPRS shield and the requisite sensors. For pushing the data to the web database server, a network bearing Internet enabled GSM card is inserted into the SIM slot of the GSM/GPRS module.
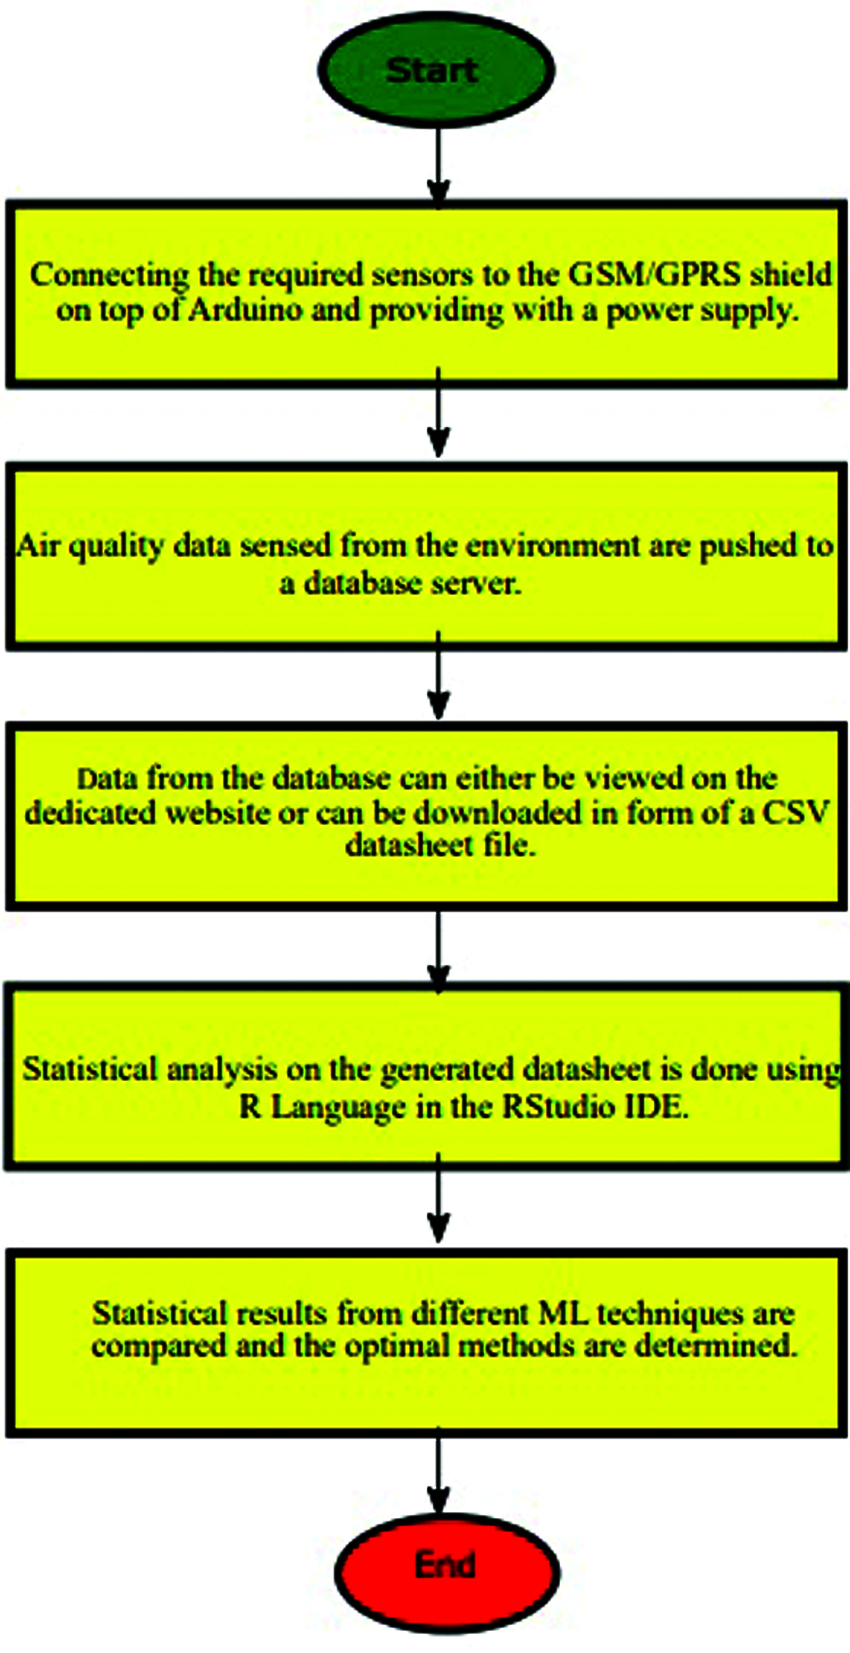
Figure 6: Flowchart of IoT-ESM implementation
For the first time, Arduino application is started on a PC having configuration of 4 GB RAM, Core i3 processor with a clock speed of 1.70 GHz, and 64-bit OS. Respective libraries are imported into the Arduino “libraries” folder and the appropriate sketch is used in the Arduino compiler to verify and execute the program. Upon successful compilation, an embedded C code written for this experimental work is burnt into the bootloader of Arduino and the program starts executing. Analog readings are gathered from the environment by the sensors and the ADC of the micro-controller converts it into digital readings which is displayed in the serial monitor of the Arduino. AT (attention) commands are used in the serial monitor console interface of the Arduino to communicate with the web server using the GSM module via a GPRS network. After connection is established, the data records are uploaded to the web URL of the database server using HTTP GET/POST requests and stored in the MySQL database. For this work, a separate website is developed and is hosted under a domain in the same server where the database resides. Data once collected and stored in the database, it can be easily displayed on the website in a tabular fashion. Access to the website as well as the database server IDE is password protected, and it can be accessed only by authorized personnel. Fig. 7 shows the recording of environment information stored in MySQL database. Algorithm 1 shows the pseudocode for the working of IoT-EMS.
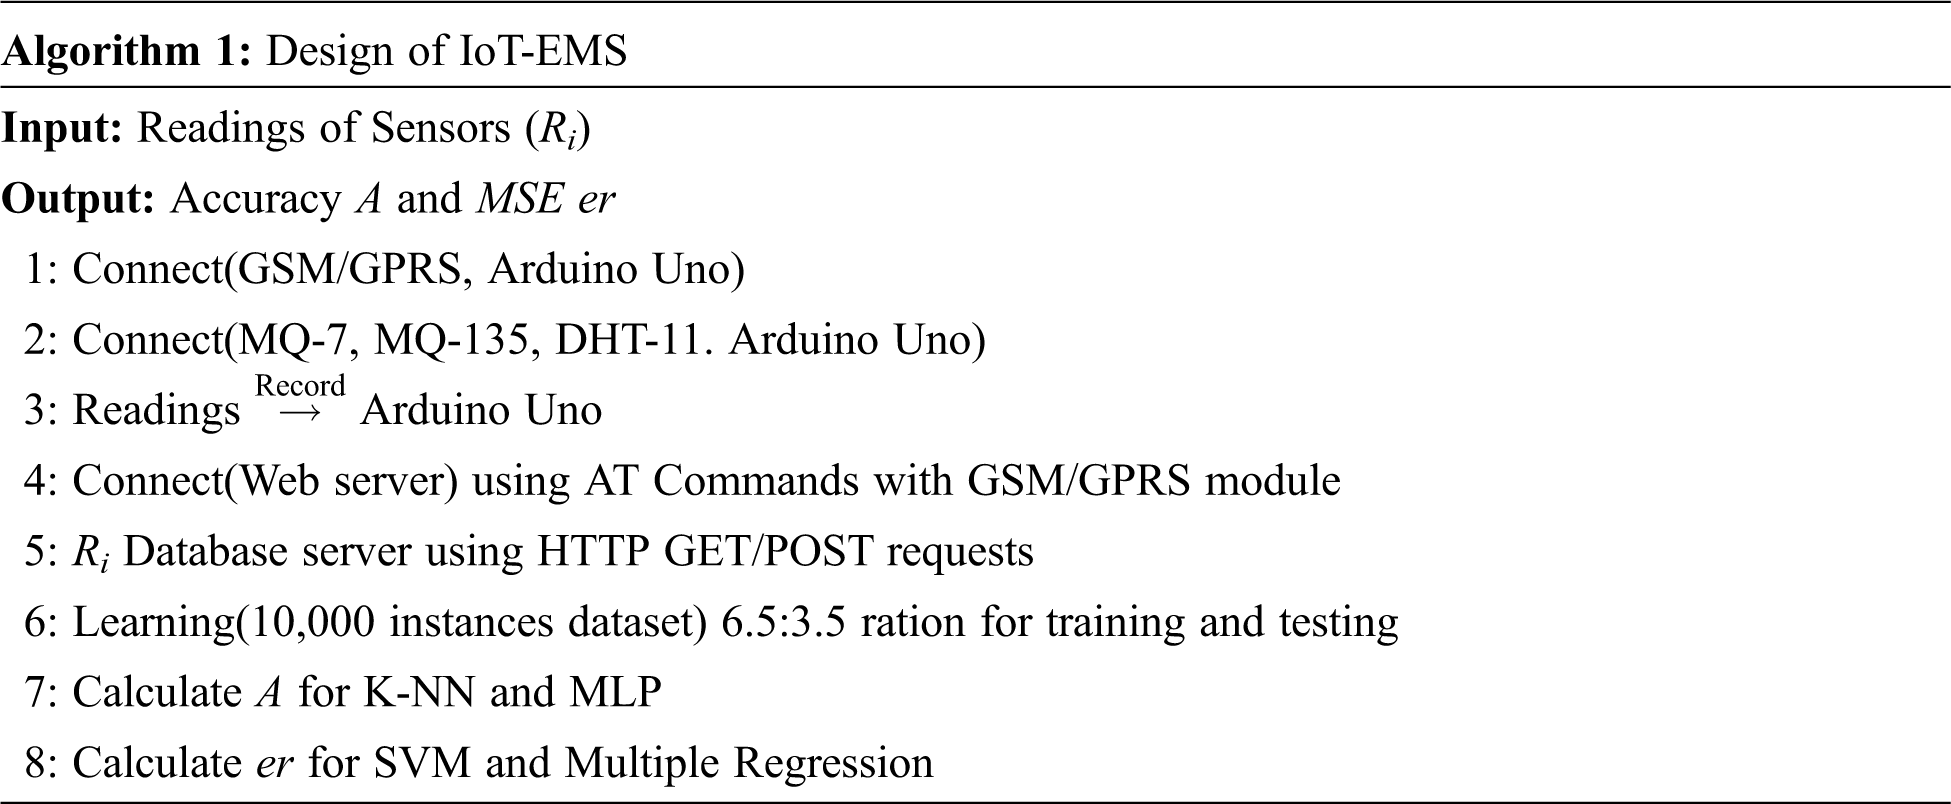
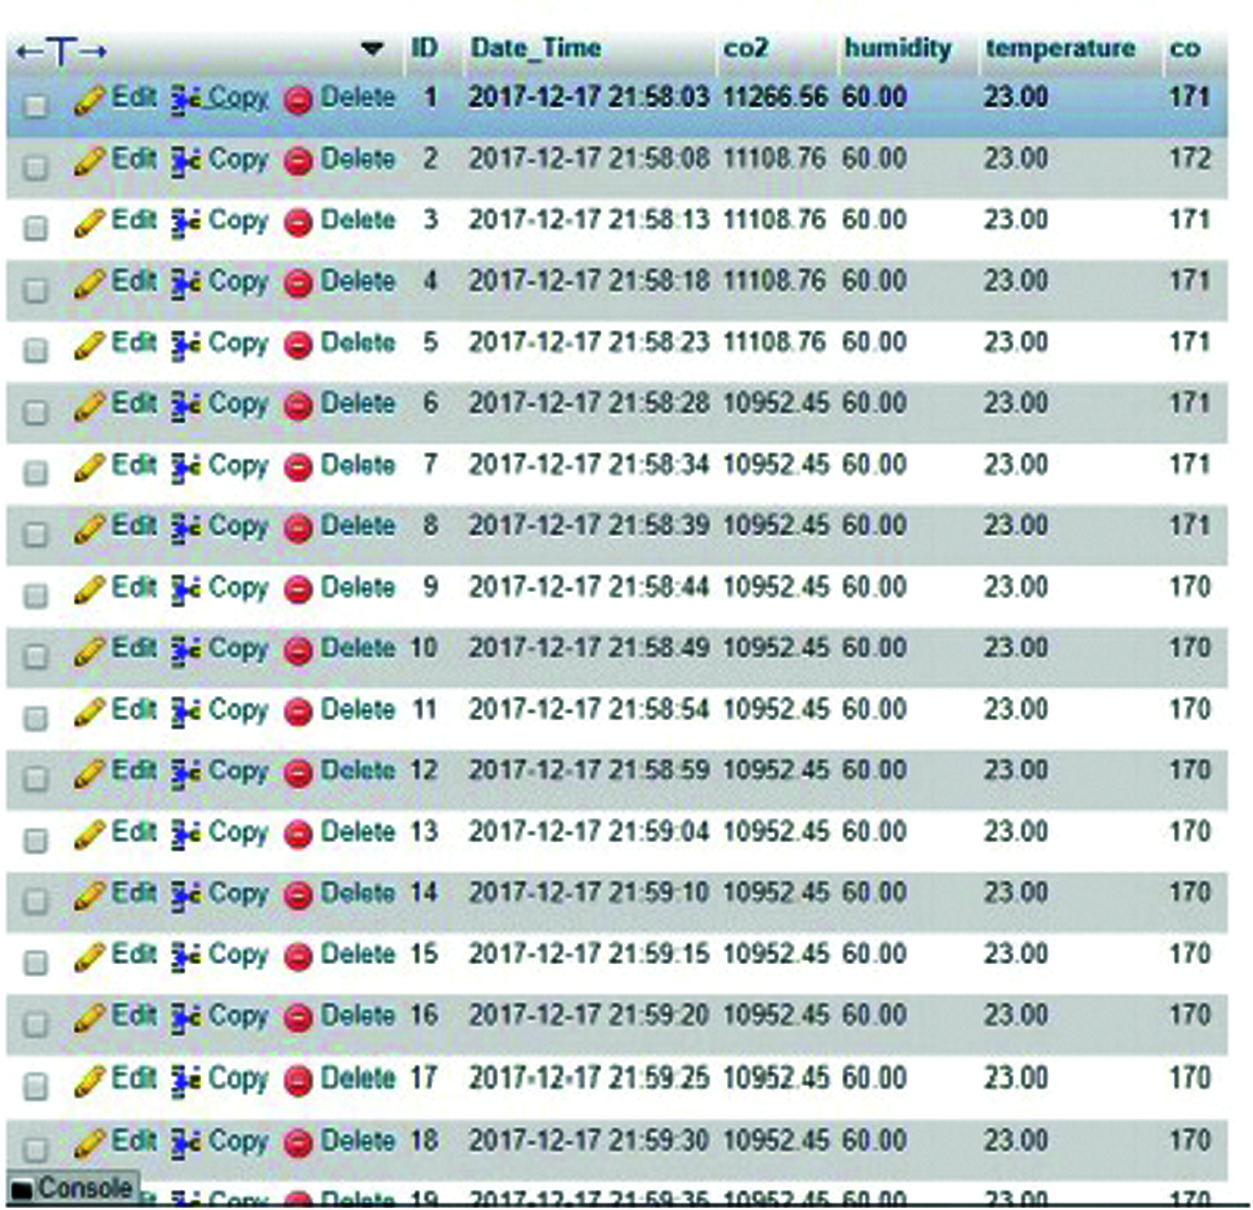
Figure 7: Storing environment information in MySQL database
The algorithms are implemented in the RStudio platform on the generated real-time dataset having 10,000 instances of the environment data. A separate course of action is followed for regression-based algorithms (SVM and Multiple Regression) and for classification-based algorithms (MLP and k-NN). For regression-based algorithms, the dataset is first imported in the RStudio IDE, and if NA values are present then those are omitted. Then the dataset is divided into training and testing data in a 6.5: 3.5 ratio. Then we plot the response variable from the dataset to observe the convergence of data points in the space. The respective libraries are imported for the algorithms to be able to use their corresponding functional formulas. Then we build the algorithm specific model, and then proceed for the hyper parameter tuning. Depending on the tuning results, the best model is selected, and it is used to generate the confusion matrix. From the above results, the Standard Error of the estimate is calculated which is the mean square error (MSE). The mathematical squared root of the MSE gives the root mean square (RMS) value of the error in predictions.
For classification-based algorithms, the above procedure is followed as well with the minor exception of categorizing the data points to separate classes/labels using min-max normalization transformation. For each of the algorithms tested on the dataset, a confusion matrix is obtained. In case of classification-based algorithms, such matrices denoted the accuracy in classifications as well as the misclassification error. In this case, the accuracy is calculated on the basis of classification of temperature data in between the range of 21.5–23.5 degree centigrade. Rest of the data lying outside this range is treated as misclassification error. So, accuracy is denoted by (1-misclassification) error. On the other hand, in regression-based algorithms the confusion matrices denoted the error in prediction of the object with reference to the model as part of the R Language syntax used during analysis. The output generated from the models is denormalized and the performance of the developed models is assessed. MSE is used as a performance metric in this work by generating a trained model, and then ranking the predicted response with the desired response.
The performance of MLP trained with back-propagation algorithm, k-NN, SVM, and multiple regression algorithms for different orders of data in terms of MSE which is depicted in a graph below in Fig. 11. From the obtained results it has been observed that the order of dataset does not have any significant effect on the performance of the algorithms. In classification-based algorithms, k-NN outperforms MLP having an average of about 97% accuracy irrespective of the dataset, whereas MLP has an accuracy of about 64%. Fig. 8 shows the neural network model for the dataset. There are 3 inputs with two processing/hidden layer units and one unit in the output layer. It also mentions the error in classification and the number of epochs in which the process is completed. Fig. 9 shows a confusion matrix of k-NN model. It helps in identifying the misclassification error and in calculating the accuracy in classification. Similarly, in the regression aspect, SVM performs better than multiple regression for all orders of the dataset taken into consideration during the experimentation. SVM classifier has MSE of 0.029, whereas multiple regression has MSE of 1.89. Fig. 10a shows the desired output of SVM. It is the response field i.e., temperature taken from the test data plotted against its index value. Fig. 10b shows the predicted output of SVM as given by the SVM model against the number of observations in the test data, and it is obtained by giving the test data as the object to predict the function. Fig. 10c illustrates the performance of SVM model. The darker shaded regions denote the best performance of the model for the corresponding epsilon and cost parameters. As we move towards the lighter shaded region, the performance of the model is reduced. Fig. 10d shows the expected performance of the multiple regression model in predicting the response variable data where the red line denotes the model fitting meaning accuracy of predictions when compared to the actual test data. The hyper parameter tuning in case of SVR is a special case to observe how and cost parameters affect the performance of the algorithmic predictions. It is very interesting to note that when cost parameter increases the number of support vectors (errors/outliers allowed in observations) decreased and vice-versa. Hence, both cost and error in predictions are inversely related.
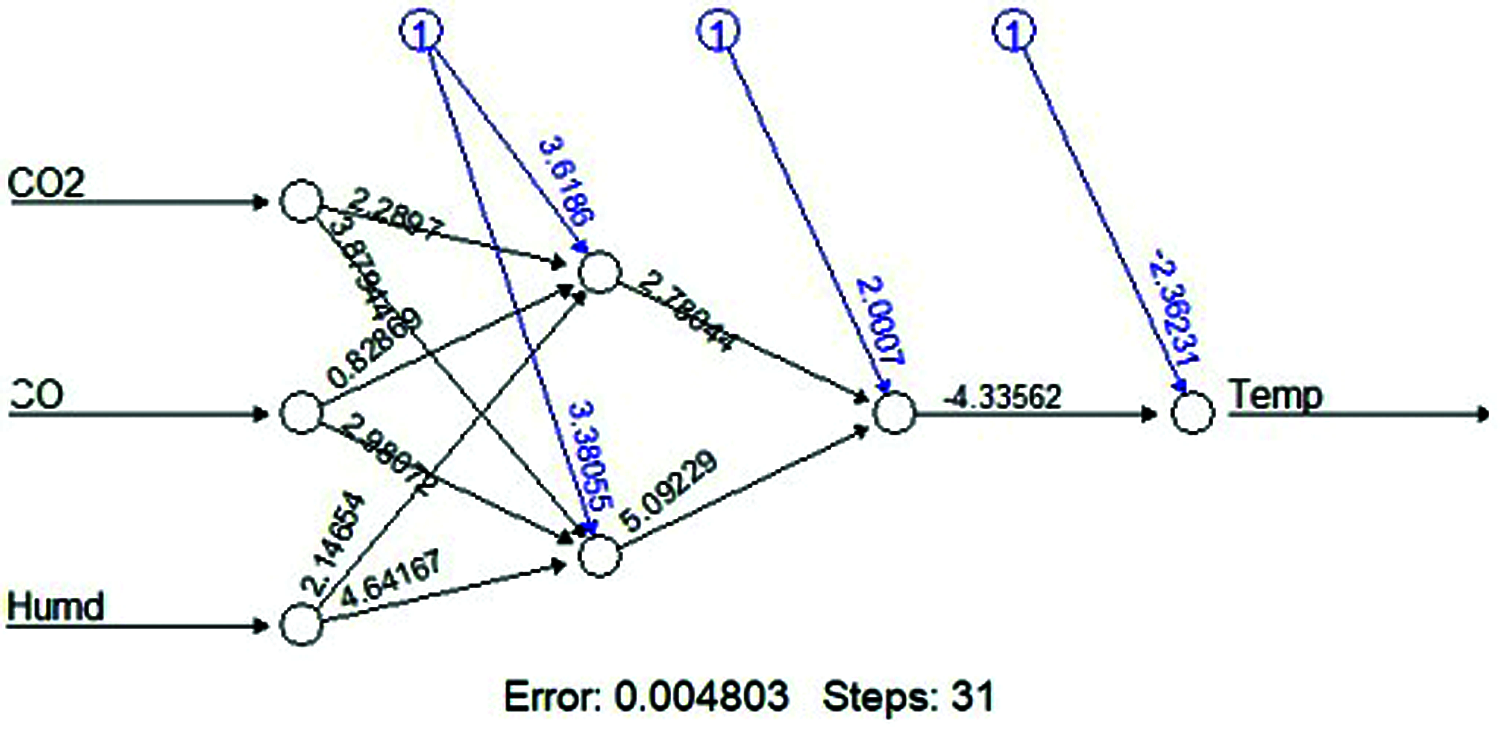
Figure 8: Model of neural network for the dataset
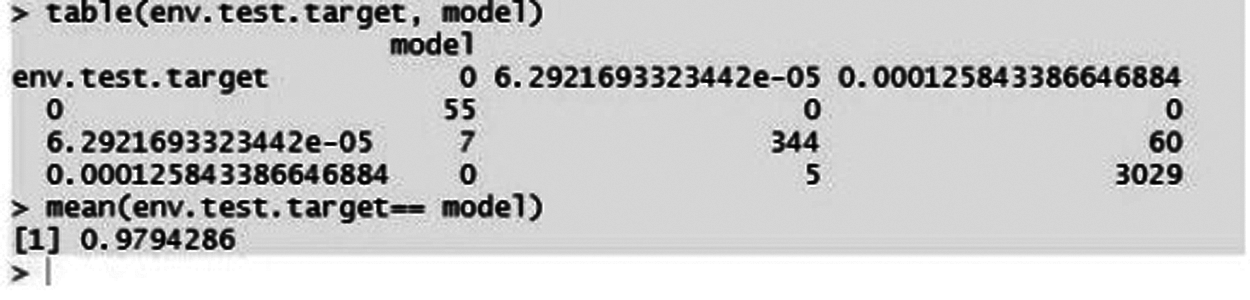
Figure 9: Confusion matrix of k-NN

Figure 10: Performance of SVM and multiple regression classifier a. Actual output of SVM b. Predicted output of SVM c. Performance of SVM d. Output of multiple regression
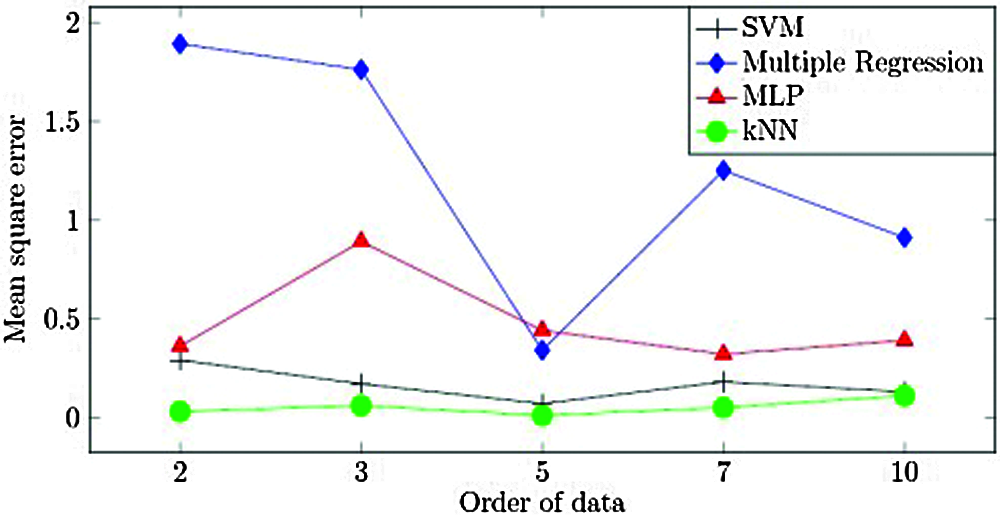
Figure 11: Comparison of errors of different ML techniques
IoT-EMS is a cost-effective environmental monitoring system in volunteer computing environment. It has several potential benefits including remote surveillance, gathering, monitoring, storage, and processing of the data. ML techniques are used for acquiring analytics on the gathered data. Such a multi-processor modular platform is a cost-effective option as compared to traditional physical models and industrial weather forecasting equipment with a much lower installation, operation, and maintenance cost. It is apparent to access the weather data on a larger scale by correctly placing the IoT-EMS at appropriate locations. Therefore, it is a better environment monitoring solution that can be implemented by government and private organizations. Interesting observations are made on comparing the analysis results of the four ML techniques stated in this paper. The overall analysis of the gathered time-series data is divided into classification-based and regression-based analyses. The results of the four models were compared based on the accuracy and the Standard Error of the Estimate. It has been observed that k-NN provides more accuracy in classification (97%) when compared to MLP (64%). However, the training cost of k-NN increases with the size of the dataset. When SVM is compared with multiple regression, the MSE of 0.029 is compared to that of multiple regression is 1.89. These outcomes can be further used to develop a sensor-based model that employs SVM for numeric prediction. As future work, we will deploy the model into a larger environment.
Funding Statement: This work was supported by Taif University Researchers Supporting Project (TURSP) under number (TURSP-2020/73), Taif University, Taif, Saudi Arabia.
Conflicts of Interest: The authors declare that they have no conflicts of interest to report regarding the present study.
1. F. K. Shaikh, Z. Sherali and E. Ernesto, “Enabling technologies for green internet of things,” IEEE Systems Journal, vol. 11, no. 2, pp. 983–994, 2015. [Google Scholar]
2. Z. Hamici and W. A. Elhaija, “Novel current unbalance estimation and diagnosis algorithms for condition monitoring with wireless sensor network and internet of things gateway,” IEEE Transactions on Industrial Informatics, vol. 15, no. 11, pp. 6080–6090, 2019. [Google Scholar]
3. M. Khan, S. Khan, M. Elhoseny, S. H. Ahmed and S. W. Baik, “Efficient fire detection for uncertain surveillance environment,” IEEE Transactions on Industrial Informatics, vol. 15, no. 5, pp. 3113–3122, 2019. [Google Scholar]
4. K. S. Sahoo, D. Puthal, M. Tiwary, M. Usman, B. Sahoo et al., “ESMLB: Efficient switch migration-based load balancing for multicontroller SDN in IoT,” IEEE Internet of Things Journal, vol. 7, no. 7, pp. 5852–5860, 2019. [Google Scholar]
5. S. K. Pande, S. K. Panda, S. Das, K. S. Sahoo, A. K. Luhach et al., “A resource management algorithm for virtual machine migration in vehicular cloud computing,” Computers, Materials & Continua, vol. 67, no. 2, pp. 2647–2663, 2021. [Google Scholar]
6. A. Ahmad, M. Khan, A. Paul, S. Din, M. M. Rathore et al., “Toward modeling and optimization of features selection in Big data based social internet of things,” Future Generation Computer Systems, vol. 82, pp. 715–726, 2018. [Google Scholar]
7. T. K. Hui, R. S. Sherratt and D. D. Sánchez, “Major requirements for building smart homes in smart cities based on internet of things technologie,” Future Generation Computer Systems, vol. 76, pp. 358–369, 2017. [Google Scholar]
8. J. Jin, J. Gubbi, S. Marusic and M. Palaniswami, “An information framework for creating a smart city through internet of things,” IEEE Internet of Things Journal, vol. 1, no. 2, pp. 112–121, 2014. [Google Scholar]
9. X. Luo, J. Liu, D. Zhang and X. Chang, “A large-scale web QoS prediction scheme for the industrial internet of things based on a kernel machine learning algorithm,” Computer Networks, vol. 101, pp. 81–89, 2016. [Google Scholar]
10. F. Chen, P. Deng, J. Wan, D. Zhang, A. V. Vasilakos et al., “Data mining for the internet of things: Literature review and challenges,” International Journal of Distributed Sensor Networks, vol. 11, no. 8, pp. 431047, 2015. [Google Scholar]
11. M. M. Rathore, A. Ahmad, A. Paul, S. Rho, “Urban planning and building smart cities based on the internet of things using big data analytics,” Computer Networks, vol. 101, pp. 63–80, 2016. [Google Scholar]
12. P. Li, Z. Chen, L. T. Yang, Q. Zhang and M. J. Deen, “Deep convolutional computation model for feature learning on big data in internet of things,” IEEE Transactions on Industrial Informatics, vol. 14, no. 2, pp. 790–798, 2017. [Google Scholar]
13. H. Li, K. Ota and M. Dong, “Learning IoT in edge: Deep learning for the internet of things with edge computing,” IEEE Network, vol. 32, no. 1, pp. 96–101, 2018. [Google Scholar]
14. C. Aldrich and L. Auret, Unsupervised Process Monitoring and Fault Diagnosis with Machine Learning Methods, 1st edition. London: Springer, pp. XIX–374, 2013. [Google Scholar]
15. G. Madhu, A. Govardhan, B. S. Srinivas, K. S. Sahoo, N. Z. Jhanjhi et al., “Imperative dynamic routing between capsules network for malaria classification,” CMC-Computers, Materials & Continua, vol. 68, no. 1, pp. 903–919, 2021. [Google Scholar]
16. B. Ali, M. A. Pasha, S. ul Islam, H. Song and R. Buyya, “A volunteer-supported Fog computing environment for delay-sensitive IoT applications,” IEEE Internet of Things Journal, vol. 8, no. 5, pp. 3822–3830, 2020. [Google Scholar]
17. R. P. Nayak, S. Sethi, S. K. Bhoi, K. S. Sahoo, N. Z. Jhanjhi et al., “TBDDosa-MD: Trust-based DDoS misbehave detection approach in software-defined vehicular network (SDVN),” CMC-Computers, Materials & Continua, vol. 69, no. 3, pp. 3513–3529, 2021. [Google Scholar]
18. M. T. Zhou, F. G. Shen, T. F. and X. Y. Heng, “Blockchain-based volunteer edge cloud for IoT applications,” in IEEE 93rd Vehicular Technology Conf. (VTC2021-SpringVirtual conference, pp. 1–6, 2021. [Google Scholar]
19. J. A. Gómez, J. Talavera, L. E. Tobón, M. A. Culman, L. A. Quiroz et al., “A case study on monitoring and geolocation of noise in urban environments using the internet of things,” in Proc. of the Second Int. Conf. on Internet of Things, Data and Cloud Computing, Cambridge, United Kingdom, pp. 1–6, 2017. [Google Scholar]
20. K. Pandey, B. Basu and S. Karmakar, “Systematic indoor room temperature forecasting for smart buildings using machine learning,” in Proc. of 3rd Int. Conf. on Internet of Things and Connected Technologies (ICIoTCTMNIT, Jaipur, India, pp. 26–27, 2018. [Google Scholar]
21. S. Fang, L. D. Xu, Y. Zhu, J. Ahati, H. Pei et al., “An integrated system for regional environmental monitoring and management based on internet of things,” IEEE Transactions on Industrial Informatics, vol. 10, no. 2, pp. 1596–1605, 2014. [Google Scholar]
22. B. S. Rao, K. S., Rao and N. Ome, “Internet of things (IoT) based weather monitoring system,” International Journal of Advanced Research in Computer and Communication Engineering, vol. 5, no. 9, pp. 312–319, 2016. [Google Scholar]
23. M. Holmstrom, D. Liu and C. Co, “Machine learning applied to weather forecasting,” Meteorological Applications, pp. 1–5, 2016. [Google Scholar]
24. Y. Radhika and M. Shashi, “Atmospheric temperature prediction using support vector machines,” International Journal of Computer Theory and Engineering, vol. 1, no. 1, pp. 55, 2009. [Google Scholar]
25. T. Rao, N. Rajasekhar and T. V. Rajinikanth, “An efficient approach for weather forecasting using support vector machines,” In Proceedings on Computer Science and Information Technology (IPCSIT), vol. 47, pp. 208–212, 2012. [Google Scholar]
26. J. Yun and K. H. Won, “Building environment analysis based on temperature and humidity for smart energy systems,” Sensors, vol. 12, no. 10, pp. 13458–13470, 2012. [Google Scholar]
27. C. Xiaojun, L. Xianpeng and X. Peng, “IOT-Based air pollution monitoring and forecasting system,” in 2015 Int. Conf. on Computer and Computational Sciences (ICCCSIEEE, Greater Noida, India, pp. 257–260, 2015. [Google Scholar]
28. S. Saad, A. M. Andrew, A. Y. Md Shakaff, M. A. Mat Dzahir, M. Hussein et al., “Pollutant recognition based on supervised machine learning for indoor air quality monitoring systems,” Applied Sciences, vol. 7, no. 8, pp. 823, 2017. [Google Scholar]
29. 2018 (accessed in February 2018). [Online]. https://store.arduino.cc/usa/arduino-uno-rev3. [Google Scholar]
30. 2018 (accessed in February 2018). [Online]. http://www.mt-system.ru/sites/default/files/documents/sim800\_hardware\_design\_v1.09.pdf. [Google Scholar]
31. 2018 (accessed in February 2018). [Online]. http://akizukidenshi.com/download/ds/aosong/DHT11.pdf. [Google Scholar]
32. 2018 (accessed in February 2018). [Online]. https://www.sparkfun.com/datasheets/Sensors/Biometric/MQ-7.pdf. [Google Scholar]
33. 2018 (accessed in February 2018). [Online]. https://www.olimex.com/Products/Components/Sensors/SNS-MQ135/resources/SNS-MQ135.pdf. [Google Scholar]
34. M. A. Alsheikh, S. Lin, D. Niyato and H. P. Tan, “Machine learning in wireless sensor networks: Algorithms, strategies, and applications,” IEEE Communications Surveys & Tutorials, vol. 16, no. 4, pp. 1996–2018, 2014. [Google Scholar]
35. K. S. Sahoo, B. K. Tripathy, K. Naik, S. Ramasubbareddy, B. Balusamy et al., “An evolutionary SVM model for DDOS attack detection in software defined networks,” IEEE Access, vol. 8, pp. 132502–132513, 2020. [Google Scholar]
 | This work is licensed under a Creative Commons Attribution 4.0 International License, which permits unrestricted use, distribution, and reproduction in any medium, provided the original work is properly cited. |