DOI:10.32604/iasc.2022.022559
| Intelligent Automation & Soft Computing DOI:10.32604/iasc.2022.022559 | |
| Article |
Covid-19 Symptoms Periods Detection Using Transfer-Learning Techniques
1Computer Sciences Program, Turabah University College, Taif University, P. O. Box 11099, Taif 21944, Saudi Arabia
2College of Applied Computer Sciences, King Saud University, Riyadh, P. O. Box 11451, Saudi Arabia
3Artificial Intelligence Center of Advanced Studies (Thakaa), King Saud University, Riyadh, P. O. Box 145111, Saudi Arabia
4Department of Computer Engineering, College of Computer and Information Sciences, King Saud University, Riyadh, 11543, Saudi Arabia
5Department of Information Technology, College of Computer and Information Science, King Saud University, Riyadh, 11543, Saudi Arabia
*Corresponding Author: Mohammed Faisal. Email: Mfaisal@ksu.edu.sa
Received: 11 August 2021; Accepted: 25 October 2021
Abstract: The inflationary illness caused by extreme acute respiratory syndrome coronavirus in 2019 (COVID-19) is an infectious and deadly disease. COVID-19 was first found in Wuhan, China, in December 2019, and has since spread worldwide. Globally, there have been more than 198 M cases and over 4.22 M deaths, as of the first of Augest, 2021. Therefore, an automated and fast diagnosis system needs to be introduced as a simple, alternative diagnosis choice to avoid the spread of COVID-19. The main contributions of this research are 1) the COVID-19 Period Detection System (CPDS), that used to detect the symptoms periods or classes, i.e., healthy period, which mean the no COVID19, the period of the first six days of symptoms (i.e., COVID-19 positive cases from day 1 to day 6), and the third period of infection more than six days of symptoms (i.e., COVID-19 positive cases from day 6 and more): 2) the COVID19 Detection System (CDS) that used to determine if the X-ray images normal, i.e., healthy case or infected, i.e., COVID-19 positive cases; 3) the collection of database consists of three different categories or groups based on the basis of time interval of offset of Symptoms. For CPDS, the VGG-19 perform to 96% accuracy, 90% F1 score, 91% average precision, and 91% average recall. For CDS, the VGG-19 perform to 100% accuracy, 99% F1 score, 100% average precision, and 99% average recall.
Keywords: COVID19 symptoms period detection; deep learning; diagnosis system; transfer-learning
In December 2019, there was a massive outbreak of casualties because of the new virus in China [1,2], which caused chronic respiratory disorder and even fatal acute respiratory distress syndrome (ARDS) [3]. This novel virus has been named as Coronavirus disease (COVID-19) by the World Health Organisation (WHO) and SARS-CoV-2 by the International Committee on Virus Taxonomy (ICTV) [4]. Human-to-human transmission was confirmed [5,6], and the continuous movement of people from one place to another in China led to its wide spread, with a high death rate. Till first of Augest, 2021 around 198 M positive COVID-19 cases were confirmed worldwide. Furthermore many studies showed the export of this novel virus to other parts of the world. Considering the possibility of further transmission of COVID-19, on January 30, 2020, WHO declared a Public Health Emergency. Although PCR is considered a standard diagnosis for COVID-19, very restricted supply and stringent laboratory requirements hinder the correct diagnosis of suspected patients, posing unparalleled difficulties in stopping the spread of the infection. Through integrating patient health symptoms and indicators with recent location, travel history, and laboratory tests, chest-based computed tomography (CT), which can allow rapid diagnosis in clinical practice as soon as possible, is a quicker and simpler approach for clinical diagnosis of COVID-19. In a term, chest R-ray and CT are a crucial diagnosis factor for hospitalized patients, with many recent studies detailing its aspects [1,7–10]. Since AI and machine learning (ML) scientists have been eagerly searching and waiting around the world for real-time data produced by this pandemic, it is extremely important to deliver COVID-1 period9 patient data in a timely manner, such as physiological characteristics and therapeutic outcomes of COVID-19 patients, followed by subsequent data transformation for easy access [2]. Fig. 1 is a schematic representation of the workflow, but there are several steps in the process that currently limit the application of machine learning and artificial intelligence to face the COVID-19. Availability of COVID-19-related clinical data, which can be managed and processed into easily accessible databases, is a key current barrier. Therefore, development of cyber-infrastructure to fuel world-wide collaborations is important [2].
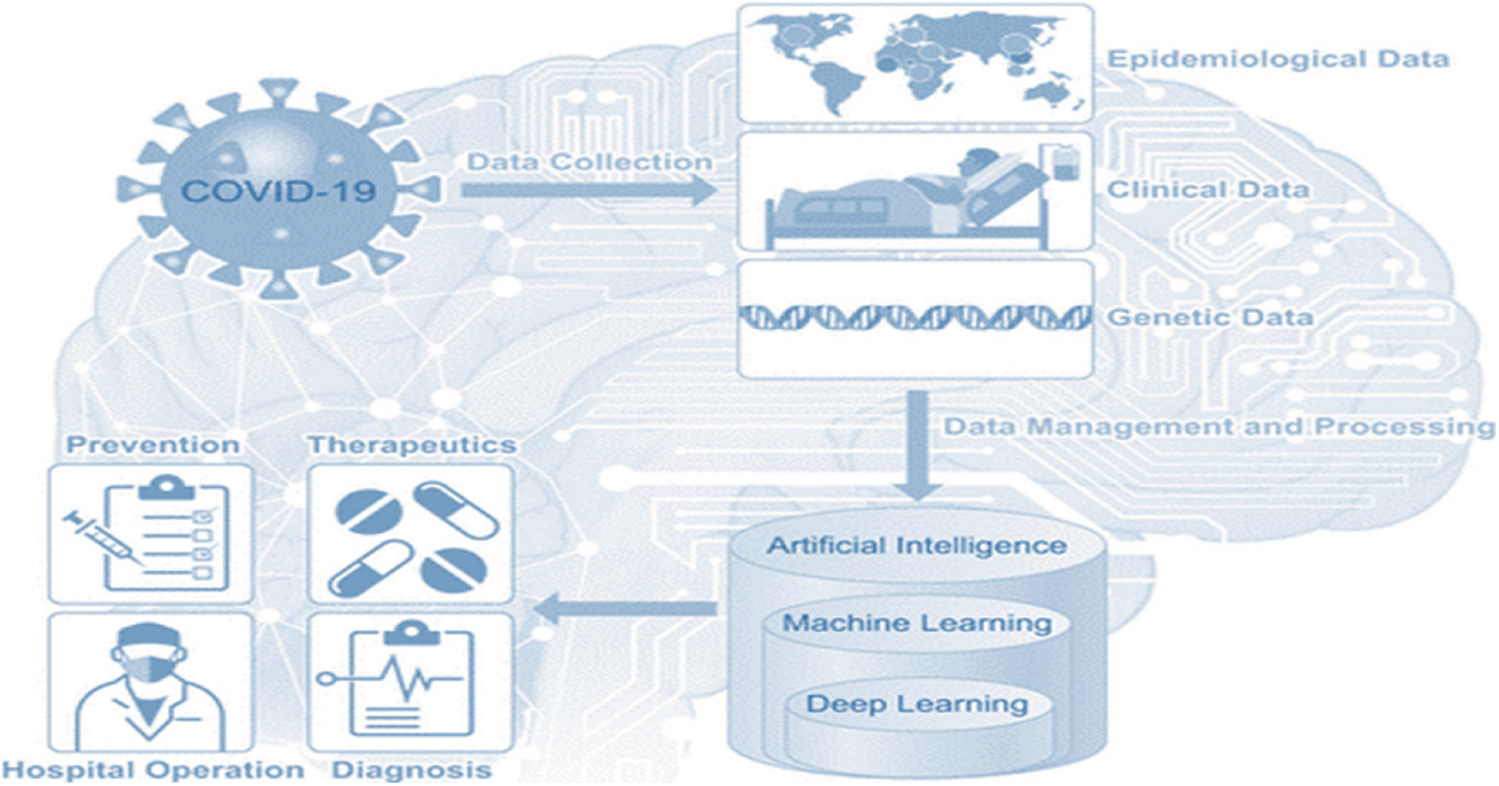
Figure 1: COVID-19 MI and ML map
To help in fighting the COVID-19 epidemic, scientists and researchers are used the AI in general and DL in specific [11–16]. DL is a common AI research field that used to product an end-to-end models to accomplish a promising results in related to COVID-19. The motivations of this research are 1) to help to overcoming the COVID-19 pandemic; 2) to introduce an automated COVID-19 period detection system; 3) to enhance the accuracy of existing diagnosis systems using the proposed CDS (see Section 5, Result and Comparison): 4) to collect a database consists of three different categories or groups based on the basis of time interval of offset of Symptoms. Therefore, in this study, we aim to introduce an accurate COVID-19 period detection and diagnosis systems using transfer-learning (TL) techniques.
The rest of this paper is structured as follows. The literature review are listed in Section 2. Section 3 illustrated the created Dataset. The proposed methodology, with a description of the selected CNN architecture. Are presented in Section 4, and Section 5 will illustrate the results and the comparisons of the two proposed systems in different metrics and section 6 will provides the conclusion.
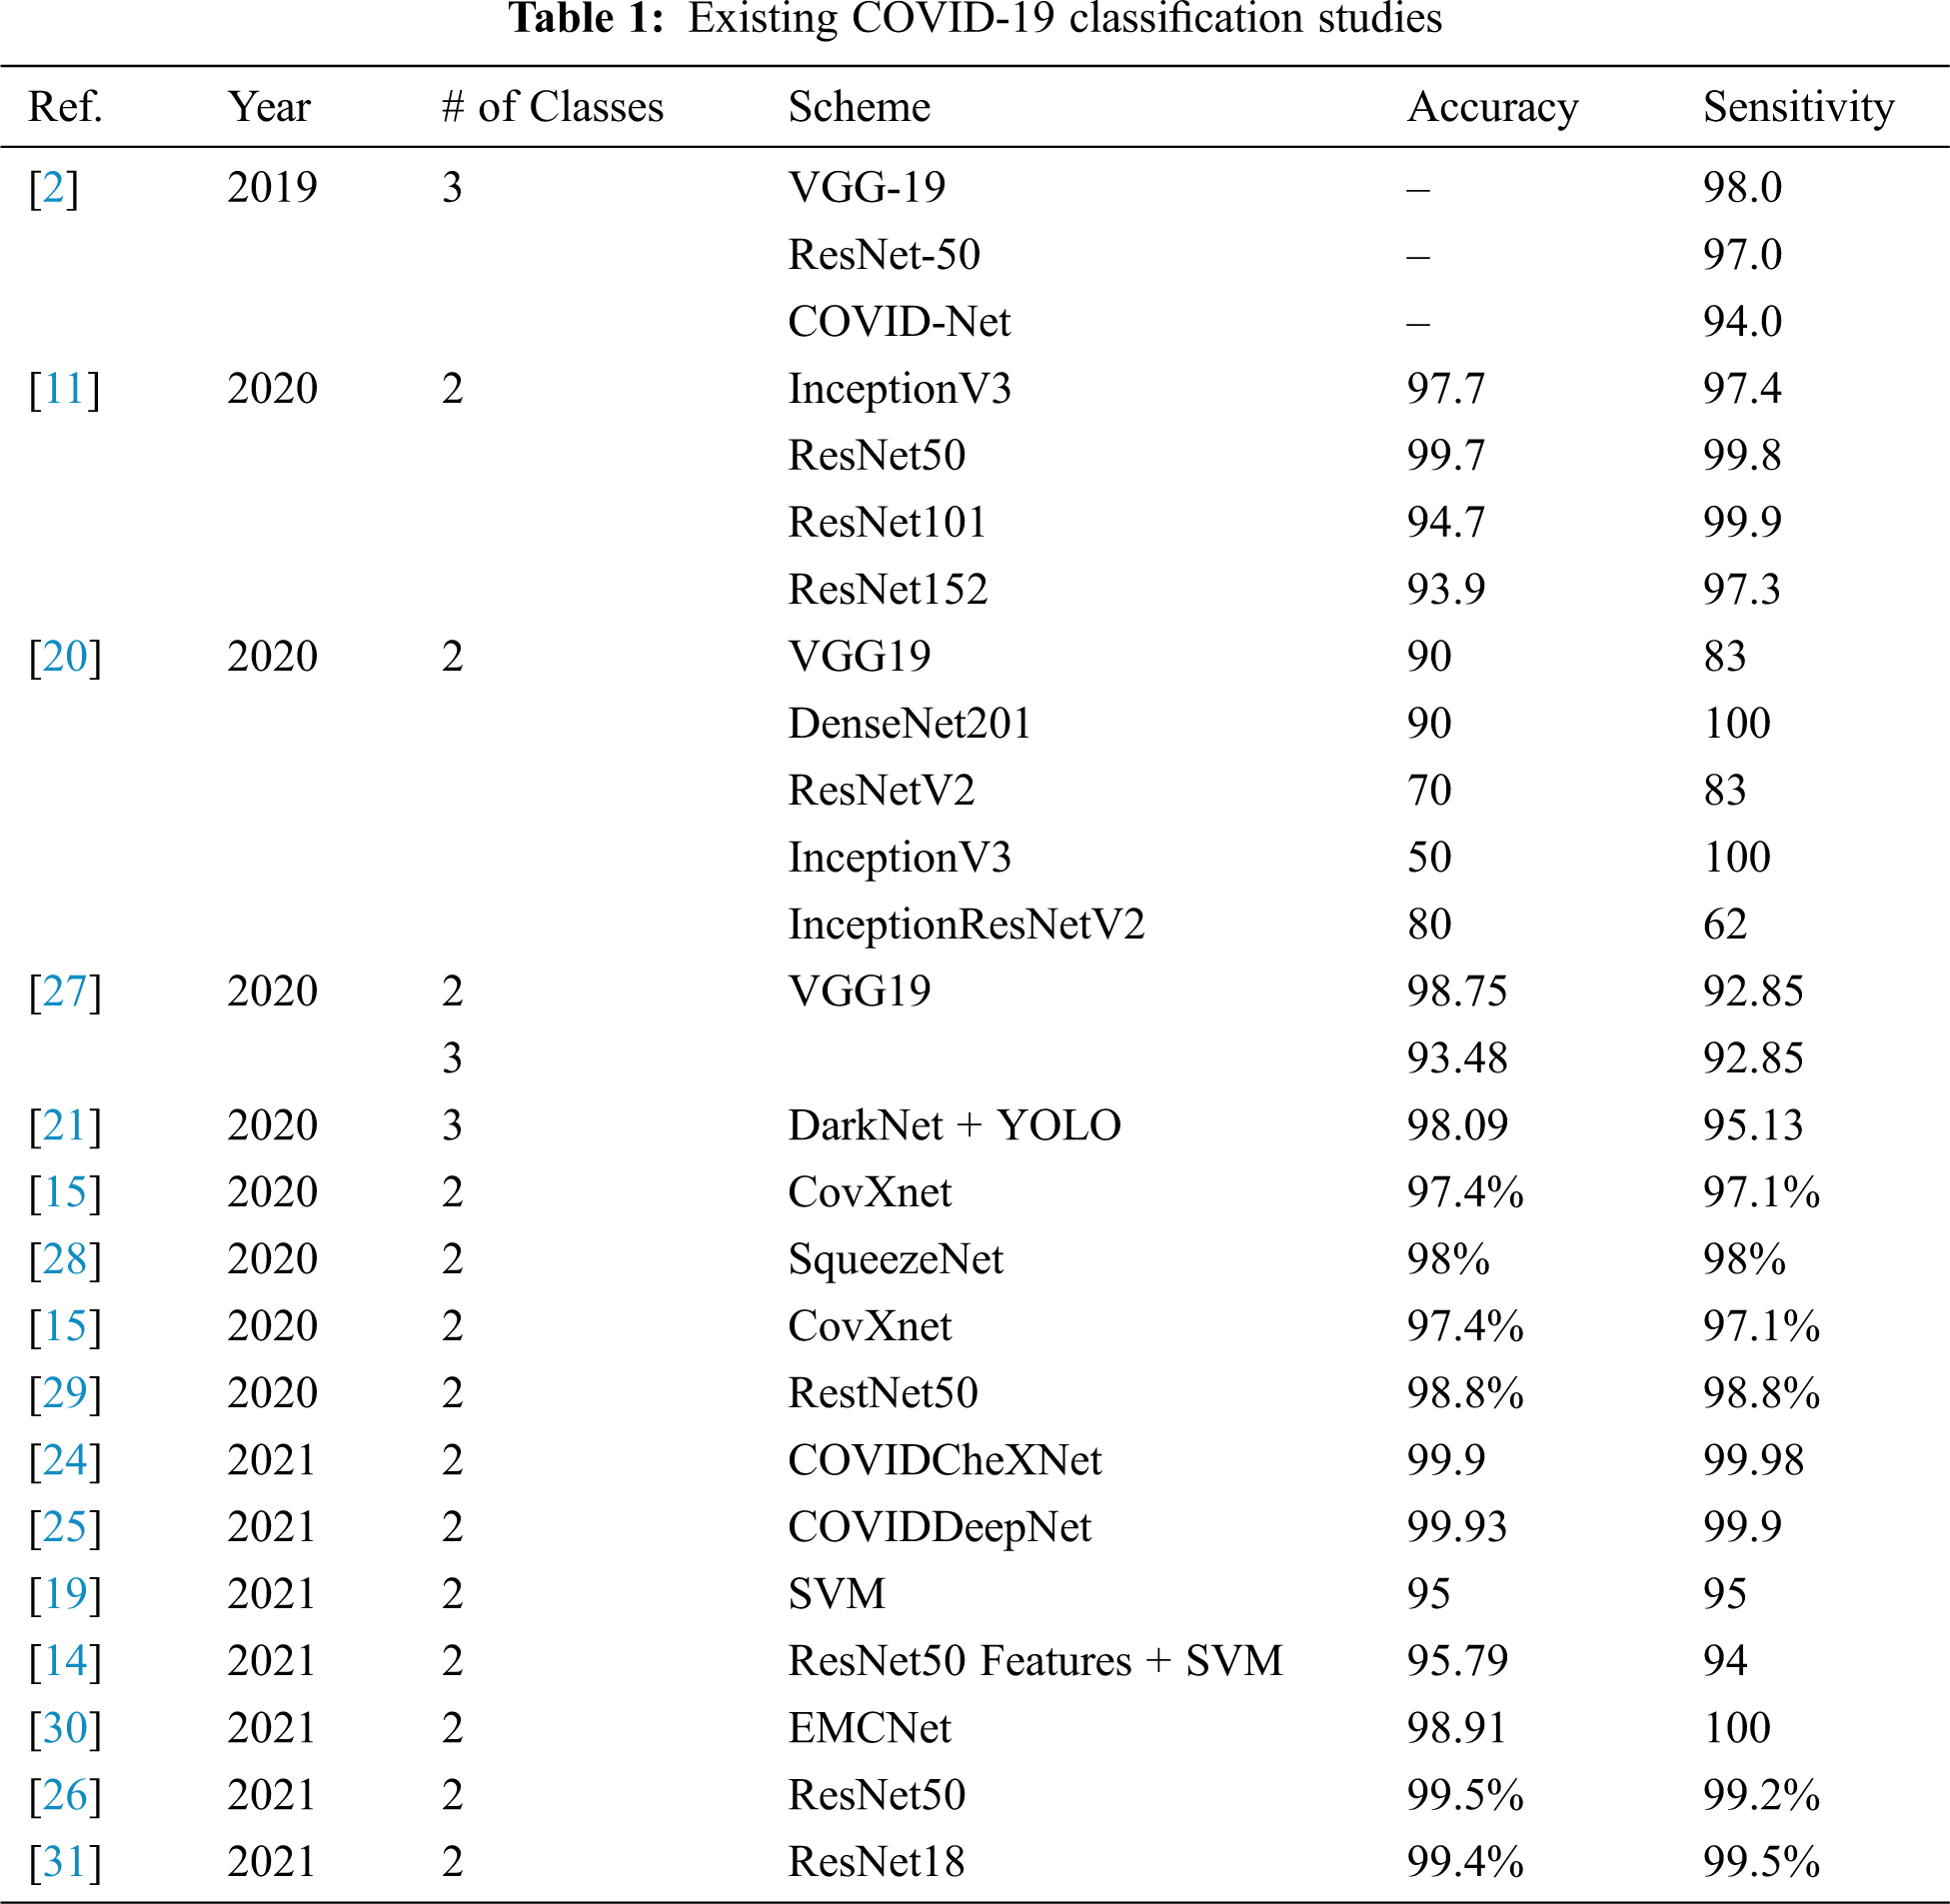
Nowadays, scientists and researchers used the ML and DL in many applications to help in fighting the COVID-19 epidemic. DL is a common AI research field that used to develop an end-to-end models to accomplish a promising results in related to COVID-19. Jain et al. [17] introduce a of DL models for COVID-19, normal, and pneumonia classifications. They used Inception V3, Xception, and ResNeXt models. They achieved an accuracy of 97%, 96%, and 93% for Xception, Inception V3, and ResNeXt respectively. A system called COVID-Xnet was introduced by Lopez et al. [18] to diagnose the COVID-19 disease using X-ray and medical imaging techniques. The COVID-Xnet achieved an accuracy of 94.43% and an AUC of 98.8. Another study by Narin et al. [11] used five CNN-based models (ResNet50, ResNet101, ResNet152, InceptionV3, and Inception-ResNetV2) for COVID-19 detection using chest X-ray. They achieved an accuracy of 96.1% using ResNet50 model for COVID-19 and Normal and 83.5% for F1. For COVID-19 and virus pneumonia they achieved an accuracy of 99.5% and 98.7% of F1. For COVID-19 and Bacterial pneumonia they achieved an accuracy of 99.7% and 98.5% of F1. In 2021, Abdulkareem et al. [19] proposed a model based on Support Vector Machine (SVM)., Naive Bayes (NB), and Random Forest (RF) and Internet of Things (IoT) to diagnose patients with COVID-19 in smart hospitals. The proposed system achieved an accuracy of 95% with SVM model. In [12], deep learning algorithms are used to predict COVID-19, normal, and pneumonia using Chest X-ray images. The Random Forest model generated the best results, with an accuracy of 97.3%. Another study [20] developed DL models called COVIDx-Net to diagnose COVID-19 cases using chest X-rays. Another study [21] proposed model based on the DarkNet method. Kadry et al. [13] proposed a ML system to detect COVID-19 infection using CT scan images, they used Naive Bayes (NB), k-Nearest Neighbors (KNN), Decision Tree (DT), Random Forest (RF), and SVM with linear kernel. They achieved an accuracy of 89.8 using SVM with Fused-Feature-Vector (FFV). There are more recent researches on COVID-19 classification using various ML models with X-Ray or CT-scan images [22]. Study in [23] developed a DL model named COVIDx and a dataset named COVIDx with a total of 16,756 X-Ray images [23]. Another study proposed ML models to classify the COVID-19 using X-Ray. The study showed that ResNet50 with the SVM classifier produces better results [11]. Al-Waisy et al. [24] developed a COVID19 recognition system called COVIDCheXNet and achieved an accuracy of 99.99%, and sensitivity of 99.98%. In addition, In 2021, Al-Waisy et al. [25] proposed another COVID19 classification system named COVID-DeepNet based on ML. Ismael et al. [14] used Dl models to classify COVID-19 using chest X-ray images. They achieved an accuracy of 94.7% with ResNet50 model and SVM classifier with the linear kernel function. A recent study by Faisal et al. [26] proposed COVID-19 diagnosis systems using two datasets of X-Ray images and VGG-19, NASNet, and MobileNet2. Their proposed diagnosis systems achieve an accuracy of 99.5% for two classes and 98.4% three-classes. Tab. 1 illustrates several COVID-19 classification methods, and the accuracy achieved.
According to our best knowledge, most available COVID-19 detection systems used to detect or classify the cases to either COVID-19, viral pneumonia, or normal cases, cases are mentioned above. Our contribution to the literature is that, the proposed CPDS system used to classify X-ray images into three periods or classes, i.e., healthy period, the period of the first six days of infection, and the third period of infection more than six days. This system detedcts patients whether they are symptomatic (showing symptoms) or asymptomatic (showing no symptoms). This will help health providers to stop the spreed of COVID-19 by self-isolating symptomatic and to provide appropriate treatment for asymptomatic as early as possible to prevent sever symptoms and death.
As dataset is the first step to develop any ML tool, in this research, we have collected the dataset from various published articles of COVID 19 Cases and databases, which are available publicly or on subscription bases and consist of Chest X Ray images of patients which are positive or suspected of COVID-19. In this research, we have collected the Chest X Ray images as radiological imaging has a fundamental role in the diagnostic process, management, and follow-up.
The collected database consists of three different categories or groups based on the basis of time interval of offset of Symptoms. Group A (Normal Patients), Group B (Patients of 0–6 days offset of symptoms) and Group C (Patients of 6 or more days offset of symptoms).
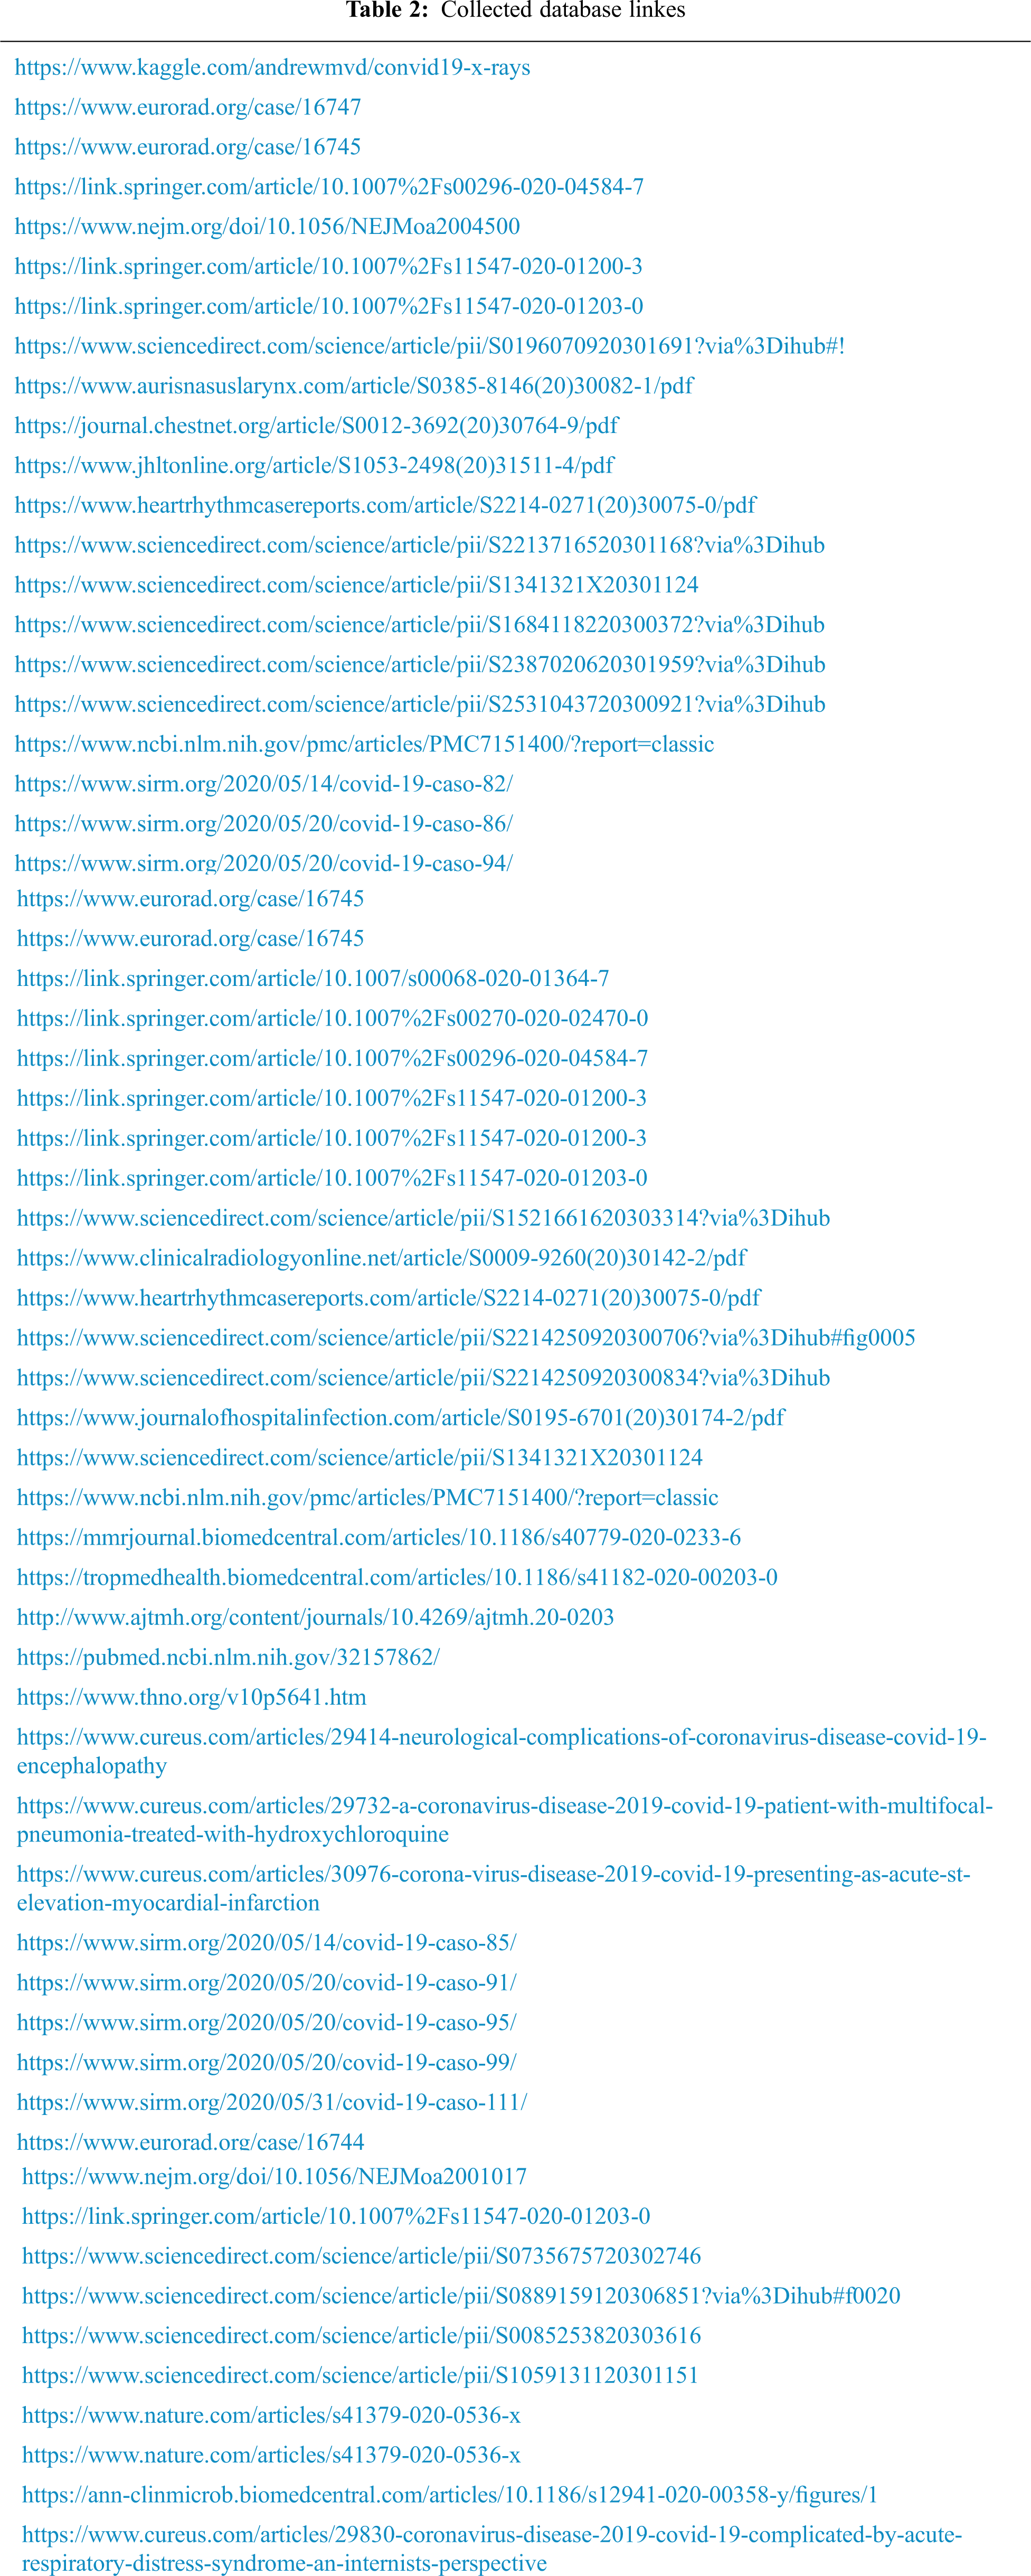
We have collected data of 2121 patients 1845 X-ray images belong to Group A, 146 X-ray images belong to Group B, and 130 X-ray images belong to Group C. The X-ray images have been collected from various published articles of COVID 19 Cases and databases (Tab. 2), such as, published articles of Eurorad, which is a peer-reviewed database of radiological case reports, provided and operated by the European Society of Radiology (ESR), published articles of Springer Link. published articles of SIRM which is Italian Society of Medical and Interventional Radiology, published articles from National Center for Biotechnology Information (NCBI), published articles of Science Direct. published articles of Cureus Journal which is an open access general medical journal, published articles of Heart Rhythm journal which is a peer-reviewed medical journal published by Elsevier. Journal of Tropical Medicine and Hygiene (AJTMH) journal, published articles of New England Journal of Medicine (NEJM), published articles of Auris Nasus Larynx journal, and available dataset [28].
This the healthy period or group, which mean the X-ray image the patient has no COVID-19 infection. In this group, we have total of 1845 X-ray images. Fig. 2 shows samples of chest X-ray images of Group A.
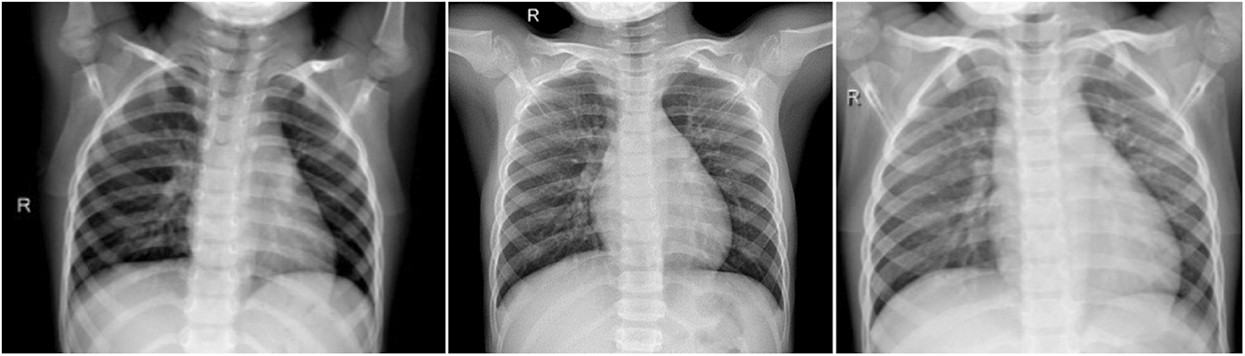
Figure 2: Chest X-ray images of Group A (no infection)
3.2 Group B (Patients of 0–6 Days Offset of Symptoms)
In this group, we have total 146 cases are considered as they belong to 0–6 day’s offsets of symptoms. It means, Group B belong to the period of the first six days of, Fig. 4 shows Chest X Ray Images of Group B.
In this group, there are 66% male patients and 34% are female Patients. The average age was 62 years (range 21–93 years). Among the common symptoms in this group 53% COVID 19 cases have fever, 27% COVID 19 cases have cough, 8% COVID 19 cases have shortness of breath, 9% COVID 19 cases have sore throat and 3% COVID 19 cases have diarrhoea. Fig. 3, illustrates the clinical characteristics of Group B.
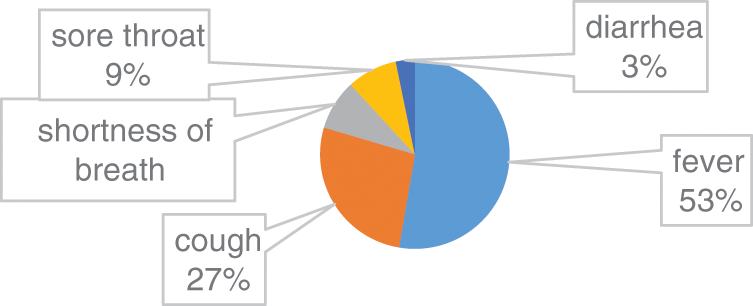
Figure 3: Clinical characteristics of Group B
Fig. 5 illustrates an 80-year-old male belong to Group B, patients of 0–6 days offset of symptoms. He admitted the emergency with complaints of fatigue, confusion, and dry cough. The cough was described as dry with occasional greenish sputum associated with shortness of breath, sore throat, and chills but no fevers [32]. His vital signs display a blood pressure of 102/45 mmHg, a heart rate (HR) of 110 beats per minute (BPM), and a respiratory rate of 18 breaths per minute. Intravenous steroids were administered, and the patient was moved to the intensive care unit (ICU).
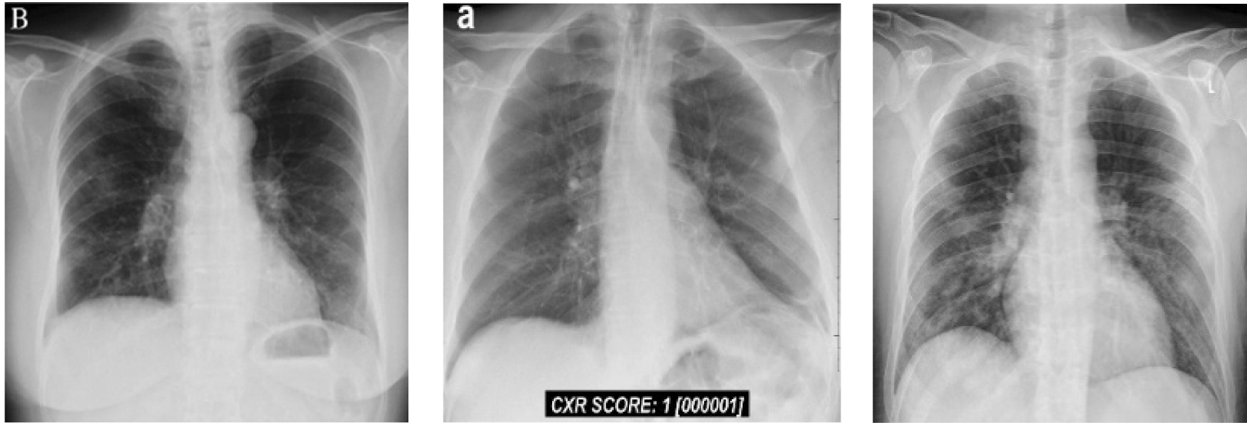
Figure 4: Chest X-ray images of Group B (patients of 0–6 days offset of symptoms)
3.3 Group C (Patients of More 6 Days Offset of Symptoms)
In this group, we have total 130 COVID 19 cases are considered as they belong to 6 or more day’s offsets of symptoms. This Dataset is a subset of dataset which is collected for conducting this research and belongs to COVID 19 Cases of patients which are positive or suspected of COVID-19. Fig. 6 shows Chest X-ray images of Group C.
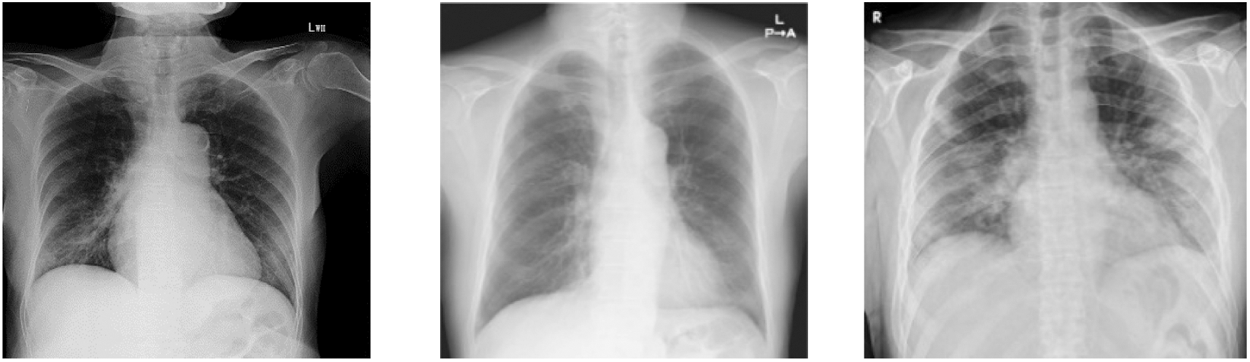
Figure 5: Chest X ray images of Group C (patients of more 6 days offset of symptoms)
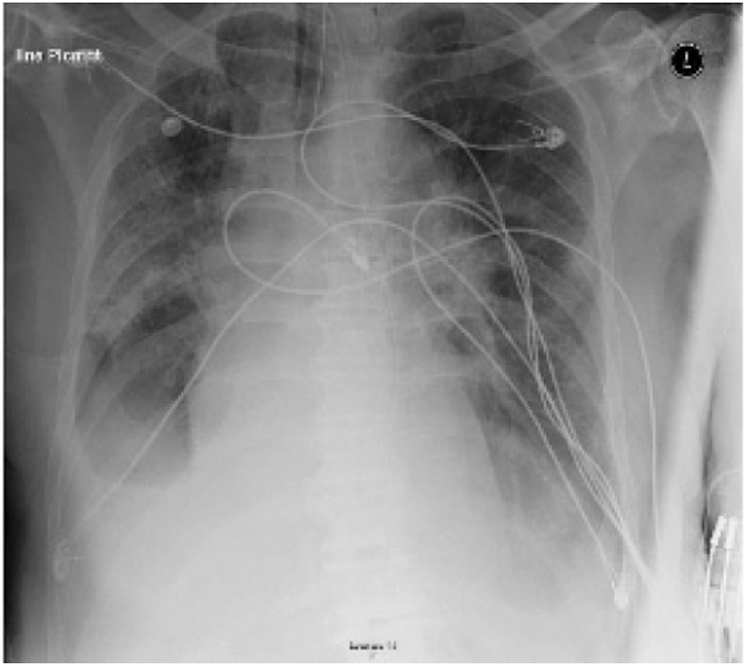
Figure 6: Chest X-ray displays multifocal airspace opacities with bilateral ground glass opacities of one case belong to Group C [16]
Fig. 7 illustrates a 74-year-old male patient of 6 or more days offset of symptoms with a past medical history of Parkinson disease, cardioembolic stroke, atrial fibrillation, chronic obstructive pulmonary disease (COPD) [16]. He admitted to the emergency with a complaint of cough and fever. The patient tacked a full check-up plus chest x-ray. The diagnosis was an exacerbation of COPD, and the patient was discharged home with an oral antibiotics. After 24 hours, the patient returned to the emergency, with worsening symptoms, counting altered mental status, fever headache, and cough. He admitted to the hospital for more check-up. Therefore, he was suspected for COVID-19 infection. The patient was isolated and repeated the chest X-ray. The new X-ray, Fig. 7, demonstrated a small right pleural effusion with bilateral ground glass opacities. The patient was then tested for COVID-19 and found to be positive. The patient developed respiratory failure and required intubation and was transferred to the ICU.
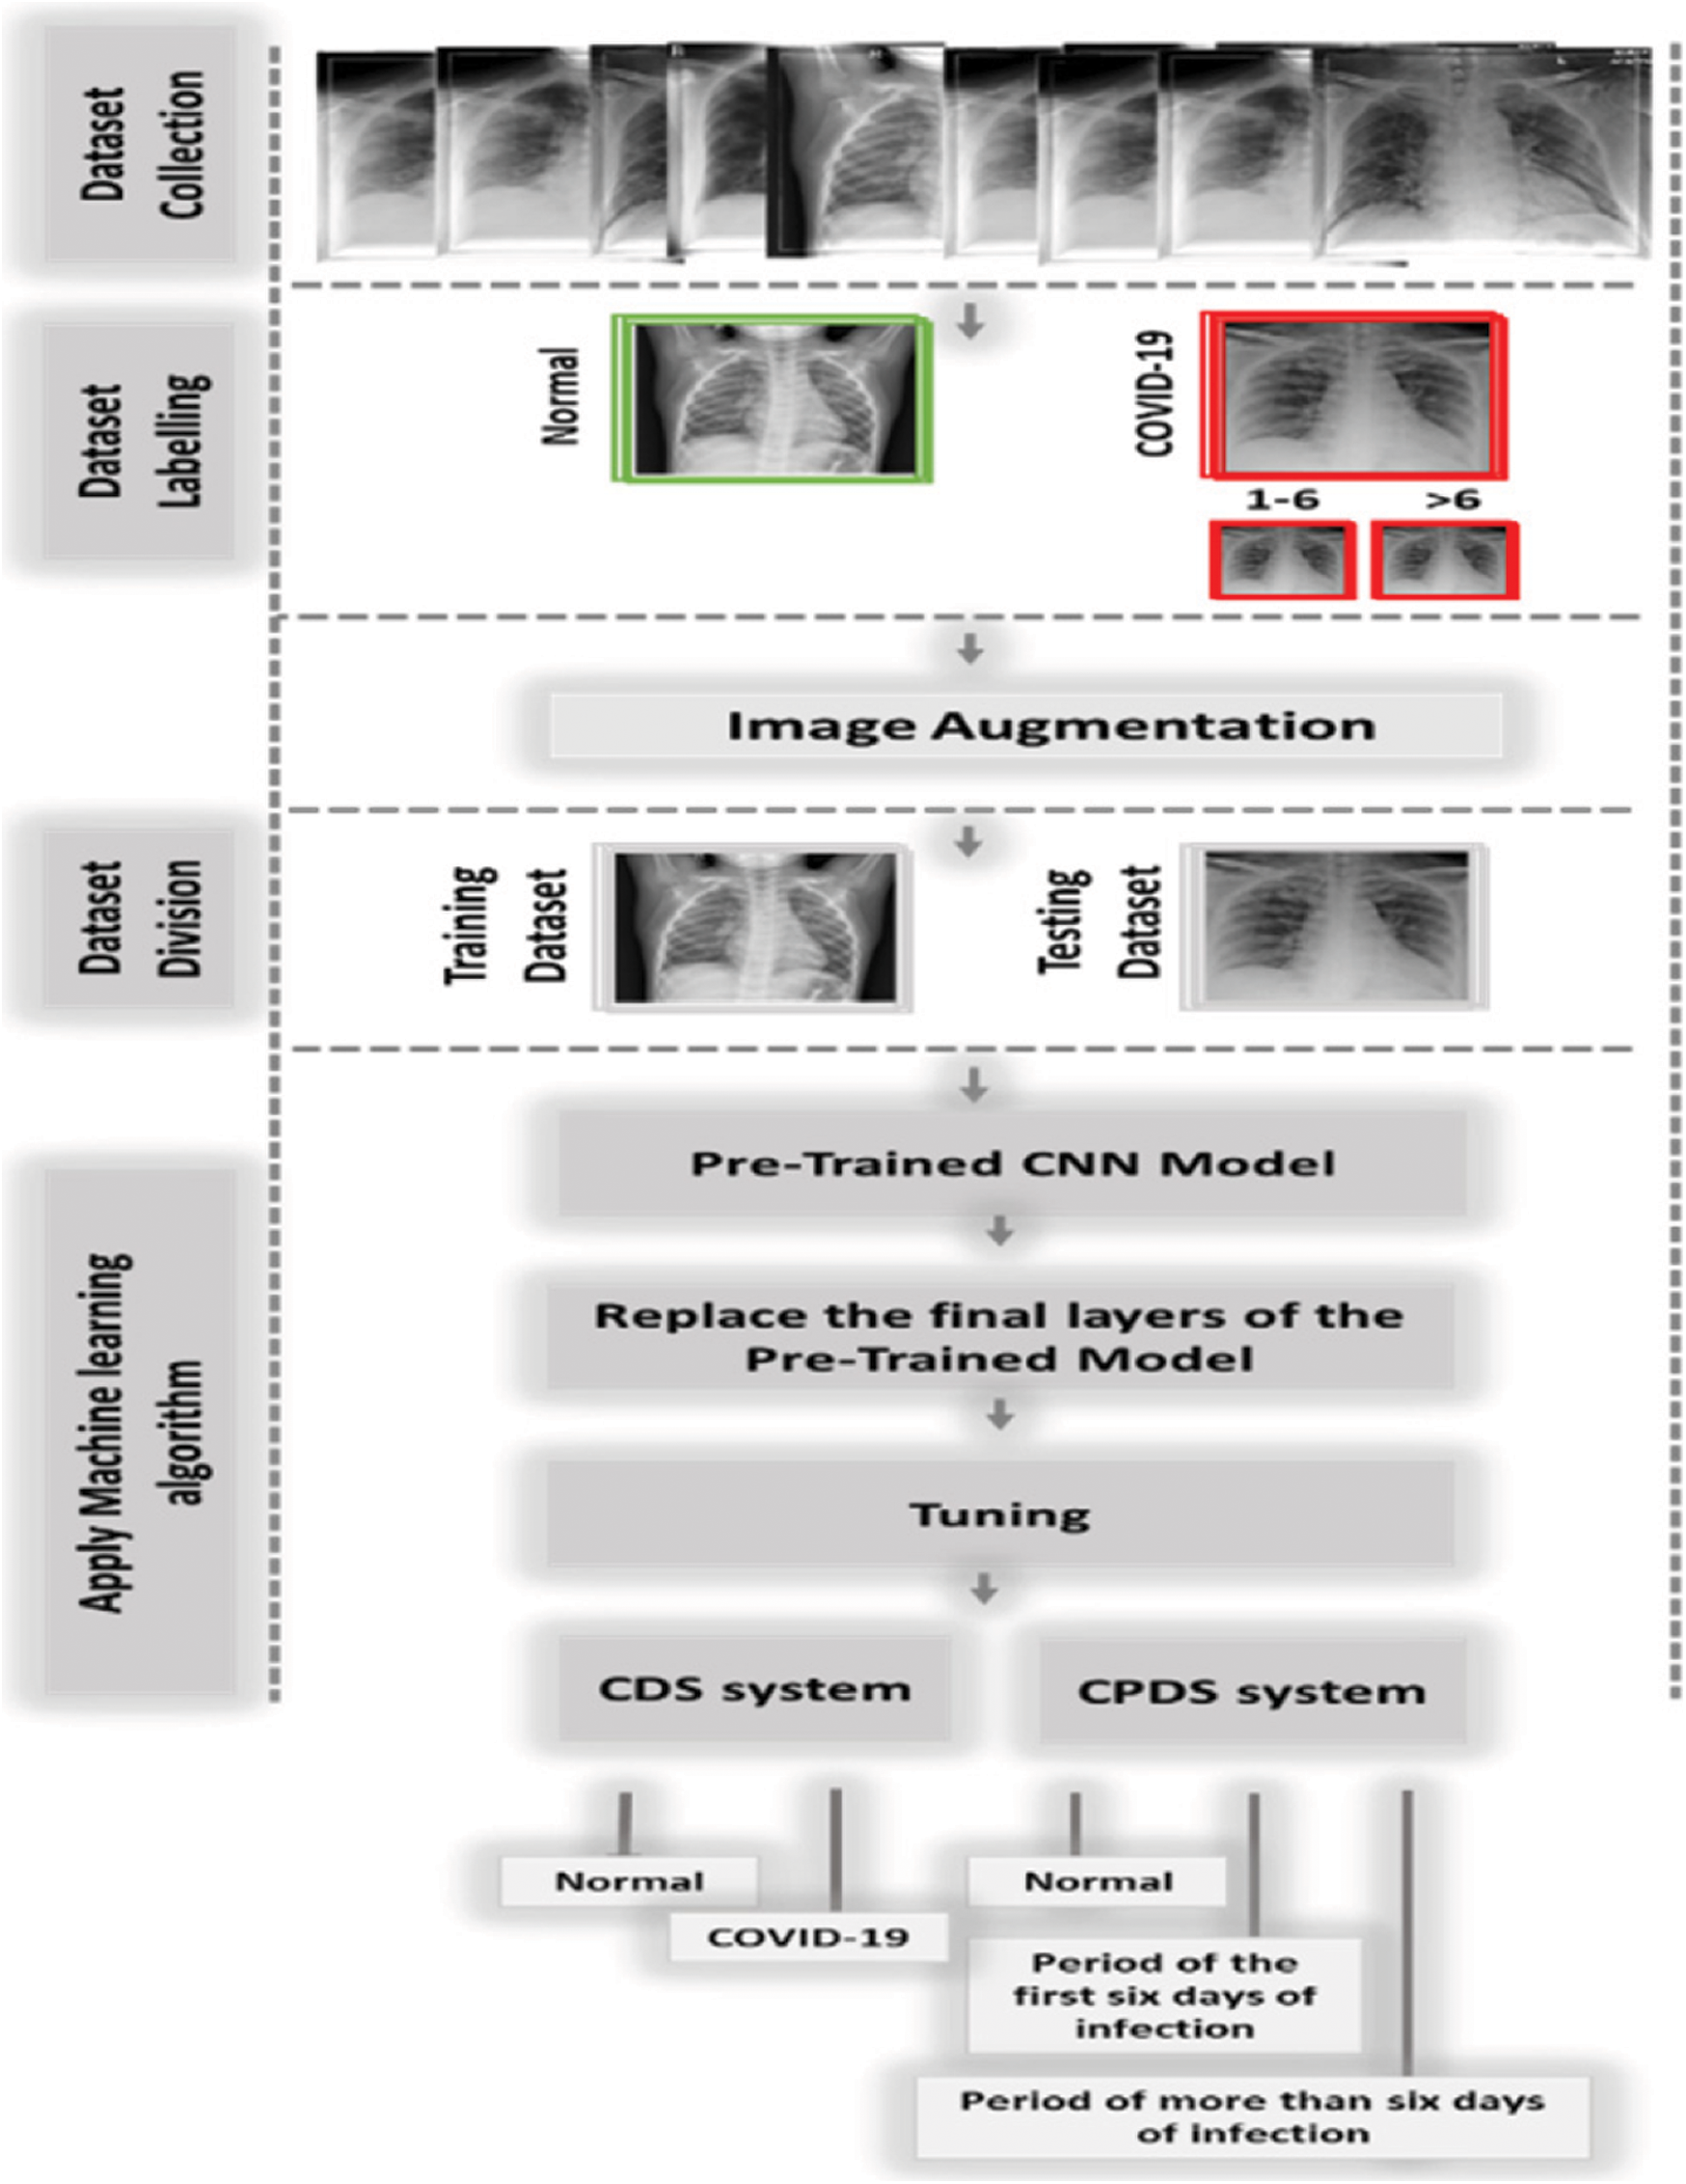
Figure 7: The proposed system (CPDS and CDS)
In this study, we proposed two diagnosis systems, the CPDS, and the CDS. The proposed CPDS system used to classify X-ray images into three periods or classes, i.e., healthy period, which mean the no COVID19, the period of the first six days of symptoms (i.e., COVID-19 positive cases from day 1 to day 6), and the third period of infection more than six days of symptoms (i.e., COVID-19 positive cases from day 6 and more). The proposed CDS system used to determine if the X-ray images normal, i.e., healthy case or infected, i.e., COVID-19 positive cases.
CPDS and CDS used the transfer-learning techniques to classify the X-ray images. As illustrated in Fig. 8, CPDS and CDS started by collecting the X-ray images data of patients having COVID-19 and healthy persons. Then, we classified the COVID-19 into two types X-ray of the COVID-19 positive cases from day 1 to day 6, and the COVID-19 positive cases from day 6 and more. After that an image augmentation is performed according respective CNN models. Then, the dataset is divided into training and test groups (80% and 20%). Final the pre-trained CNN models (VGG 19, ResNet, and MobileNetV2) are applied to determine the if the X-ray consider as healthy or infected using CDS system, and the period of infection using CPDS system.
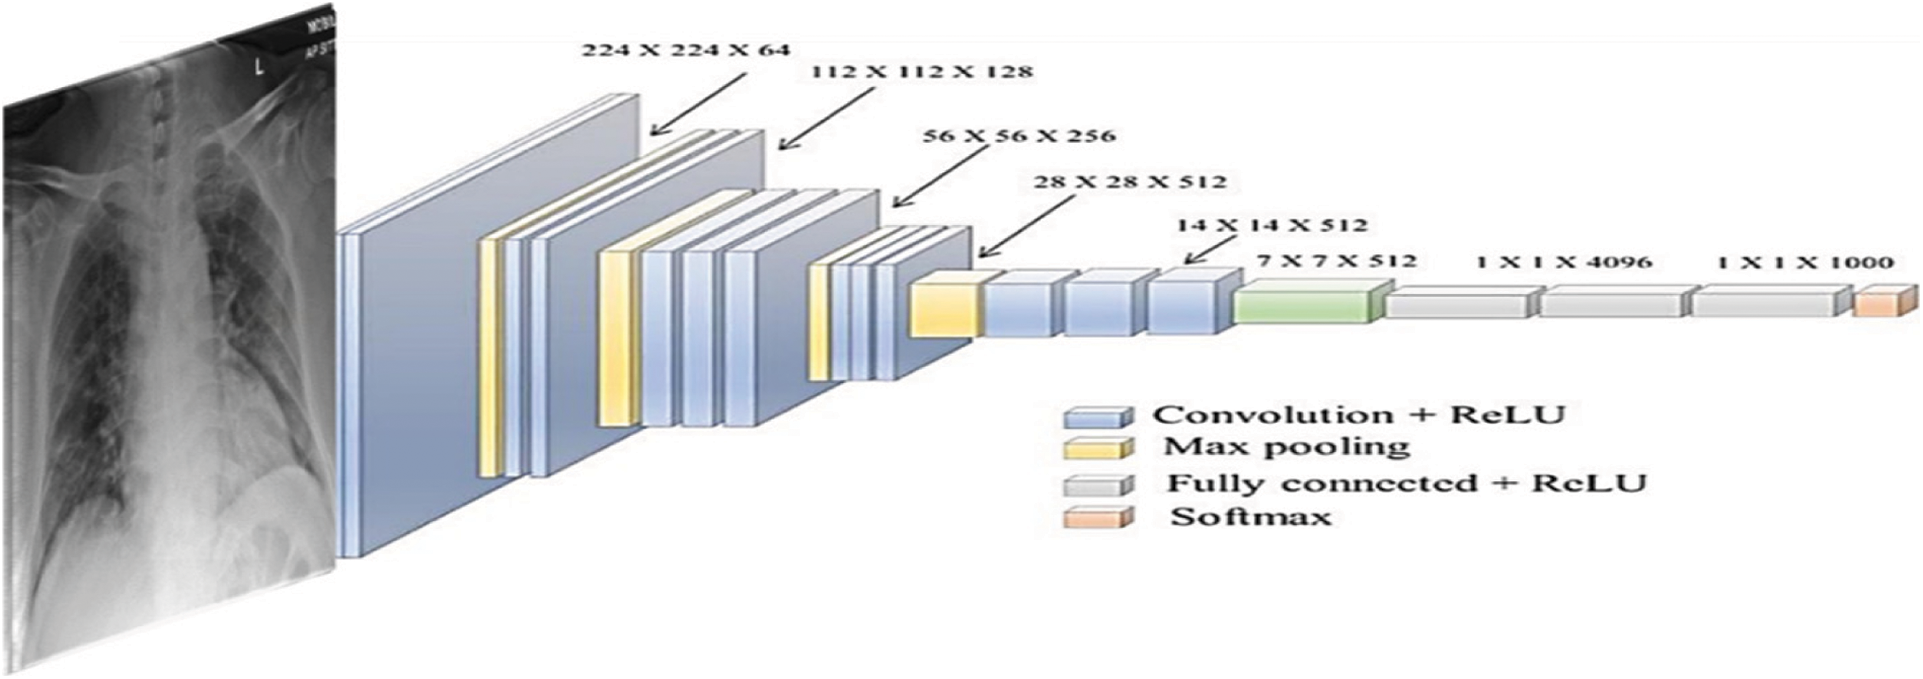
Figure 8: The used VGG-19 architecture
We used KERAS framework to on a PC with Intel © i9-9880H core @ 2.3 GHz processor and 16 GB RAM and 2 GB graphics card of a graphics processing unit on 64-bit Windows 10. We used the Image Data Generator with the following parameters (rotation range = 40, width shift range = 0.2, height shift range = 0.2, shear range = 0.2, zoom range = 0.2) for augmentation. Also, we resized all images to the size 224 × 224 pixels to fulfill the requirement of the pretrained models. Furthermore, we used the following training parameters––batch size = 16, number of epochs = 50, ADAM optimizer with learning rate = 0.0001––and four-fold cross-validation for training and testing.
CPDS and CDS used three well-known DL architectures VGG-19 [33], ResNet [34], and MobileNet2. VGG-19 [33] architecture is introduced with minimum pre-processing to recognise the patterns from pixel images. VGG network is identified by its easiness, using only 3 × 3 convolutional layers stacked in increasing depth. Reducing volume size is handled by max pooling. Two fully-connected layers, each with 4,096 nodes, are then followed by a softmax classifier. Fig. 9 illustrates the used VGG-19 architecture.
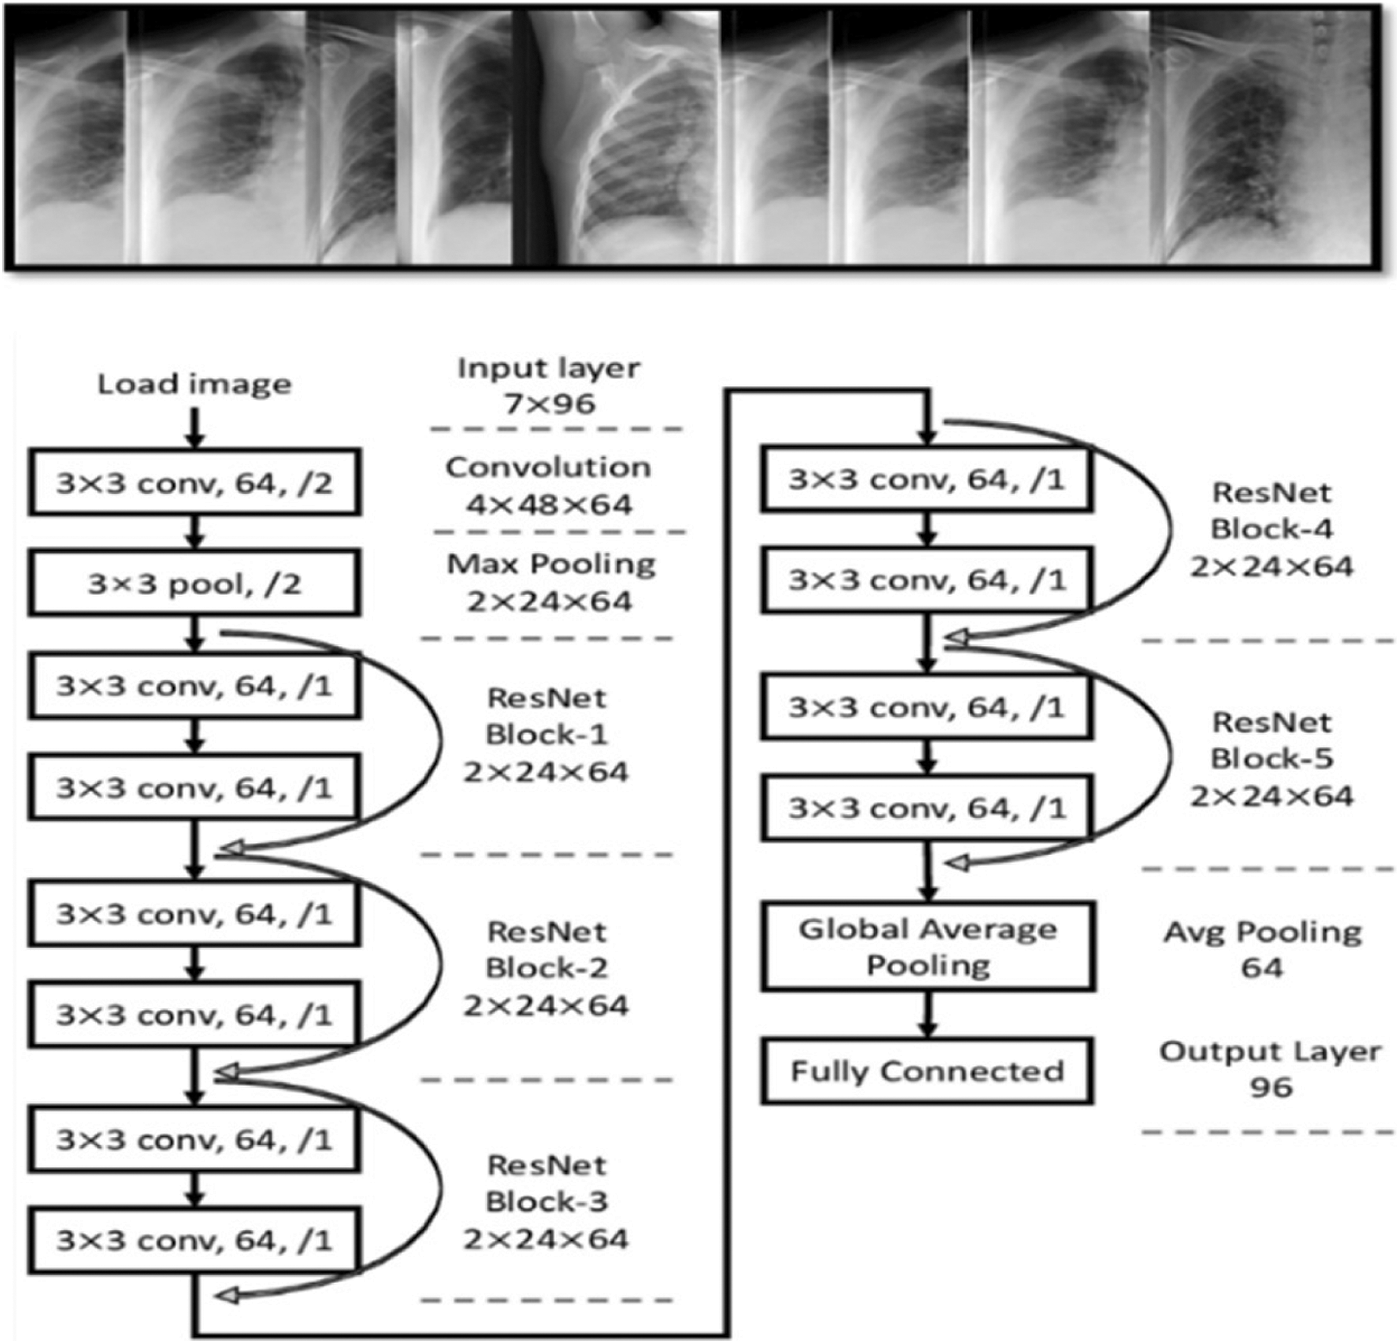
Figure 9: General overview of ResNet architectures
ResNet is a CNN architecture based on avoid blocks of convolutional layers by using shortcut connections (Fig. 9). Its elementary blocks called “bottleneck” blocks follow two design rules: the amount of filters is doubled if the output feature map size is halved or uses the same number for layers and filters if they have the same output feature map size. In additional, the down-sampling is executed straight by convolutional layers with a stride of 2, and batch normalization is performed after each convolution before ReLU activation.
5 Experimental Results and Compression
The proposed systems (CPDS and CDS) were evaluated using the collected dataset for CPDS and reference DATASET [28] for CDS. The proposed systems used three well-known DL architectures VGG-19 [33], ResNet [34], and MobileNet2 to train, evaluate and test the CPDS and CDS. The proposed CPDS system used to identify the three periods or classes, i.e., healthy period, the period of the first six days of infection, and the period of more than six days of infection. The proposed CDS system used to determine if the X-ray images normal, i.e., healthy case or infected, i.e., COVID-19 positive cases. The collected dataset (2121 X-ray images) has been divided into training and test groups (80% and 20%). Tab. 3 summarizes the performance of CPDS and CDS with three VGG-19, ResNet, and MobileNet2 CNN architectures.
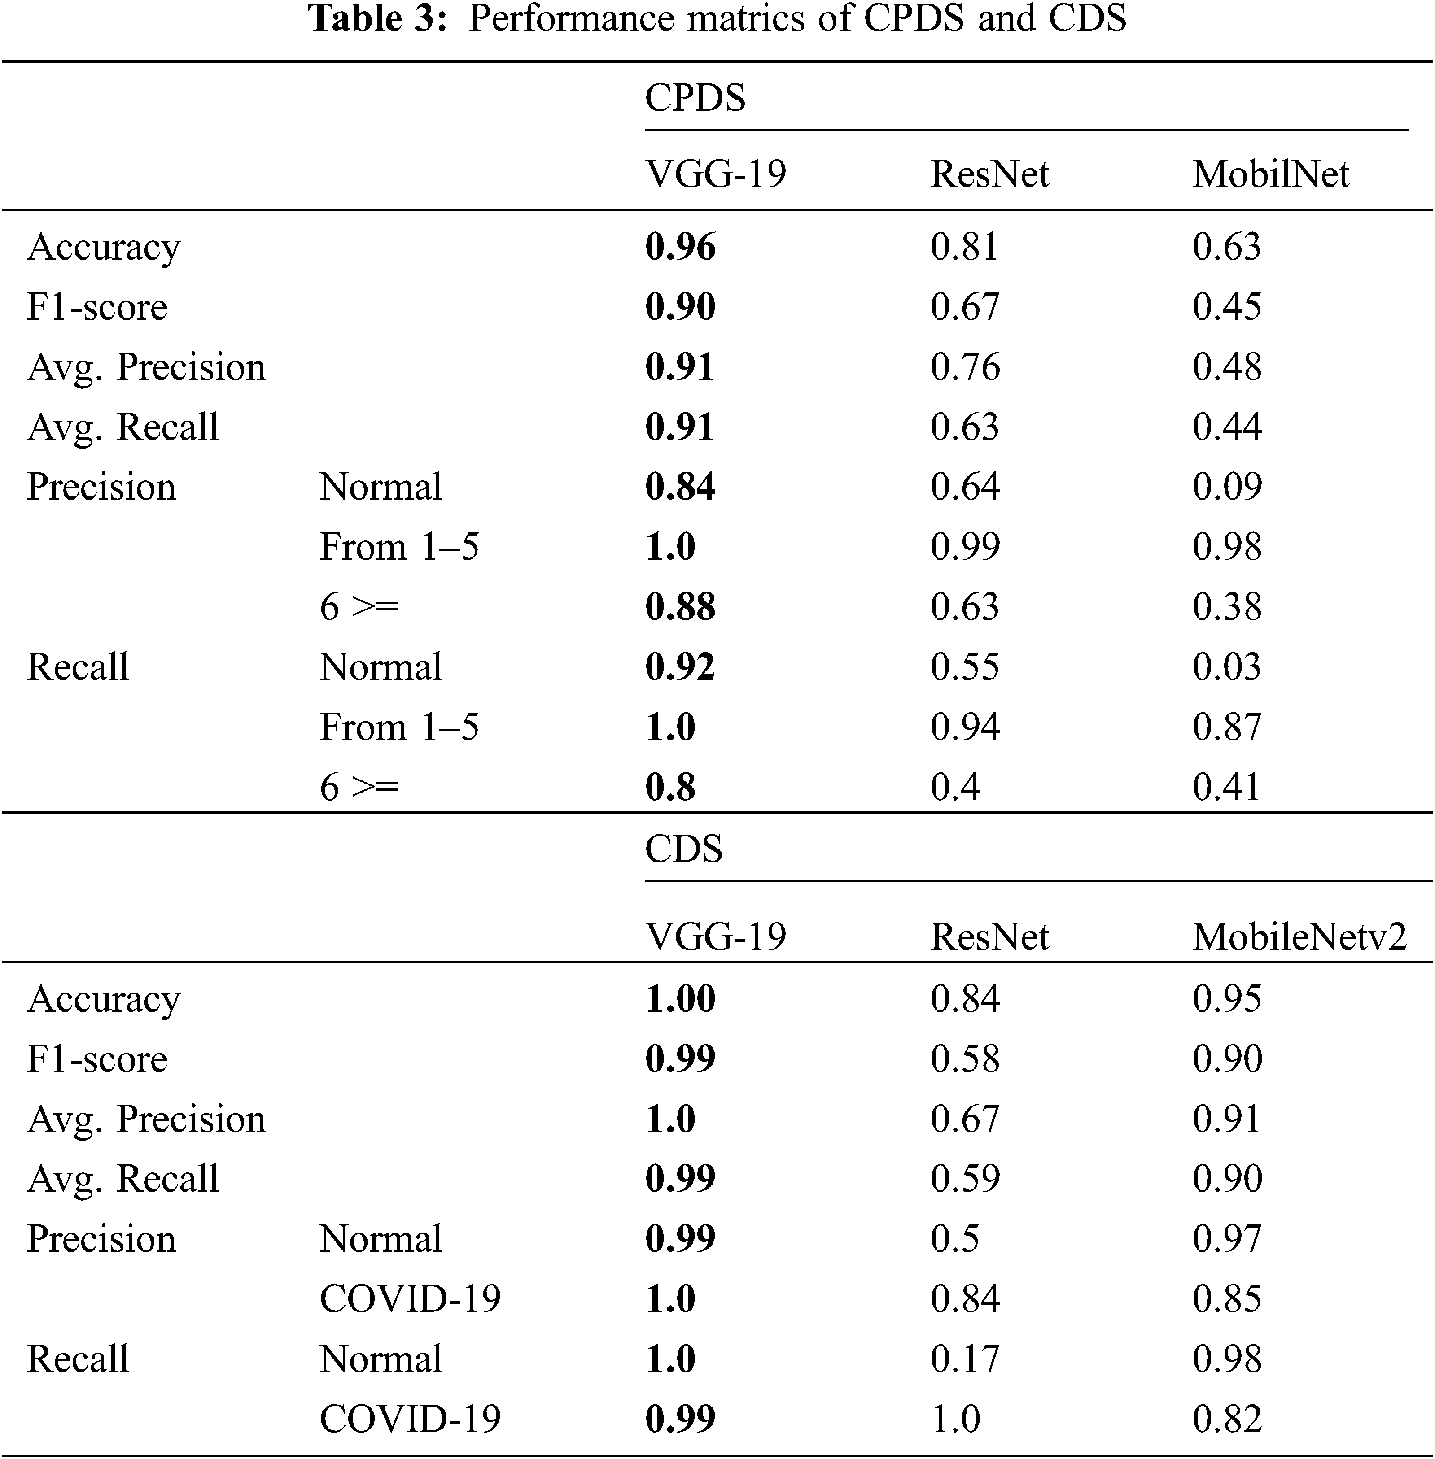
As mentioned earlier, we executed four-fold cross-validation with 50 epochs for both CPDS and CDS and computed the overall average of the results. As illustrated in Tab. 1 the VGG-19 model outperformed the ResNet, and MobileNet for both CPDS and CDS in all the performance metrics (F1 score, accuracy, sensitivity (recall), precision, and confusion matrix). For CPDS, the VGG-19 perform to 96% accuracy, 90% F1 score, 91% average precision, and 91% average recall, will the ResNet perform 81% accuracy, 67% F1 score, 76% average precision, and 63% average recall; the MobileNet perform 63% accuracy, 45% F1 score, 48% average precision, and 44% average recall. For CDS, the VGG-19 perform to 100% accuracy, 99% F1 score, 100% average precision, and 99% average recall, will the ResNet perform 84% accuracy, 58% F1 score, 67% average precision, and 59% average recall; the MobileNet perform 95% accuracy, 90% F1 score, 91% average precision, and 90% average recall. Figs. 10 and 11 shows the learning performance accuracy of VGG-19 in four-fold cross-validation with 50 epochs of CPDS.
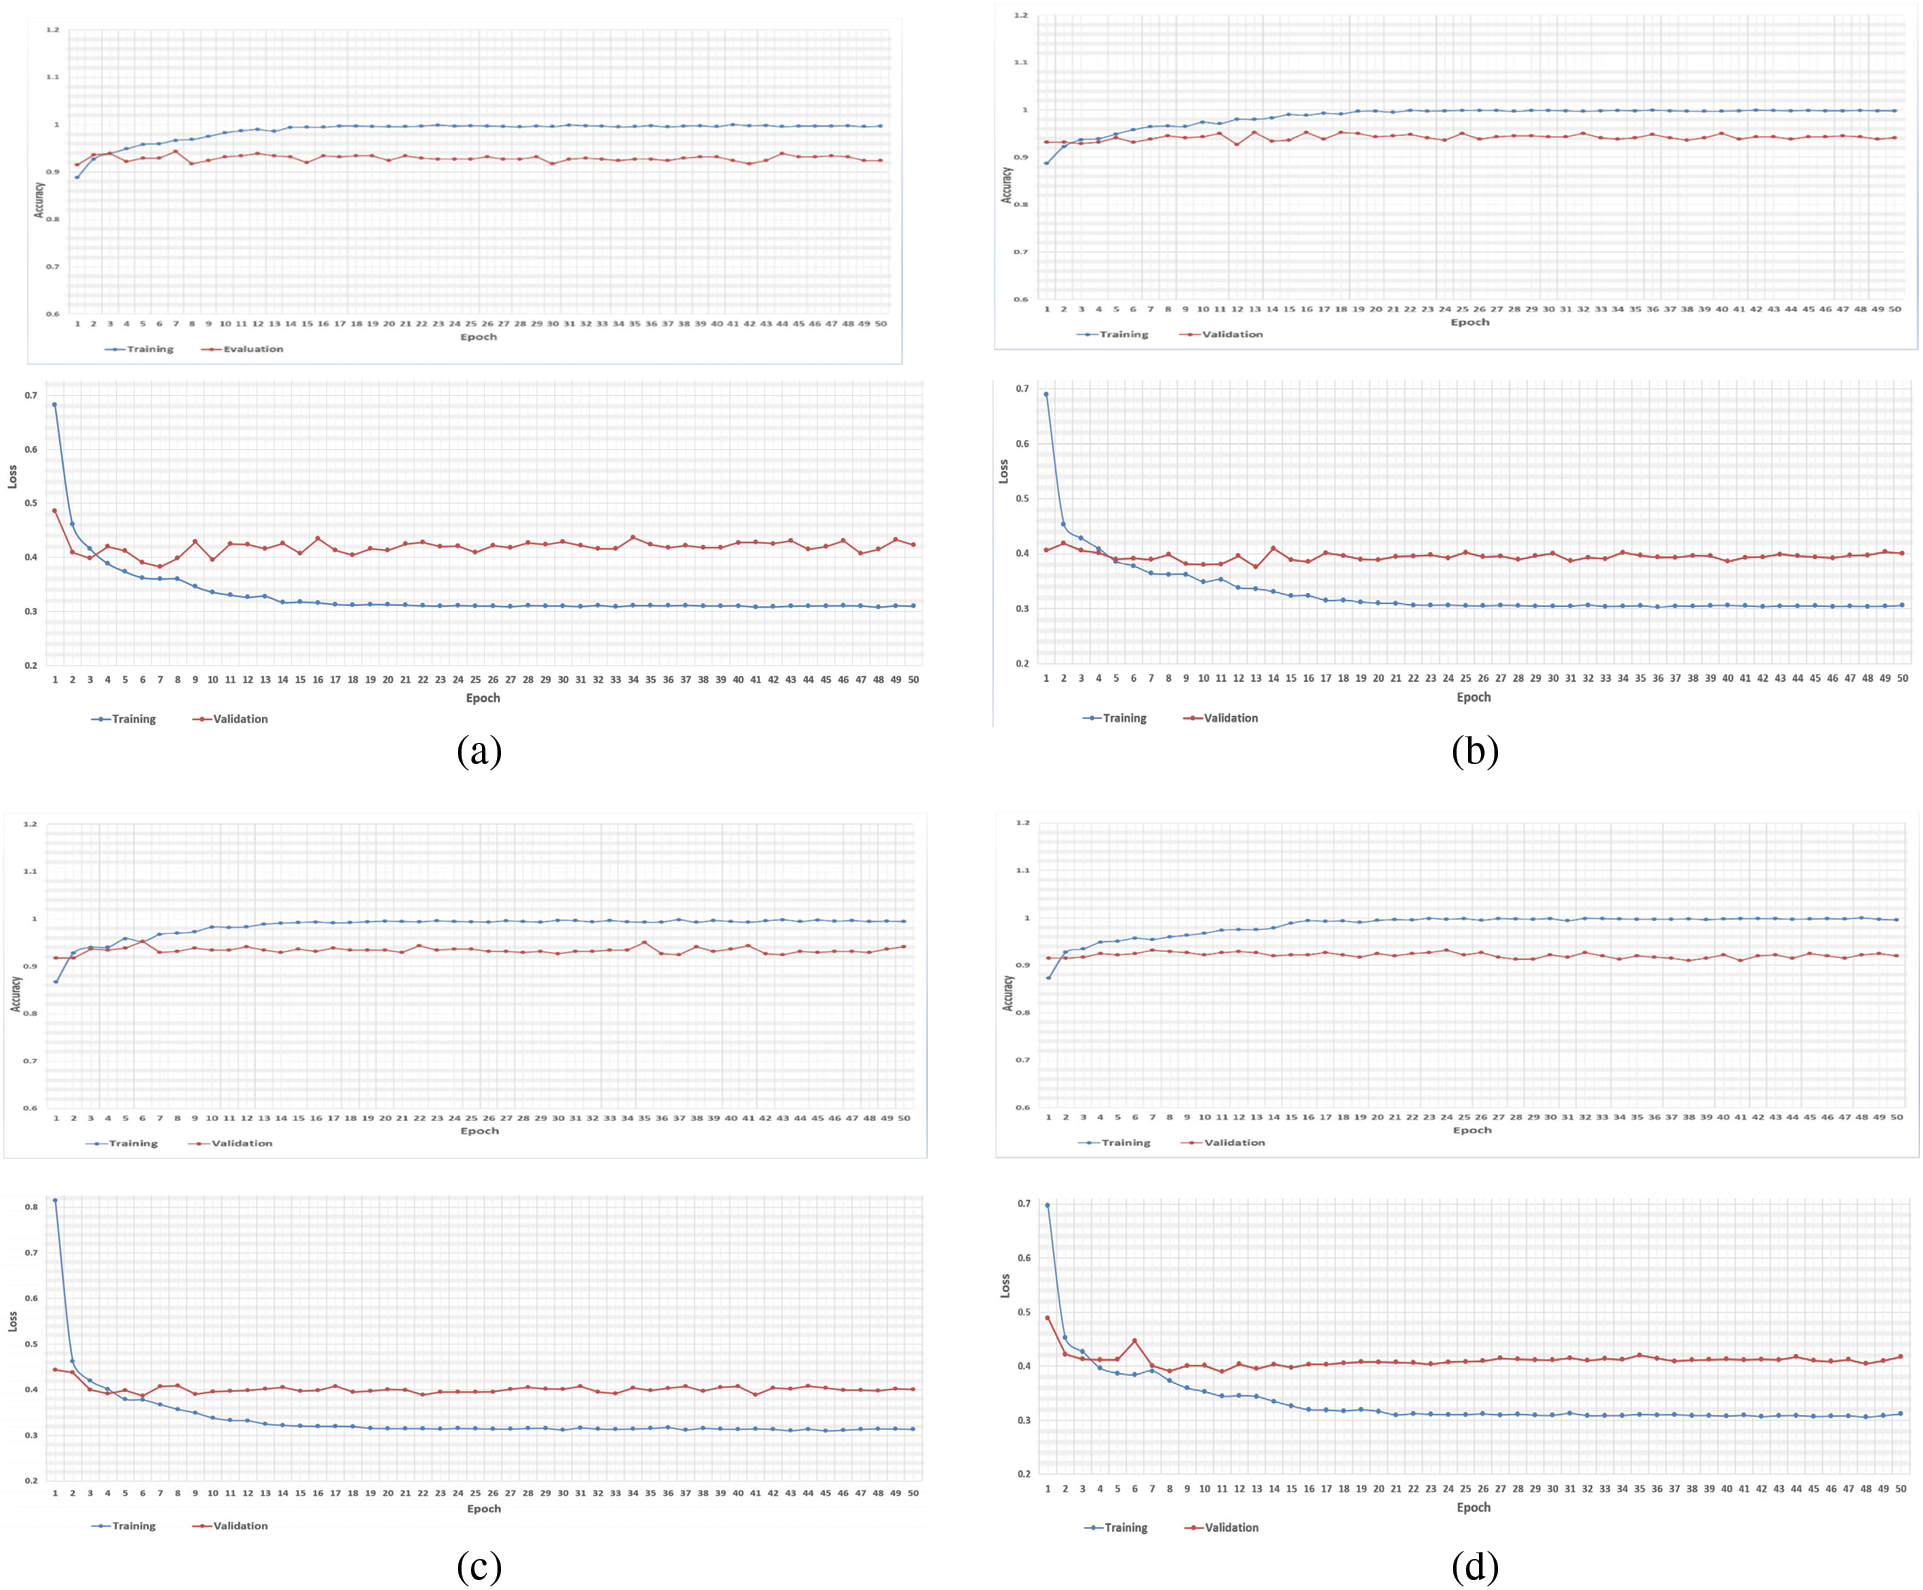
Figure 10: Learning curves of VGG19 in CPDS for four folds with 50 epoch. (a) First fold of CPDS system (b) Second fold of CPDS system (c) Third fold of CPDS system (d) Fourth fold of CPDS system
As illustrated in Fig. 10, the VGG-19 model has a good fit and stable performance. The training and validation loss decreased to a point of stability with a minimal gap between two final loss values. Fig. 11 shows the confusion matrix for VGG-19, Resnet, and MobileNet for one random fold of CPDS and CDS system.
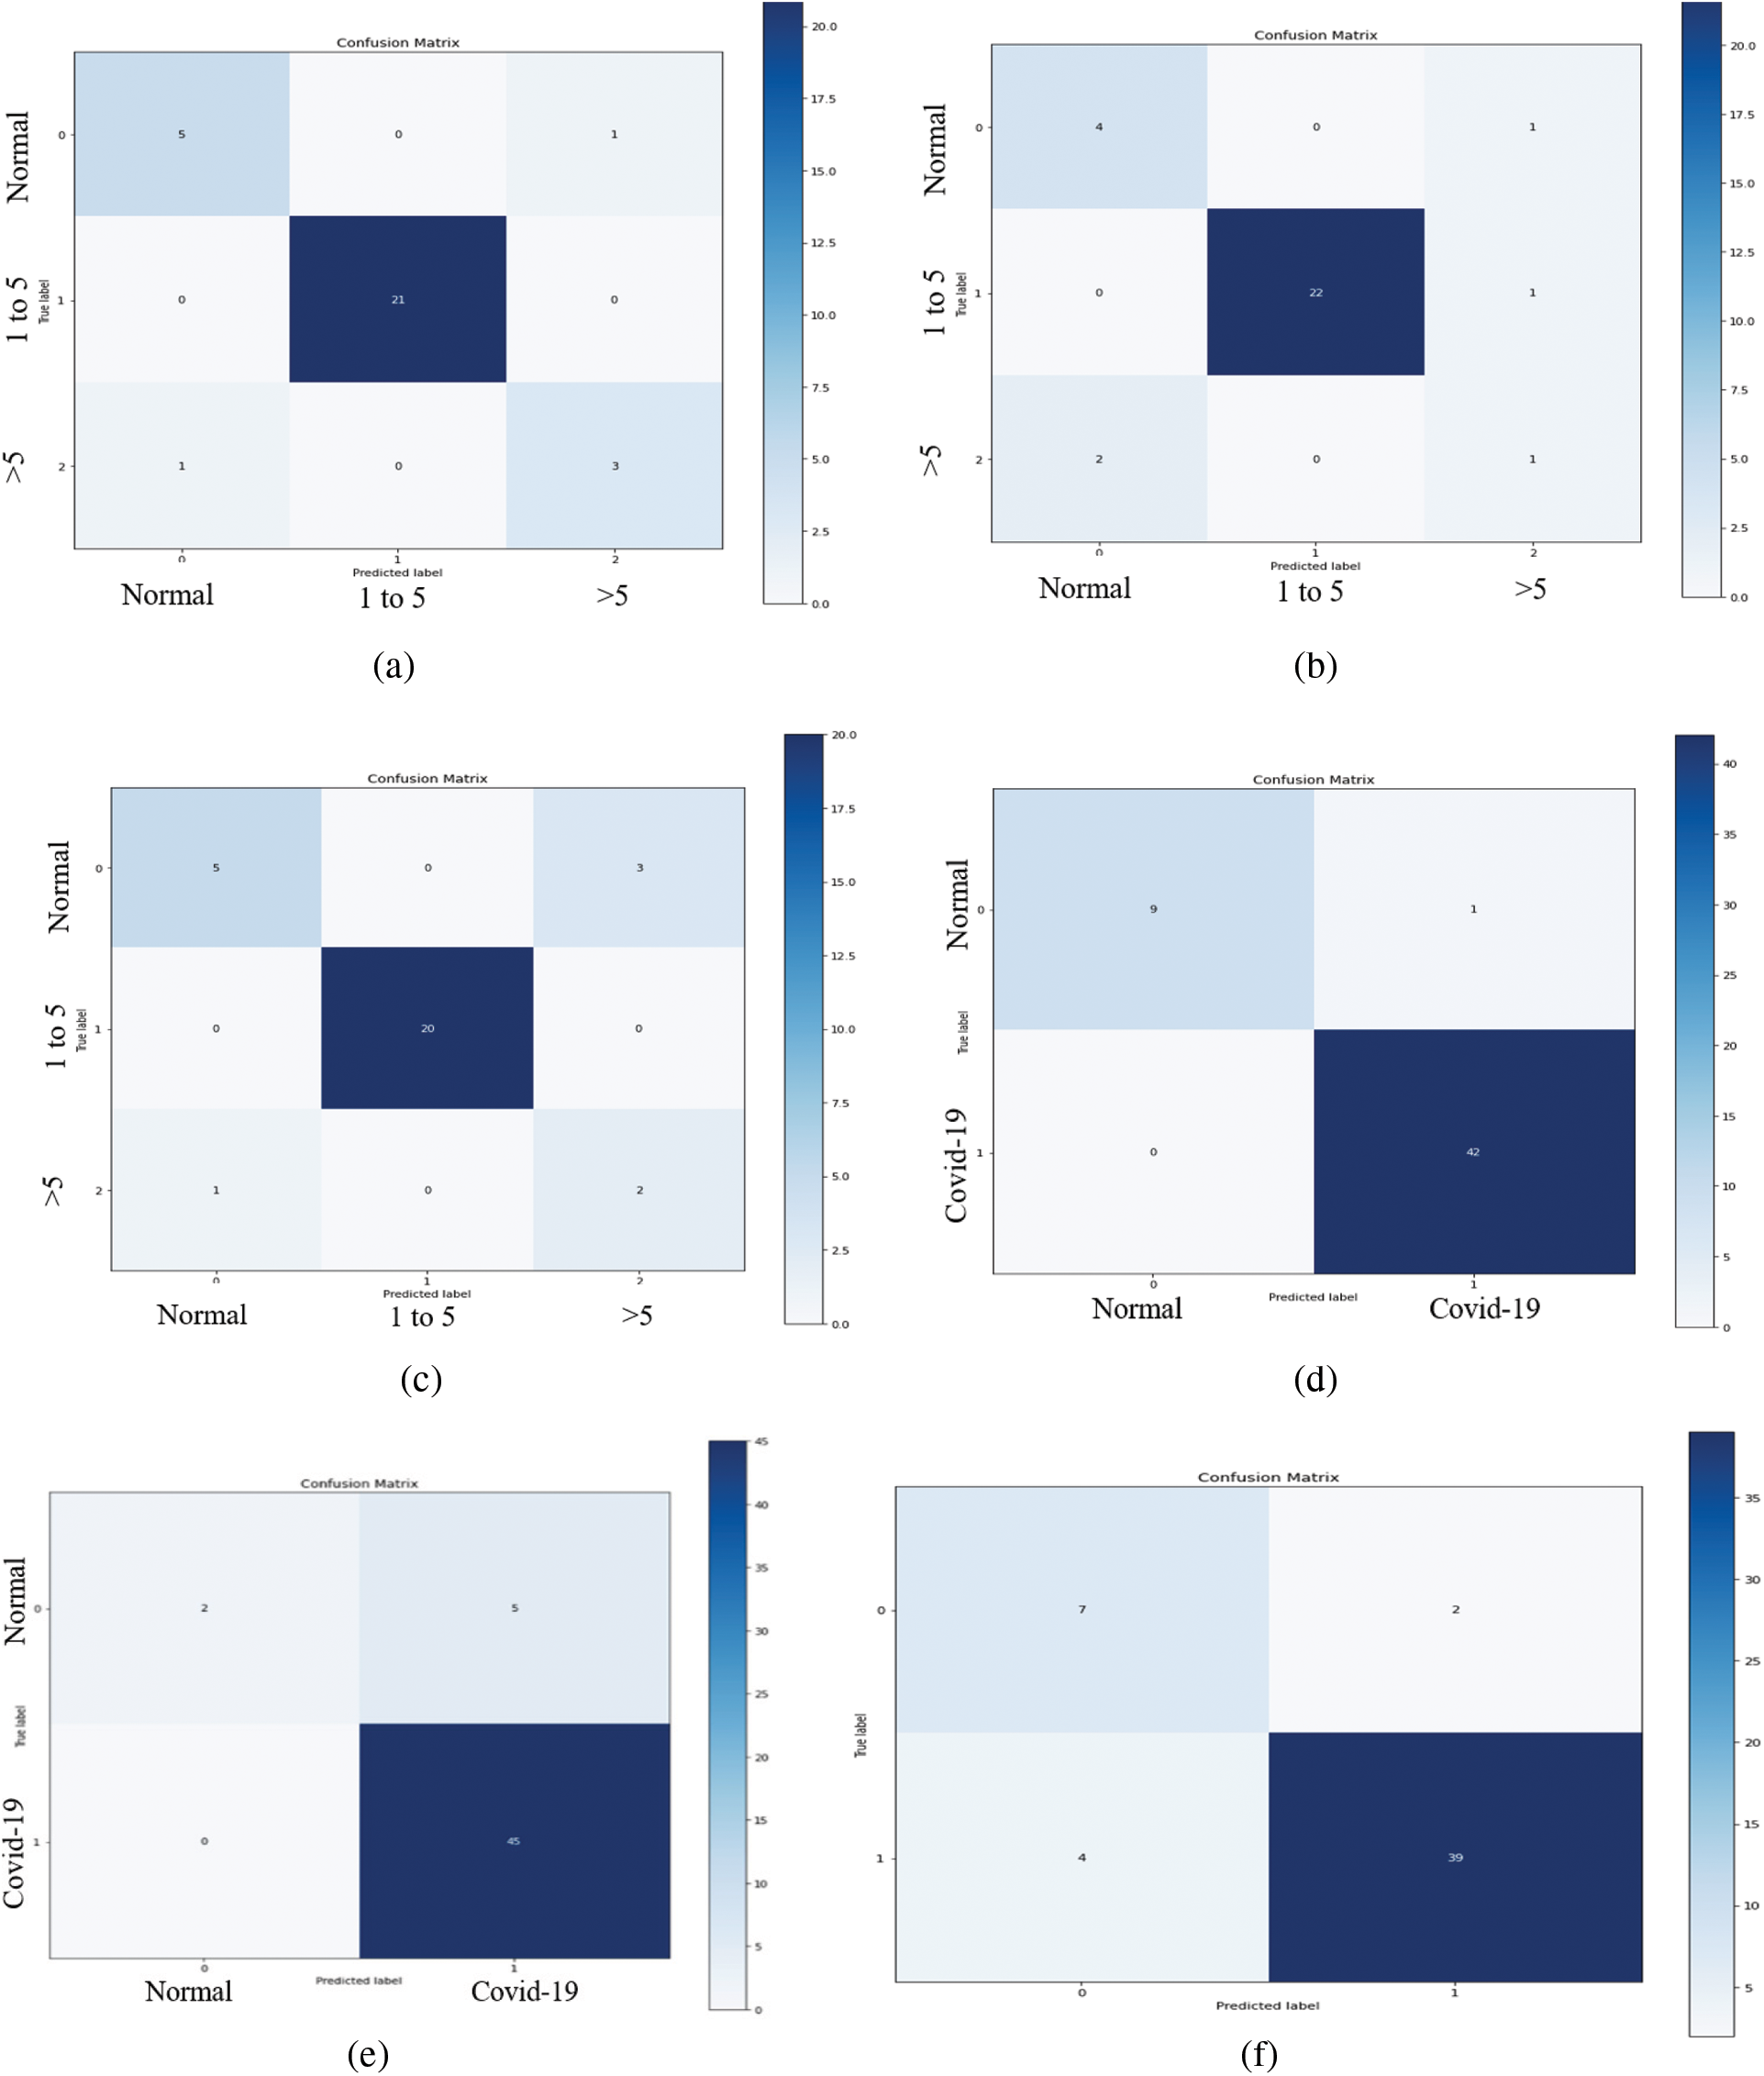
Figure 11: The confusion matrices of the VGG-19, ResNet, and MobileNet architectural in one-fold for both CPDS and CDS systems. (a) Confusion matrix of the VGG19 model of CPDS system. (b) Confusion matrix of the ResNet model of CPDS system. (c) Confusion matrix of the MobileNet model of CPDS system. (d) Confusion matrix of the VGG19 model of CDS system. (e) Confusion matrix of the ResNet model of CDS system. (f) Confusion matrix of the MobileNet model of CDS system
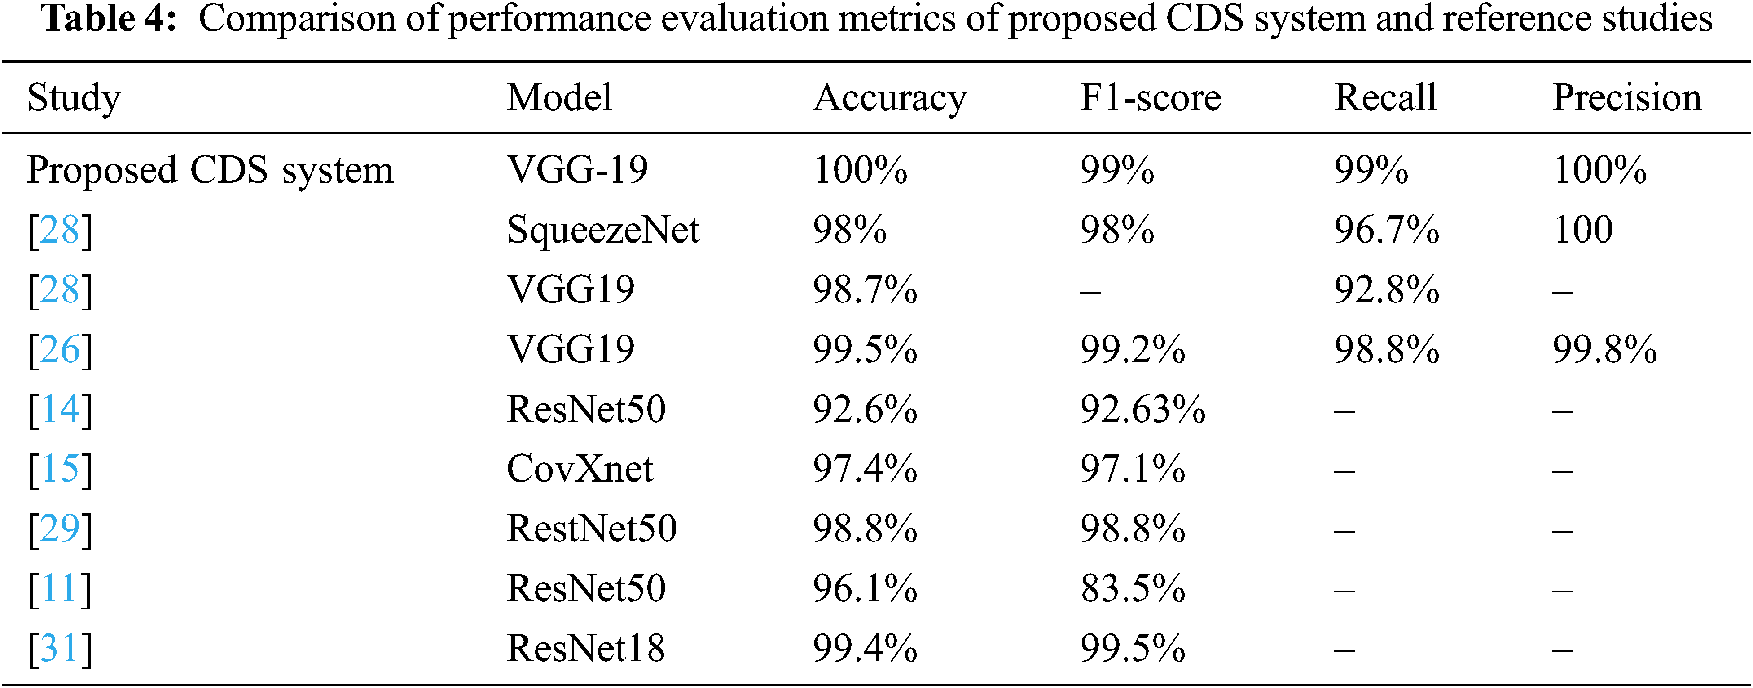
In this section, we will compare the performance evaluation matrix of the CDS system and the reference studies. The VGG-19 of CDS system outperforms and shows outstanding results with different performance metrics (Tab. 4), such as 100% accuracy and 99% F1 score, 99% sensitivity, and 100% Precision. In contrast, in the reference studies, five CNN models (SqueezeNet, VGG19, ResNet50, ResNet18, and CovXnet) were used to train the system.
In this study, we proposed two TL-based systems for the automatic period detection and identifying of COVID-19 using X-Ray. We used VGG 19, ResNet, and MobileNetV2 as a ML architectures. In additional, in this stady we build and collected database consists of three different categories or groups based on the basis of time interval of offset of Symptoms. Group A (Normal Patients), Group B (Patients of 0–6 days offset of symptoms) and Group C (Patients of 6 or more days offset of symptoms). In this study, the VGG-19 model outperformed the ResNet, and MobileNet for both CPDS and CDS in all the performance metrics (F1 score, accuracy, sensitivity (recall), precision, and confusion matrix). For CPDS, the VGG-19 perform to 96% accuracy, 90% F1 score, 91% average precision, and 91% average recall. For CDS, the VGG-19 perform to 100% accuracy, 99% F1 score, 100% average precision, and 99% average recall. To the best of our knowledge, this is the first study that address the period of COVID-19 infection, i.e., healthy period, which mean the no COVID19, the period of the first six days of symptoms (i.e., COVID-19 positive cases from day 1 to day 6), and the third period of infection more than six days of symptoms (i.e., COVID-19 positive cases from day 6 and more).
In the future, we are planning to extend the dataset by adding more COVID-19 cases to each class and also adding more periods to be first healthy period, first period (1–4 days), the second period (5–8 days), and third period (>9 days) from 10 another kind of image like the CT scan.
Funding Statement: This work was supported by the Deanship of Scientific Research (DSR) with King Saud University, Riyadh, Saudi Arabia, through a research group program under Grant RG-1441-503.
Conflicts of Interest: The authors declare that they have no conflicts of interest to report regarding the present study.
1. C. Huang, Y. Wang, X. Li, L. Ren, J. Zhao et al., “Clinical features of patients infected with 2019 novel coronavirus in Wuhan, China,” The Lancet, vol. 395, pp. 497–506, 2020. [Google Scholar]
2. H. Lu, C. W. Stratton and Y. W. Tang, “Outbreak of pneumonia of unknown etiology in Wuhan China: The mystery and the miracle,” Journal of Medical Virology, vol. 92, no. 4, pp. 401–402, 2020. [Google Scholar]
3. N. Chen, M. Zhou, X. Dong, J. Qu, F. Gong et al., “Epidemiological and clinical characteristics of 99 cases of 2019 novel coronavirus pneumonia in Wuhan, China: A descriptive study,” The Lancet, vol. 395, pp. 507–513, 2020. [Google Scholar]
4. E. Lefkowitz, D. Dempsey, R. Hendrickson, R. Orton, S. Siddell et al., “Virus taxonomy: The database of the international committee on taxonomy of viruses (ICTV),” Nucleic Acids Research, vol. 46, pp. D708–D717, 2018. [Google Scholar]
5. Q. Li, X. Guan, P. Wu, X. Wang, L. Zhou et al., “Early transmission dynamics in Wuhan, China, of novel coronavirus-infected pneumonia,” New England Journal of Medicine, vol. 382, no. 13, pp. 1199–1207, 2020. [Google Scholar]
6. J. Wu, K. Leung and G. Leung, “Nowcasting and forecasting the potential domestic and international spread of the 2019-nCoV outbreak originating in Wuhan, China: A modelling study,” The Lancet, vol. 395, pp. 689–697, 2020. [Google Scholar]
7. W. Guan, Z. Ni, Y. Hu, W. Liang, C. Ou et al., “Clinical characteristics of 2019 novel coronavirus infection in China,” MedRxiv, vol. 28, pp. 394, 2020. [Google Scholar]
8. J. Lei, J. Li, X. Li and X. Qi, “CT imaging of the 2019 novel coronavirus (2019-nCoV) pneumonia,” Radiology, vol. 295, pp. 18, 2020. [Google Scholar]
9. F. Song, N. Shi, F. Shan, Z. Zhang, J. Shen et al., “Emerging 2019 novel coronavirus (2019-nCoV) pneumonia,” Radiology, vol. 295, pp. 210–217, 2020. [Google Scholar]
10. C. Zheng, X. Deng, Q. Fu, Q. Zhou, J. Feng et al., “Deep learning-based detection for COVID-19 from chest CT using weak label,” MedRxiv, vol. 395, no. 10223, pp. 497, 2020. [Google Scholar]
11. A. Narin, C. Kaya and Z. Pamuk, “Automatic detection of coronavirus disease (COVID-19) using x-ray images and deep convolutional neural networks,” Pattern Analysis and Applications, vol. 24, pp. 1207–1220, 2021. [Google Scholar]
12. R. Kumar, R. Arora, V. Bansal, V. J. Sahayasheela, H. Buckchash et al., “Accurate prediction of COVID-19 using chest x-ray images through deep feature learning model with smote and machine learning classifiers,” MedRxiv, vol. 40, pp. 63, 2020. [Google Scholar]
13. S. Kadry, V. Rajinikanth, S. Rho, N. S. M. Raja, V. S. Rao et al., “Development of a machine-learning system to classify lung CT scan images into normal/covid-19 class,” ArXiv Preprint arXiv:2004.13122, 2020. [Google Scholar]
14. A. Ismael and A. Şengür, “Deep learning approaches for COVID-19 detection based on chest X-ray images,” Expert Systems with Applications, vol. 164, pp. 114054, 2021. [Google Scholar]
15. T. Mahmud, M. Rahman and S. Fattah, “CovXNet: A multi-dilation convolutional neural network for automatic COVID-19 and other pneumonia detection from chest X-ray images with transferable multi-receptive feature optimization,” Computers in Biology and Medicine, vol. 122, pp. 103869, 2020. [Google Scholar]
16. A. Filatov, P. Sharma, F. Hindi and P. Espinosa, “Neurological complications of coronavirus disease (COVID-19Encephalopathy,” Cureus, vol. 12, no. 3, 2020. [Google Scholar]
17. R. Jain, M. Gupta, S. Taneja and D. J. Hemanth, “Deep learning based detection and analysis of COVID-19 on chest X-ray images,” Applied Intelligence, vol. 51, no. 3, pp. 1690–1700, 2021. [Google Scholar]
18. L. Lopez, J. Morales, J. Jaime, S. Diaz and A. Barranco, “COVID-XNet: A custom deep learning system to diagnose and locate COVID-19 in chest X-ray images,” Applied Sciences, vol. 10, pp. 5683, 2020. [Google Scholar]
19. K. Abdulkareem, M. Mohammed, A. Salim, M. Arif, O. Geman et al., “Realizing an effective COVID-19 diagnosis system based on machine learning and IOT in smart hospital environment,” IEEE Internet of Things Journal, vol. 8, no. 21, pp. 15919–15928, 2021. [Google Scholar]
20. E. Hemdan, M. Shouman and M. Karar, “COVIDX-Net: A framework of deep learning classifiers to diagnose COVID-19 in x-ray images,” ArXiv Preprint arXiv: 2003.11055, 2020. [Google Scholar]
21. T. Ozturk, M. Talo, E. Yildirim, U. Baloglu, O. Yildirim et al., “Automated detection of COVID-19 cases using deep neural networks with X-ray images,” Computers in Biology and Medicine, vol. 121, pp. 103792, 2020. [Google Scholar]
22. L. Wang and A. Wong, “COVID-Net: A tailored deep convolutional neural network design for detection of COVID-19 cases from chest x-ray images,” ArXiv Preprint arXiv:2003.09871, 2020. [Google Scholar]
23. P. Sethy, S. Kumari, P. Kumar and P. Biswas, “Detection of coronavirus disease (COVID-19) based on deep features and support vector machine,” International Journal of Mathematical Engineering and Management Sciences, vol. 2020, pp. 643–651, 2020. [Google Scholar]
24. A. Al-Waisy, S. Al-Fahdawi, M. Mohammed, K. Abdulkareem, S. Mostafa et al., “COVID-CheXNet: Hybrid deep learning framework for identifying COVID-19 virus in chest X-rays images,” Soft Computing, pp. 1–16, 2020. [Google Scholar]
25. A. Al-Waisy, M. Mohammed, S. Al-Fahdawi, M. Maashi, B. Zapirain et al., “COVID-DeepNet: Hybrid multimodal deep learning system for improving COVID-19 pneumonia detection in chest x-ray images,” Computers, Materials and Continua, vol. 67, no. 2, 2021. [Google Scholar]
26. M. Faisal, F. Albogamy, H. ElGibreen, M. Algabri, S. Ahad et al., “COVID-19 diagnosis using transfer-learning techniques,” Intelligent Automation and Soft Computing, vol. 29, pp. 649–667, 2021. [Google Scholar]
27. I. Apostolopoulos and T. Mpesiana, “COVID-19: Automatic detection from x-ray images utilizing transfer learning with convolutional neural networks,” Physical and Engineering Sciences in Medicine, vol. 43, no. 2, pp. 635–640, 2020. [Google Scholar]
28. M. Chowdhury, T. Rahman, A. Khandakar, R. Mazhar, M. Kadir et al., “Can AI help in screening viral and COVID-19 pneumonia?,” ArXiv Preprint arXiv:2003.13145, 2020. [Google Scholar]
29. M. Mohammed, K. Abdulkareem, B. Zapirain, S. Mostafa, M. Maashi et al., “A comprehensive investigation of machine learning feature extraction and classification methods for automated diagnosis of COVID-19 based on x-ray images,” Computers, Materials and Continua, vol. 66, no. 3, 2020. [Google Scholar]
30. P. Saha, M. Sadi and M. Islam, “EMCNet: Automated COVID-19 diagnosis from X-ray images using convolutional neural network and ensemble of machine learning classifiers,” Informatics in Medicine Unlocked, vol. 22, no. 3, pp. 100505, 2021. [Google Scholar]
31. S. Ahuja, B. Panigrahi, N. Dey, V. Rajinikanth and T. Gandhi, “Deep transfer learning-based automated detection of COVID-19 from lung CT scan slices,” Applied Intelligence, vol. 51, no. 1, pp. 571–585, 2021. [Google Scholar]
32. T. Ahmed, R. J. Shah, S. E. G. Rahim, M. Flores and A. O’Linn, “Coronavirus disease 2019 (COVID-19) complicated by acute respiratory distress syndrome: An internist’s perspective,” Cureus, vol. 12, no. 3, 2020. [Google Scholar]
33. K. Simonyan and A. Zisserman, “Very deep convolutional networks for large-scale image recognition,” ArXiv Preprint arXiv:1409.1556, 2014. [Google Scholar]
34. K. He, X. Zhang, S. Ren and J. Sun, “Deep residual learning for image recognition,” in IEEE Conf. on Computer Vision and Pattern Recognition, Caesars Palace, Las Vegas, Nevada, USA, pp. 770–778, 2016. [Google Scholar]
 | This work is licensed under a Creative Commons Attribution 4.0 International License, which permits unrestricted use, distribution, and reproduction in any medium, provided the original work is properly cited. |