DOI:10.32604/iasc.2022.020463
| Intelligent Automation & Soft Computing DOI:10.32604/iasc.2022.020463 | |
| Article |
Spectrum Prediction in Cognitive Radio Network Using Machine Learning Techniques
1Department of Mathematics, Anna University, Chennai, 600025, India
2Department of Information Technology, B.S.Abdur Rahman Crescent Institute of Science and Technology, Vandalur–Chennai, 600048, India
*Corresponding Author: S. Mangairkarasi. Email: gomathichamys@gmail.com
Received: 25 May 2021; Accepted: 08 July 2021
Abstract: Cognitive Radio (CR) aims to achieve efficient utilization of scarcely available radio spectrum. Spectrum sensing in CR is a basic process for identifying the existence or absence of primary users. In spectrum sensing, CR users suffer from deep fading effects and it requires additional sensing time to identify the primary user. To overcome these challenges, we frame Spectrum Prediction-Channel Allocation (SP-CA) algorithm which consists of three phases. First, clustering mechanisms to select the spectrum coordinator. Second, Eigenvalue based detection method to expand the sensing accuracy of the secondary user. Third, Bayesian inference approach to reduce the performance degradation of the secondary user. The Eigenvalue based detection method is compared with Energy detection method in terms of varying false alarm rates and samples. The Eigenvalue detection method achieves better performance than Energy detection method. The Simulation results show that our approach gives better performance in terms of reducing sensing time and increasing sensing accuracy.
Keywords: Cognitive radio; spectrum sensing; spectrum prediction; Eigenvalue based detection; clustering algorithms
Nowadays, the abundant growth of wireless applications requires radio spectrum resources. The spectrum resources are very limited due to the fixed spectrum assignment policy. This spectrum scarcity can be solved by the CRN. CR is an eminent approach for spectrum prediction and spectrum allocation. It allows the secondary user to predict the idle spectrum and access it without disturbing the primary user stated as dynamic spectrum access. Thus, the secondary users in CRN continuously sense the channels to identify the spectrum holes, this process known as spectrum sensing. Spectrum sensing is an incredible component for measuring the spectral content and tries to avoid interference with the primary user. Several techniques have been proposed [1] for obtaining the best spectrum sensing performance such as Energy Detection (ED), Matched Filter Detection (MD), and Eigenvalue based detection. Eigenvalue based detection is created on the covariance matrix of the received signal and then observed for the presence of the primary user signal. To evaluate the performance of Eigen value based spectrum sensing, we consider Maximum to Minimum Eigen value based detection (MME). This detection technique is more effective when compared to the energy detection technique. Due to the channel fading, the detection of primary user signals with the individual sensing is not reliable. So cooperative spectrum sensing has been suggested for overcoming the problem of individual sensing [2].
The cooperative spectrum sensing can be broadly categorized into centralized and distributed schemes. For the centralized scheme, the central unit is responsible for collecting the sensing results from each secondary user. The centralized authority is equipped with cognitive capabilities that identify the idle spectrum band and allocates it to the secondary users in accordance with a pre-defined policy. It acts as a coordinator and the remaining secondary users act as members. The selection of the coordinator is done by using various clustering algorithms. The three main advantages of clustering in CR networks are scalability, stability and supporting cooperative tasks. For example, channel sensing and channel access are the essential functions of CR operations. The connectivity and the cooperativeness of CR users based on the improvement of the k-means algorithm is discussed in [3]. As clustering provides cooperative communication between secondary users. The information sharing between the coordinator and its members are spectrum sensing results, SNR (Signal to Noise Ratio) level and the present status of the secondary user. This type of network architecture is a suitable choice for effective dynamic spectrum management [4]. At the same time, the centralized architecture overcomes the challenges of the single node spectrum sensing, and also improves the detection performance and energy consumption.
Considering the challenges in spectrum sensing as well as to improve the spectrum utilization spectrum prediction has been proposed. Spectrum prediction is a key mechanism that aims to avoid the performance degradation of secondary users which consist of channel status prediction, primary user activity prediction and transmission rate prediction. In this article, the Bayes method is utilized to predict the spectrum and the channel is allocated to the secondary user.
K-means algorithm is used to improve the connectivity and cooperativeness of cognitive radio nodes [5]. The main idea of this paper is to perform pre-processying task based on clustering. They showed the effect of k-means clustering in terms of exchange messages and execution time. Reyes et al. [6] proposed a method for spectrum sensing based on the autocorrelation of the received samples. They observe the probability of detection and false alarm at different signal-to-noise ratio. This method is compared with the value of the autocorrelation at the first lag and also based on the power of the signal. Two sensing algorithms are suggested in [7], first, the ratio of maximum eigenvalue to minimum eigen value and the ratio is average eigenvalue to minimum eigen value. Random matrix theory is used to calculate the ratio from the maximum eigenvalue to the minimum eigenvalue as the test to identify the presence of primary users in [8] based on signal detection in the Rician fading channel. Patil et al. [9] presented a comprehensive survey of evolutionary achievements of eigenvalue based spectrum sensing algorithm. To decrease sensing time, a multi-taper two stage spectrum sensing is used. Eigenvalue based detection for multiantenna cognitive radio system has been proposed in [10] to reduce noise uncertainty and achieve high detection probability. They transfer the weighting issue of eigenvalue to the energy based detection and originate the theoretical expressions of detection threshold. Charan et al. [11] have projected the optimum number of samples for given SNR and also presented the theoretical analysis and numerical formula for optimum samples. Random matrix theory is used in [12] to compute the Eigen ratio and threshold for the detection method depending on sample covariance matrix of received signal. Zeng et al. [13] have proposed a new method based on the statistical covariance on autocorrelation of the received signal. They used the sample covariance matrix of maximum eigenvalue as the test statistic. Jacob et al. [14] have proposed a simple approach to predict the presence of primary users with the help of Bayesian theorem. The performance of Bayes approach is compared with exponential weighted moving average based approach to predict the status of spectrum occupancy. Marquez et al. [15] have developed a channel availability predictive model to take the advantages of dynamic spectrum opportunity. Additionally, Naïve Bayes algorithm has been used to predict the presence of primary user in each available frequency band. The formulation of realistic control has been used [16] to give the guarantee protection for primary user. They proposed suboptimal scheme to achieve better spectrum utilization at lower complexity and has been constructed based on dynamic interference graph. The doctoral dissertation [17] has presented the spectrum sharing in CRN with security constraints. Particle swarm optimization algorithm is proposed in [18] to assign the channel in CRN. The repair process is used to improve the spectrum usage in CRN and remove the conflicts between secondary user. The existing literatures are referred to identify the presence of primary user by using different sensing methods. In this work, we proposed clustering algorithms to form the spectrum coordinator then the spectrum coordinator identifies the primary user with Eigenvalue based detection method. Finally, Bayesian approach is proposed to predict the spectrum. This will improve the performance of the secondary user.
The major contributions of the work as follows:
• Forming the spectrum coordinator with different types of clustering algorithms.
• Sensing the spectrum through Eigenvalue based detection method.
• Predicting spectrum by Bayesian inference method.
The CRN architecture has two components, namely primary network and secondary network. The primary network is a licensed network where the primary users has right to access this network. The secondary network does not have any license in a specific band. But it can access the licensed band without interfering primary users [17]. A simple cognitive radio network model is considered in Fig. 1. It is clear that, the same frequency band is shared between the primary user and the secondary user.
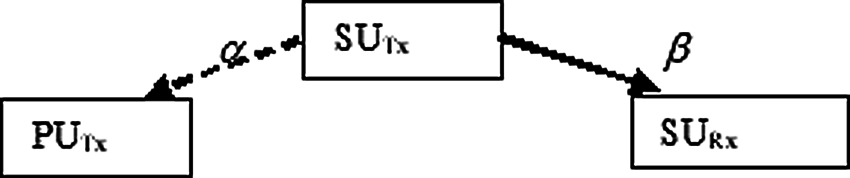
Figure 1: Single user sensing
In this model,
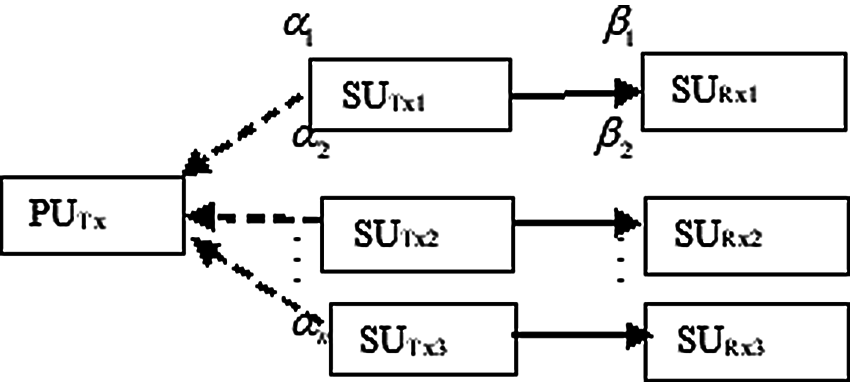
Figure 2: Multi user sensing
where
Each secondary user is responsible for sensing the spectrum and identifying the free spaces of the spectrum. Now the Spectrum Coordinator (SC) collects all the sensed information from the secondary users and maintains the sensing history. Then SC sends the sensing history to Fusion Center (FC) and proceeds the process of predicting the primary user arrival in the channel. The end result of the spectrum access is directed to SC. Final result is shared between multiple secondary users.
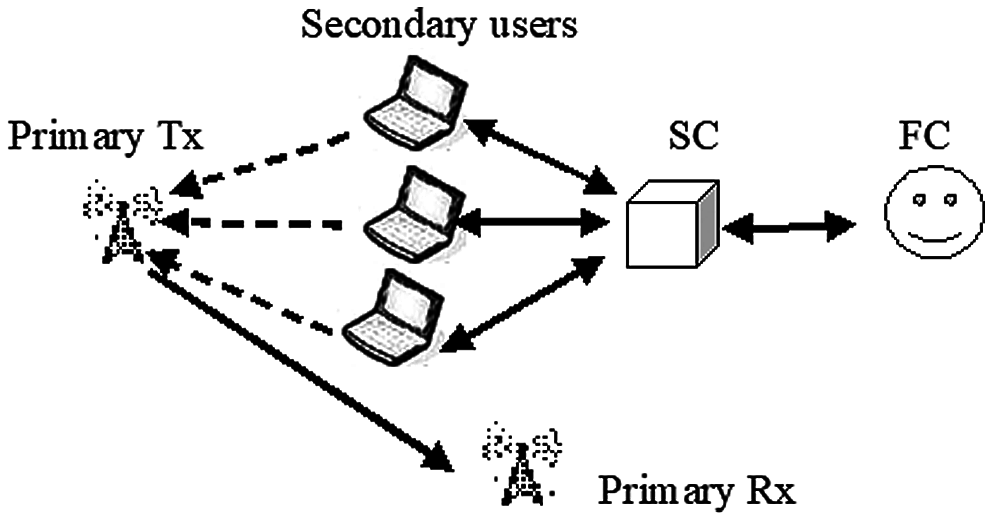
Figure 3: Cooperative spectrum sensing
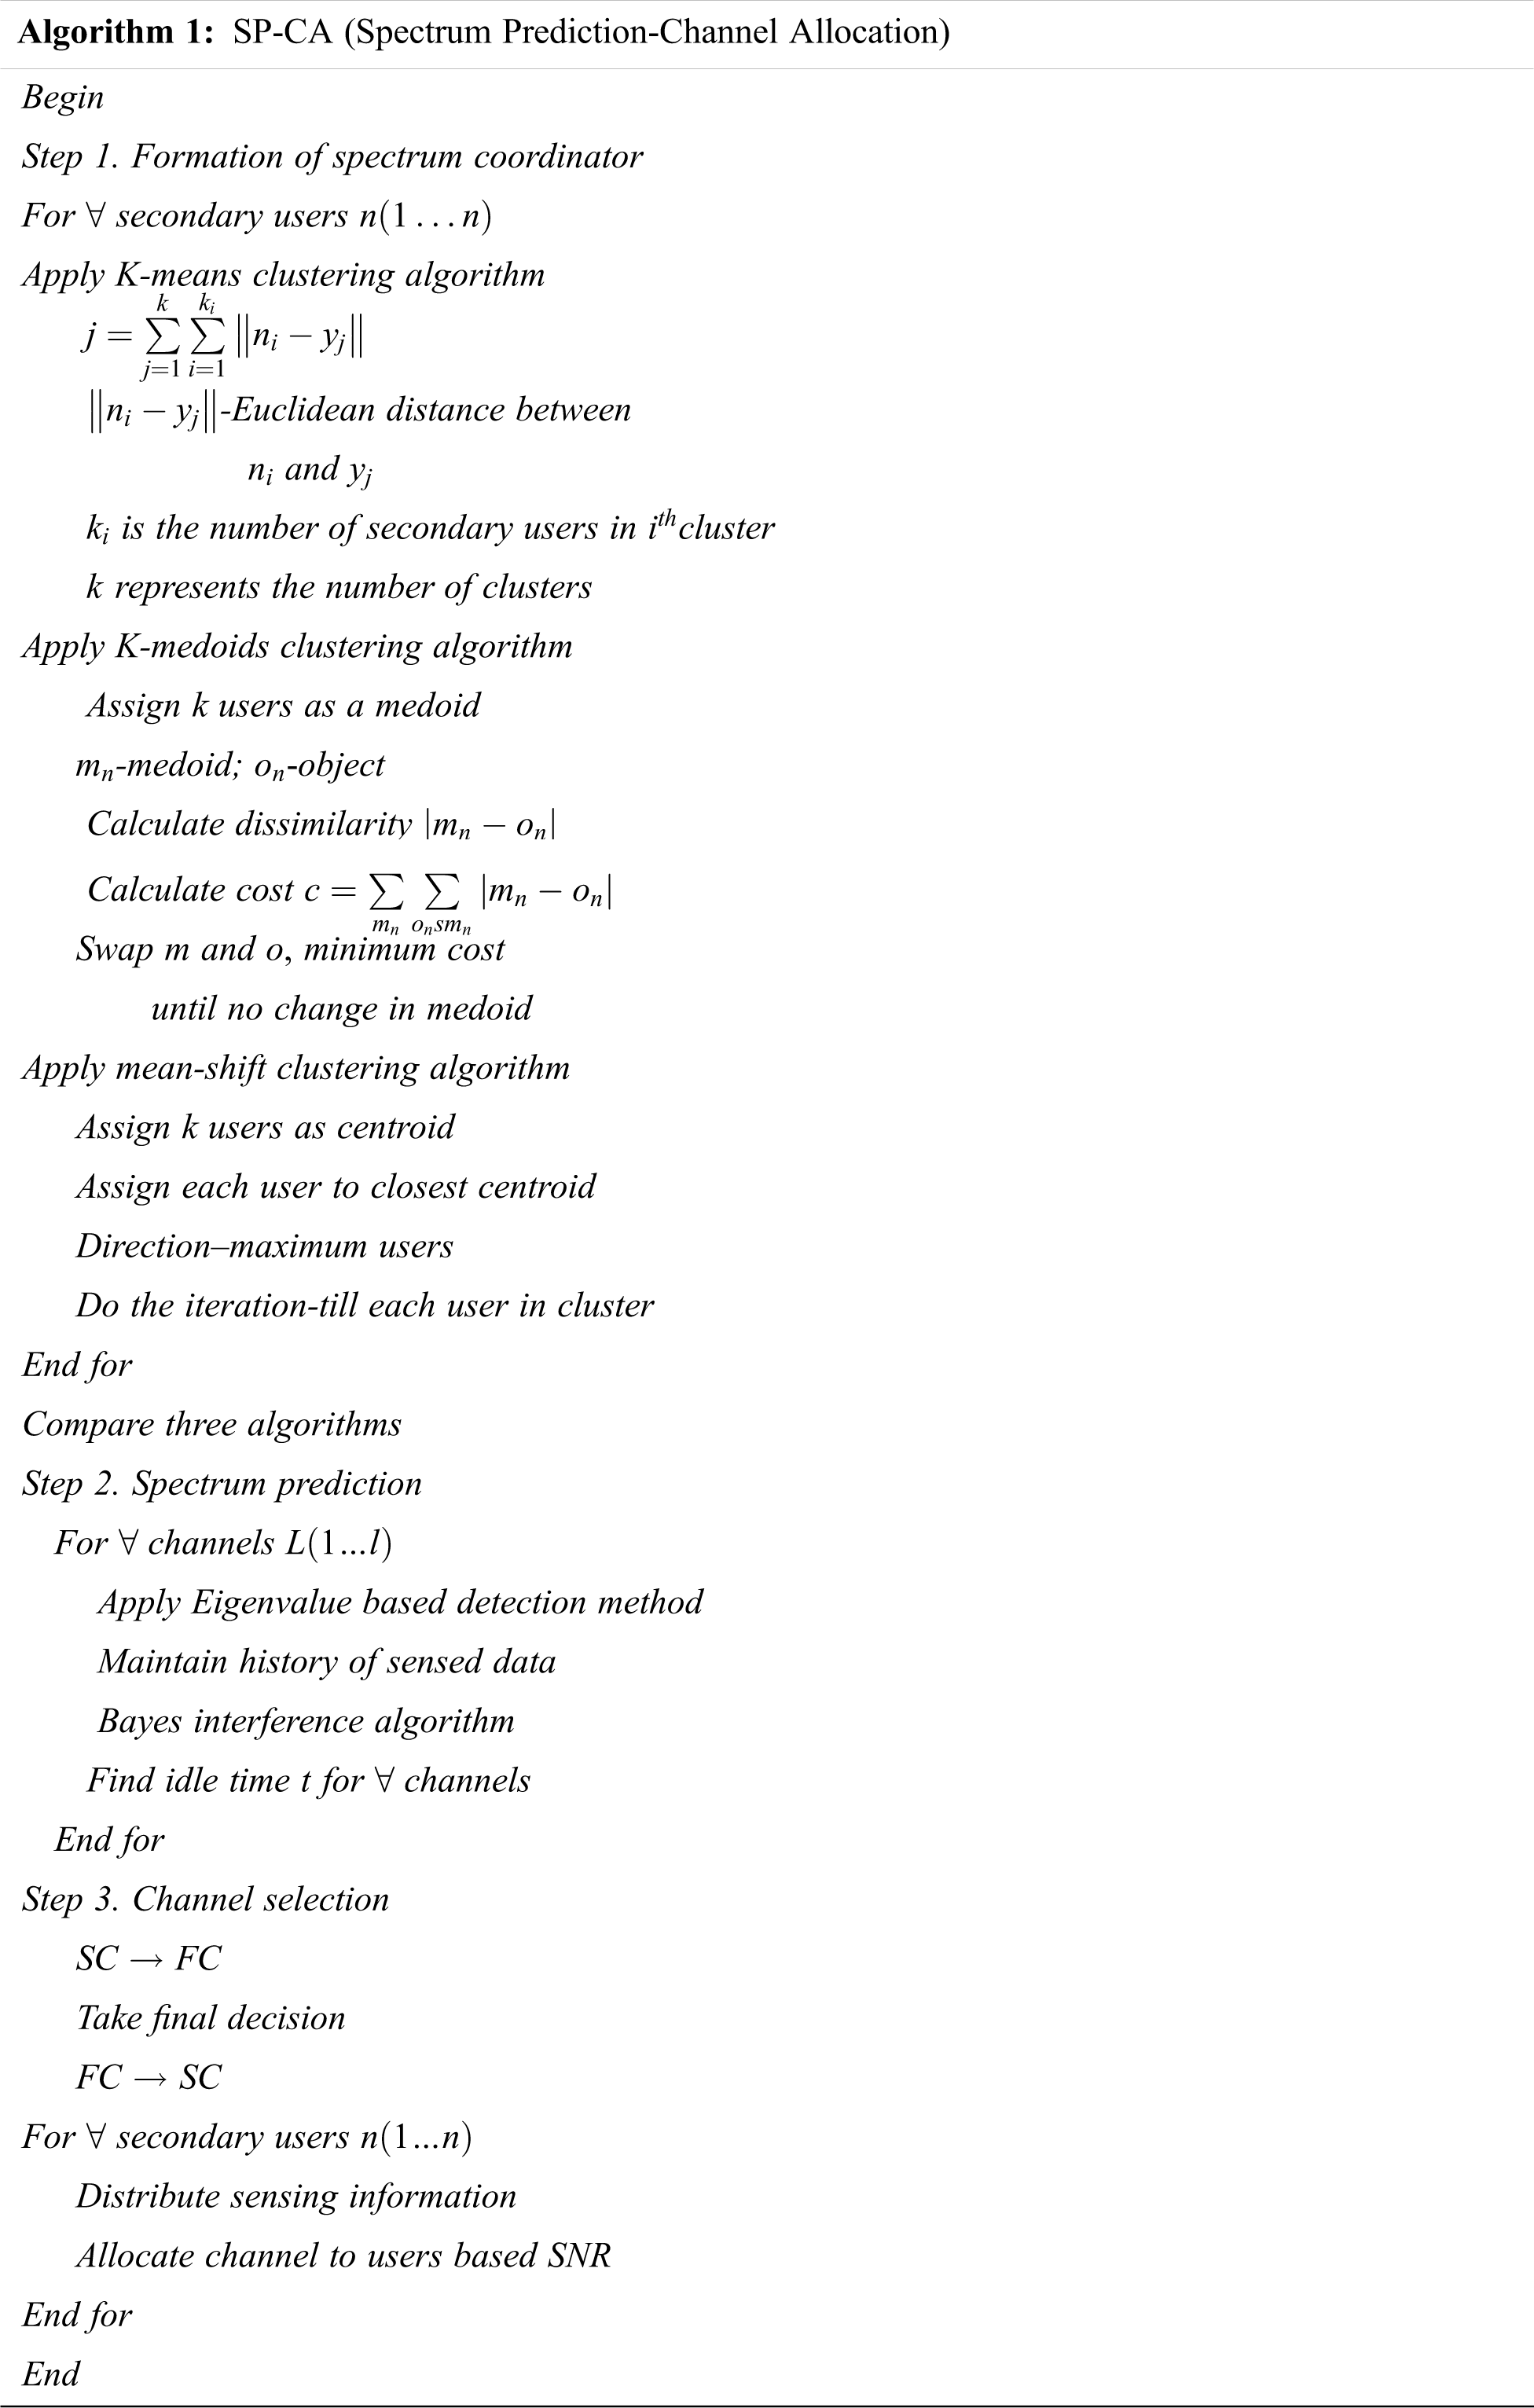
4 Algorithm for Proposed Model
An unsupervised learning algorithm named k-means is an iterative algorithm that tries to classify the dataset into a
K-medoids clustering is related to the k-means algorithm. Randomly select
The mean shift clustering is a centroid based algorithm that tries to find a center point of data points. It iteratively moves toward the centroid on each step until convergence. Given a set of
4.4 Eigenvalue Based Detection
Dynamic detection and effective use of an idle spectrum is termed as cognitive radio technology. The basic functions of CR are namely spectrum sensing, spectrum sharing, spectrum mobility, and spectrum decision. By using these four functions, CR users can employ the idle spectrum for their communications. Spectrum sensing is done by the Eigenvalue based detection method, it follows the concept of the covariance matrix of the received signal. The decision of spectrum sensing is defined between two states: the primary user is present or absent. The covariance of the received signal samples is to decide the same. The received signal is defined as
where
The statistical covariance matrices of the vectors
The matrix can be expressed as
Suppose if the signal is absent, then
In this method, CR users face non-negligible time delay in sensing and low efficiency in spectrum sharing. To overcome these problems prediction based techniques are used.
Spectrum prediction is a distinct approach to save the sensing time. In this work, the prediction of the spectrum is done by Bayesian inference approach. The prediction requisite is expressed as a Bayesian problem to find the solution through the Bayesian approach. The novelty of this method is that it utilizes the conditional probability of busy or idle previous states to predict the probability of the next idle state.
Bayes theorem is defined in [15]
In this approach, first prior knowledge is combined with observed data then the posterior probability is assigned to a class based on its prior probability and its likelihood of a given training data. The posterior probability is calculated with different number of hypothesis then the highest hypothesis with probability is selected. This is called a maximum of a posterior hypothesis.
Let assume
For example, a channel is divided into 60 time slots. The presence and absence of the primary user is specified in binary states. Each secondary user sense the channel effectively and maintain the sensing history as
We take the sensing history for 20 time slots. The secondary user sends this history to spectrum coordinator and it forwards to fusion center. Now the FC predicts the presence of primary user in future time slots.
First, we assign
Probability of a busy slot is defined as
Probability of idle slot is defined as
Probability of future busy state for the given present busy state is
where
= (0.3636 * 0.55) + (0.444 * 0.45)
= 0.3999
Probability of idle slots for both previous and current idle slots is referred as
where
= (0.1818 * 0.55) + (0.222 * 0.45)
= 0.1999
Probability of idle slots for current state is busy and future state is idle is stated as
= 0.66
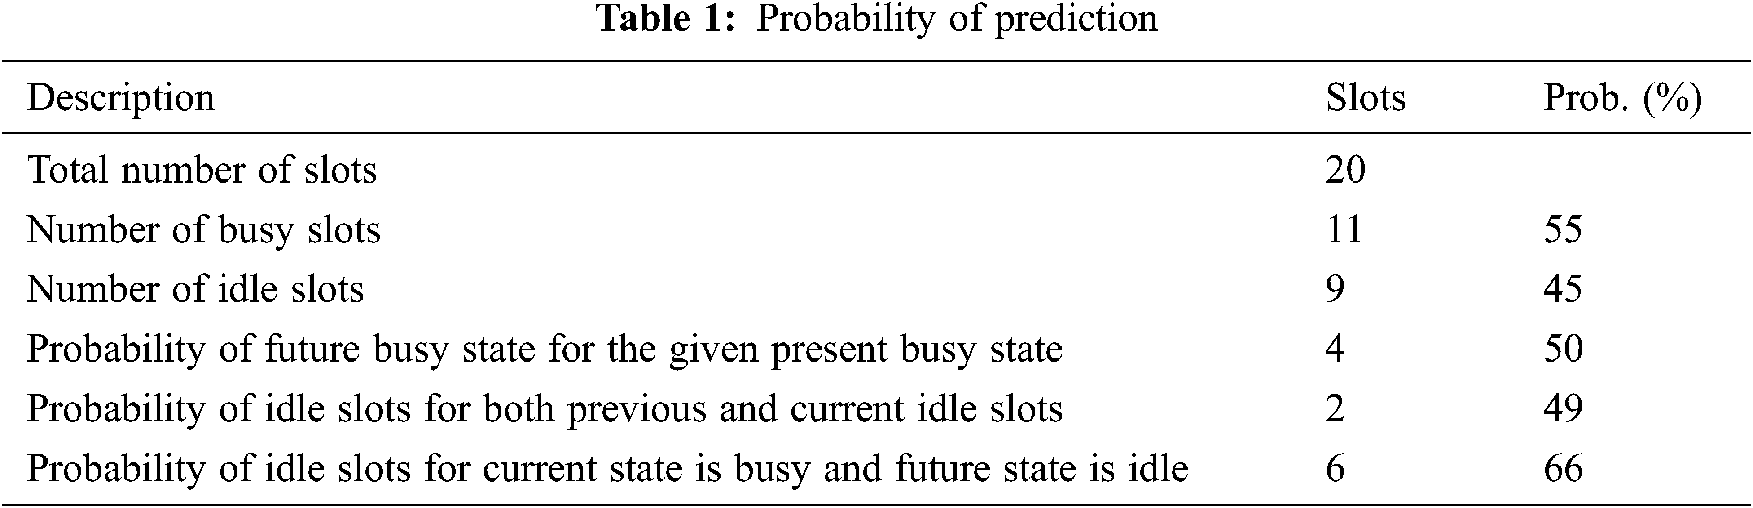
The above-said approach supports to predict the probability of future time slots that is calculated from the sensing history done by the FC. For this channel, the 20th slot is busy but the possibility of idle for 21st slot is 66%. The same process is followed for all channels. The final decision is forwards to the spectrum coordinator. The predicted probability of single channel is explained in Tab. 1.
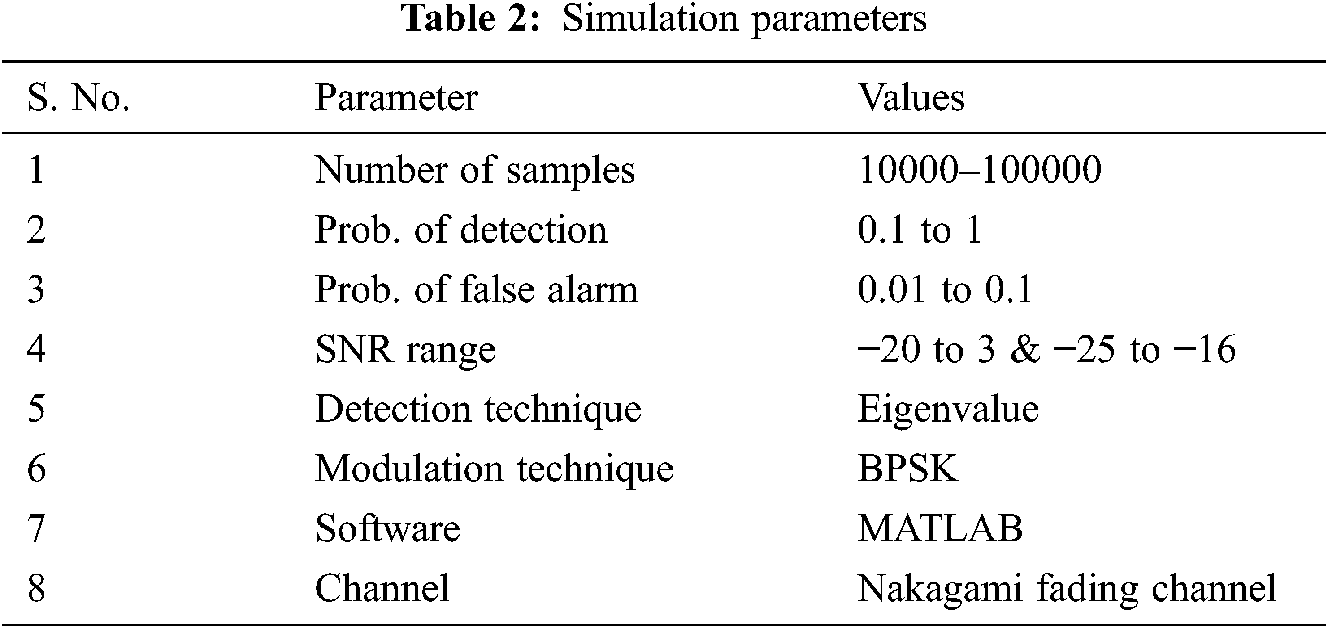
In this section, the performance of CRN is discussed with respect to channel sensing and channel allocation. For all simulation purposes, we have used MATLAB environment. The simulation parameters for spectrum sensing are shown in Tab. 2. Simulation results are taken by using BPSK modulated random primary signal. Self-sufficient and identically scattered noise samples with Gaussian distribution are used.
The two SNR ranges are considered in this paper. The first range is referred from [8], they used Rician fading channel for samples 100000. The same range and samples are specified in this paper for Nakagami fading channel and analyse the performance of the detection of the primary user. In paper [11], the author utilizes the second SNR range for Nakagami fading channel but the samples are 200 to 2000. At the same time, we anticipate the second SNR range for observing the probability of detection of primary user in high SNR.
Initially, we assumed that 100 secondary users are continuously monitor the spectrum for data transmission. The spectrum coordinator is selected by using k-means, k-medoids and mean shift clustering algorithms. Fig. 4 Depict the experimental result of k-means algorithm. Here we selected 3 spectrum coordinators out of 100 secondary users based on the distance. The spectrum coordinators are shown in black color.
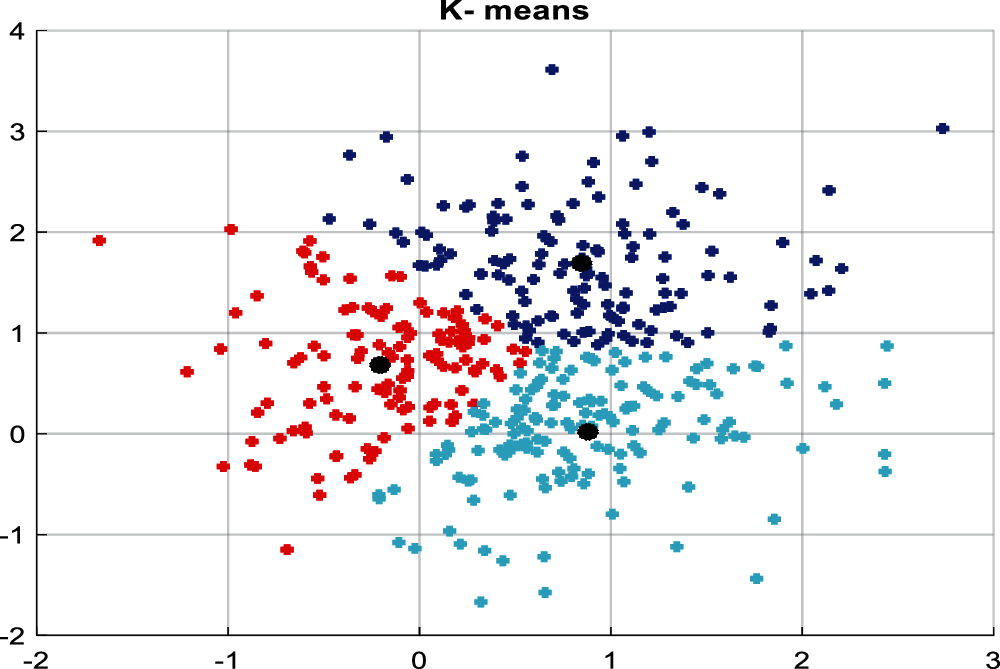
Figure 4: K-means clustering
Fig. 5 represents the performance of k-medoids algorithm. Determining cluster assignments and cluster centers are both done in an efficient and vectorised way. For this clustering, it requires only distance matrix and number of clusters.
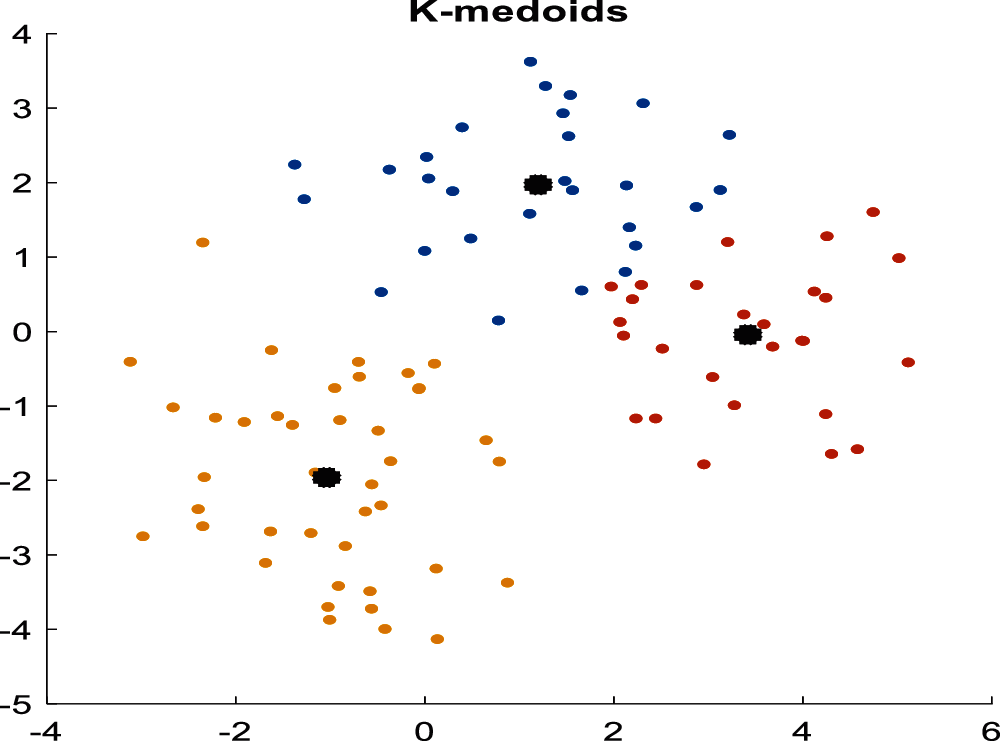
Figure 5: K-medoids clustering
The execution of mean shift clustering is shown in Fig. 6. It is hierarchical in nature, which constructs hierarchy of clusters step by step. Starting on all data points, calculate the mean for which lies inside the window. And move to the window based on the location of the mean. Repeat this process until it reaches convergence.
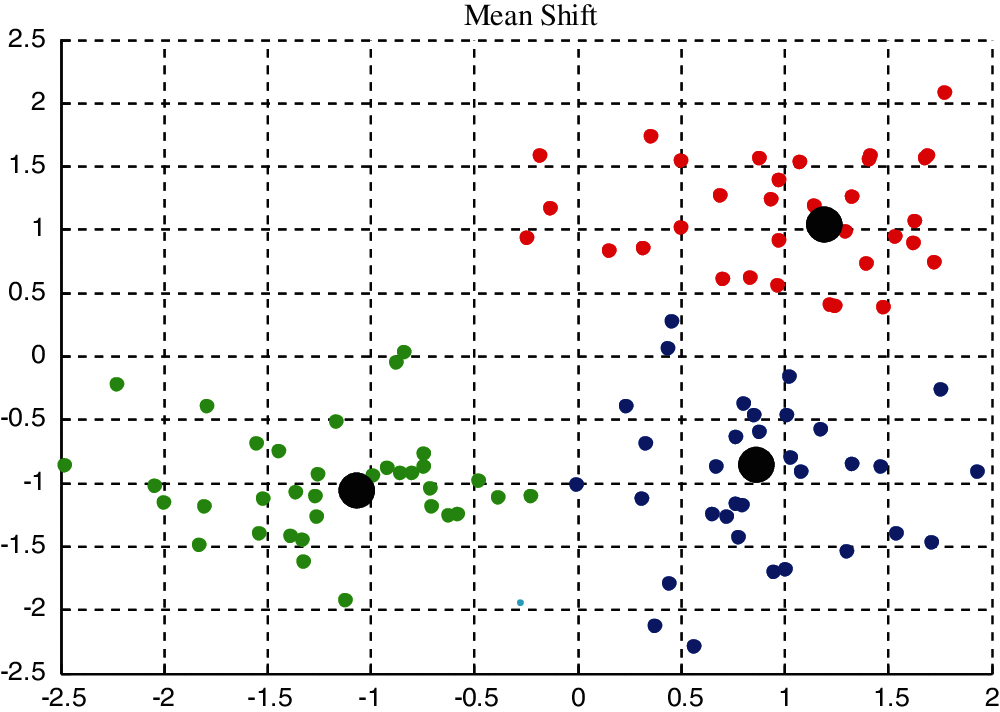
Figure 6: Mean shift clustering
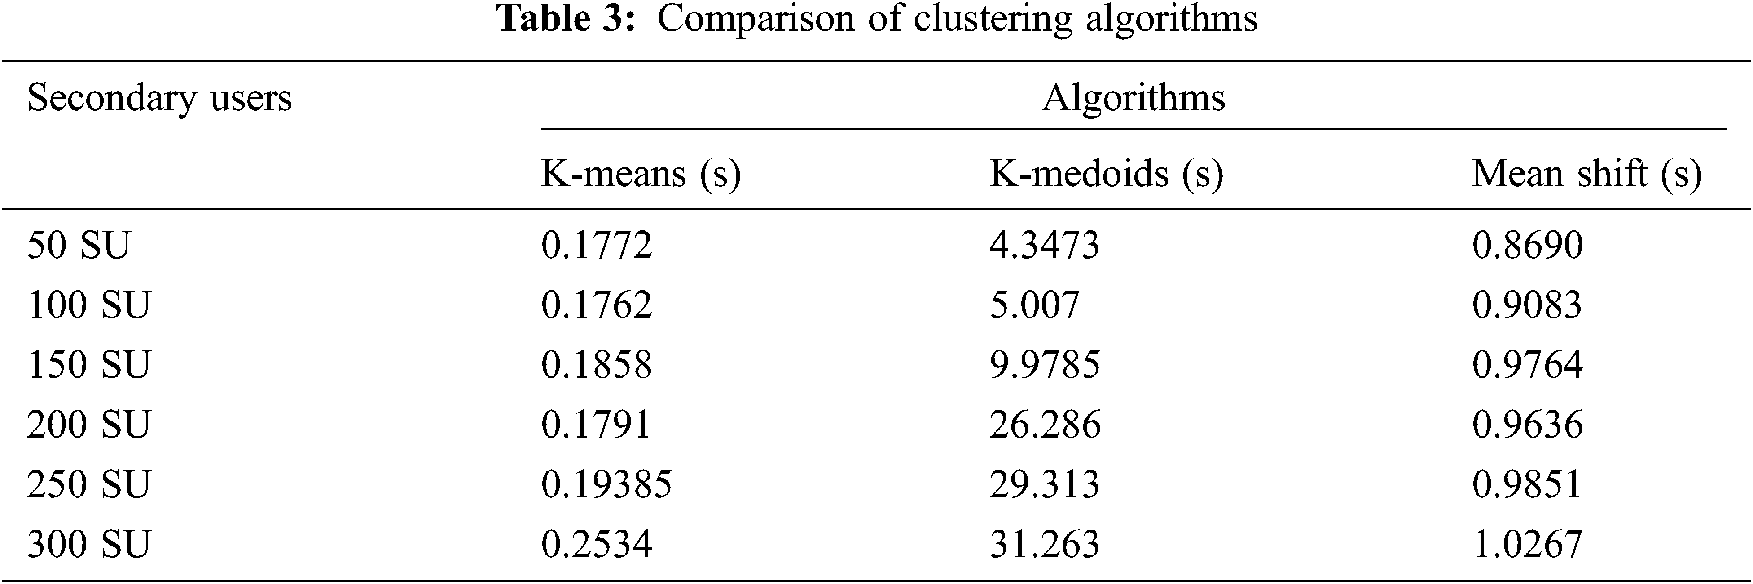
The comparison of the above three algorithms is illustrated in Tab. 3. In this table, the secondary users vary from 50 to 350. The k-means algorithm provides better performance than other two algorithms. When the changes are made in the number of secondary users k-means algorithm takes minimum time for assigning spectrum coordinator than k-medoids and mean shift algorithms. But mean shift algorithm automatically assigns the clusters whereas k-means assigns the number of clusters in prior.
While using independent and identically distributed signal, the energy detection technique is optimal for detection. But it is not optimal for detecting correlated signal. So this paper focuses on eigenvalue based spectrum sensing. It is based on the eigenvalues of the covariance matrix of the received signal. It is shown that the ratio of the maximum eigenvalue to the minimum eigenvalue can be used to detect the presence of the signal.
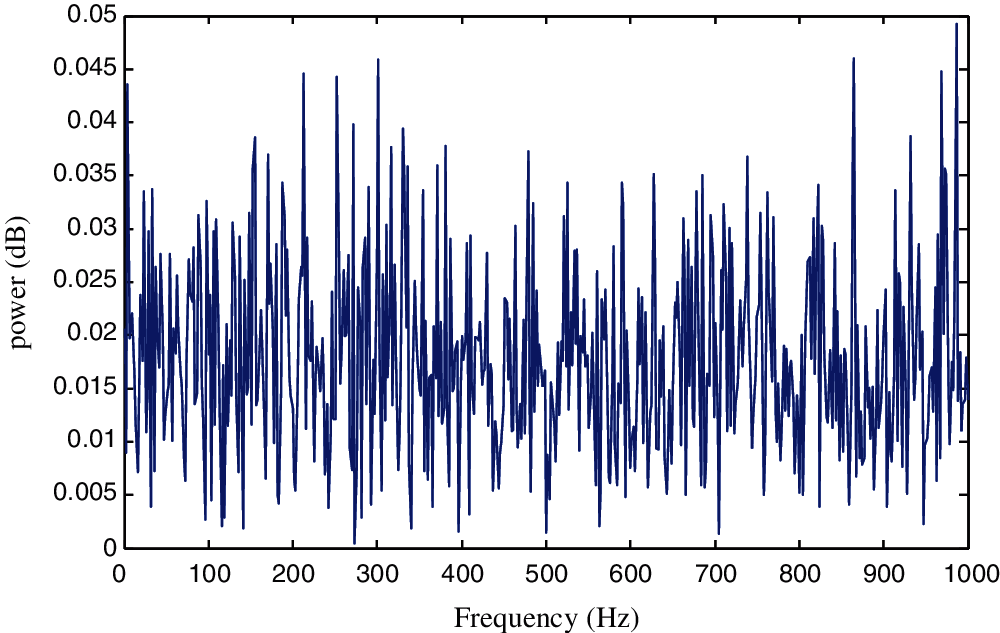
Figure 7: Power spectrum in bandwidth 1–100 Hz
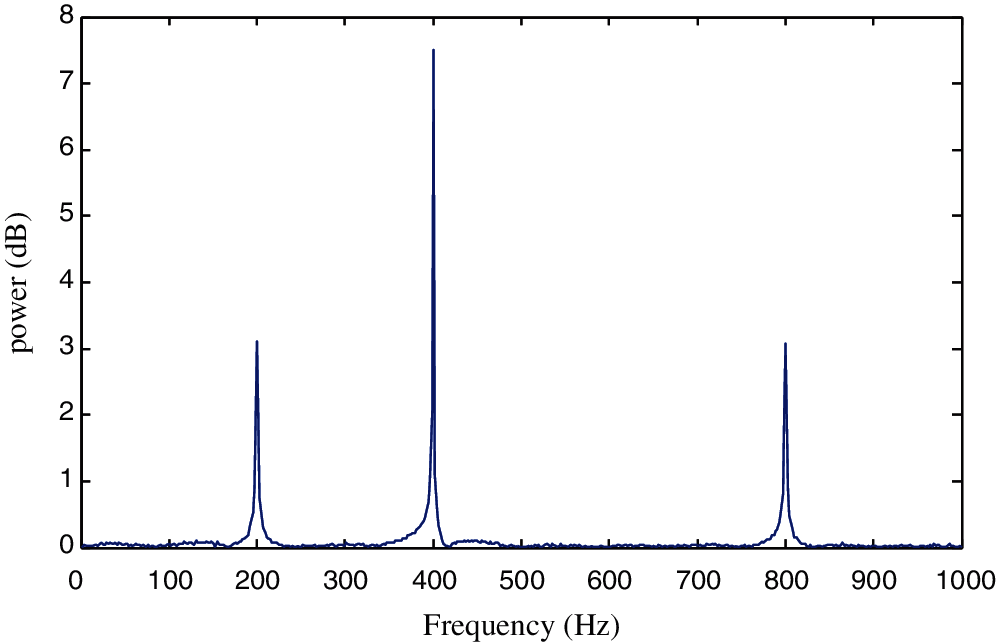
Figure 8: Power spectrum over entire bandwidth
First, the sample covariance matrix is calculated from the received signal. Then the ratio is determined between the maximum Eigen value to minimum Eigen value. The ratio is then compared with the threshold value to determine whether the signal exists or not. Fig. 7 shows the power spectrum in 1 to 100 bandwidth. Fig. 8 illustrates the presence of primary user signal in 1 to 1000 bandwidth. Here we identified three primary users in the entire bandwidth.
Fig. 9 depict the comparative Receiver Operating Characteristic (ROC) curve of ED & MME with Pd Verses SNR at different value of samples (10000 & 50000) respectively. It is clear that Pd is higher for MME when compared to ED with various SNR levels from −25 to −16. The probability of detection for MME is 0.6780 but in (b) the probability of detection is 0.9970. It is showed that, when the number of samples is increase the detection is also increased.
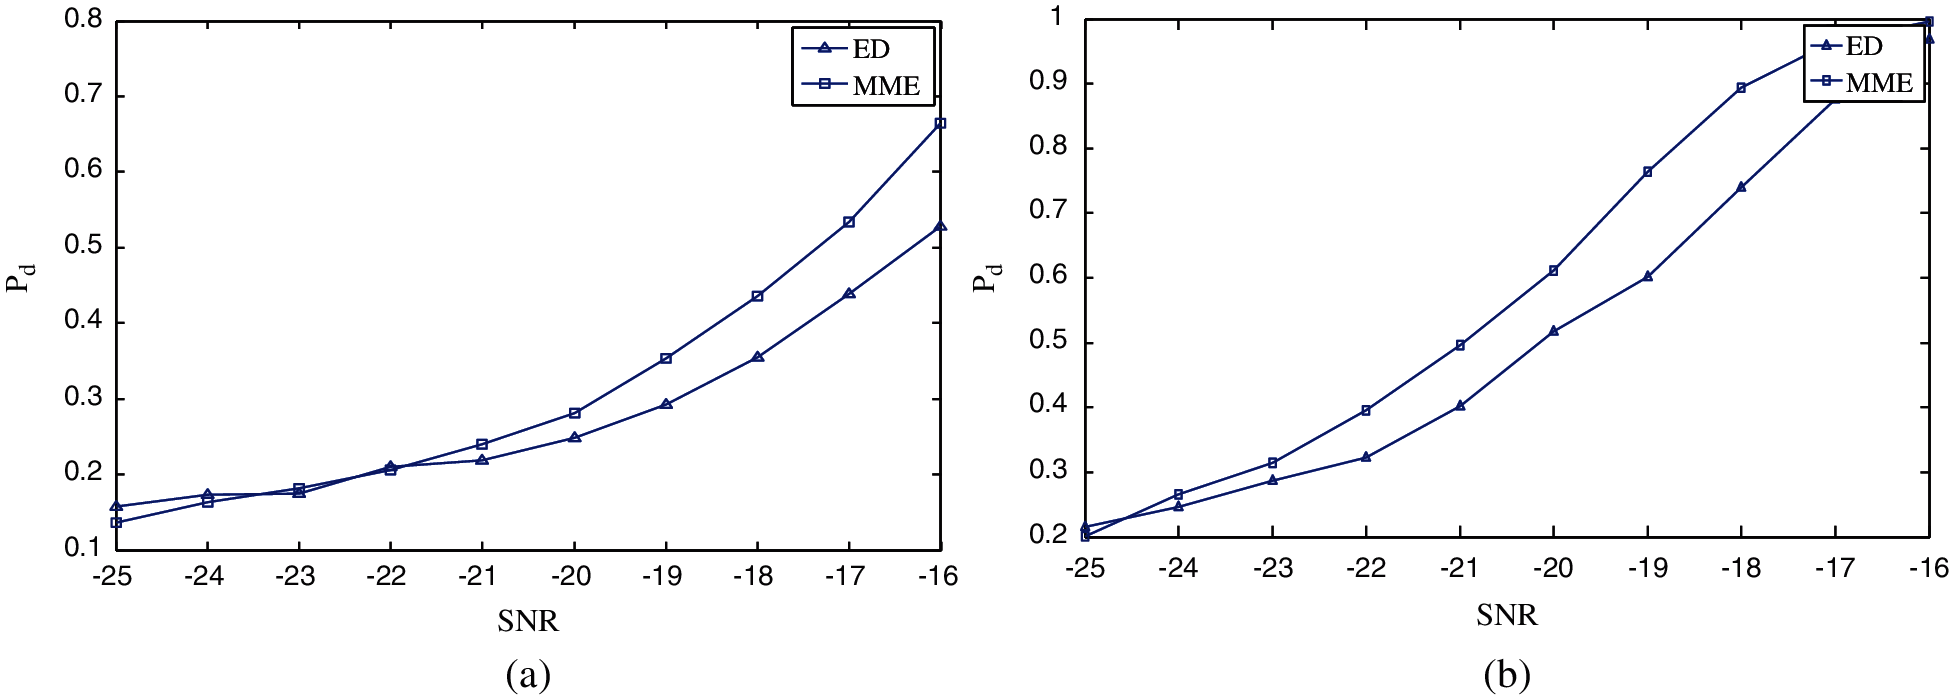
Figure 9: ROC for probability of detection vs. SNR (a) Number of samples N = 10000 (b) Number of samples N = 50000
Numerical evaluation of comparison of ED and MME is given in Tab. 4. Here we analyze the performance of detection probability in various false alarm rate for 10000 samples. The MME achieves better detection probability than ED. From the above ROC, it is proved that MME achieves good performance at higher number of samples. The changes in false alarm does not affect in the probability of detection of primary user.
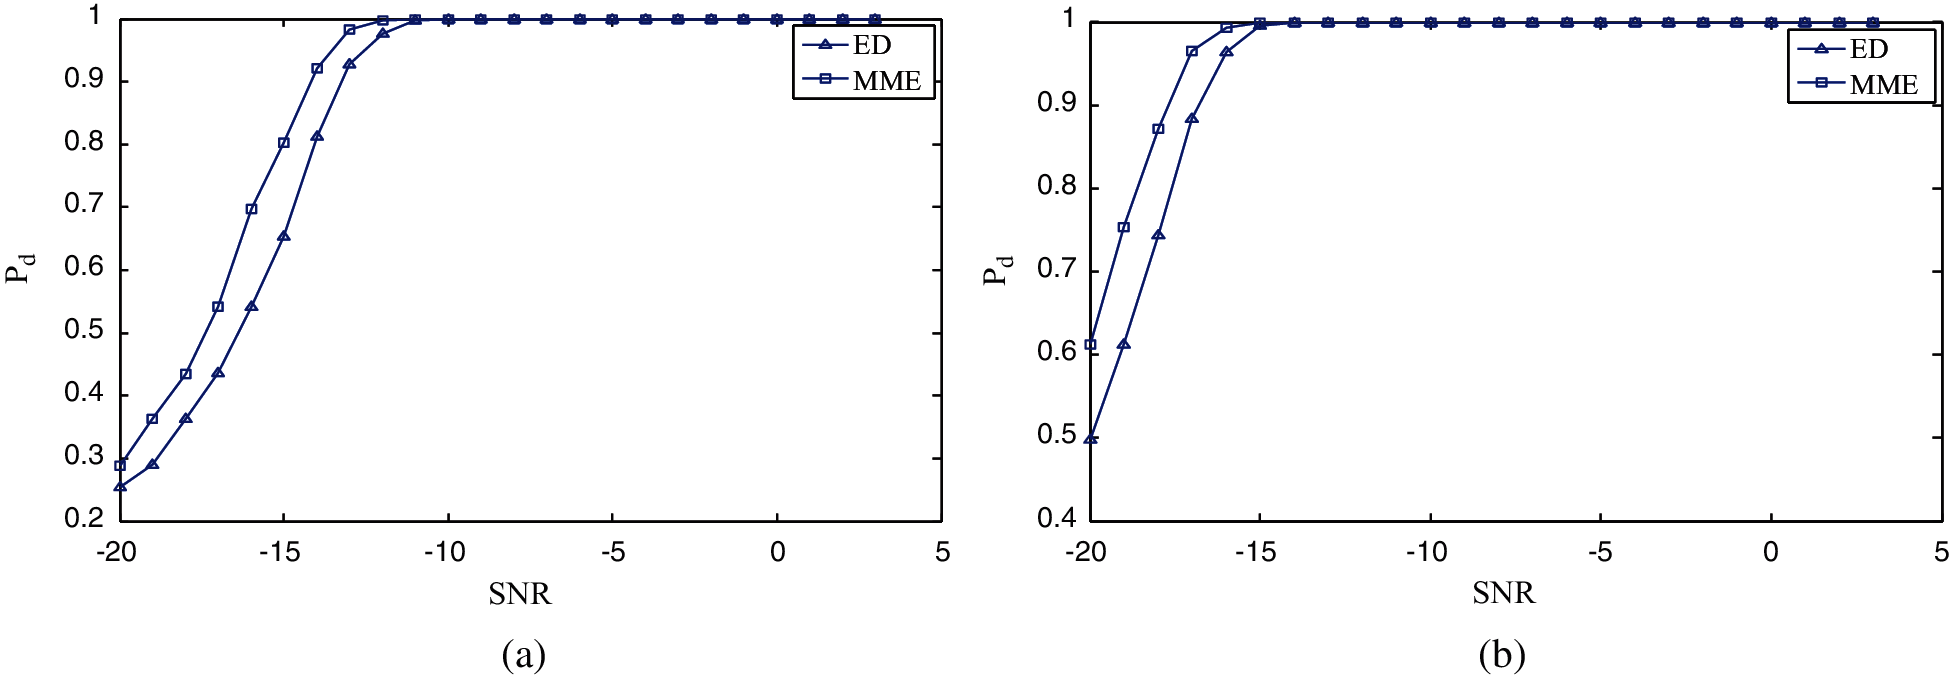
Figure 10: ROC for probability of detection vs. SNR (a) Number of samples N = 10000 (b) Number of samples N = 50000
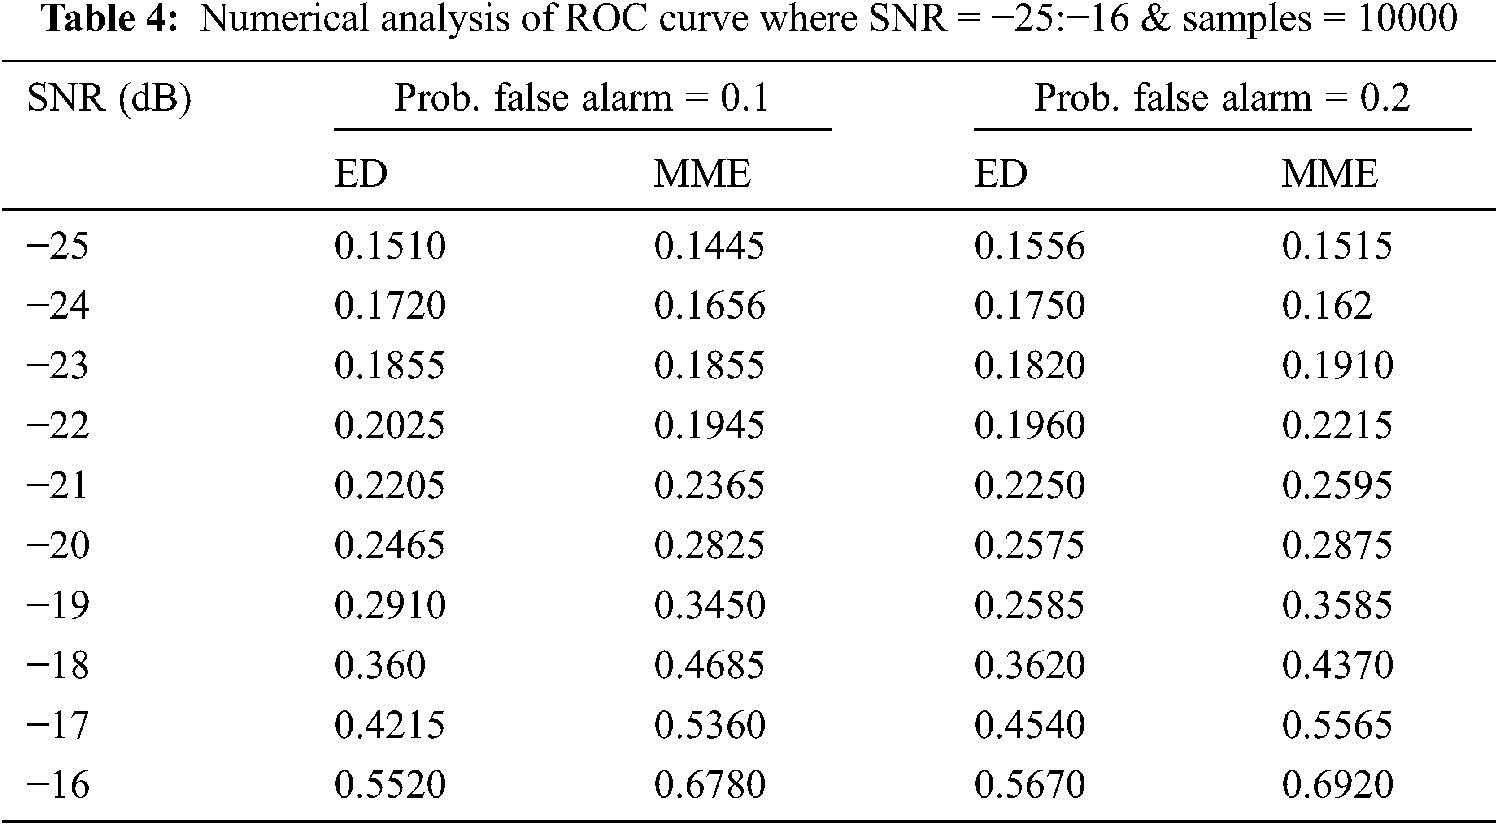
Fig. 10 give a picture of a ROC curve between ED and MME with Pd vs. SNR. The samples used at this point are (10000 & 50000) but the SNR ratio is −20:3. It is substantiated that, the Pd values of MME succeeds improving performance than ED after changing the SNR ratio level. The performance of Pd for MME is achieved at −18 dB in Rician fading channel for 100000 samples [8]. But in Nakagami fading channel, the Pd is achieved at −16 dB.
The comparison of numerical analysis of ED and MME is shown in Tab. 5. Here we change the SNR level as −20:3, Pfa = 0.1, 0.2, 0.8 and samples = 10000. The MME achieves better detection probability than ED at −11 dB itself. The comparison of various false alarm rate is calculated. It is clear that, the changes in false alarm does not affect the probability of detection.
Naive Bayes is a classification algorithm; it is easy to implement when the input values are described in a binary form. In this classification, our hypothesis (
After calculating the posterior probability for a number of different hypothesis, the maximum probable hypothesis is selected using
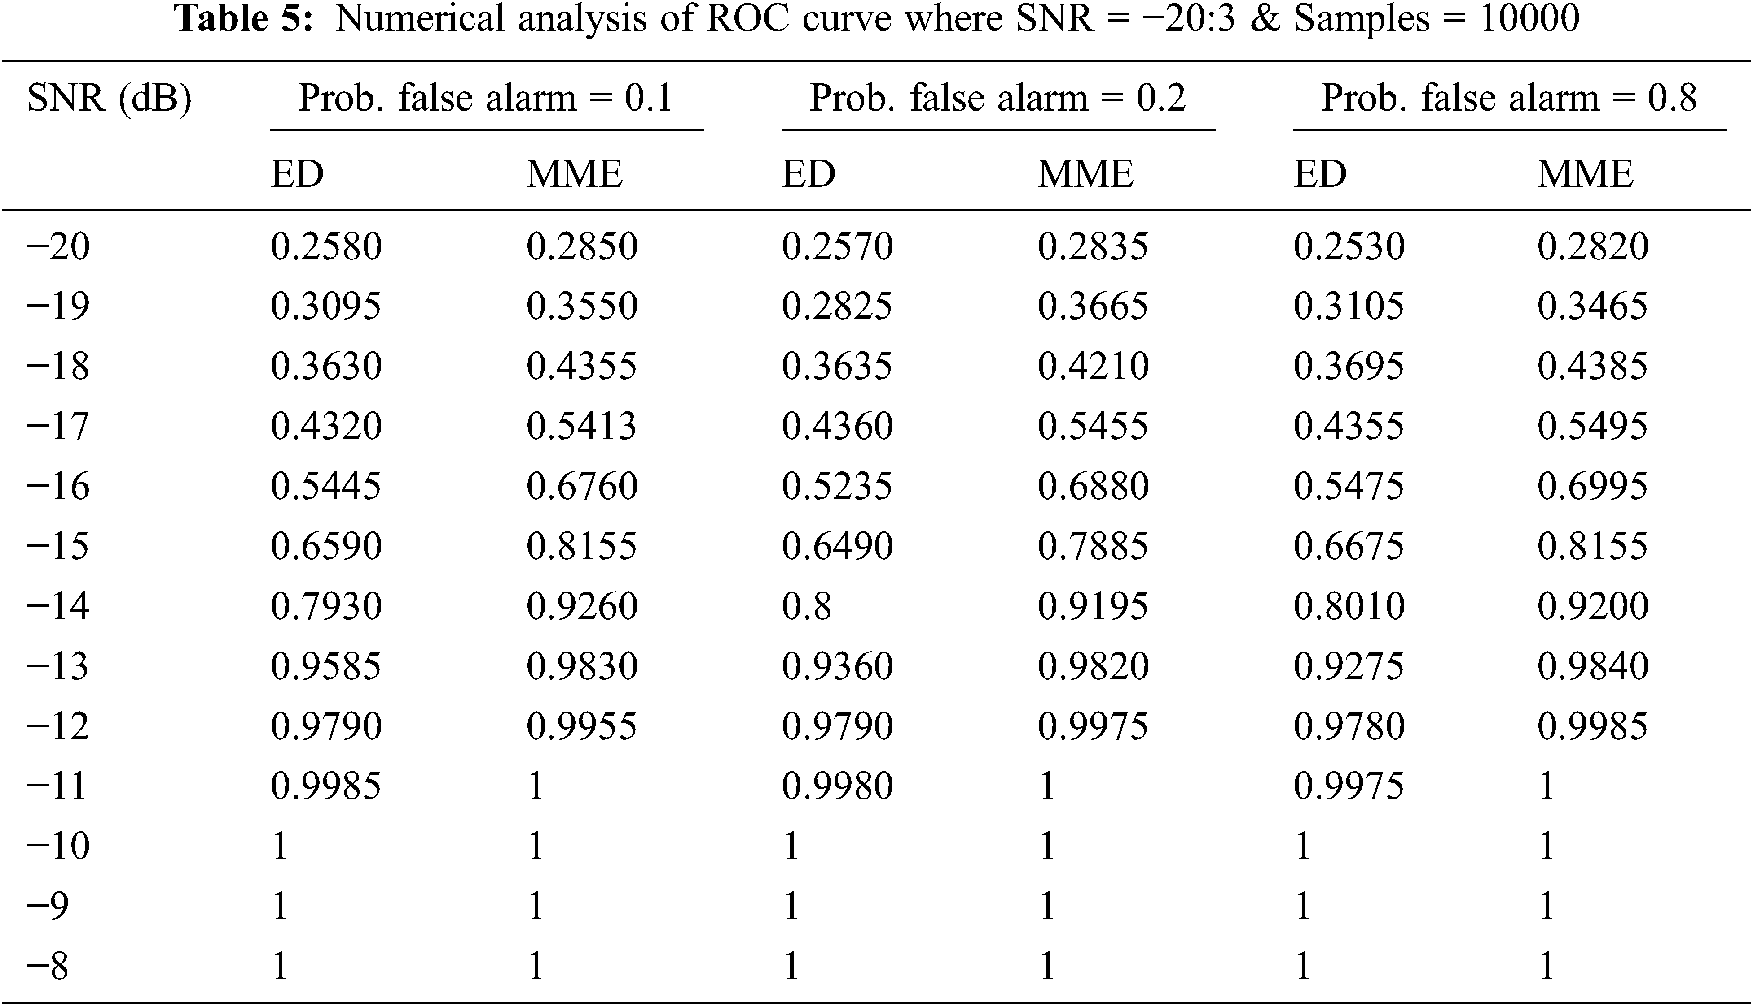

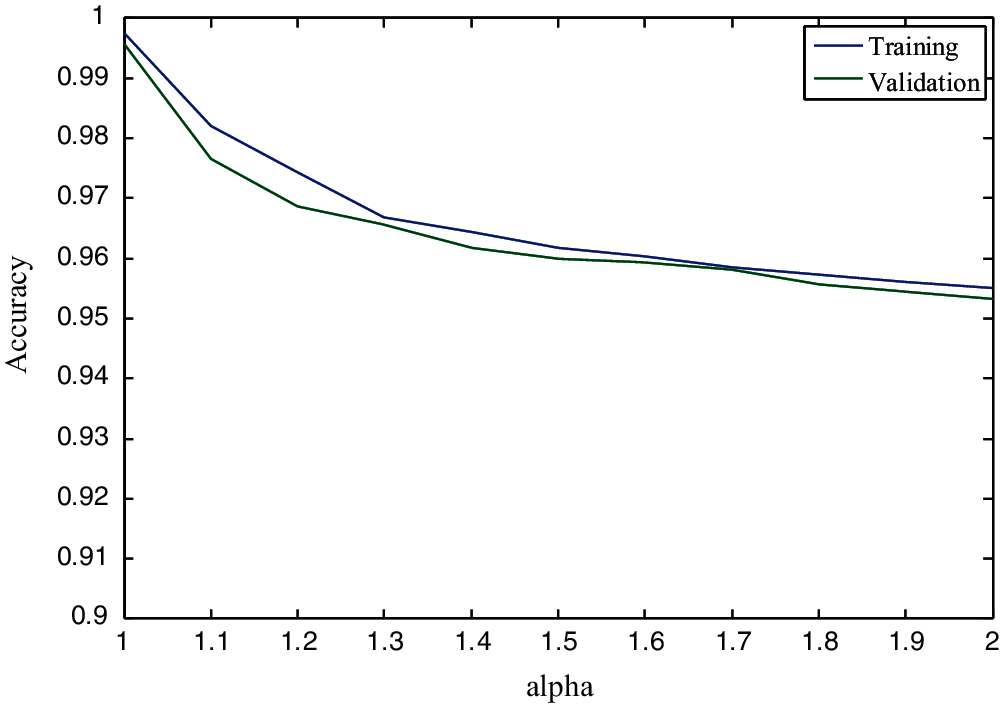
Figure 11: Bayes classification
First, we execute the Bayesian approach for sample datasets and finds the accuracy of training and validation. Fig. 11 refers to the accuracy of the probability of Bayes classification algorithm during training and validation for varying alpha value. It is perceived that; the direction of training is same as the validation. But the training peaks are slightly higher than the validation.

Figure 12: Signal prediction
Prediction accuracy = 95.191%
Elapsed time is 3.396683 s.
Fig. 12 describes the comparison between actual probability and predicted probability of signal prediction. The actual probability is referring to traditional sensing of a channel. Due to channel switching and interference with primary user it achieves low probability. But the prediction is done in efficient way and it achieves 95% accuracy in 3 s. This procedure is repetitive for 25 times for one channel and it follows for all channels. The predicted channel is allocated to the secondary user through the spectrum coordinator.
An effective, centralized cooperative method is used to improve the spectrum utilization and to solve the spectrum scarcity problem. Eigen value based detection method is applied to reduce the sensing time and improves the detection performance. Bayes inference approach is utilized to predict the channel quality based on inferred channel idle duration and spectrum, sensing accuracy. The channel is selected based on the channel quality and allocated to the secondary user. The ED and MME are compared in terms of various SNR levels and number of samples. The simulation results show that the MME gives better performance than ED method. In future, the mobility of secondary user and activity of primary user to be considered and compared with other existing algorithms.
Funding Statement: The authors received no specific funding for this study.
Conflicts of Interest: The authors declare that they have no conflicts of interest to report regarding the present study.
1. Y. Arjoune and N. Kaabouch, “A comprehensive survey on spectrum sensing in cognitive radio networks: Recent advances, new challenges, and future research directions,” Sensors: MDPI, vol. 19, pp. 1–32, 2019. [Google Scholar]
2. R. Saifan, I. Jafar and G. Al Sukkar, “Optimized cooperative spectrum sensing algorithms in cognitive radio network,” The Computer Journal, vol. 60, no. 6, pp. 835–849, 2017. [Google Scholar]
3. K.-L. A. Yau, N. Ramli, W. Hashim and H. Mohamad, “Clustering algorithms for cognitive radio networks: A survey,” Journal of Network and Computer Applications, vol. 45, no. 13, pp. 79–95, 2014. [Google Scholar]
4. S. Kumar and A. K. Singh, “A localised algorithm for clustering in cognitive radio networks,” Journal of Kingsaud University-Computers and Information Sciences, vol. 33, pp. 1208–1209, 2018. [Google Scholar]
5. B. Benmammar, M. H. Taleb and F. Krief, “Diffusing-CRN k-means: An improved k-means clustering algorithm applied in cognitive radio ad hoc networks,” Wireless Networks, vol. 23, no. 6, pp. 1849–1861, 2017. [Google Scholar]
6. H. Reyes, S. Subramaniam, N. Kaabouch and W. Chen, “A spectrum sensing technique based on autocorrelation and Euclidean distance and its comparison with energy detection for cognitive radio networks,” Computers and Electrical Engineering, vol. 52, no. 3, pp. 319–327, 2016. [Google Scholar]
7. Y. Zeng and Y.-C. Liang, “Eigenvalue-based spectrum sensing algorithms for cognitive radio,” IEEE Transactions on Communications, vol. 57, no. 6, pp. 1784–1793, 2009. [Google Scholar]
8. S. Feng, Y.-bin Chen and F. Gao, “Signal detection based on maximum-minimum Eigenvalue in Rician fading channel,” in IEEE Int. Conf. on Advanced Information Communication Technology, Berlin, Heidelberg, pp. 160–168, 2013. [Google Scholar]
9. K. P. Patil, A. S. Lande and M. H. Naikwadi, “A Review on the evolution of Eigenvalue based spectrum sensing algorithms for Cognitive radio,” Network Protocols and Algorithms, vol. 8, no. 2, pp. 58–77, 2016. [Google Scholar]
10. S. S. Ali, C. Liu, J. Liu, M. Jin and J. M. Kim, On the Eigenvalue Based Detection for Muliantenna Cognitive Radio System. vol. 2016. London, United Kingdom: Hindawi Publishing Corporation, pp. 1–8, 2016. [Google Scholar]
11. C. Charan and R. Pandy, “Eigenvalue-based Reliable spectrum sensing scheme for cognitive radio networks,” in Int. Conf. on Nascent Technologies in the Engineering, Vashi, India, pp. 1–5, 2017. [Google Scholar]
12. S. Jain, D. Pancholi and P. Sharma, “Eigenvalue detection for spectrum sensing in cognitive radio network over Nakagami fading channel,” International Journal of Advanced Research in Electronics and Communication Engineering, vol. 7, pp. 604–608, 2018. [Google Scholar]
13. Y. Zeng, C. L. Koh and Y.-C. Liang, “Maximum Eigenvalue detection: Theory and application,” in IEEE Int. Conf. on Communications, Beijing, China, pp. 1–6, 2008. [Google Scholar]
14. J. Jacob, B. R. Jose and J. Mathew, “Spectrum prediction in cognitive radio networks: A Bayesian approach,” in Int. Conf. on Next Generation Mobile Applications, Services and Technologies, Oxford, UK, pp. 203–208, 2014. [Google Scholar]
15. H. Marquez, C. Hernandez and D. Giral, “Channel availability prediction in cognitive radio networks using Naïve Bayes,” Contemporary Engineering Sciences, vol. 10, pp. 593–605, 2017. [Google Scholar]
16. A. T. Hoang and Y.-C. Liang, “Maximizing spectrum utilization of cognitive radio networks using channel allocation and power control,” in IEEE Vehicular Technology Conf., Montreal, QC, Canada, pp. 1–5, 2006. [Google Scholar]
17. L. Sibomana, “Performance analysis of cognitive radio networks under spectrum sharing and security constraints,” Doctoral Dissertation, Blekinge Institute of Technology, Sweden, 2016. [Google Scholar]
18. S. Latif, S. Akraam, A. J. Malik, A. A. Abbasi, M. Habib et al., “Improved channel allocation scheme for cognitive radio networks,” Intelligent Automation & Soft Computing, vol. 27, no. 1, pp. 103–114, 2021. [Google Scholar]
 | This work is licensed under a Creative Commons Attribution 4.0 International License, which permits unrestricted use, distribution, and reproduction in any medium, provided the original work is properly cited. |