DOI:10.32604/iasc.2022.021507

| Intelligent Automation & Soft Computing DOI:10.32604/iasc.2022.021507 |  |
| Article |
COVID-19 Pandemic Prediction and Forecasting Using Machine Learning Classifiers
1Department of Computer Science, College of Computer and Information Sciences, Majmaah University, Al Majmaah, 11952, Kingdom of Saudi Arabia
2Department of Computer Science, Aligarh Muslim University, Aligarh, 202002, India
3Department of Computer Science, Jazan University, Jazan, 45142, Kingdom of Saudi Arabia
4Rajiv Gandhi University of Knowledge Technologies, Hyderabad, 504107, India
5University of Duisburg-Essen, Duisburg, 45141, Germany
6Bhagwan Parshuram Institute of Technology (BPIT), Guru Gobind Singh Indraprastha University (GGSIPU), New Delhi, 110089, India
*Corresponding Author: Jabeen Sultana. Email: j.sultana@mu.edu.sa
Received: 05 July 2021; Accepted: 17 August 2021
Abstract: COVID-19 is a novel virus that spreads in multiple chains from one person to the next. When a person is infected with this virus, they experience respiratory problems as well as rise in body temperature. Heavy breathlessness is the most severe sign of this COVID-19, which can lead to serious illness in some people. However, not everyone who has been infected with this virus will experience the same symptoms. Some people develop cold and cough, while others suffer from severe headaches and fatigue. This virus freezes the entire world as each country is fighting against COVID-19 and endures vaccination doses. Worldwide epidemic has been caused by this unusual virus. Several researchers use a variety of statistical methodologies to create models that examine the present stage of the pandemic and the losses incurred, as well as considered other factors that vary by location. The obtained statistical models depend on diverse aspects, and the studies are purely based on possible preferences, the pattern in which the virus spreads and infects people. Machine Learning classifiers such as Linear regression, Multi-Layer Perception and Vector Auto Regression are applied in this study to predict the various COVID-19 blowouts. The data comes from the COVID-19 data repository at Johns Hopkins University, and it focuses on the dissemination of different effect patterns of Covid-19 cases throughout Asian countries.
Keywords: COVID-19; pandemic; linear regression; multilayer perceptron; vector auto regression
The COVID-19 outbreak has been confirmed among 140 million people worldwide, with a mortality rate of 3.05%. The mortality rate is gradually increasing, which is a worrying trend for all countries. Based on the mode of spread and time, transmission is divided into four phases. In the case of a common attempt to tackle the spread of this epidemic, each nation implemented various methodologies ranging from staying at home, wearing masks, limiting movement, avoiding social events, constantly washing hands, and sanitizing the environment. Many nations have implemented a condition of lockout to keep civilians from moving about excessively. The health and economy of different countries were jeopardized due to this societal distancing aspect and activity constraints. As a result, the GPD has dropped drastically for all countries. When an individual is discovered to be sick is isolated and given medication to help him heal. However, depending on the severity, this can lead to death or make people more depressed. The coronavirus epidemic in Asian Countries has non-continuous functioning of society as an entire, and everyone was asked to keep a reasonable distance to avoid this. Confirmed cases return from surveillance at an early stage, followed by local broadcast. Elders are treated with great care, and people with lower immunity are minors. The majoritarian infected is 45+ years based on demographics environmental factors. People between the ages of 35 and 70 are disproportionately impacted. Everyday COVID-19 predominance data is collected by Johns Hopkins University and updated on the Website from February 22, 2020, to April 21, 2021 [1]. The information was decoded using Weka 3.8.43 and Orange 4 [2]. To predict the potential results of the world’s COVID-19 pandemic, MLP, LR, and VAR are used to Johns Hopkins University’s COVID-19 data set of 100 instances. The need of the hour is forecasting, which aids in developing a more assertive approach to deal with the trenchant time of the world due to this infectious disease. Humankind has seen many disease epidemics caused by various invisible and invincible bacteria [3–5]; in this 21st century, the biggest challenge is the Covid-19 epidemic. Fig. 1 depicts a graphic imperialist in action.
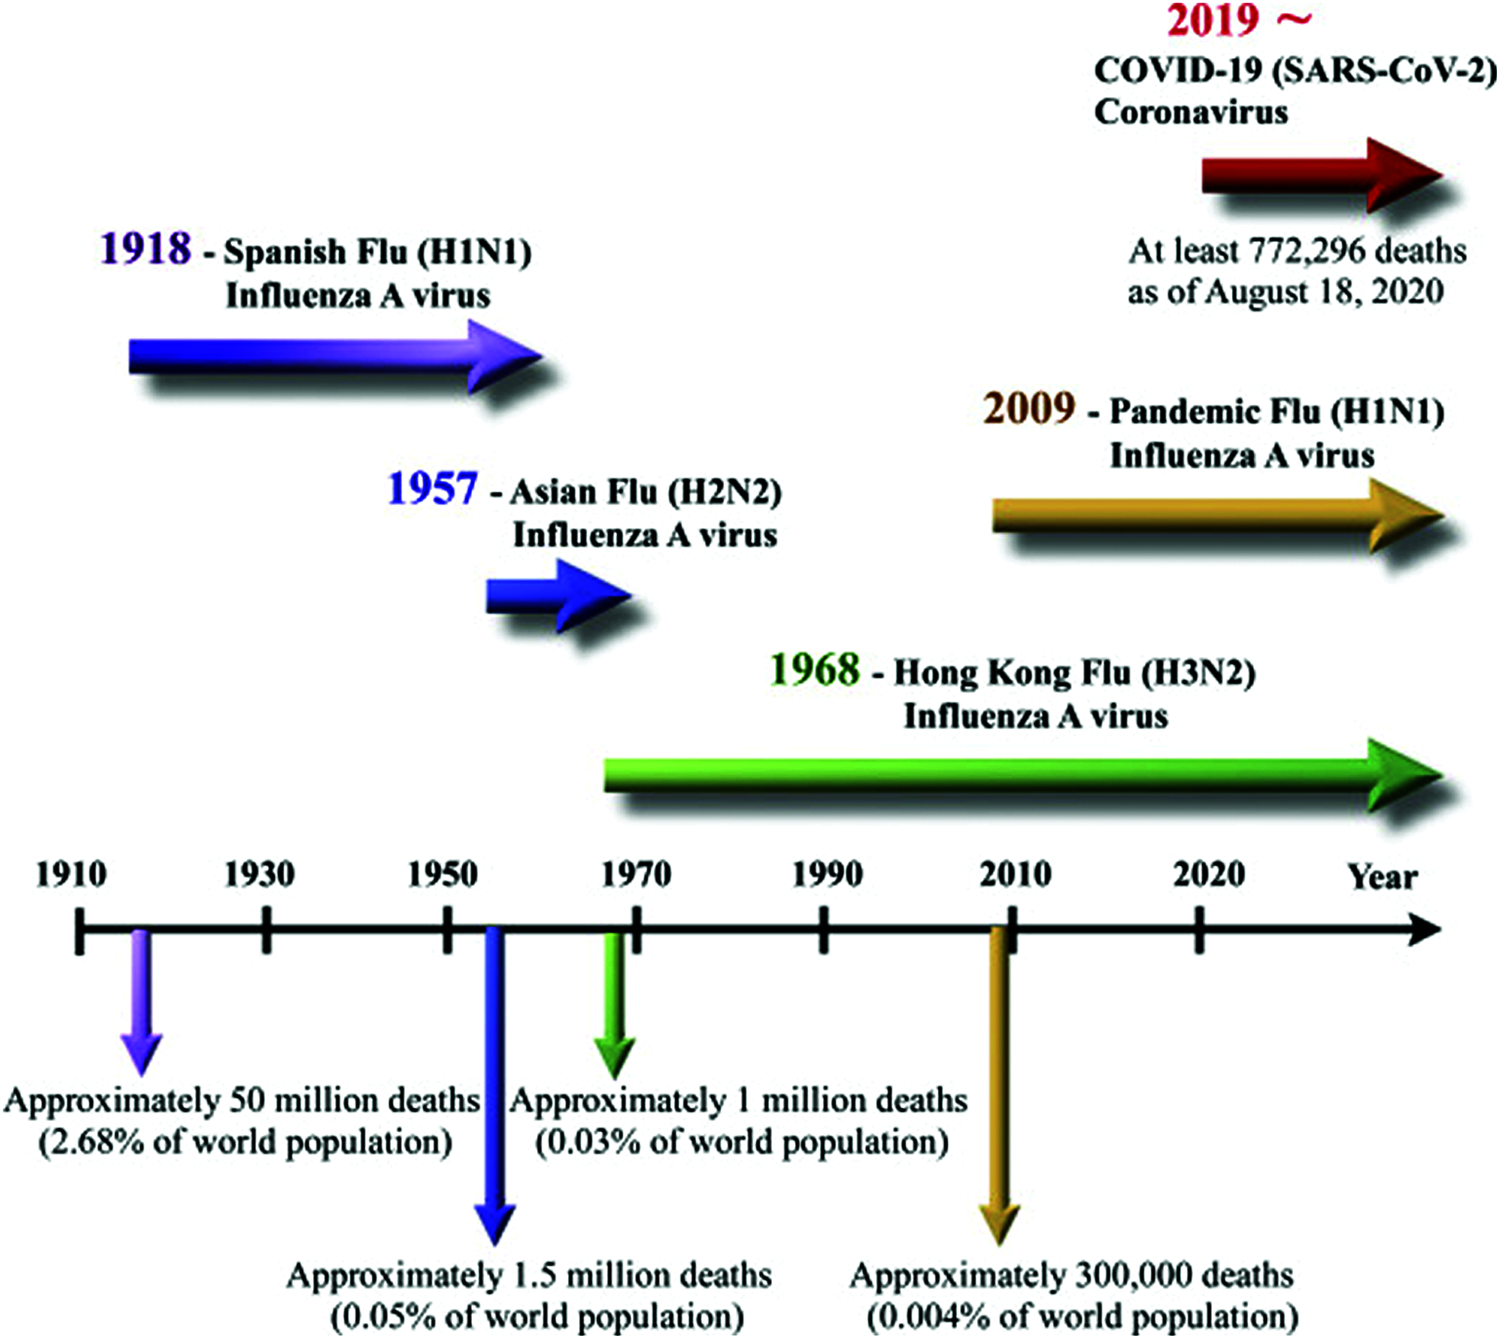
Figure 1: History of pandemic
Artificial intelligence (AI) will help us deal with the issues posed by the COVID-19 pandemic [5,6]. However, it is not only the breakthrough that can affect but rather the knowledge and creativity of those who use it. There is no question that the COVID-19 epidemic emergency would reveal some of the significant AI shortages [7]. Machine learning, the most common form of AI, operates by detecting patterns in previously recorded training data. We will take exercises from one case and adapt them to new ones, using our dynamic data to make the best guesses about what would happen. On the contrary, when the context or task changes only slightly, the computer intelligence system must fail without prior design.
As a result, the COVID-19 epidemic emergency will highlight the actual situation of AI: this is a system, and the evaluation of AI in any situation will be determined by the personnel who develop and use the AI. AI is in a current state of emergency. Gathering new training material under present circumstances is one way to deal with novel situation problems. Every new data about our current situation is crucial for human managers and artificial intelligence framework conditions to provide information for our future decision-making. The more details we will share, the faster our situation will no longer be novel, and we can find a path forward [8]. Artificial intelligence (AI) will help us deal with the issues that the COVID-19 pandemic has brought up. However, the knowledge and creativity of the people who use it, not just the invention, would be affected. To be sure, the COVID-19 emergency would most likely reveal some of AI’s major flaws [9].
Machine learning is the most common form of artificial intelligence, which identifies the patterns in the training data that are being tested. People have a preference for humans over artificial intelligence. We should take exercises from one context and extend them to new situations, building on our scientific knowledge to come up with the best hypotheses on what could succeed or happen [10]. Surprisingly, simulated intelligence systems must gain without any planning if the context or task shifts even slightly. Along these lines, The COVID-19 emergency will include something that has always been associated with AI: it is a device. In all cases, the calculation used is determined by the person preparing and using it. Human interaction and growth would be particularly important in leveraging the intensity of what AI will do in the current emergency [11,12]. Accumulating new teaching material under present circumstances is one way to deal with the novel situation problem. Every new piece of data about our current situation is crucial for clarifying our future decisions about human bosses and artificial intelligence structures. The more convincing we exchange details, the sooner our situation is no longer fresh, and humankind finds a way forward.
Iwendi et al. [13] proposed a model that can use linear regression to predict the spread of the COVID-19 Pandemic. Multilevel perceptions, vector, and autoregressive models provide epidemiological case studies from Johns Hopkins University’s COVID-19 data set [1]. Yang et al. developed hierarchical SEIR and SEIRS models to predict the peak and magnitude of the COVID-2019 pestilence. The author utilizes an AI model created using evidence from previous Severe Acute Respiratory Syndrome (SARS) outbreaks, revealing that the scourges will continue to spread in the future. Machine learning techniques applied to stomach Computed Tomography images by Barstugan et al. [14], shows the early location of COVID-19 as determined by the (WHO). Peeri et al. [15] use time series models and numerical detailing to show a similarity of day level gauging models on COVID-19 influenced events [16]. Based on the data released on February 22, 2020, Rizk-Allah et al. [17] proposed a new measurement model to analyze and predict COVID-19 in the next few days. Rezaee et al. [18] use a hybrid method based on language Failure Modes and Effects Analysis (FMEA), Fuzzy inference system and fuzzy data analysis model for developing new assessment methods to resolve specific Risk Priority Number (RPN) errors and prioritize your health (H), safety (S), and environment (E) may be referred to as either HSE. Navares et al. [19] recommended predicting the need for rehabilitation clinics in Madrid to treat cardiovascular and respiratory diseases based on bio meteorological markers. Cui et al. [20] developed and tested the multiregional evolution (MRE) hypothesis using spectrum power as an indicator to predict monthly river flow. Variable random Torky et al. [21] proposed an integrated blockchain framework that explores the possibility of gradually using peer-to-peer blockchains and decentralized storage points to build new architectures for verifying and separating obscure COVID-19 infection cases. Using an optimization approach, Ezzat et al. [22] suggest GSA-DenseNet121-COVID-19, a novel technique based on a hybrid Convolutional Neural Network (CNN, or ConvNet) structure.
3 Machine Learning for COVID-19
Linear Regression (LR) is a straightforward method that established the relationship between at least one independent variable or explanatory variable and a dependent variable in statistical machine learning. LR is the key form of regression analysis that received a lot of attention and is commonly used in practical applications [23–25].
By fitting a straight condition to a dependent variable, LR depicts the relationship between two variables [26–28]. One variable is treated as a dependent variable, while the other is treated as an independent variable. The structure of an LR line is as follows:
X is an explanatory variable and Y is a dependent variable, b is considered as the slope of the line, a is considered the intercepted (when X = 0, the value of Y)
And considering equation is
A forward feed in the artificial neural network (ANN) called Multi-Layer Protection (MLP), MLP refers to the forward feed of ANN, and the other refers to the different perceptions of layers, and it is used to solve the complex problems.
The Multilayer perceptron formula considered as
where the number of neurons in the previous layer is considered m, a random weight is considered w; the input value is considered x, a random bias is considered b and the non-linear activation function is considered
A vector autoregression (VAR) is a prediction calculation method used when at least two-time series interact, i.e. the relationship between the periods is bi-directional.
The formula for VAR is:
where Yt = (y1t, y2t… ynt)’: an (n × 1) vector of time series variables,
a: an (n × 1) vector of intercepts,
Ai (i = 1, 2… p): (n × n) coefficient matrices,
εt: an (n × 1) vector of unobservable that is error considered as white noise.
Fig. 2 shows the data structure using Eqs. (2) and (3) as a function of weakly case, cumulative case, age, report, severely, and death, and it is clear that some events are in such an early stage [25]. According to the WHO, the world is currently in the second step, but the future will be in the third step, with very few cases and a projection of them showing the possible work needed at this point of time [29]. The data set is visualized by a proportions diagram using Eqs. (1) and (3), showing the proportions classification. Fig. 3 shows the features that are closely related to peak critical situations. This crosstab represents the interest of the attribute pair, whereas a graphical method of visualizing frequencies [30,31]. Correlation is extremely useful in determining the relationship between characteristics of records. Our data focuses on confirmed cases rescued or decreased due to the COVID-19 outbreak in Asia Countries over the past two months. Depending on the day (date), the probability of getting sick is very high, as the correlation value is E+0.949, in Eqs. (4)–(6) are the associated between Pearson and the Spearman mechanism shown in Fig. 4 [32,33]. The date attribute is much more crucial, so global social distancing measures have been implemented [34]. In the case of COVID-19, the spread is usually simply through contact with the person. Information about the effect and appropriate countermeasures to remember. Members of nations around the world use various trials and errors to combat the severity of the disease.
The forecast provides relevant and consistent information about historical, current, and future events for some mathematical and empirical methods. It helps to make smart decisions from all angles. There are two types of approaches: qualitative and quantitative. The forecasting steps are as follows: Identify the factor tasks first understand the problem, include a thorough review, setting a solid foundation, gathering evidence based on the two previous phases, and forecasting the future for follow-up action, compare the actual results to the expected economic and earnings applications include forecasting, budgeting, census, and stock market research, performance forecasting, and many other areas. The medical profession is excited to use foresight and forecast to help the growing number of people in need [35]. Yamana et al. [36] include the prediction linear regression models, multilayer perceptron, and VAR for a data series t. The VAR model is a more suitable analysis model in the multivariate time series that assist with inference and policy analysis. It is more likely to be used in a practical forecasting scenario, but it has superior forecasting performance. From a technical point of view, it is a model with an m-equation and m-variables, in which the individual variable is explained using current and past values. Various parameters of VAR start with the order of maximum autoregression. Various information criteria that contribute to the optimization of the autoregressive order are the Akaike information criterion (AIC), the Bayesian information criterion (BIC), Final prediction error (FPE). By adding and varying the constant, linear and quadratic trends with forwarding forecast steps and confidence intervals [37–39]. The formula for calculating AIC, BIC and FPE model is as follows:
where N is considered as a number of an attribute in the system, X is considered as sample size, E is considered as an estimate of a covariance matrix, P is the model of AIC, BIC, FPE.
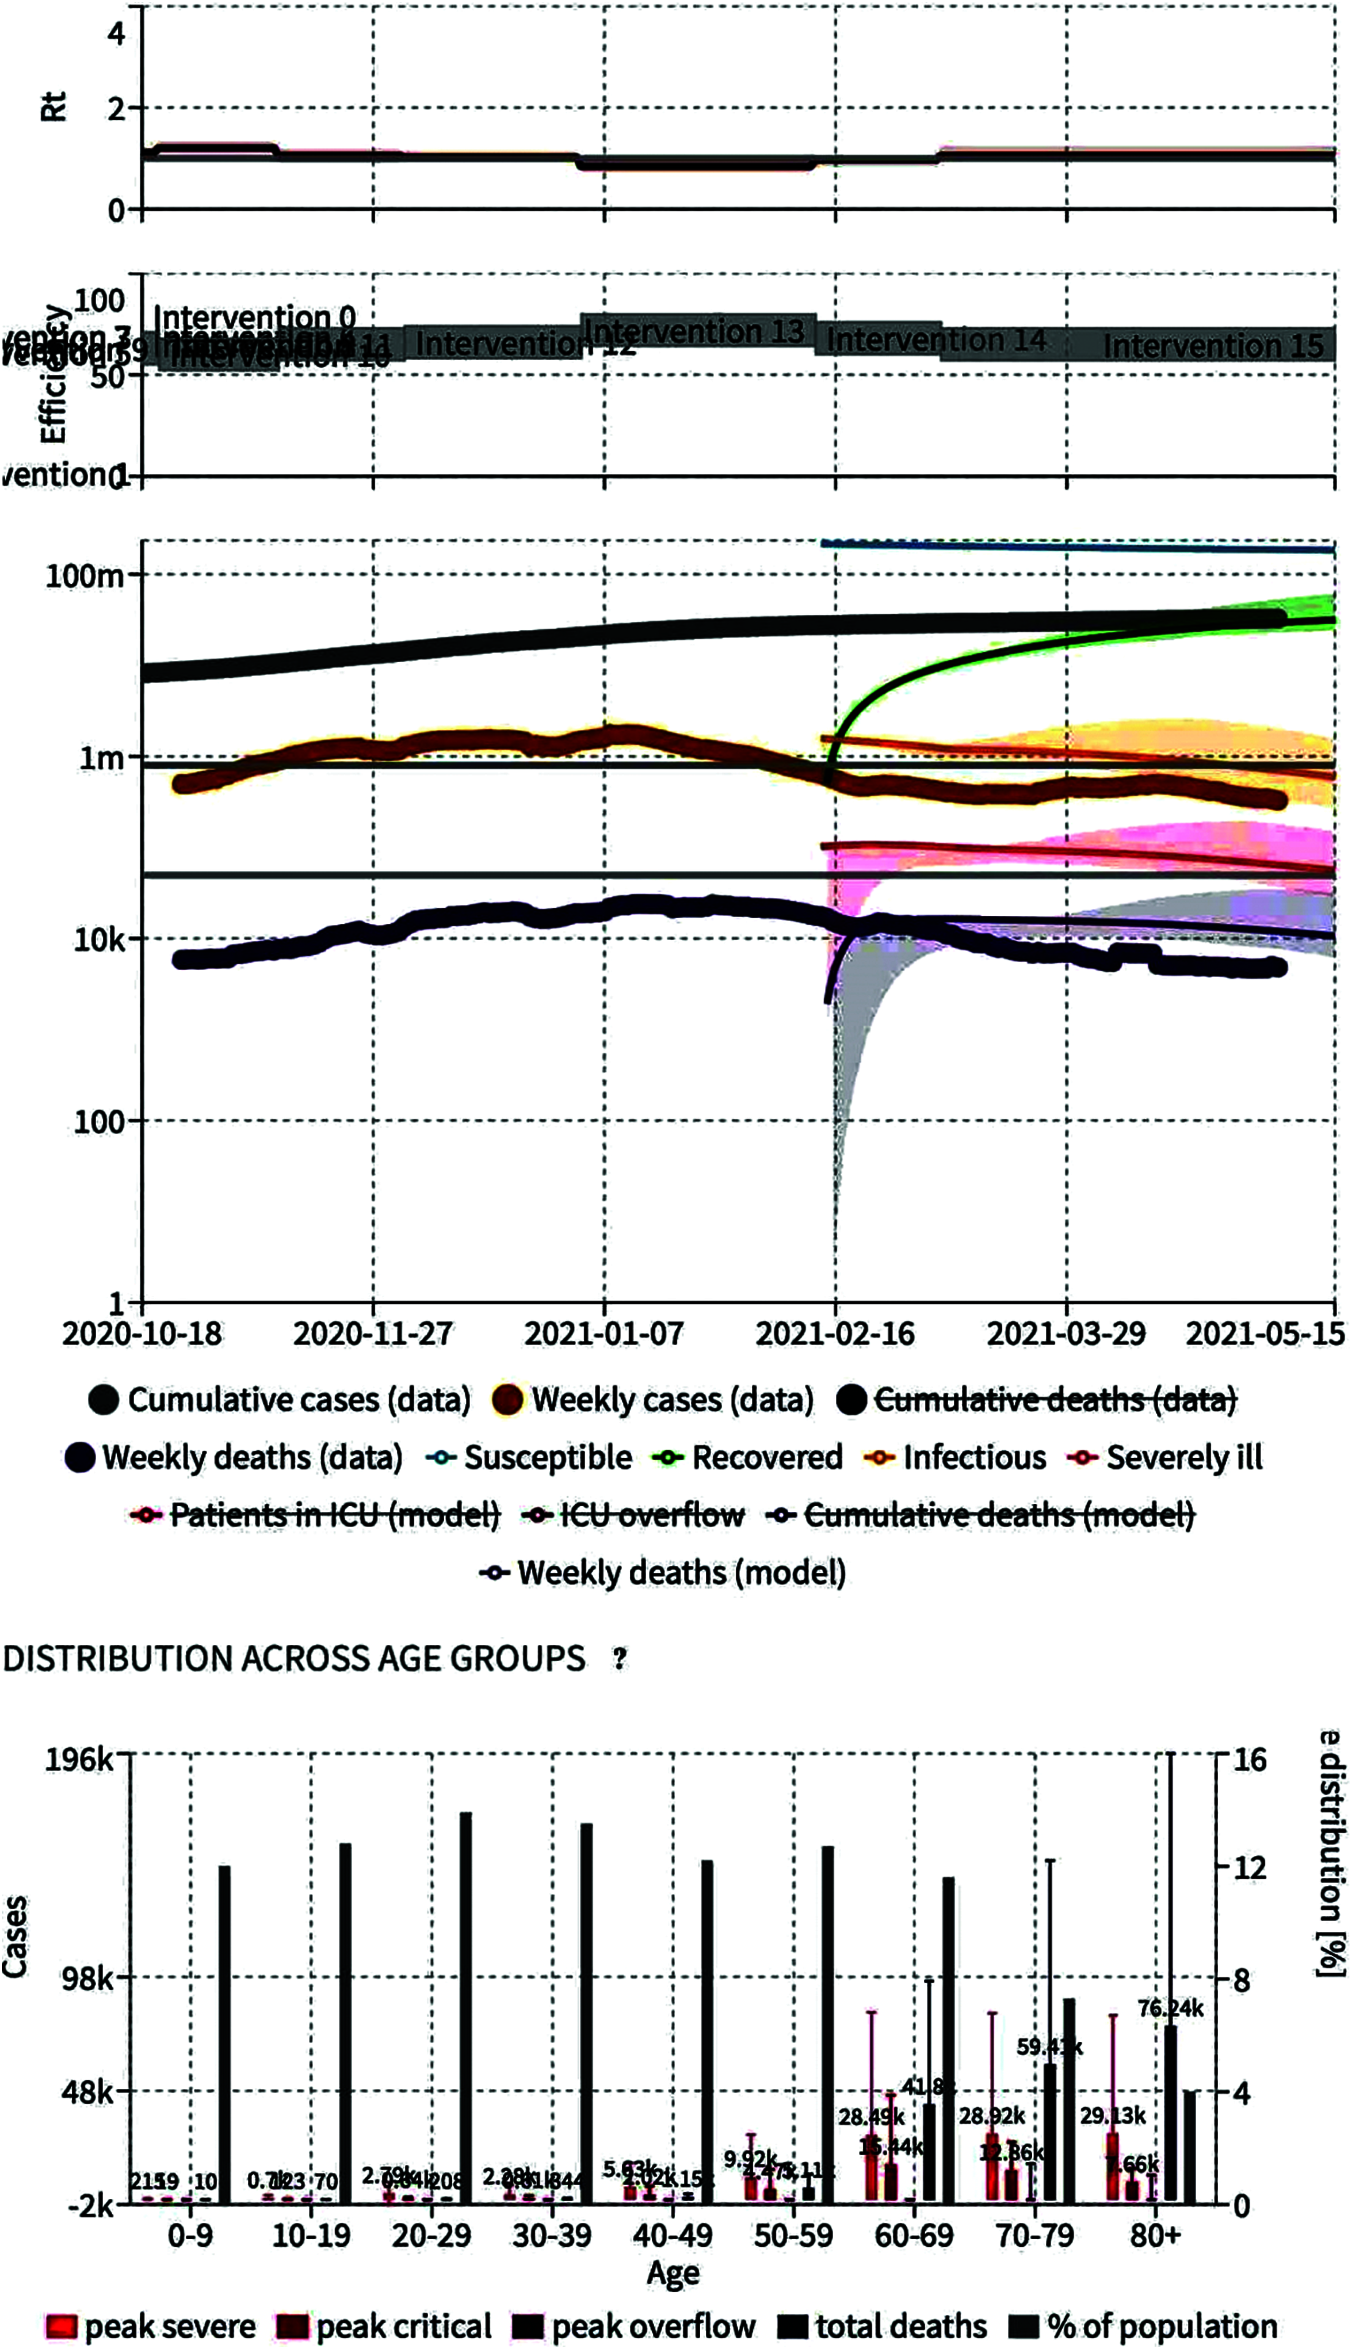
Figure 2: World covid-19
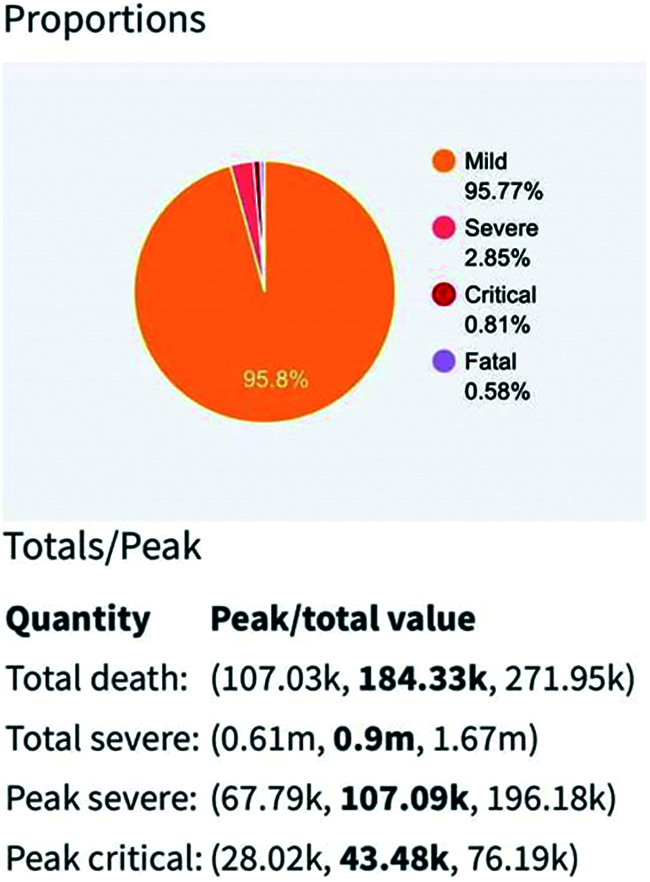
Figure 3: COVID-19 country-wise proportions
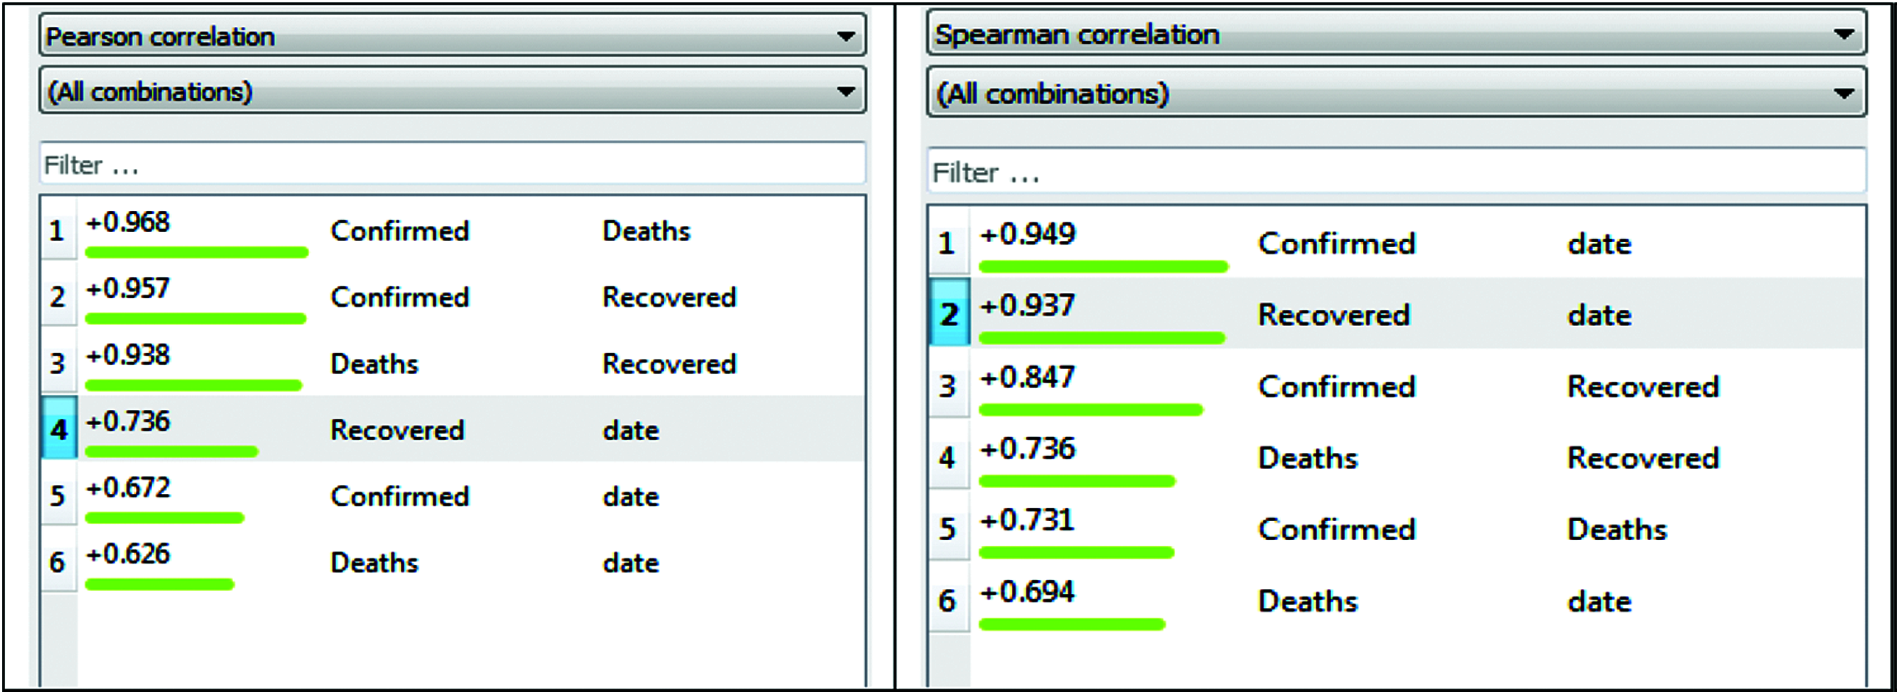
Figure 4: Pearson and spearman correlation graph
5 Circumstantial Forecasting in World
Order four is used for visualization with the maximum auto regression sequence in the current environment, followed by a piece of information mean value 85% criterion. The constant, linear and quadratic trend is introduced along with more than one step forward and a confidence interval (CI). Figs. 5–12 from Tapia 2000, Days are assigned to the X-axis and the number of cases shown on the Y-axis.
Fig. 5 depicts the awaited confirmed cases with an 85% confidence interval based on LR and actual confirmed case data. By interpreting the diagram, based on the current case records, it can be concluded that reported cases will increase in the future. Fig. 6 depicts the confirmed cases estimated with an 85% confidence interval based on real cases confirmed with MLP. The MLP chart shows the estimate of reported cases in an exponential range based on 79 days of evidence. Fig. 7 depicts the awaited effects of COVID-19 based on the verified confirmed cases, death, and recovery from LR with an 85% confidence interval. The algorithm predicts that the number of reported cases will increase day by day based on the input data. In Fig. 8, MLP is used to predict the impact of COVID-19 using real-world evidence for confirmed cases, deaths, and recovery with an 85% confidence interval. As MLP predicts, reported cases would recede very slowly during recovery, and the fatality reports will fluctuate (i.e., sometimes sit might be huge, sometimes it might be small. Fig. 9 depicts the awaited effects of death from COVID-19 based on the evidence of fatality events, with 85% confidence intervals (CI) calculated using LR. Based on current case statistics, the graph shows that cases will arise in the future.
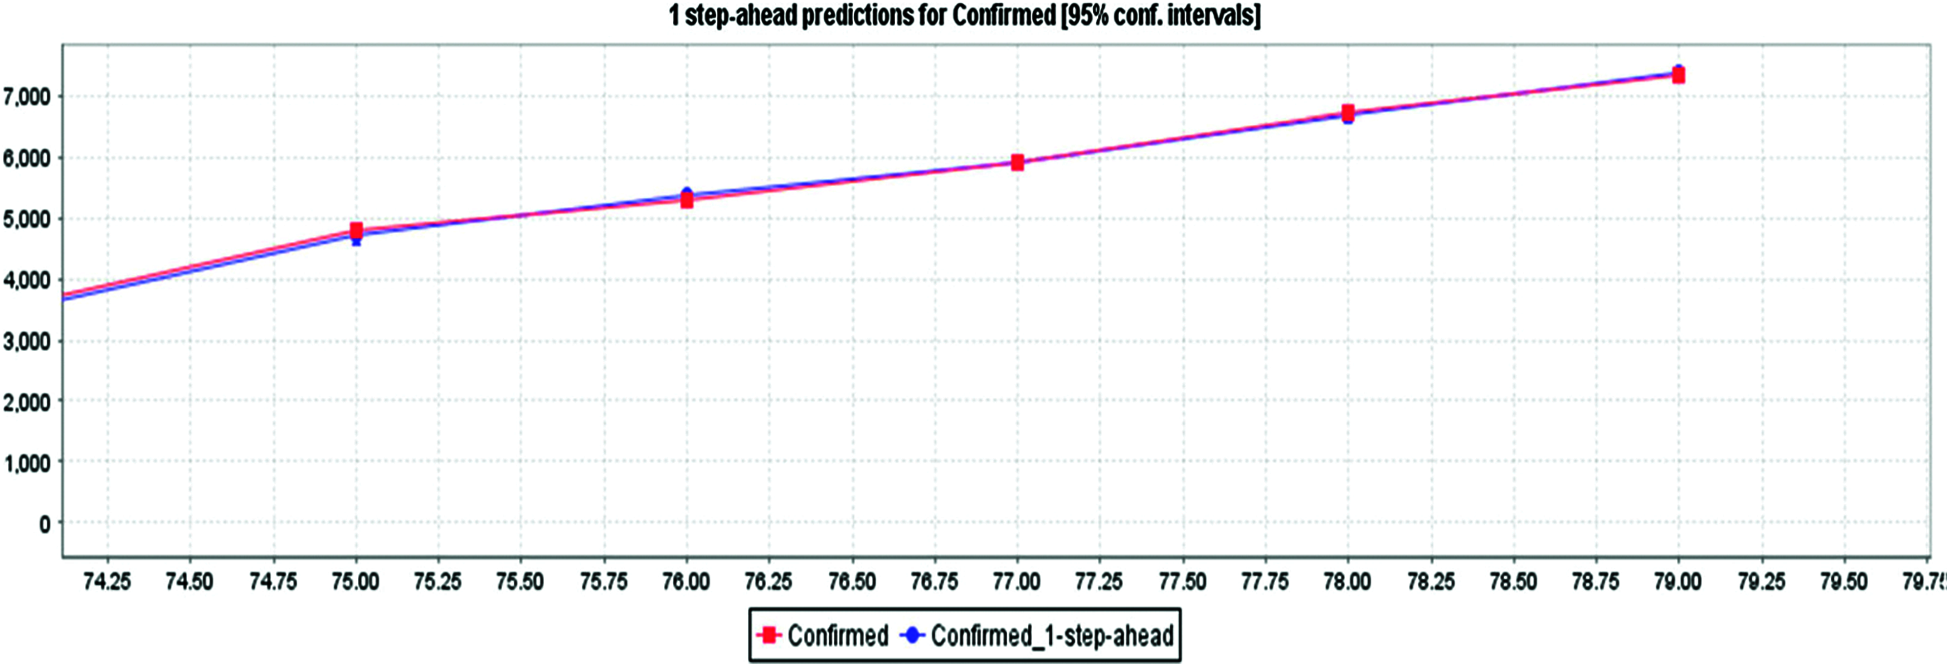
Figure 5: Using LR method for COVID-19 confirmed cases prediction in India
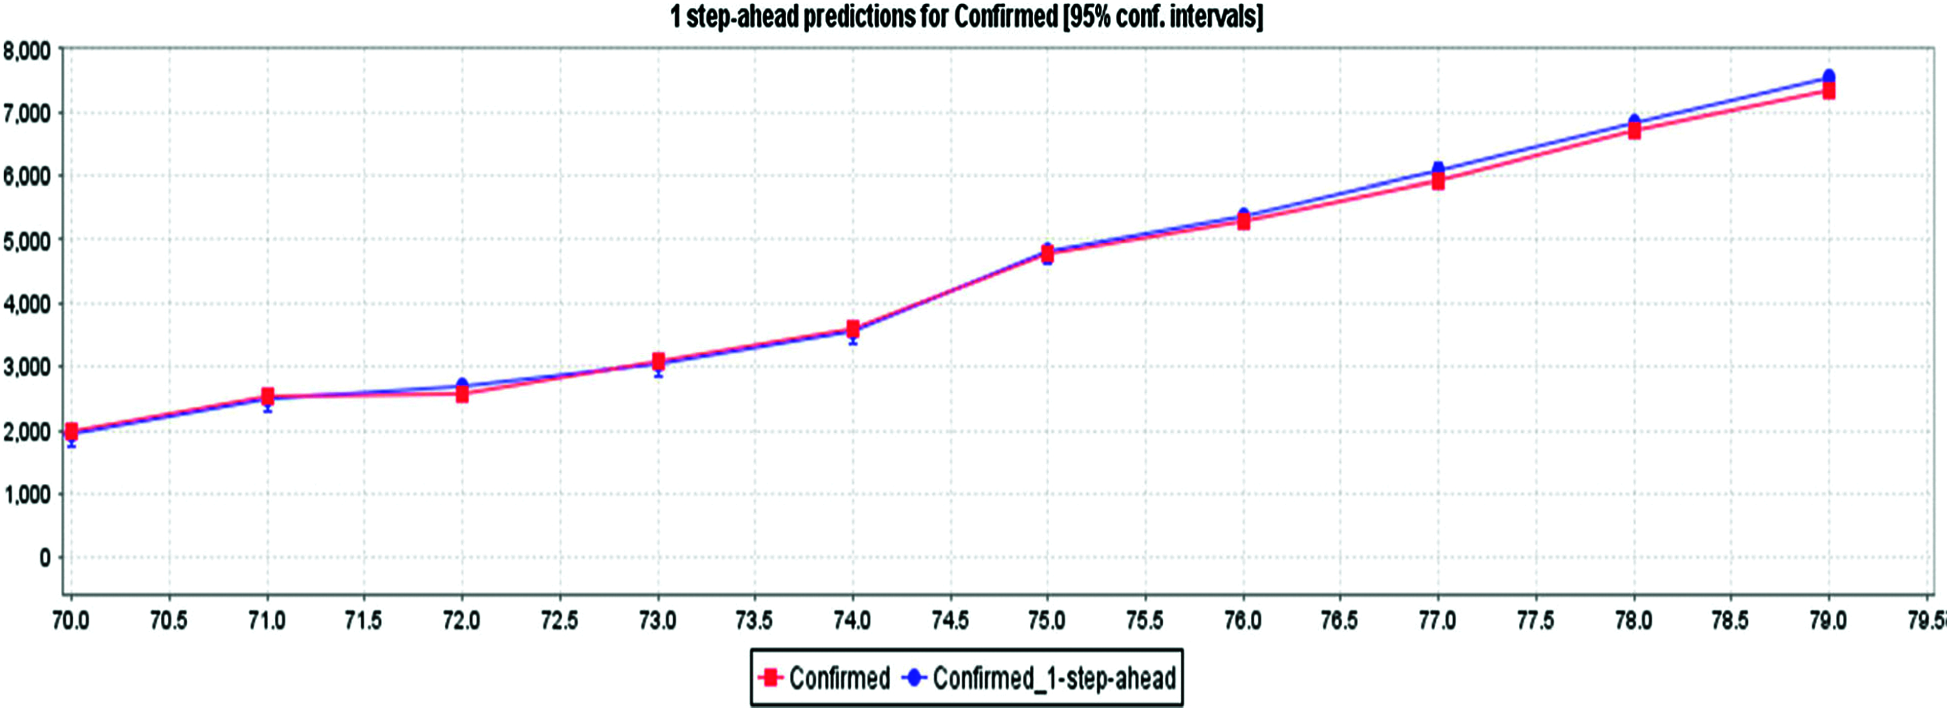
Figure 6: Using MLP method for confirmed cases prediction of COVID-19 in India
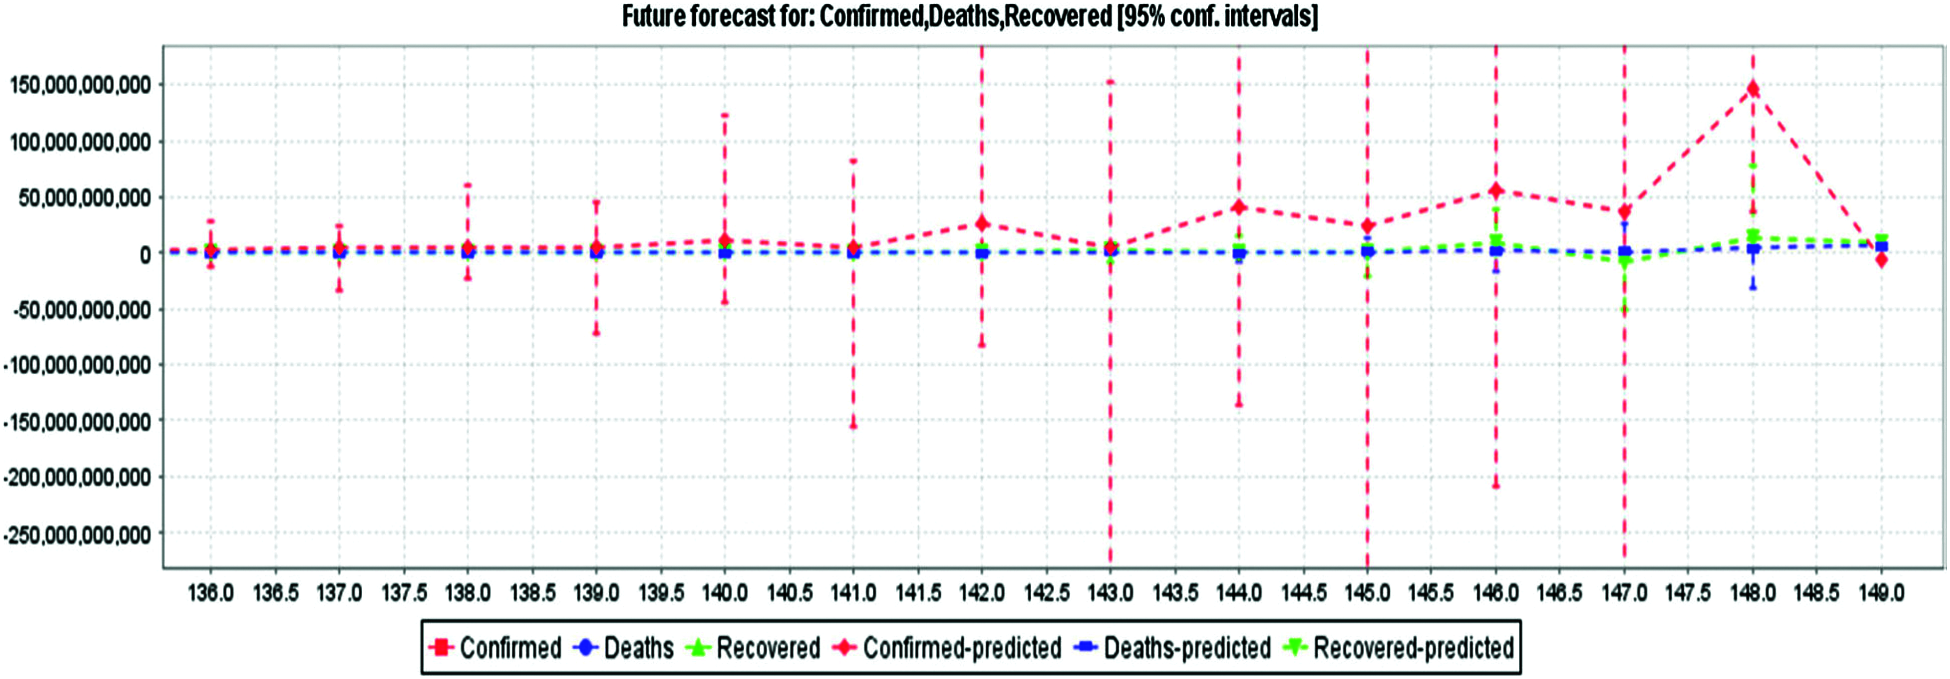
Figure 7: Using LR method for prediction of COVID-19 confirmed, deaths, recovered cases in India

Figure 8: Using MLP method for prediction of COVID-19 confirmed, deaths, recovered cases in India
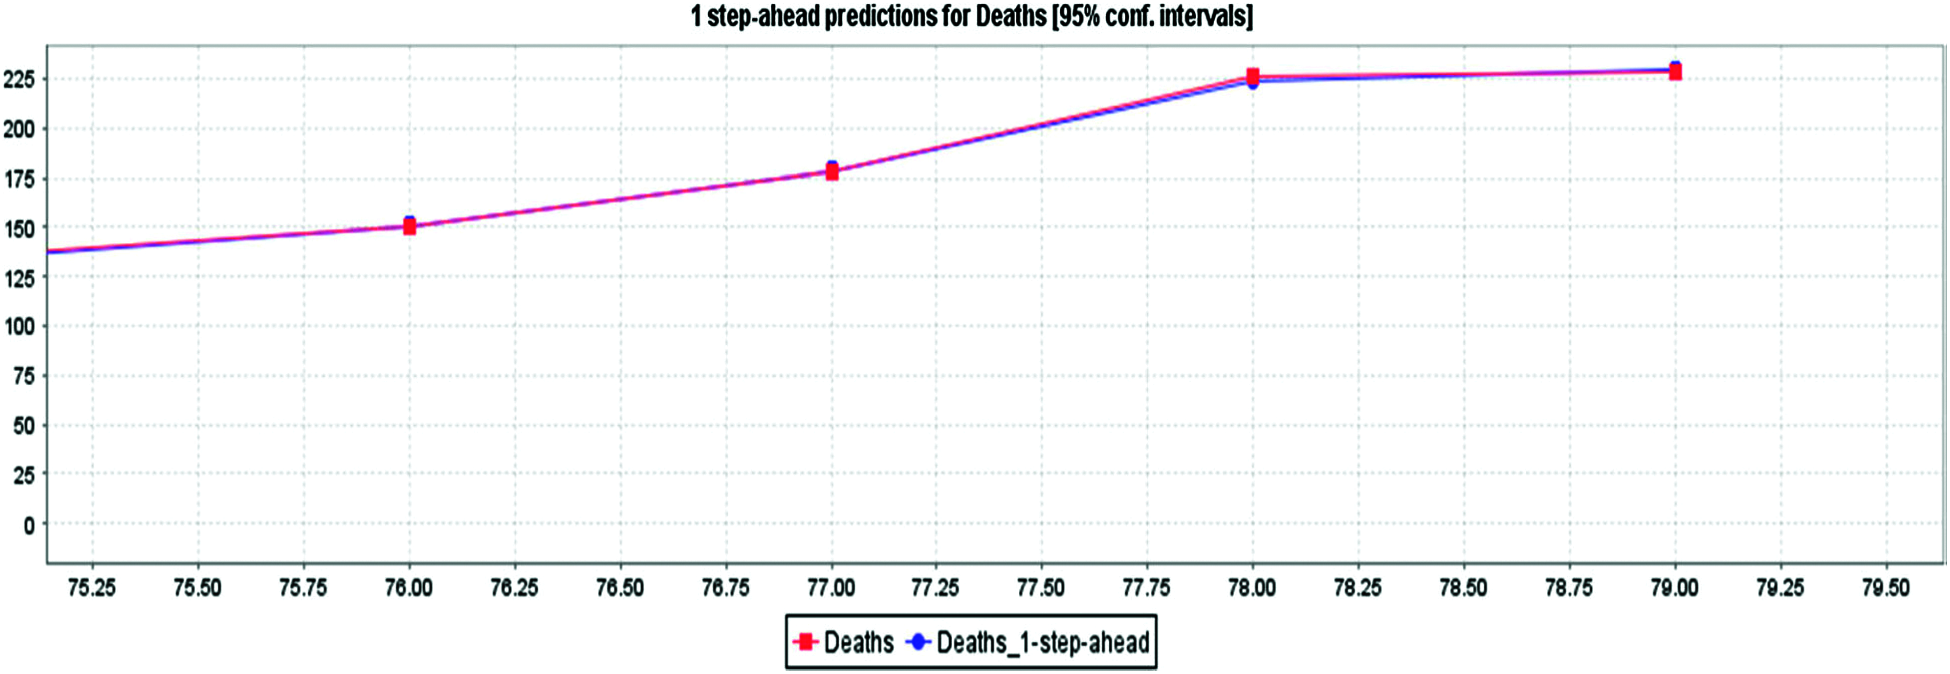
Figure 9: LR for death cases prediction for COVID-19 in India
Fig. 10 depicts the awaited effects of the deaths from COVID-19 using 85% confidence intervals based on actual evidence of deaths obtained from MLP. Based on current case records, Fig. 12 shows that cases will arise in the future. Fig. 11 depicts the awaited COVID-19 impact based on the actual recovered occurrence of the data with an 85% confidence interval per LR. From Figs. 13 and 14, we can deduce that the number of cases will rise in the future. Fig. 12 depicts the recovered COVID-19 impact based on factual evidence for recovered cases with a confidence interval of 5% CI at MLP. Fig. 13 depicts the VAR models predicted for the next 69 days. The order of auto regression is 10, the knowledge parameters for AIC optimization are the persistent and linear pattern of vectors, the CI for actual events, restored and fatalities, is 85%. We have given details of the case by day 79, March 01, 2000. Tab. 1 shows the expected values of committed, deceased, and convalesced patients using the current LR method starting with day 80, March 01, 2020, through the next 68 days, May 01, 2021. These are the expected values based on the input values. The estimated values in Tab. 1 are used to create Figs. 5, 7, 9 and 11.
We have provided details of the case by day 79, March 01, 2020. Tab. 2 depicts the awaited values of substantiated, deceased, and recovered patients using the MLP method from day 80, March 01, 2020, next 69, May 01, 2021. These are the expected system values based on the current input values. The waves for the various cases in Fig. 13 are derived from the values in Tab. 3, which shows the next 69 days for the multiple variables mentioned in the VAR model section. Figs. 14–16 depict the predicted COVID-19 Confirmed, deaths, and recovered cases with an 85% confidence interval and MLP based on the actual positive confirmed cases fatal, and recovered outcomes. Based on the current case statistics, the graph shows that cases will increase in the future.
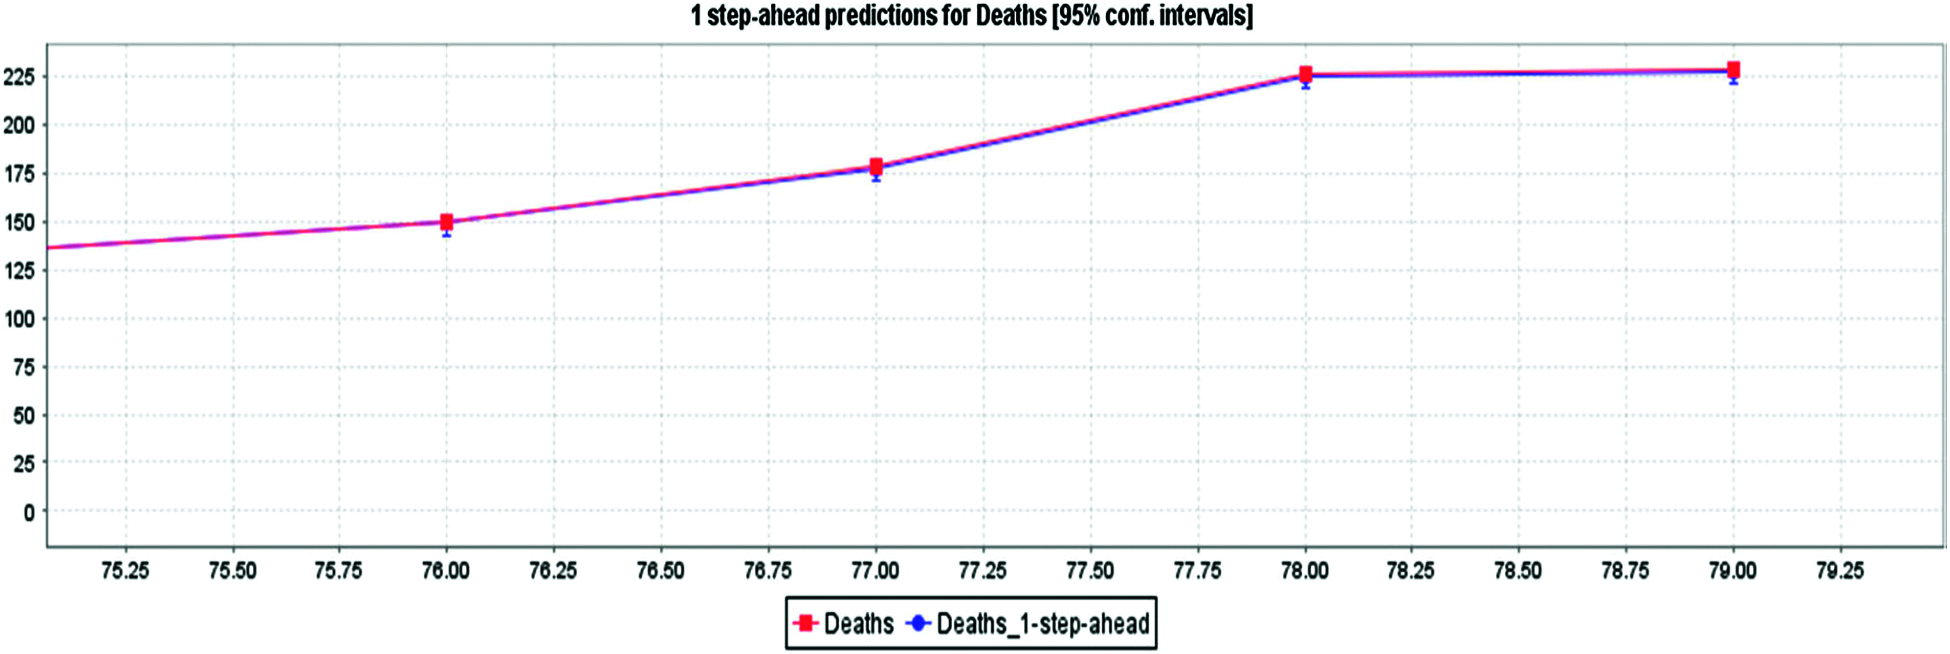
Figure 10: MLP for COVID-19 death cases prediction in India
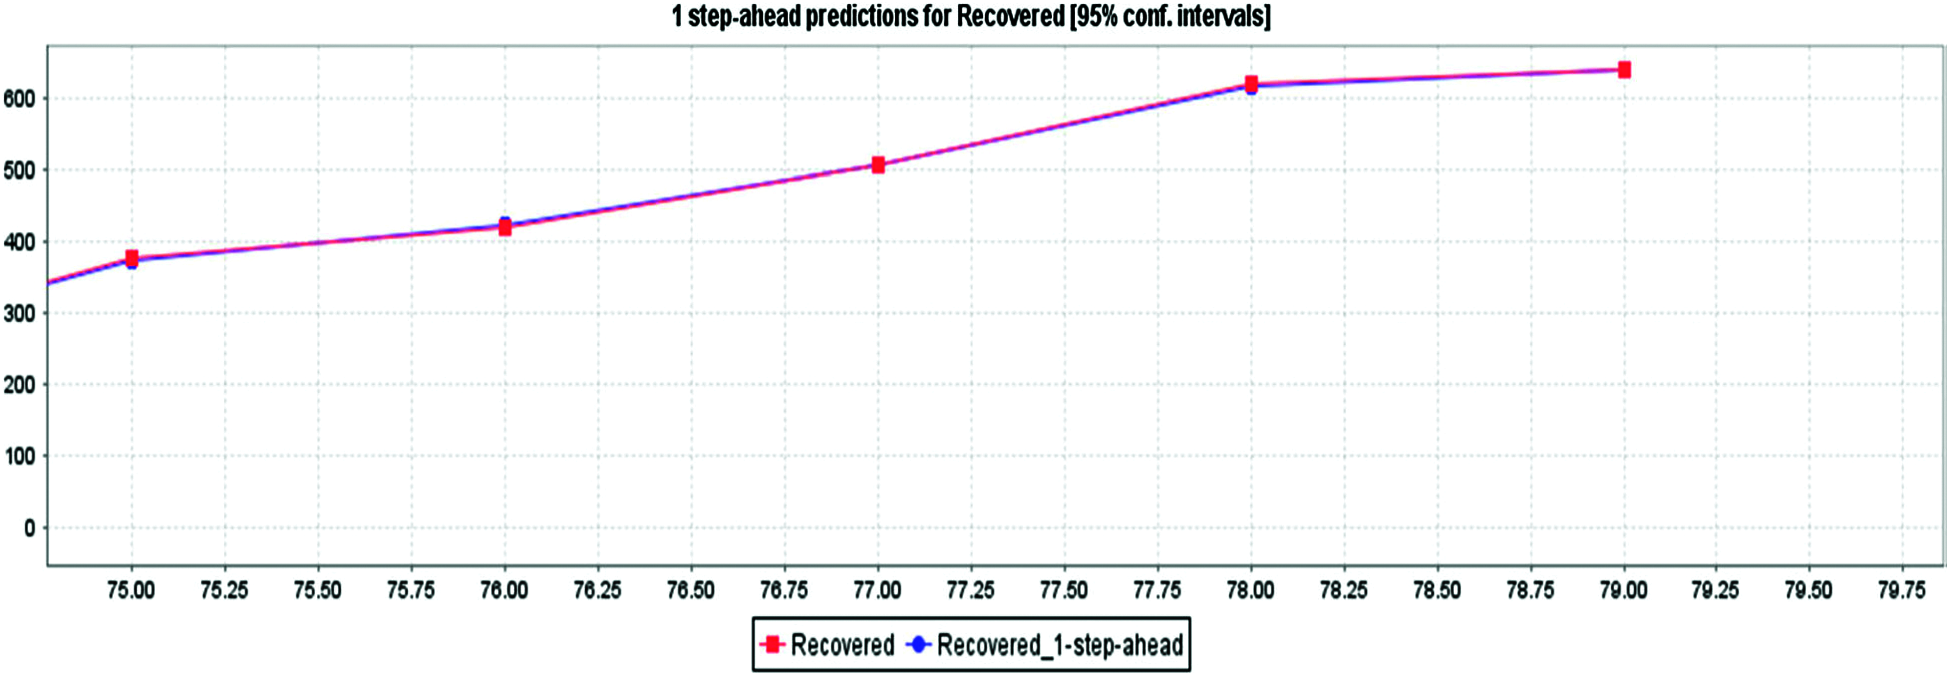
Figure 11: LR for recovered cases prediction for COVID-19 in India
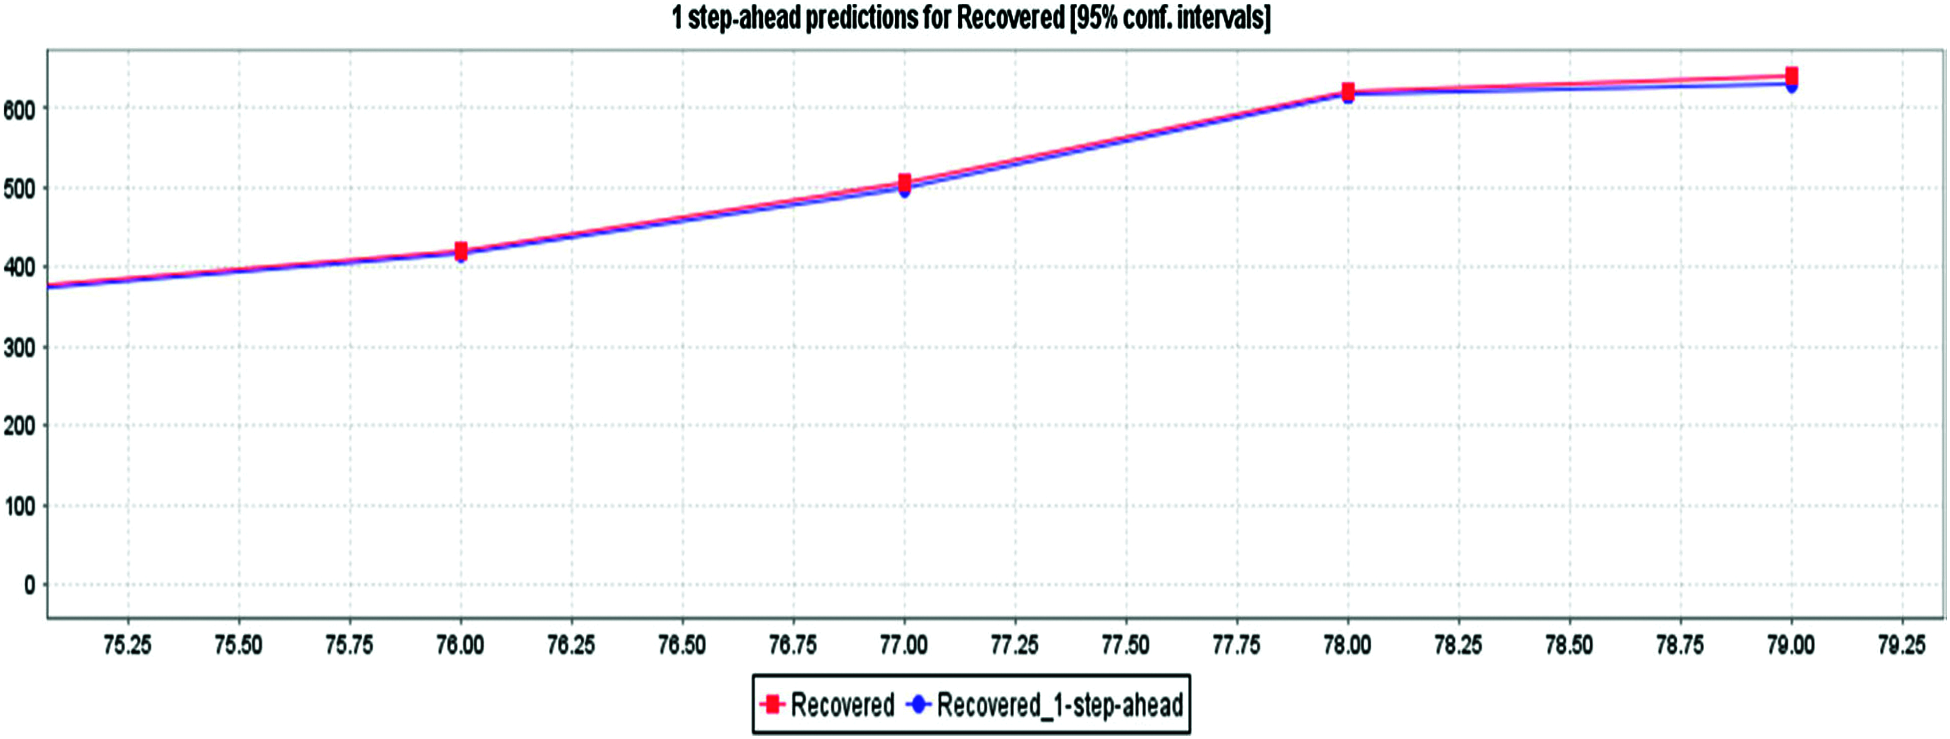
Figure 12: MLP for recovered cases prediction for COVID-19 in India
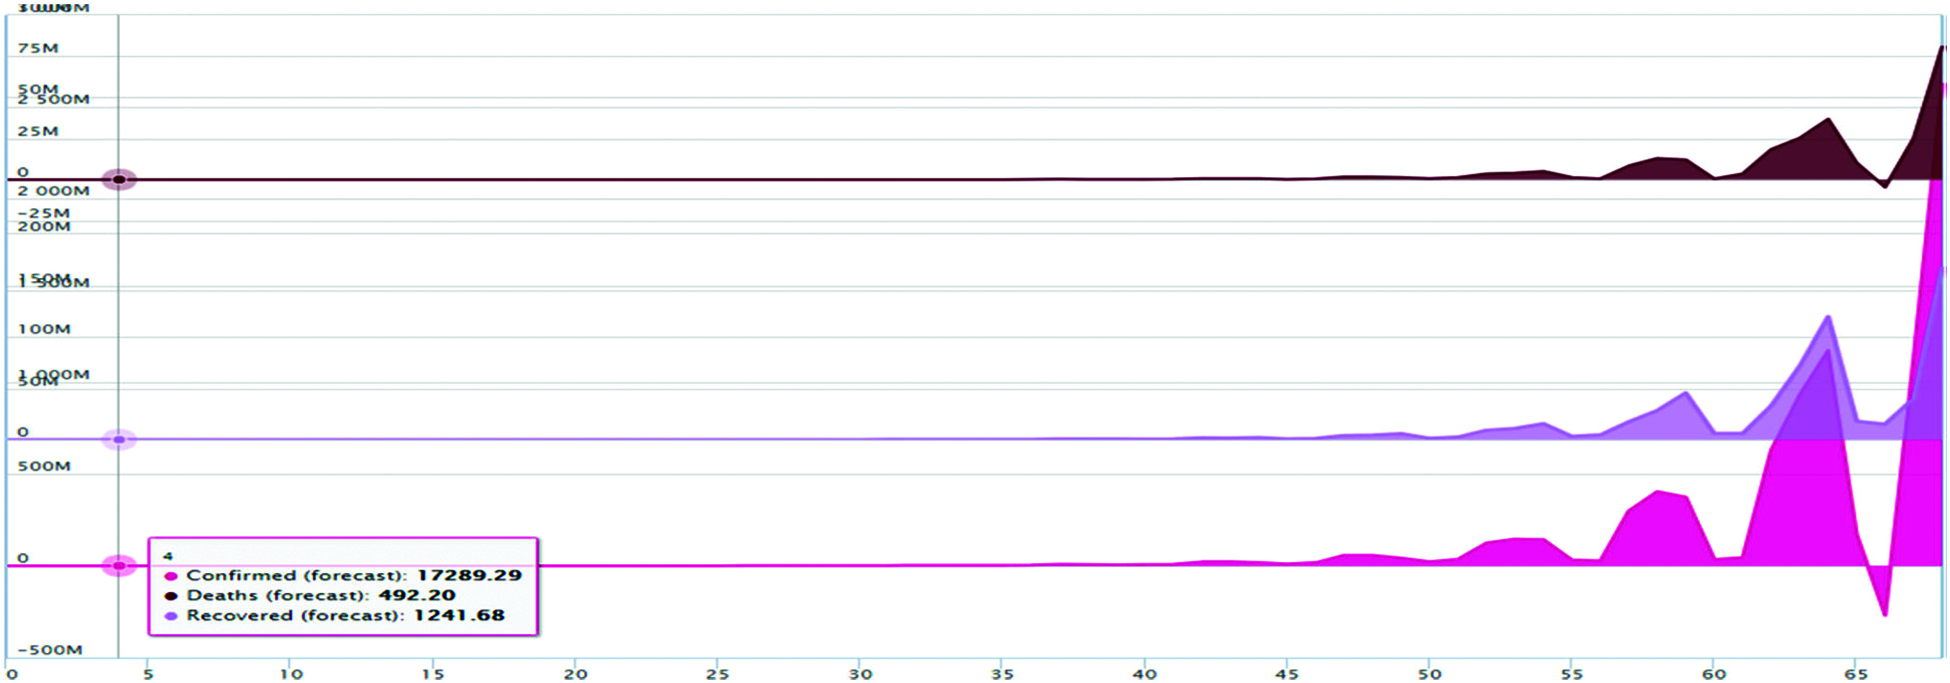
Figure 13: Forecasting using VAR model for COVID-19 confirmed deaths and recovered cases
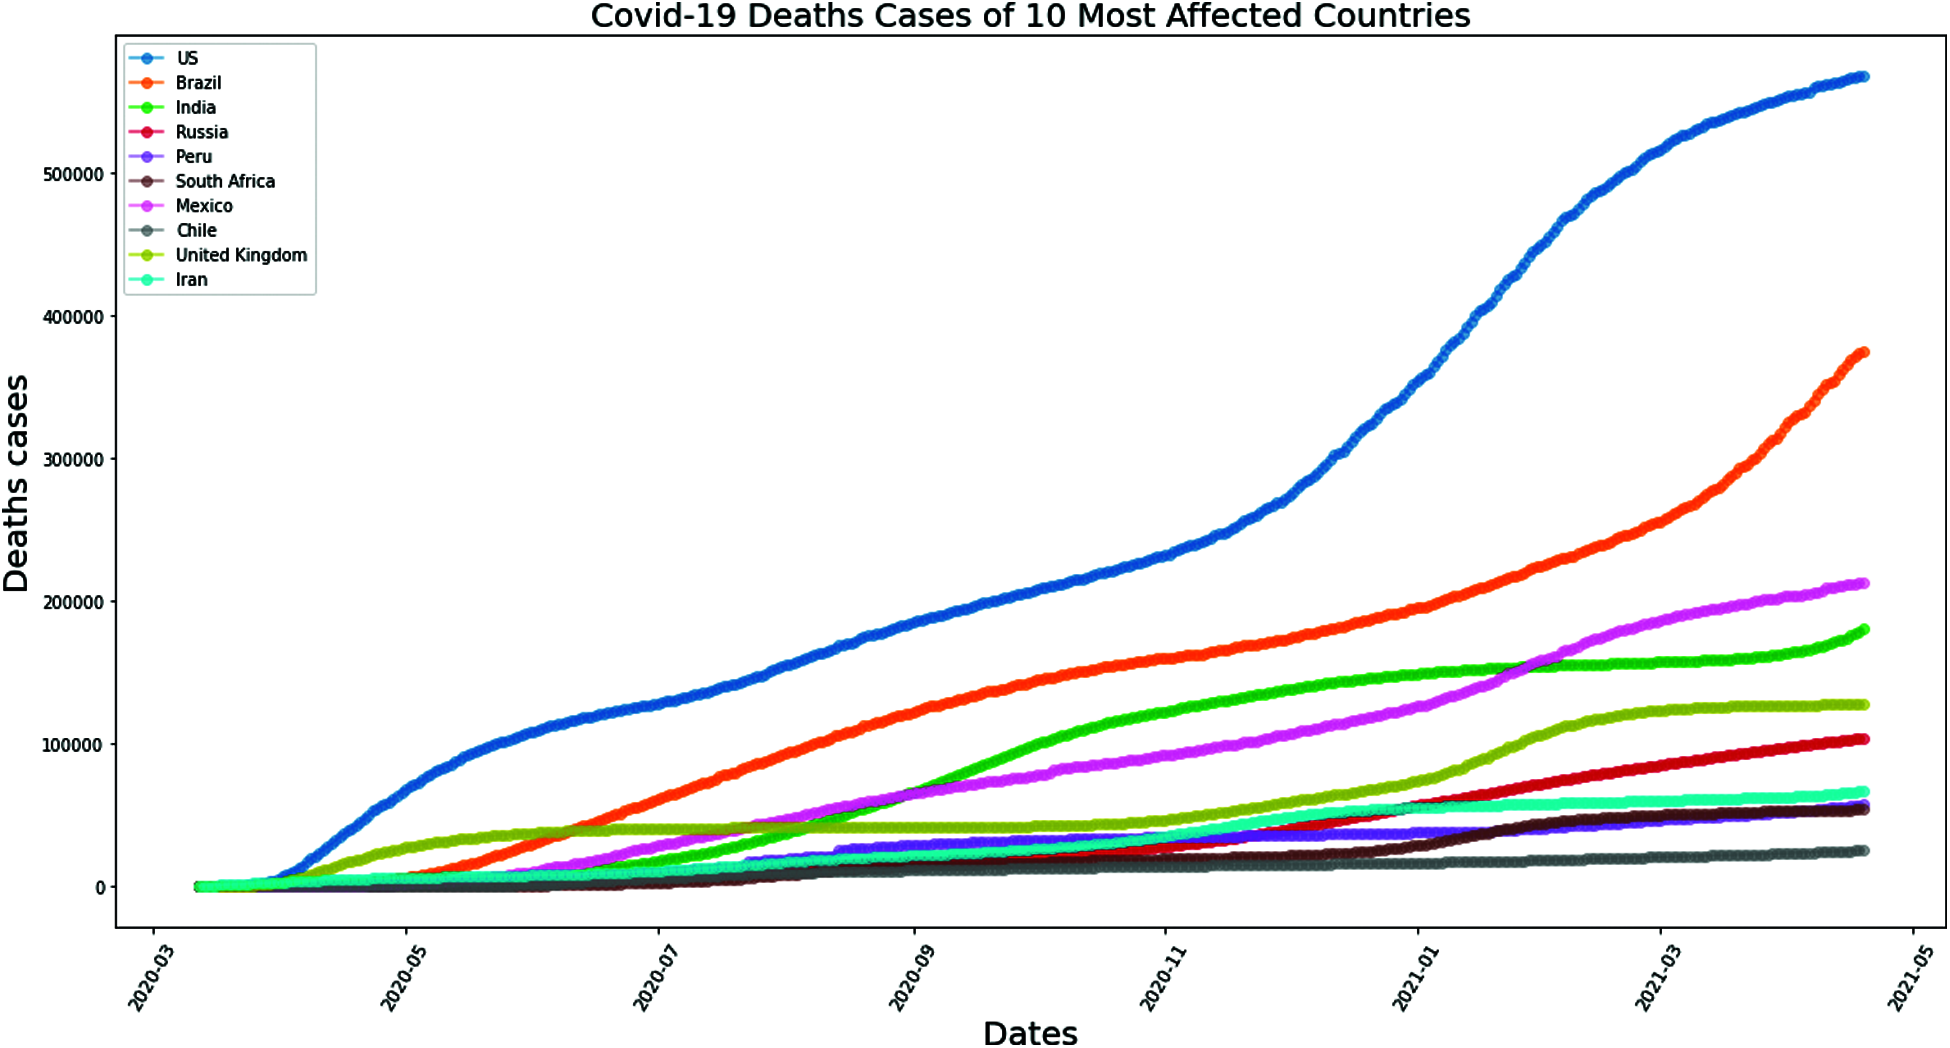
Figure 14: MLP method for COVID-19 deaths cases of 10 most affected Asia Countries


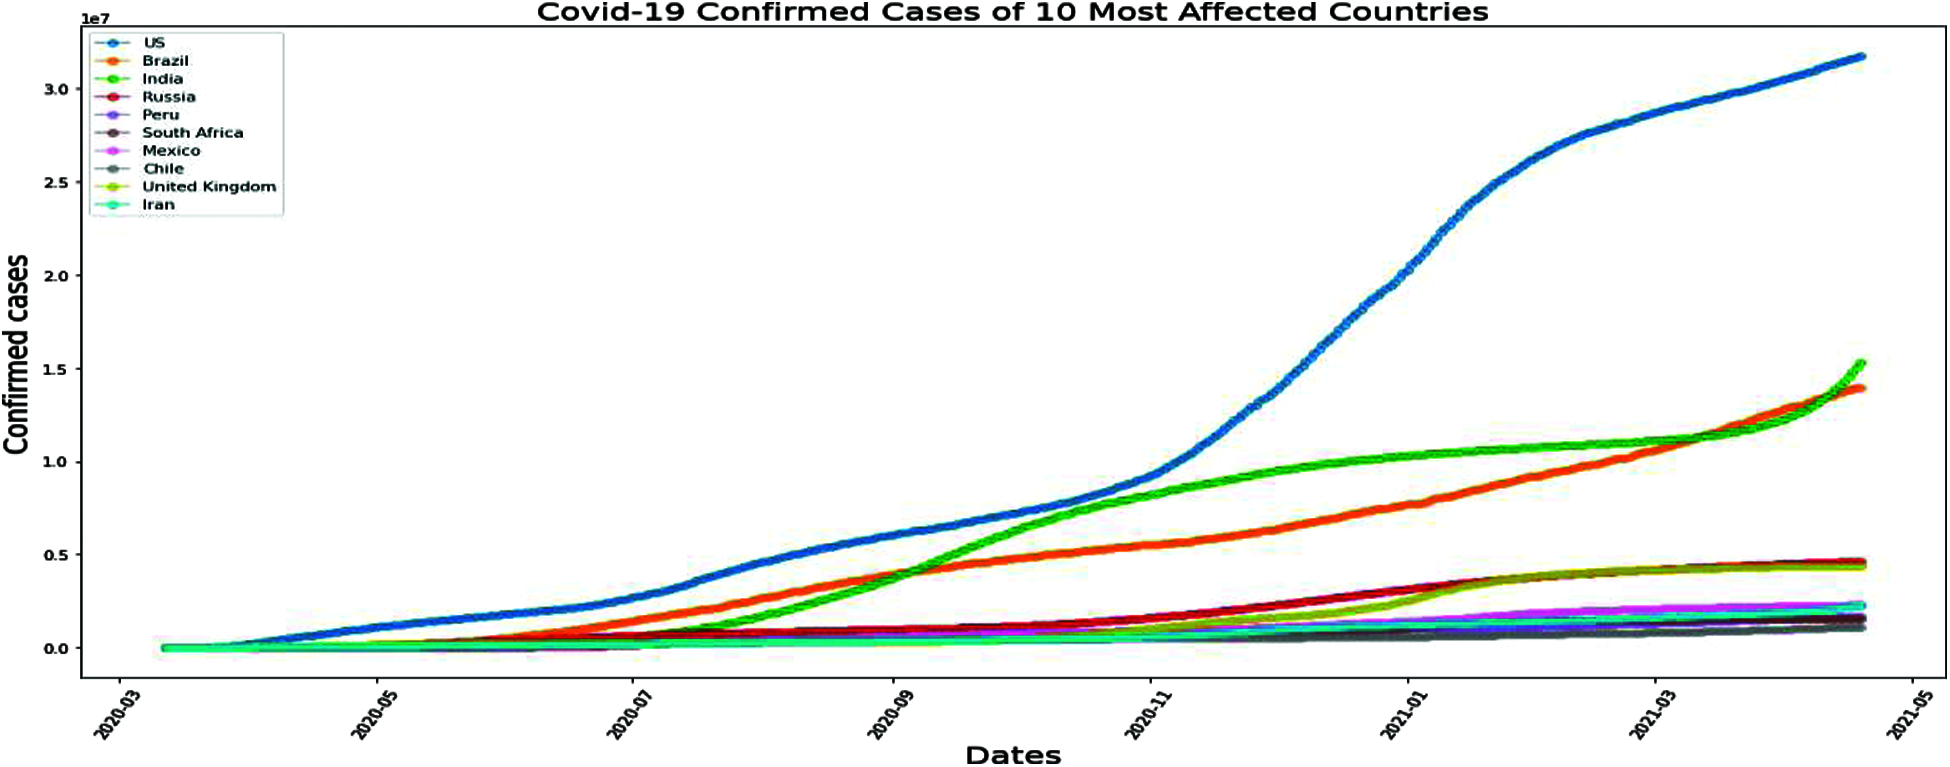
Figure 15: MLP method for COVID-19 confirmed cases of 10 most affected Asia Countries
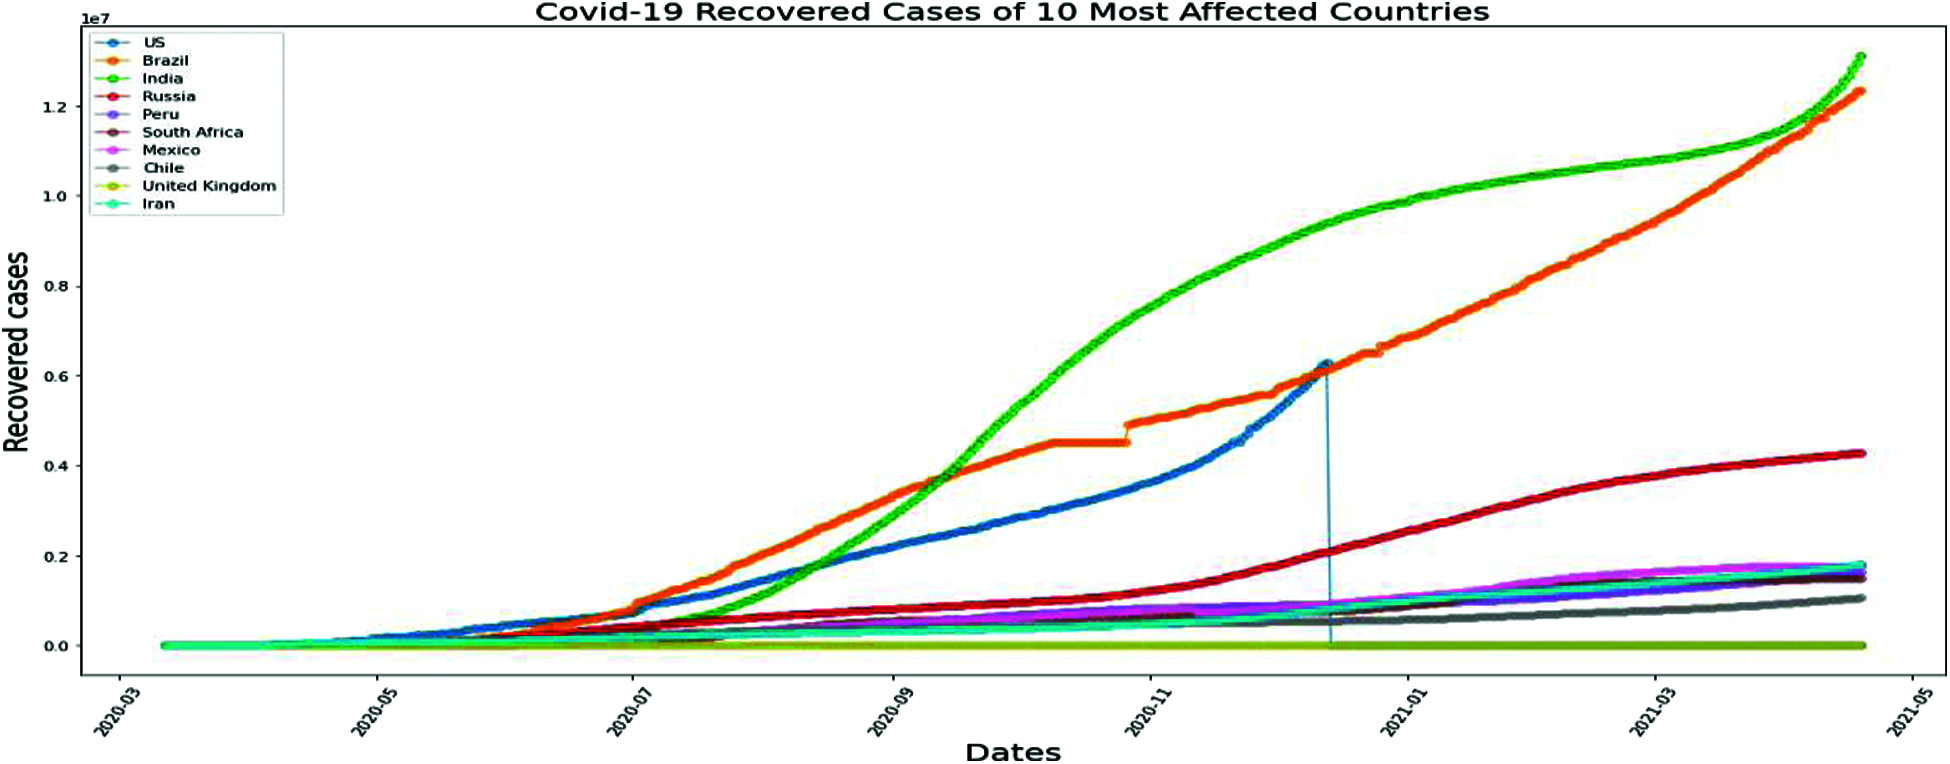
Figure 16: MLP method for COVID-19 recovered cases of 10 most affected Asia Countries
6 Analysis of Forecasting Results
Covid-19, a novel corona virus has badly affected people’s life. Different organizations pertaining to both the private and public sectors must offer valuable data in order to predict and compare various factors faced by the different people from the people’s perspective. In our research, a deep analysis of the Asia region is carried out regarding different events occurring in people’s life because of Covid-19 such as a number of cases on Confirmed, deaths, recovery rate and future cases. Linear regression (LR) and Multi-layer perceptron (MLP) predicts 75% for confirmed case, death case 62%, and recovered case 20%. This in-depth analysis is needed for the whole region of Asia to assist the infected people. In addition to this, novel methods are suggested using Linear regression (LR), Multi-layer perceptron (MLP), Vector auto regression (VAR). Few mathematical calculations and parameters are adjusted for the suggested model in order to attain the highest possible accuracy.
In this current pandemic situation, the whole world public is starving for data to get tips to protect individuals from this COVID-19 virus. Also, the rising number of cases as second wave hits has created a sensation among the researchers to predict the newly infected cases based on the current death rate and virus infections among the world’s public. The accuracy of the machine learning model can be improved by selecting the most relevant features like person age, gender, immunity power, saturation point, and some other features of infected person’s medical history and the patient getting recovered in a week or two in combating COVID-19. In present times, as the second wave hits the world badly, especially India, the prime importance of following mass lock-down, strict social division, and wearing proper masks to cover the face and isolation if the person gets infected is the need of the hour slow down the transmission. COVID-19 data was preprocessed well and classified using LR, VAR and MLP. It was found that MLP gave promising results in classifying Indian COVID-19 data using WEKA and ORANGE tools. The plan is to use deep learning classifiers to classify COVID-19 data more accurately in the near future and to analyze time series COVID-19 data.
Funding Statement: Dr. Jabeen Sultana would like to thank Deanship of Scientific Research at Majmaah University for supporting this work under the Project No. R-2021-198.
Conflicts of Interest: The authors declare that they have no conflicts of interest to report regarding the present study.
1. J. Hopkins, “University’s center for systems science and engineering website,” 2021. [Online]. Available: https://coronavirus.jhu.edu/data/new-cases. [Google Scholar]
2. A. B. Abdulkareem, N. S. Sani, S. Sahran, Z. A. A. Alyessari, A. Adam et al., “Predicting COVID-19 based on environmental factors with machine learning,” Intelligent Automation & Soft Computing, vol. 28, no. 2, pp. 305–320, 2021. [Google Scholar]
3. F. J. Alsolami, A. Saad, A. I. Khan, Y. B. Abushark, A. Almalawi et al., “Impact assessment of covid-19 pandemic through machine learning models,” Computers Materials & Continua, vol. 68, no. 3, pp. 2895–2912, 2021. [Google Scholar]
4. N. Zhu, D. Zhang, W. Wang, X. Li, B. Yang et al., “A novel coronavirus from patients with pneumonia in China 2019,” New England Journal of Medicine, vol. 382, no. 8, pp. 727–733, 2020. [Google Scholar]
5. W. J. Guan, Z. Y. Ni, Y. Hu, W. H. Liang, C. Q. Ou et al., “Clinical characteristics of coronavirus disease 2019 in China,” New England Journal of Medicine, vol. 382, no. 18, pp. 1708–1720, 2020. [Google Scholar]
6. R. Vaishya, M. Javaid, I. H. Khan and A. Haleem, “Artificial Intelligence (AI) applications for COVID-19 pandemic,” Diabetes & Metabolic Syndrome: Clinical Research & Reviews, vol. 14, no. 4, pp. 337–339, 2020. [Google Scholar]
7. S. Lalmuanawma, J. Hussain and L. Chhakchhuak, “Applications of machine learning and artificial intelligence for Covid-19 (SARS-CoV-2) pandemic: A review,” Chaos Solitons & Fractals, vol. 139, no. 2, pp. 110059, 2020. [Google Scholar]
8. A. Saygılı, “A new approach for computer-aided detection of coronavirus (COVID-19) from CT and X-ray images using machine learning methods,” Applied Soft Computing, vol. 105, pp. 107323, 2021. [Google Scholar]
9. N. Jha, D. Prashar, M. Rashid, M. Shafiq, R. Khan et al., “Deep learning approach for discovery of in silico drugs for combating COVID-19,” Journal of Healthcare Engineering, vol. 2021, pp. 1–13, 2021. [Google Scholar]
10. Y. Jiancheng, “The role of health technology and informatics in a global public health emergency: Practices and implications from the COVID-19 pandemic,” JMIR Medical Informatics, vol. 8, no. 7, pp. e19866, 2020. [Google Scholar]
11. M. Baz, H. Zaini, H. S. Elsayed, M. AbuAlNaja, H. M. ElHoseny et al., “Utilization of artificial intelligence in medical image analysis for COVID-19 patients detection,” Intelligent Automation & Soft Computing, vol. 30, no. 1, pp. 97–111, 2021. [Google Scholar]
12. V. Chamola, V. Hassija, Vl Gupta and M. Guizani, “A comprehensive review of the COVID-19 pandemic and the role of IoT, drones, AI, blockchain, and 5G in managing its impact,” IEEE Access, vol. 8, pp. 90225–90265, 2020. [Google Scholar]
13. C. Iwendi, A. K. Bashir, A. Peshkar, R. Sujatha and J. M. Chatterjee, “COVID-19 patient health prediction using boosted random forest algorithm,” Frontiers in Public Health, vol. 8, pp. 357, 2020. [Google Scholar]
14. M. Barstugan, U. Ozkaya and S. Ozturk, “Coronavirus (COVID-19) classification using CT images by machine learning methods,” arXiv preprint, arXiv:2003.09424, 2020. [Google Scholar]
15. N. C. Peeri, N. Shrestha, M. S. Rahman, R. Zaki, Z. Tan et al., “The SARS, MERS and novel coronavirus (COVID-19) epidemics, the newest and biggest global health threats: What lessons have we learned?” International Journal of Epidemiology, vol. 49, no. 3, pp. 717–726, 2020. [Google Scholar]
16. H. H. Elmousalami and A. E. Hassanien, “Day level forecasting for coronavirus disease (COVID-19) spread: Analysis, modeling and recommendations,” arXiv preprint, arXiv:2003.07778, 2020. [Google Scholar]
17. R. M. Rizk Allah and A. E. Hassanien, “COVID-19 forecasting based on an improved interior search algorithm and multi-layer feed forward neural network,” arXiv preprint, arXiv:2004.05960, 2004. [Google Scholar]
18. M. J. Rezaee, S. Yousefi, M. Eshkevari, M. Valipour and M. Saberi, “Risk analysis of health, safety and environment in chemical industry integrating linguistic FMEA, fuzzy inference system and fuzzy DEA,” Stochastic Environmental Research and Risk Assessment, vol. 34, no. 1, pp. 201–218, 2020. [Google Scholar]
19. R. Navares, J. Díaz, C. Linares and J. L. Aznarte, “Comparing ARIMA and computational intelligence methods to forecast daily hospital admissions due to circulatory and respiratory causes in Madrid,” Stochastic Environmental Research and Risk Assessment, vol. 32, no. 10, pp. 2849–2859, 2018. [Google Scholar]
20. H. Cui and V. P. Singh, “Application of minimum relative entropy theory for streamflow forecasting,” Stochastic Environmental Research and Risk Assessment, vol. 31, no. 3, pp. 587–608, 2017. [Google Scholar]
21. M. Torky and A. E. Hassanien, “COVID-19 blockchain framework: innovative approach,” arXiv preprint, arXiv:2004.06081, 2004. [Google Scholar]
22. D. Ezzat and H. A. Ella, “GSA-DenseNet121-COVID-19: a hybrid deep learning architecture for the diagnosis of COVID-19 disease based on gravitational search optimization algorithm,” arXiv preprint, arXiv:2004.05084, 2004. [Google Scholar]
23. R. Farkh, M. T. Quasim, K. Al Jaloud, S. Alhuwaimel and S. T. Siddiqui, “Computer vision control based CNN-PID for robot,” Computers Materials & Continua, vol. 68, no. 1, pp. 1065–1079, 2021. [Google Scholar]
24. Z. Yang, Z. Zeng, K. Wang, S. S. Wong, W. Liang et al., “Modified SEIR and AI prediction of the epidemics trend of COVID-19 in China under public health interventions,” Journal of Thoracic Disease, vol. 12, no. 3, pp. 165–174, 2020. [Google Scholar]
25. M. Yamin, A. Ahmed, Z. M. AlKubaisy and R. Almarzouki, “A novel technique for early detection of covid-19,” Computers Materials & Continua, vol. 68, no. 2, pp. 2283–2298, 2021. [Google Scholar]
26. X. Yan and X. Su, “Linear regression analysis: Theory and computing,” World Scientific, 2009. [Online]. Available: https://www.worldscientific.com/worldscibooks/10.1142/6986. [Google Scholar]
27. S. H. Gill, N. A. Sheikh, S. Rajpar, Z. U. Abidin, N. Z. Jhanjhi et al., “Extended forgery detection framework for covid-19 medical data using convolutional neural network,” Computers Materials & Continua, vol. 68, no. 3, pp. 3773–3787, 2021. [Google Scholar]
28. Waselallah Alsaade F., Aldhyani T. and Hmoud Al-Adhaileh M., “Developing a recognition system for classifying covid-19 using a convolutional neural network algorithm,” Computers Materials & Continua, vol. 68, no. 1, pp. 805–819, 2021. [Google Scholar]
29. A. Alotaibi, M. Shiblee and A. Alshahrani, “Prediction of severity of COVID-19-infected patients using machine learning techniques,” Computers, vol. 10, no. 3, pp. 31, 2021. [Google Scholar]
30. A. D. K. Tareen, M. S. A. Nadeem, K. J. Kearfott, K. Abbas, M. A. Khawaja et al., “Descriptive analysis and earthquake prediction using boxplot interpretation of soil radon time series data,” Applied Radiation and Isotopes, vol. 154, no. 3, pp. 108861, 2019. [Google Scholar]
31. I. Ashraf, W. S. Alnumay, R. Ali, S. Hur, A. K. Bashir et al., “Prediction models for covid-19 integrating age groups, gender, and underlying conditions,” Computers, Materials & Continua, vol. 67, no. 3, pp. 3009–3044, 2021. [Google Scholar]
32. P. Zhang and A. M. Krieger, “Appropriate penalties in the final prediction error criterion: a decision theoretic approach,” Statistics & Probability Letters, vol. 18, no. 3, pp. 169–177, 1993. [Google Scholar]
33. A. M. Alsaqr, “Remarks on the use of Pearson’s and Spearman’s correlation coefficients in assessing relationships in ophthalmic data,” African Vision and Eye Health, vol. 80, no. 1, pp. 10, 2021. [Google Scholar]
34. T. D. Gauthier, “Detecting trends using Spearman's rank correlation coefficient,” Environmental Forensics, vol. 2, no. 4, pp. 359–362, 2001. [Google Scholar]
35. Z. Hajirahimi and M. Khashei, “Hybrid structures in time series modeling and forecasting: A review,” Engineering Applications of Artificial Intelligence, vol. 86, no. 1, pp. 83–106, 2019. [Google Scholar]
36. T. K. Yamana and J. Shaman, “A framework for evaluating the effects of observational type and quality on vector-borne disease forecast,” Epidemics, vol. 30, no. 12, pp. 100359, 2020. [Google Scholar]
37. M. Billio, R. Casarin and L. Rossini, “Bayesian nonparametric sparse VAR models,” Journal of Econometrics, vol. 212, no. 1, pp. 97–115, 2019. [Google Scholar]
38. S. Portet, “A primer on model selection using the Akaike Information Criterion,” Infectious Disease Modelling, vol. 5, no. 5, pp. 111–128, 2020. [Google Scholar]
39. Y. Mu, X. Liu and L. Wang, “A Pearson’s correlation coefficient based decision tree and its parallel implementation,” Information Sciences, vol. 435, no. 11, pp. 40–58, 2018. [Google Scholar]
 | This work is licensed under a Creative Commons Attribution 4.0 International License, which permits unrestricted use, distribution, and reproduction in any medium, provided the original work is properly cited. |