DOI:10.32604/iasc.2022.021216
| Intelligent Automation & Soft Computing DOI:10.32604/iasc.2022.021216 | |
| Article |
Prediction of Suitable Candidates for COVID-19 Vaccination
1School of Information Technology and Engineering, Vellore Institute of Technology, Vellore, India
2Department of IT, Lord Buddha Education Foundation & Scientific Research Group in Egypt (SRGE), Kathmandu, Nepal
3School of Computer Science and Engineering, SCE, Subang Jaya Taylors University, Malaysia
4Department of Computer Engineering, College of Computer and Information Technology, Taif University, Taif, 21994, Saudi Arabia
*Corresponding Author: NZ Jhanjhi. Email: noorzaman.jhanjhi@taylors.edu.my
Received: 27 June 2021; Accepted: 16 August 2021
Abstract: In the current times, COVID-19 has taken a handful of people’s lives. So, vaccination is crucial for everyone to avoid the spread of the disease. However, not every vaccine will be perfect or will get success for everyone. In the present work, we have analyzed the data from the Vaccine Adverse Event Reporting System and understood that the vaccines given to the people might or might not work considering certain demographic factors like age, gender, and multiple other variables like the state of living, etc. This variable is considered because it explains the unmentioned variables like their food habits and living conditions. The target group for this work will be the healthcare workers, government bodies & medical research organizations. We analyze the data using machine learning techniques & algorithms and predict the working of COVID-19 vaccines on specific age groups developed by significant vaccine manufacturers, i.e., PFIZER\BIONTECH and MODERNA. Data visualization and analysis interpret the vaccine impact based on the above-said variables. It becomes clear that people belonging to a specific demographic factor can have an option to choose the vaccine accordingly based on the previous history of a particular manufacturer’s vaccine getting succeeded for that demographic factor. The various machine learning algorithms we have used are Logistic Regression, Adaboost, Decision Tree, and Random Forest. We have considered the DIED variable as the target variable as this results in a high life threat. On performance measure, perspective Adaboost is showing appreciable values. The prediction of the type of vaccine to be administered could be derived using this machine learning algorithm. The accuracy we achieved based on the experiment are as follows: Decision Tree Classifier with 97.3%, Logistic Regression with 97.31%, Random Forest with 97.8%, AdaBoost with 98.1%.
Keywords: COVID-19 Vaccine; vaccine adverse event reporting system (VAERS) dataset; machine learning (ML); logistic regression; adaboost algorithm; decision tree (DT); random forest (RF)
In today’s world, the main concern has become COVID-19, and we are trying our best to fight this pandemic. Researchers and clinicians have been working hard for over a year to develop the vaccine for this disease finally. Now that it is here, the main task is to get it to the people. However, Researchers say people might have a negative impact from this vaccine. Certain cases have been reported around the world about such negative impacts. Several bad health conditions or symptoms that the candidate already has can lead to a horrible effect on taking the COVID-19 vaccine. The worst effect can even lead to the death of the candidate. So, it is essential to know the prior health condition of the candidate.
The main objective of this work is to develop a system that predicts if a candidate’s life is in danger once he/she takes the COVID-19 vaccine through various machine learning (ML) algorithms. We have used regression analysis in this work. Regression is used when one seeks to predict a numerical quantity. Dataset is a real-world basis that helps in training the system and predicting the result more accurately. We have taken up a dataset on adverse effects after vaccination. The data consists of vaccines and their adverse effects on individuals living in the United States. We analyze personal data, i.e., demographic factors (Age and Gender), combining it with a geographic factor (State in which candidates live) to understand the living habits. We prioritize the symptoms and group them into specific categories like normal, critical, and life-threatening. We still are not sure about how effective this vaccine can be. We predict that depending on what age groups a specific manufacturer's vaccine COVID-19 will probably show adverse effects, thereby preventing the vaccination for that age group until the vaccine is entirely successful.
Additionally, we have utilized the Adaboost algorithm, which reassigns weights to each instance to help reduce bias and variance and improve accuracy. Adaboost helped us to obtain better results. This research aimed to help us better understand the adverse effects of various vaccines with the help of four different chosen ML algorithms. We propose various methods that help reduce bias and variance in the data while maintaining excellent accuracy to help classify the candidate as suitable for vaccination. The proposed system was trained using the VAERS dataset that contains 4716 rows with 18 columns with data regarding two different types of vaccines. The rest of the paper has been structured as follows: Section 2 consists of the literature review where we analyze how the various algorithms utilized by us were applied in different scenarios. Section 3 consists of the proposed system where the system's architecture has been provided, and the various modules of the system are elaborated in detail. Information regarding the dataset utilized has also been included. Section 4 is results and discussion where we provide the various metrics achieved by our algorithms and analyze the results and graphs. Section 5 consists of a conclusion where we summarize the findings of our study and introspect about future work.
Since the technology is rapidly increasing, there are many chances and possibilities for ML in the field of healthcare [1]. The authors were not sure about the interpretability of ML techniques. Therefore, this paper compared and tried to find the credibility of different ML techniques related to healthcare. The authors discussed different characteristics of interpretable models. This work can be used as a guide to creating the requirements of interpretable models in our system. Zhu et al. [2] tried to predict whether a patient would develop severe symptoms of COVID-19 later. If yes, then the proposed system predicts the conversion time. Authors used ML techniques like a joint classification and regression method. This paper showed a prediction accuracy of 76.97% with a coefficient correlation of 0.524. Their system also used similar classification and regression methods to increase the accuracy rate. Roland et al. [3] surveyed social media to collect real-time data that included COVID-19 symptoms, demographic information, etc. Then through LR, the system will be able to predict COVID-19 positive candidates. For this, selected classifiers were assessed using ROC curve analysis. With the help of different regression techniques and RC curves, the authors tried to achieve a good result. Reference [4] models’ scenarios for COVID-19 in the USA. The scenarios like the percentage of people who should wear masks so that the spread can be reduced, the death rate can be reduced. Another thing they have achieved is that they could estimate the effects of social distancing through different suitable regression models. Using such methods helped them to gain good results. Iwendi et al. [5] includes the use of an imbalanced dataset, and they have pre-processed the dataset to apply various ML classification models, which are DT classifier, support vector machine (SVM) classifier, boosted RF classifier. They have used the F1 score as the primary metric for the performance evaluation and got the highest F1 score of 81% by implementing the RF algorithm boosted by the Adaboost algorithm. Prakash et al. [6] briefs about the application of various ML algorithms on COVID-19 datasets. An analysis is performed to determine which age groups are more susceptible. Eight different algorithms are utilized, and their performance is compared based on different metrics. Finally, RF with an accuracy of 96% has been deemed the best algorithm in this work for COVID-19 prediction. Correlation matrices and bar charts have been drawn to better analyze the COVID-19 datasets in this paper. Abdar et al. [7] described the use of various ML algorithms to diagnose coronary artery disease. Ten different algorithms were tested, and the top 3 algorithms were chosen to explore in more detail. A new optimization technique was introduced in this paper called N2Genetic Optimizer that drastically improved the performance of the various ML techniques used. The methodology proposed in this paper can be utilized to predict various other diseases like cancer and coronary artery disease.
Shipe et al. [8] intends to support clinical decision-making with the help of a prediction model with dual outcomes that are based on LR. This article described the steps involved in creating LR risk forecasting models, from choosing a data source to choosing predictor variables, evaluating model results, conducting internal and external validation, and determining the model's effect on outcomes. The overall conclusion is that a prediction model should provide reliable and validated predictions of an individual’s risks to enhance an individual’s outcome. Uddin et al. [9] aimed to find commonalities among various types of supervised ML methods and their performance and application in disease risk prediction. Of the many ML algorithms observed in this paper, the SVM algorithm has been used most frequently in different studies, with Naïve Bayes (NB) coming only second. Only studies that utilized the same dataset were chosen for a more accurate comparison of algorithms. Though used the most, SVM has been shown to perform poorly for the most part compared to other algorithms. However, in other articles that utilized research data that is not clinical, SVM and RF have been shown to perform the best with superior accuracy.
Souza et al. [10] conducted two experiments. Experiment 1 consists of repeated tests using only the training dataset, and experiment 2 for the final test using both training and validation datasets. From both the experiments, the evaluation metrics for LR with an accuracy of 88% are higher than others. Sujatha et al. [11] introduced a model that could be valuable to foresee the spread of COVID-2019. Utilizing linear regression, multi-layer perceptron (MLP) & Vector autoregression technique on the COVID-19 Kaggle dataset to expect the epidemiological illustration of the illness and speed of COVID-19 cases in India. In [12], creators considered strategies to research appropriate Statistical Neural Network (SNN) models & their mixture form for COVID-19 death forecast in Indian populaces & to appraise the future COVID-19 demise cases for India. Combatting the coronavirus spread is the need of the hour across the globe [13]—various virologists working round the clock to find vaccines that will reduce the attack’s impact. Medical workers are striving a lot to safeguard the infected person's life, and it is better to have the vaccine in advance. Because of the mutation behavior of the virus, it is required to design the vaccine based on various considerations. Work focussed on putting together reverse vaccinology and machine learning for vaccine designing tasks. Sentiment analysis, part of machine learning, is applied to the tweet dataset obtained from the Indian citizens’ viewpoint, and it is given that 78.5% of the comments about vaccines are neutral or positive [14]. Few unexpected deaths post-vaccination is the result of the adverse comments about vaccination. Entirely, work discusses the usage of machine learning in handling the virus detection and tasks to bring down the spread and assist in the healthcare perspective [15]. Few of the modules that show the inevitable involvement of the artificial intelligence concepts are medical imaging, chatbots, thermal imaging, monitoring, and tracking.
3.1.1 Logistic Regression (LR)
LR is a characterization approach that utilizes supervised learning to foresee the likelihood of a target variable. Since the existence of the target or the dependent variable is dichotomous, there exist only two classes. In simple terms, the input variable is dual, with the information presented as 1 (or yes) or 0 (or no). It is an S-shaped graph that shows any real-valued number to a value as either 0 or 1, but not exactly. Since our work is about the prediction with only two outputs, either yes (1) or no (0), Logistic regression is most suitable here. Through this regression, we can produce desirable output. It predicts whether the person has a death threat after taking the vaccine based on that person’s symptoms [16].
The AdaBoost algorithm, which stands for Adaptive Boosting, is used as an Ensemble Method in ML. The weights are once again assigned to every occurrence, with more weights to incorrectly classified occurrences. In supervised learning, boosting is utilized to minimize bias & variance. It is working on the idea of the consecutive growth of learners. Each successive learner, except the first, is evolved from prior grown learners. In other words, weak learners are transmuted into strong learners. Although the Adaboost algorithm operates on the very same concept as boosting, there is a minor difference in how it works [17].
This supervised learning approach entails RF, which is a standard ML algorithm. It is founded on ensemble learning, a method of combining multiple classifiers to find and fix problems and improve the model’s accuracy. RF is a classification algorithm that combines DT on various subsets of a dataset and midpoints the outcomes to expand the dataset’s prescient accuracy. It is capable of handling large datasets with high dimensionality, which is helpful in this work since we have used a large dataset. It also improves the model's accuracy and eliminates the problem of overfitting [18].
DT is a supervised learning strategy that applies to both classification & regression; however, it is frequently used to settle classification issues. Internal nodes signify dataset ascribes; branches address decision rules & each leaf node addresses the outcome in this tree-organized classifier. The Decision Node & the Leaf Node are the two nodes in a DT. Leaf nodes result from such decisions & do not have any extra branches, while Decision nodes are frequently used to settle on any decision and have a few branches. The decisions or tests are made based on the characteristics of the specified dataset. It is a visual representation for obtaining all potential solutions to an issue based on specific parameters. Node, which grows by branching out and forming a tree-like layout. We utilized the CART algorithm to construct a tree, representing the Classification and Regression Tree algorithm. A DT asks questions and divides the tree into subtrees depending on the response (Yes/No) [19].
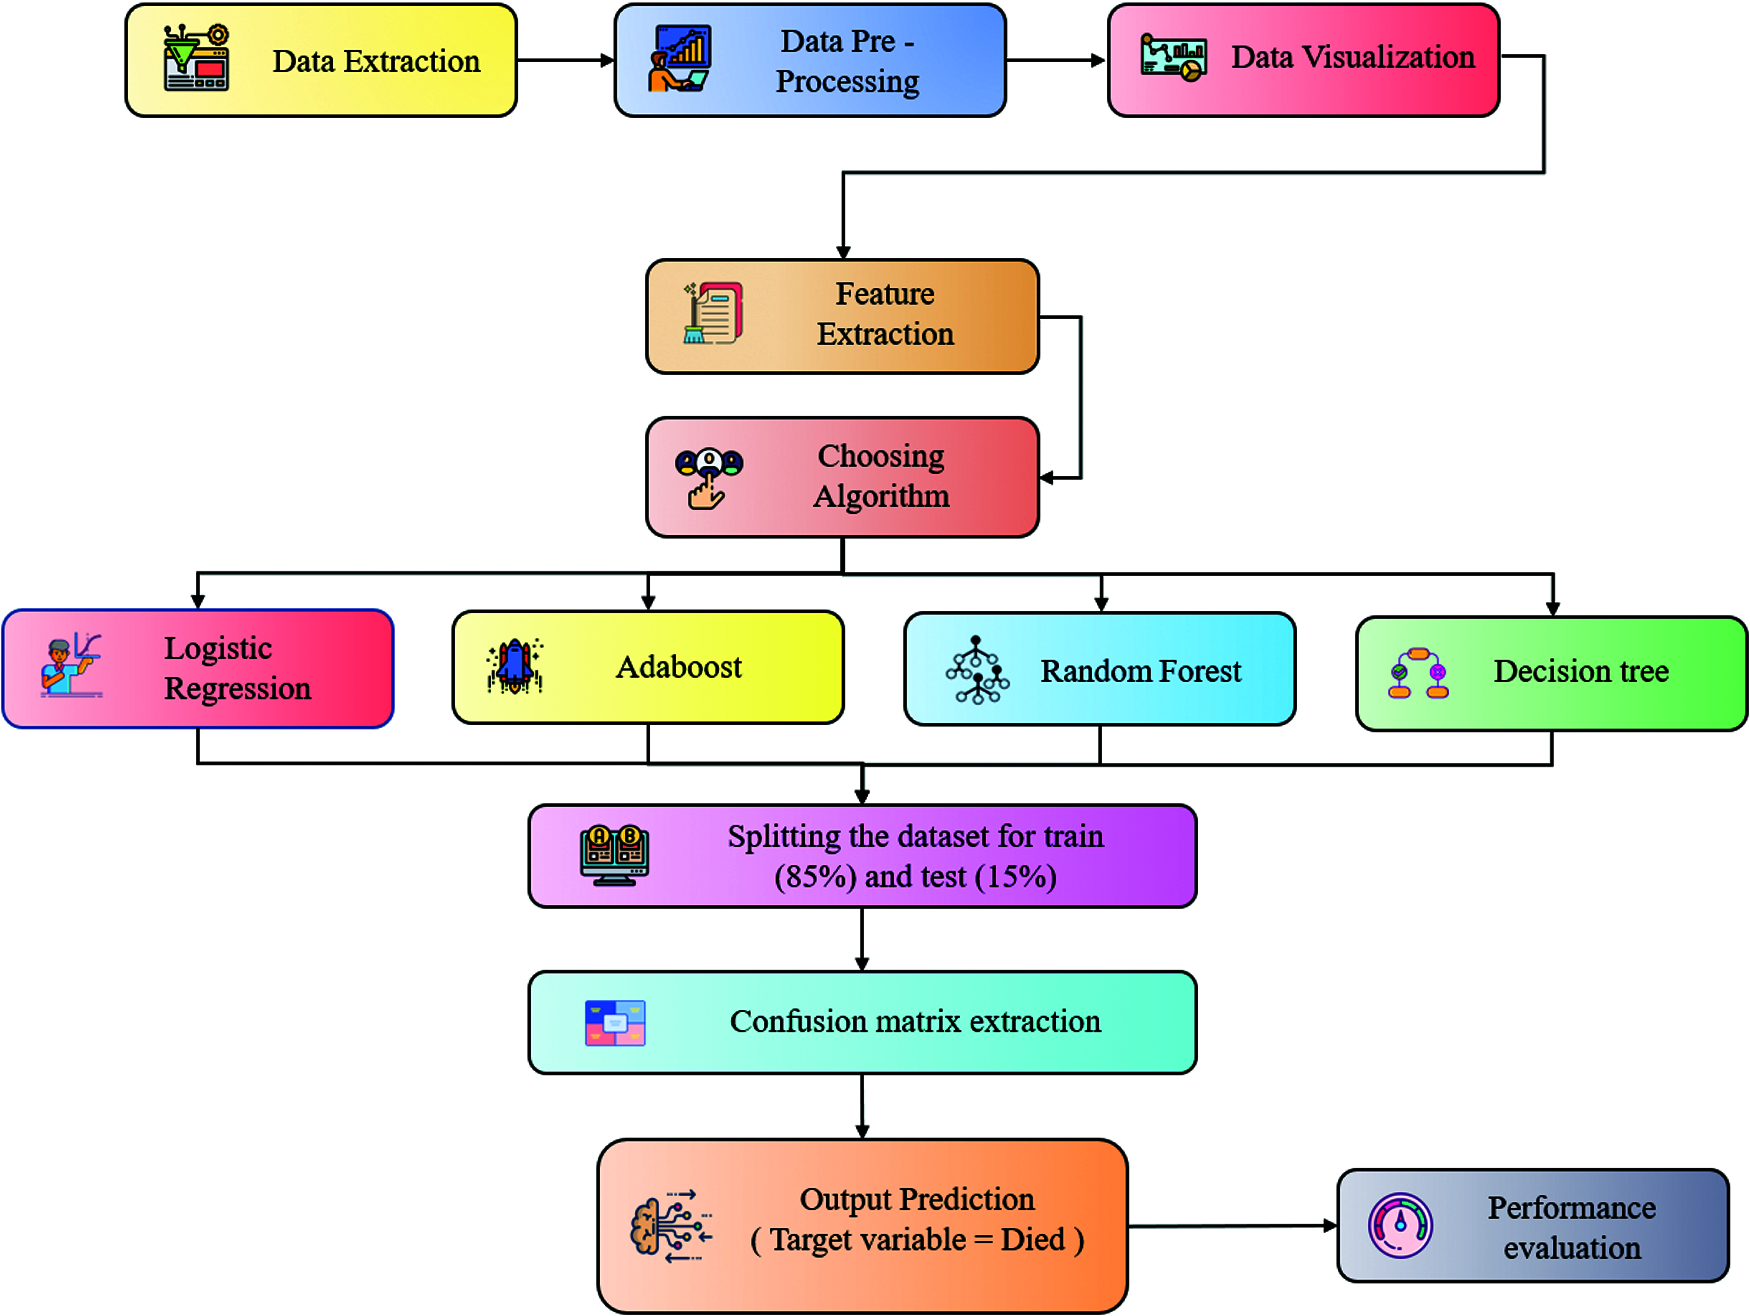
Figure 1: Architecture diagram
The detailed working of Fig. 1, is detailed below:
The data extraction is the first step where we have fetched the dataset from the VAERS. The data consists of multiple CSV files; we have to do some analysis to understand the essential attributes from the dataset. In data pre-processing, we have extracted the final dataset with all the required dependent features by pre-processing the values, i.e., empty, null, and processed other string values to appropriate integer values to process for the next step. In data visualization, we have visualized the data so that it would be easy to understand the general statistics of the data, i.e., understanding the dependencies between multiple columns such as demographics and vaccines, etc. Feature extraction involves reducing the number of attributes to a precise needed no of attributes. Then in choosing the algorithm stage, we have chosen LR, Adaboost, RF, and DT Algorithms for our ML analysis purpose. During partitioning into Training and Testing data, the Spitting of training and testing data is done in the ratio of 85(training):15(testing) percentage. We apply algorithms and predict output where 4 ML algorithms are being used to the VAERS processed dataset for training and testing purposes. After training the model against a set of data with different algorithms selected, the model is tested with another set of data to see the accuracy of our model. After going through different training and testing methods, the model can predict the most accurate result.
For the current work we have considered only 15 attributes namely: VAERS_ID, STATE, AGE_YRS, SEX, DIED, L_THREAT, RECOVD, VAX_MANU, VAX_DOSE_SERIES, VAX_ROUTE, VAX_SITE, VAX_NAME, Symptom_1, Symptom_2, Symptom_3, Symptom_4, Symptom_5. In the data pre-processing steps we have first merged the worksheet CANDIDATE DATA, VAXINE DATA & SYMPTOMS DATA using a common VAERS_ID field. Next, we have removed the unused data fields. Then we have performed optimal removal of duplicate rows from the dataset. The next steps are as follows:
• VAXINE DATA (Candidates who had received more than one vaccine) i.e., we are using the vaccine data, only received the first time by the candidate (second dosages are not considered for the analysis).
• SYMPTOMS DATA (Candidates who had more no of symptoms, as each row is limited to 5 Symptoms. We only consider the first 5 symptoms of the candidate).
• Filling / Removal of undefined values i.e., na, null, nil. Etc whole rows are removed containing even an empty usage attribute.
• The VAERS gets reported with all the vaccine data related to not only COVID19. Therefore, Vaccine types other than COVID19 are removed.
• Initially, the dataset had 9287 instances but after conducting the data pre-processing steps, the data size got reduced to 4417 instances and out of which 4009 rows have taken into training the models and 708 rows considered for testing the models.
For this covid-19 vaccine analysis system, we used the VAERS dataset. VAERS data can be accessed using the CDC WONDER online search tool or downloading raw data in CSV files for import into a database or text editing software. VAERS data that has been de-identified is available from 4-6 weeks after the report is submitted. Since VAERS data changes as new reports arrive, the results can differ if we rerun the exact search later. There are a total of 4716 rows with 18 columns of data in this dataset [20]. The various fields in this dataset are ID for identification purposes, state, i.e., locality of the patient, age of the patient, sex of the patient, state of the patient, i.e., dead/alive, the life-threatening illness of the patient, recovered patients, manufacturer of the vaccine, vaccine dosage, vaccination route, vaccination site, name of the vaccine, followed by five symptoms symptom_1, symptom_2, symptom_3, symptom_4, and symptom_5. We have gone through the dataset containing the private entities, vaccine, and symptoms-related data. We have analyzed specific columns that are connected to the adverse effects. Mostly the Life threat status of a person is dependent on symptoms and certain demographic factors, i.e., Age and Gender. We have analyzed all the columns except for the symptoms part. The data collected is analyzed and cleaned by removing all irrelevant columns and values that might not do this work. The data collected after analyzing and cleaning go through the code we developed that visualizes data in different forms, which makes it easier for us to understand and have a clear idea about the dataset. This helps in more accurate predictions. Here 4 ML algorithms are applied to the VAERS dataset for training and testing purposes. After training the model against a set of data with different algorithms selected, the model is tested with another set of data to see the accuracy of our model. After going through different training and testing methods, the model can predict the most accurate result.
We have used four different types of ML algorithms to analyze the VAERS data. These are DT Classifier, LR, Adaboost, and RF approaches. A target variable's probability is estimated using the supervised learning classification algorithm LR. The presence of the target or dependent variable is dualistic, implying that there are only two possible groups. In this case, the target variable is eligibility. It tells us whether the given candidate is eligible for the vaccination or not. RF is a supervised learning technique. It is based on a method of combining multiple classifiers called ensemble learning. This improves the system’s accuracy and solves a complex problem. RF, which is being used in this model, is a classifier algorithm that combines several DT on different subsets of a dataset. It then averages the results to improve the dataset’s predictive accuracy. One of the predictive modeling methods, DT learning, is also in this model. This method is used in data mining, analytics, and ML. This method observes an item and concludes with the item’s target value through a decision tree method as a predictive model (the leaves). Data visualization has given below.
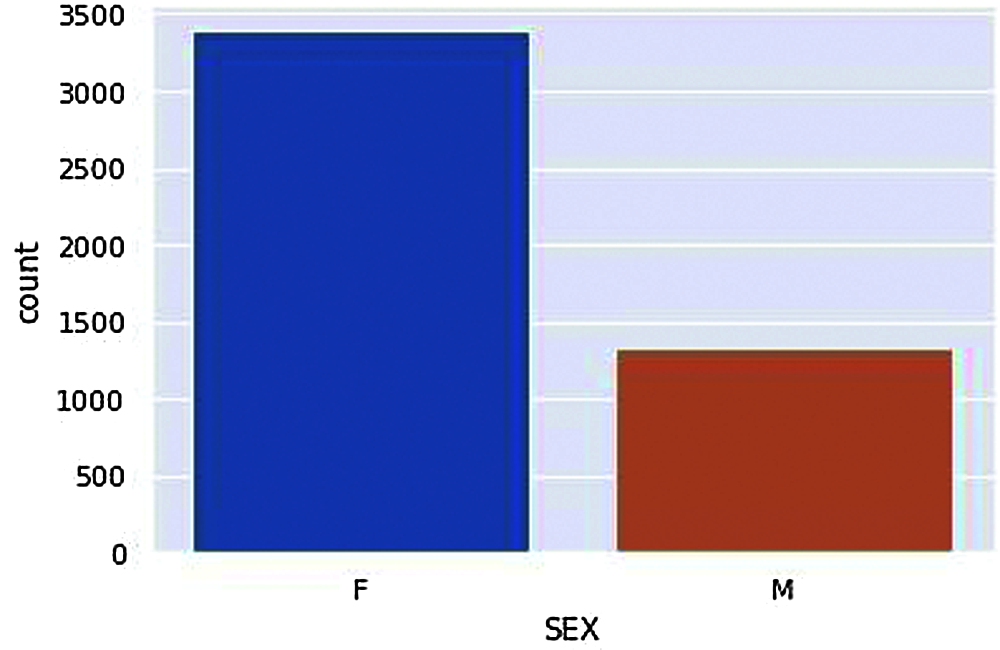
Figure 2: Vaccinated Males and Females
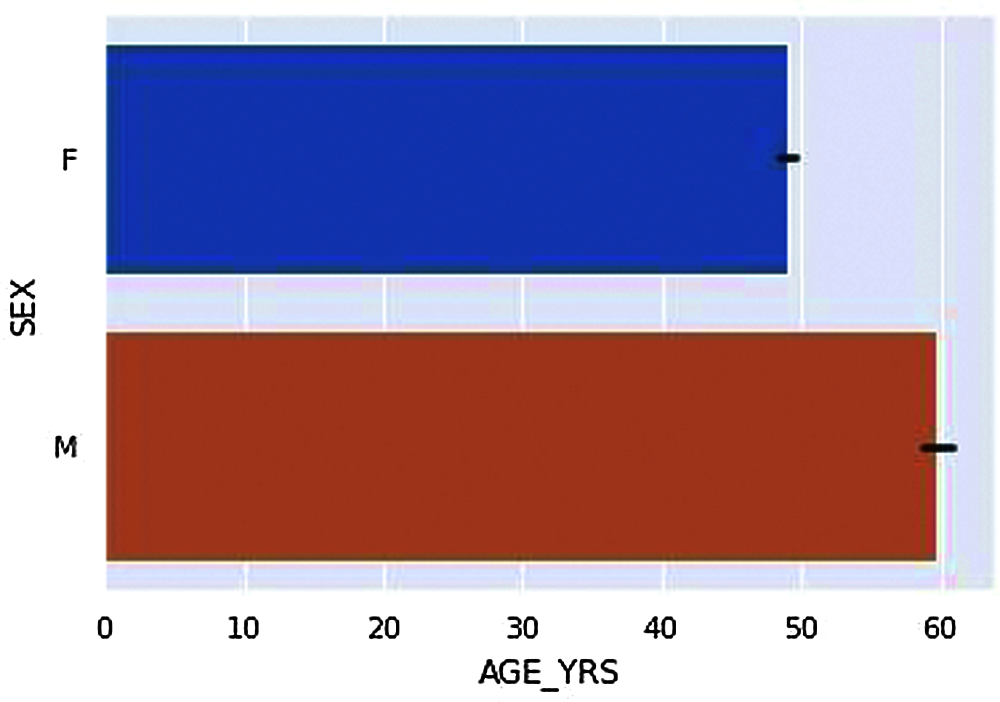
Figure 3: Average age of vaccinated Males and Females
According to the dataset, we have compared Genders, i.e., Male and Females have got vaccinated in a ratio of about 3:1, i.e., a more significant number of females were vaccinated compared to Male is given in Fig. 2. According to Fig. 3. The Average ages of Male who have received adverse effects from the vaccination are around 50–60 years old. At the same time, the average ages of females who have received the adverse effects are around the age of 40–50 years.
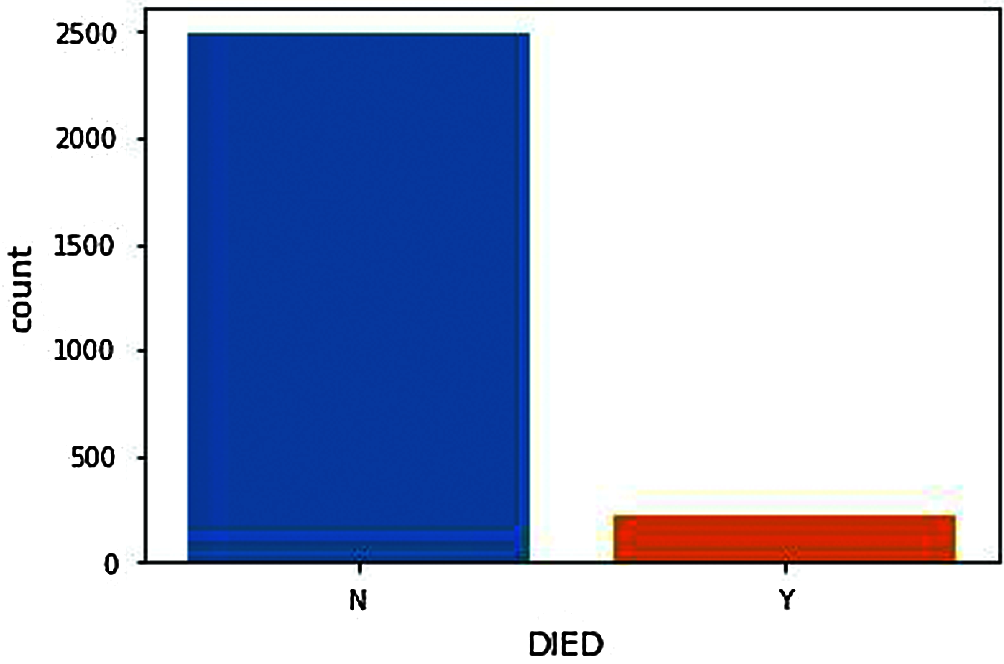
Figure 4: Death count after vaccination
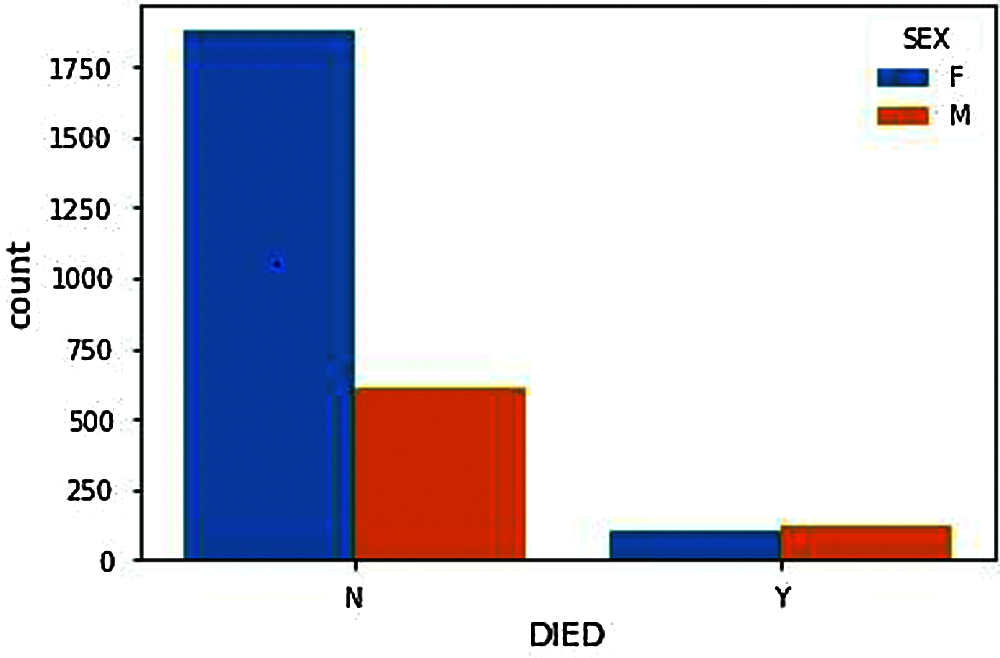
Figure 5: Gender based death count after vaccination
From DIED Attribute (N represents Not Died, Y represents Died). Fig. 4, shows the number of people death chat who have received adverse effects from vaccination. The death count as shown in the figure should, of course, be minimal or significantly less to proceed with further vaccinations. Compared with the people deaths and genders, the number of males reported with adverse effects from the COVID-19 vaccine is significantly lower than females. Therefore, the number of male deaths should also be lower but from Fig. 5, we can see that the death rate of males is significantly very high compared to females. i.e., the males are the ones having more significant adverse effects resulting in death from the COVID-19 vaccination.
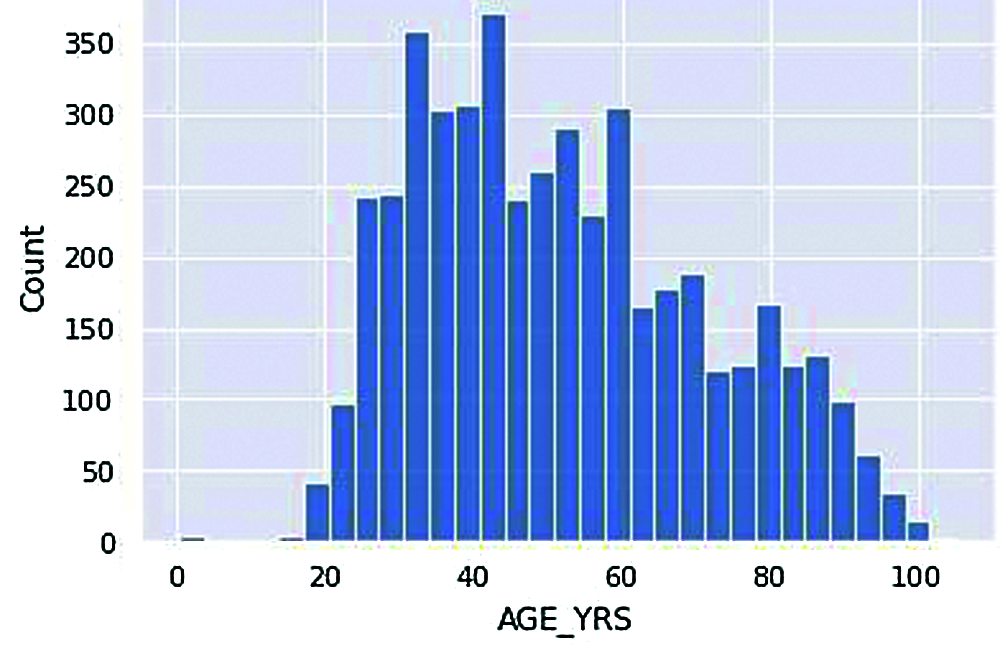
Figure 6: Vaccinated age group
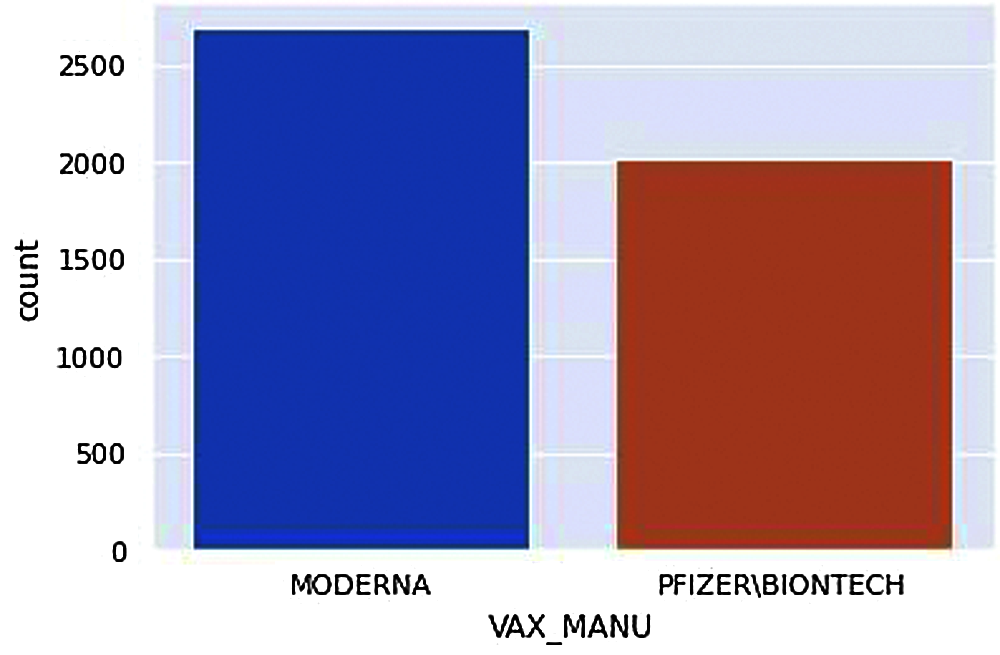
Figure 7: Types of vaccines available
The above histogram plot shows us a clearer picture of the number of people in various age groups reported with adverse effects from COVID-19 vaccination.
According to Fig. 6, the most significant number of people who receive adverse effects from vaccination come under the age of around 35-45. Moreover, the least number of people who got vaccinated come under 20-30. An average number of people who got adverse effects from vaccination come under age groups above 50. As the initial acquisition of this dataset is around the end of March 2021, Note that the lower people counted at ages below 20 have not been vaccinated by then.
This count plot in Fig. 7. shows the two different vaccines available and the count of people who received adverse effects from each one. Note that the number of MODERNA vaccines is given to more people; therefore, the number of people adversely affected by MODERNA vaccines is higher.
From Fig. 7, we can acquire the total number of people receiving adverse effects from each vaccine manufacturer.
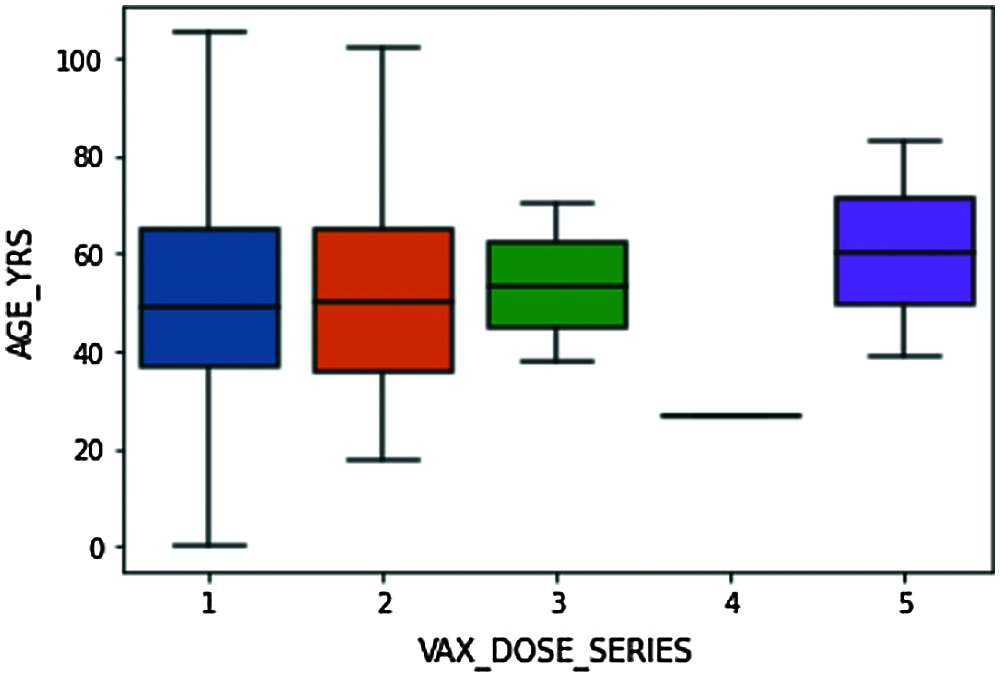
Figure 8: Box plot explaining the distribution of VAX_DOSE_SERIES data concerning AGE data
The above box plot explains the detailed distribution summary of data based on number summaries. From Fig. 8, we understand that the bottom line in the blue box represents that the candidates of ages below 40 are given with dose 1 are 25% of all people who received a single dose, 50% of the people who received single-dose are about 50 years and below, and 75% of the whole people received single dosage are about 65 and lower. Similarly, for the other dosages. Maximum people from the dataset are given either 1 or 2 vaccine doses.

Figure 9: (a), (b) & (c) Shows life threatening situation in various age groups
In Fig. 9, three different plots are categorized by age groups, i.e., Fig. 9a Mid-Adult (ages 31–59), Fig. 9b Senior-Adult (ages 60 and above), Fig. 9c Young-Adult (ages 19–30). The figures represent the life threats caused by vaccines of different vaccine manufacturers. From the range of 0 to 1, 0 represents no life threat, 1 represents life threat. Compared with genders, i.e blue bar represents Female candidates, and orange represents Male candidates.
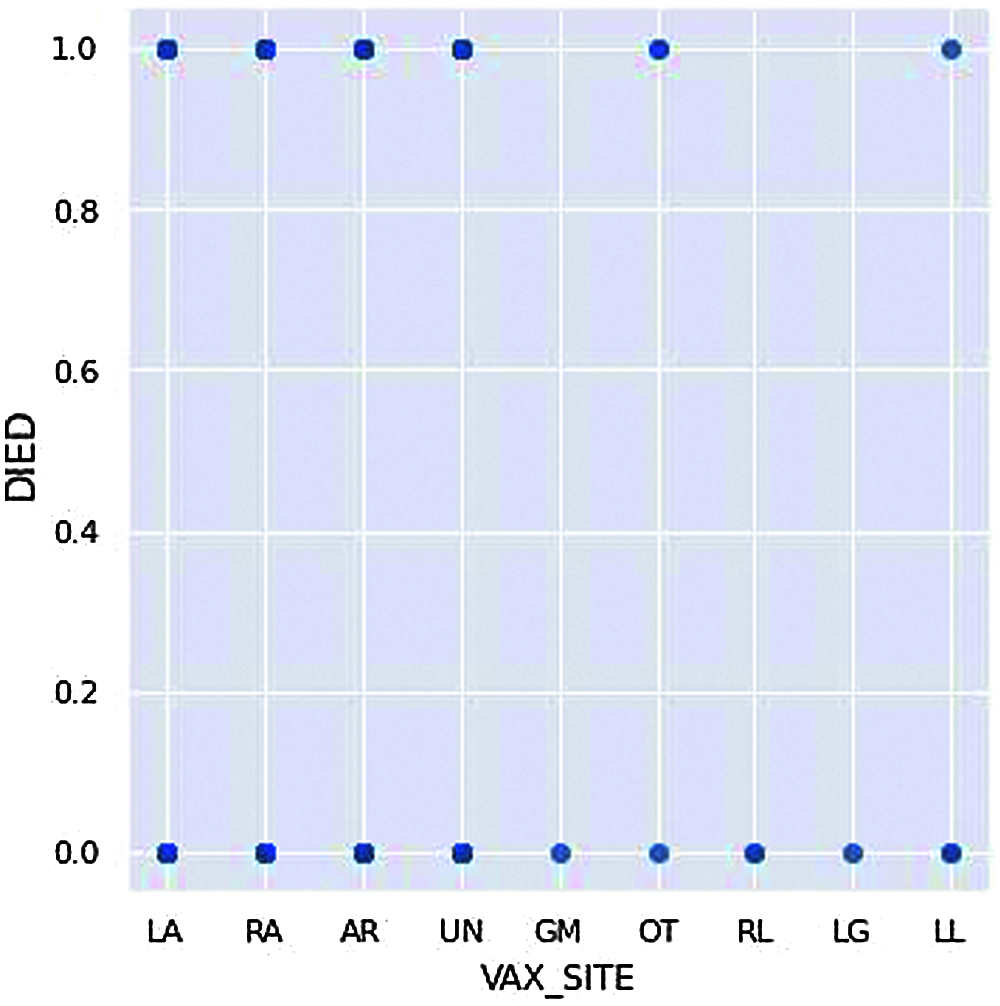
Figure 10: Death count vs. administered vaccination site
The markings on the x-axis are the positions on the body at which the candidate received the vaccination; for example, LA means Left Arm, and RA means Right Arm in Fig. 10. Similarly, the candidate receiving the vaccine at GM, RL, LG are the ones who are not dead from the adverse effects received from the COVID-19vaccination. Even though this factor is minimal to affect one’s death, by this figure, we can understand that the factor can still be considered against the right way to vaccinate.
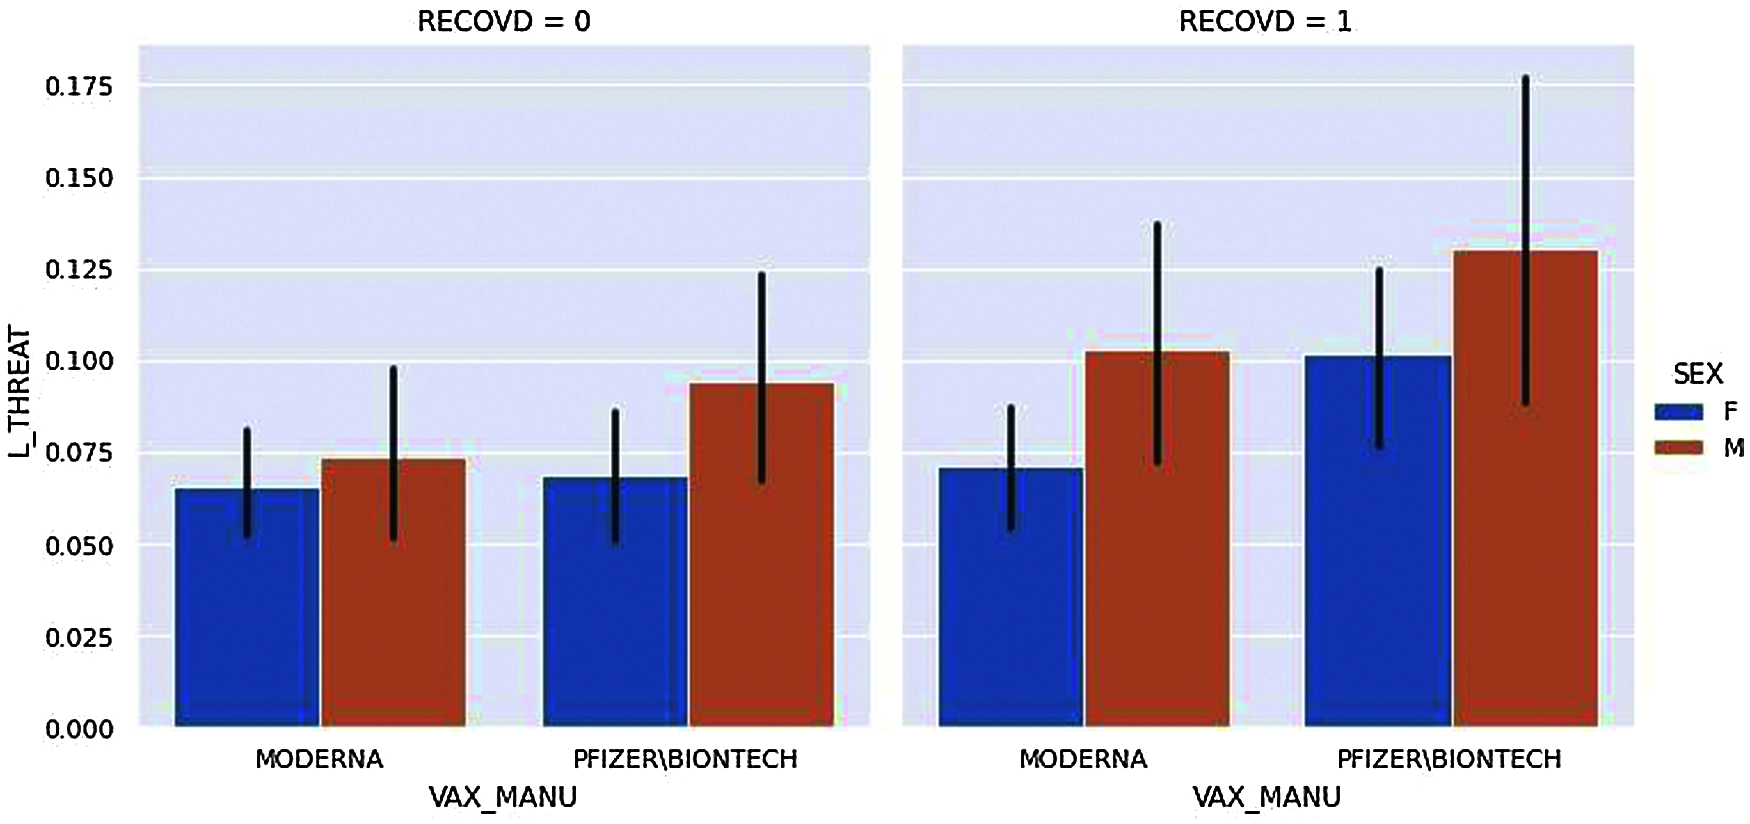
Figure 11: Life threat vs. vaccine manufacturer
Fig. 11, displays the two kinds of vaccine manufacturers and compares them to show whether the vaccinated candidates have life threat from adverse effects from vaccination or not. In the figure, the candidates are divided based on their gender and their Recovery status; RECOVID=0 means the candidate has not recovered whereas RECOVID=1 means the candidate has recovered from adverse effects.
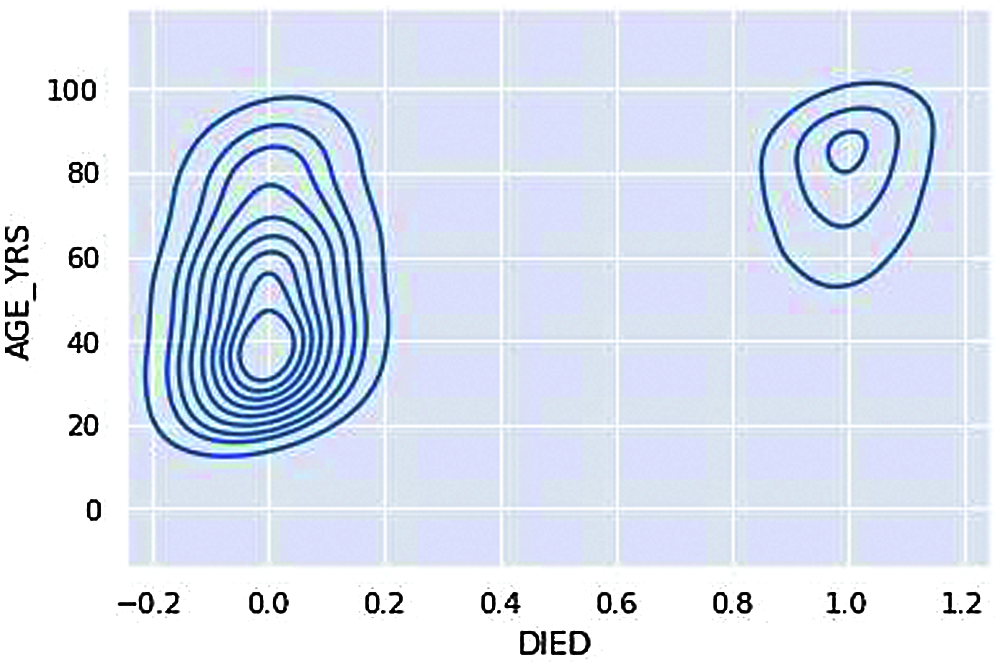
Figure 12: KDE plot – Age group deaths
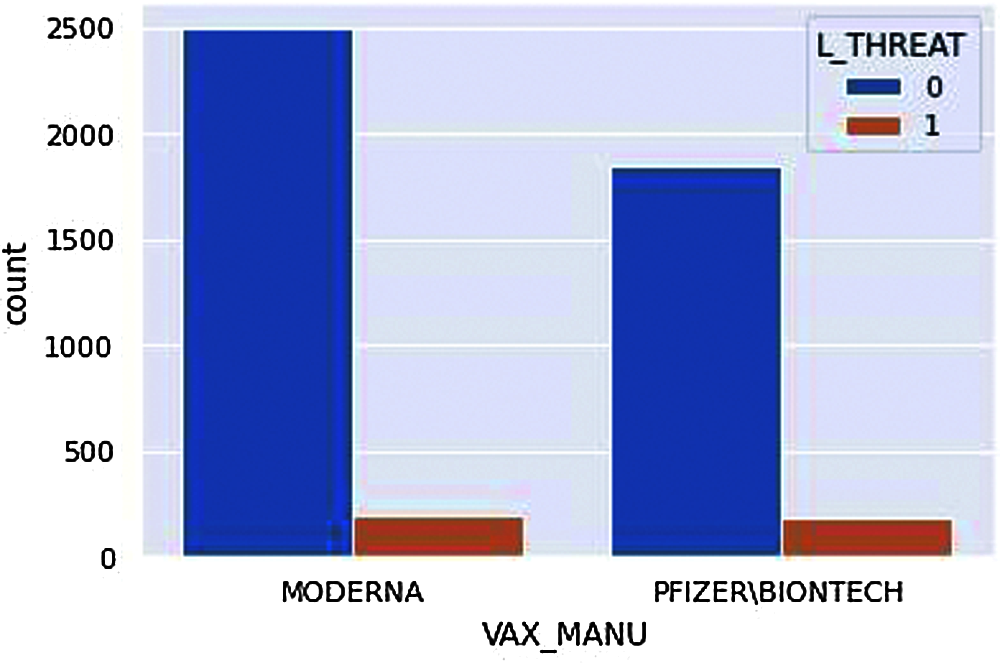
Figure 13: Count plot-Life Threat
We can understand that the overall death rate, i.e., 0 (not died) consists of more age groups and 1(Died) consists of age groups 60 and above are the ones resulting in a severe life threat from the adverse effects of vaccination, i.e., Death from Fig. 12.
Note that the number of MODERNA vaccines is given to more people; therefore, the number of people adversely affected by MODERNA vaccines is higher.
According to Fig. 13, despite the manufacturer, there are a certain number of life threats. However, if we closely observe, fewer people have a life threat from adverse effects from the MODERNA vaccine even when there are large groups of people who have received vaccines from MODERNA. This is just the overview of our analysis; it is not sure what demographic factors are suitable to what vaccine manufacturer only from this exact figure.
The orange color signifies that the values are close to 0, while the green and dark orange indicate that the correlation between variables is close to +1 or −1 in Fig. 14. Overall, the heatmap gives us the relationship between every attribute concerning every other attribute used in our analysis.
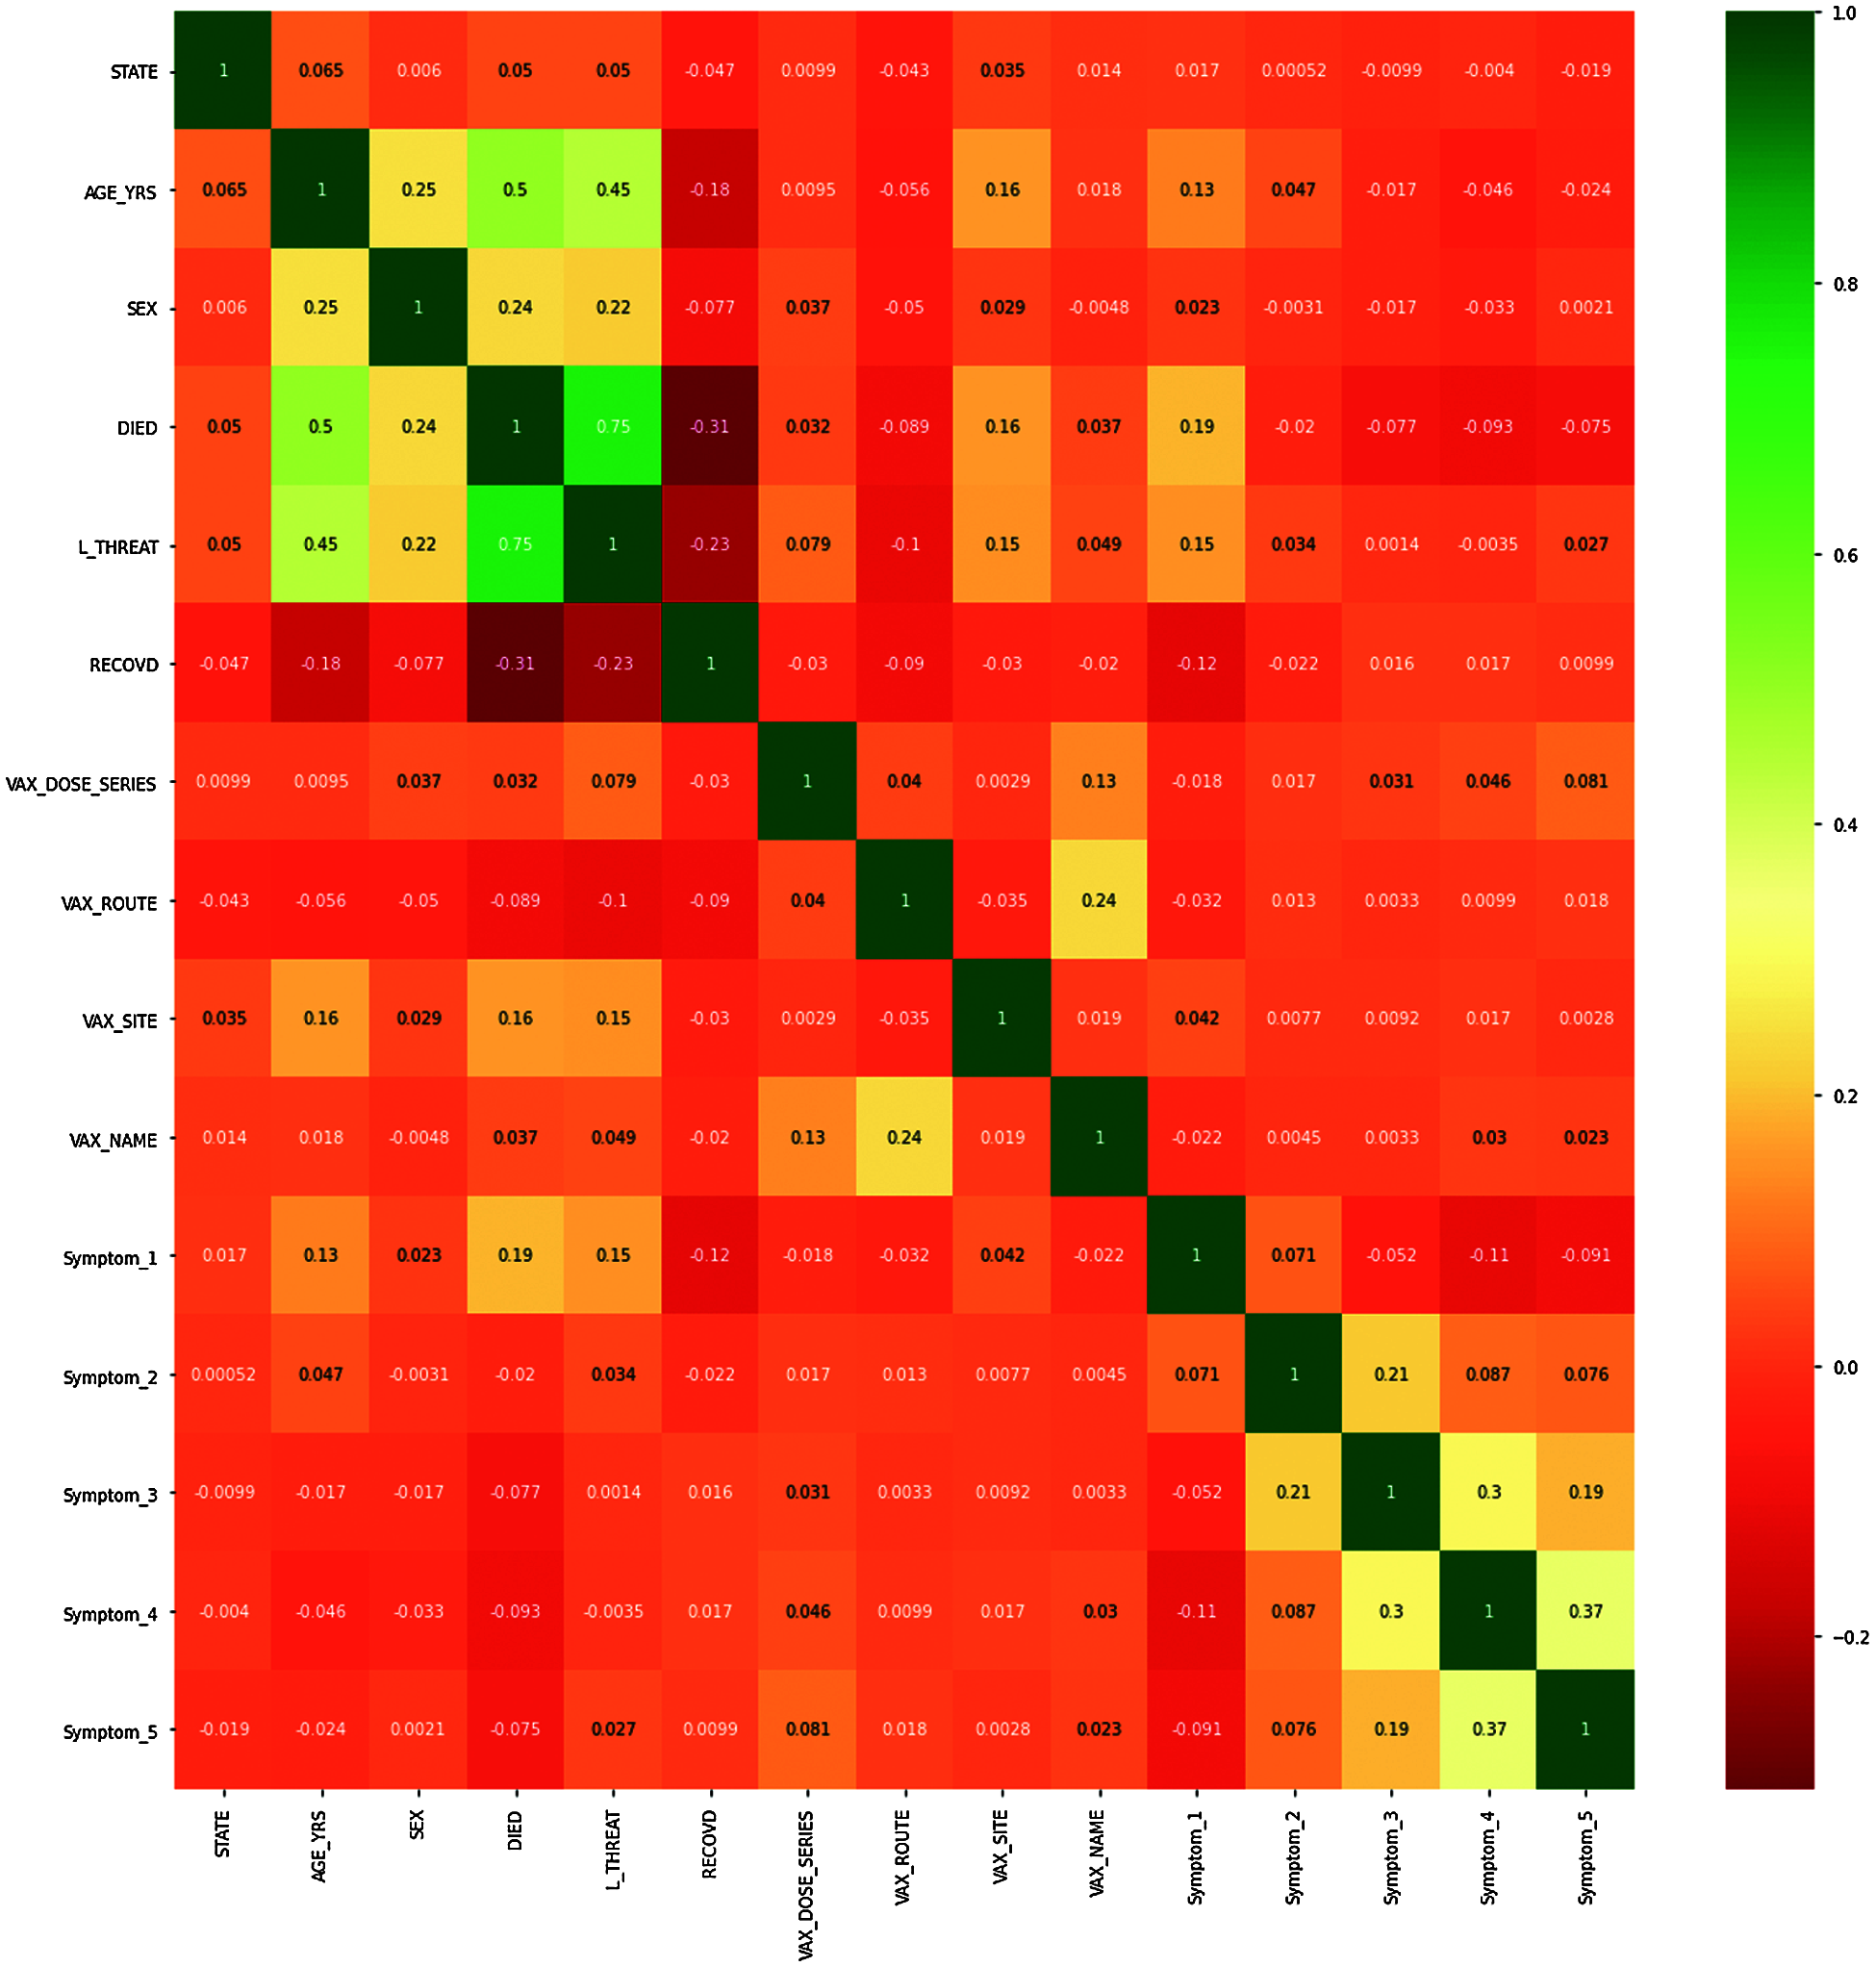
Figure 14: Correlation heat map of pre-processed data
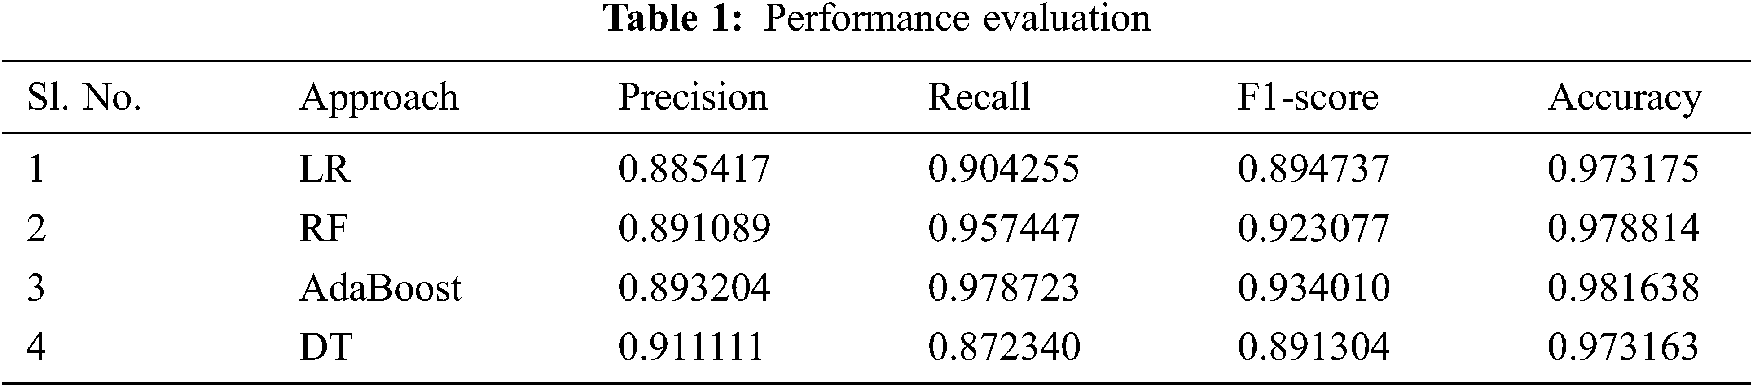
The next step after implementing ML algorithms is to find out how effective the model is based on metrics and datasets. Different performance metrics are used to evaluate different ML Algorithms. The various evaluation factors used here are true positive (TP), true negative (TN), false positive (FP), and false negative (FN). Here we are using evaluators as follows:
Accuracy-This term tells us how many right classifications were made out of all the classifications:
Precision-This is the ratio of true positives and total positives predicted:
Recall- It is essentially the ratio of true positives to all the positives in the ground truth.
F1-Score-This score will give us the harmonic mean of precision and recall. F1 score is having an equal relative contribution of precision and recall.
Tab. 1 presents the experimental result we have received.
We have set the target variable as ‘DIED’ (value 0 means live and 1 means died). Value of the following variables STATE, AGE_YRS, SEX, L_THREAT, RECOVD, VAX_MANU, VAX_DOSE_SERIES, VAX_ROUTE, VAX_SITE, VAX_NAME, Symptom_1, Symptom_2, Symptom_3, Symptom_4, Symptom_5 influences the value of the target variable. To process a new candidate, i.e., we have to input all the variable values and even the symptoms. Nevertheless, the problem here is that the symptoms from the dataset are a result of post-vaccination. There will be no symptoms before vaccination. In the analysis for the processing of symptoms, we have mapped no symptom as value ‘0’ but giving ‘0’ to every symptom (i.e., Symptom1, 2, 3, 4, and 5) for a new candidate can be done, but the outputs are not tested to detect if a person can be predicted with possibilities of death.
The below ROC curve implies the significance of the connection between sensitivity and specificity for every possible cut-off or threshold produced.
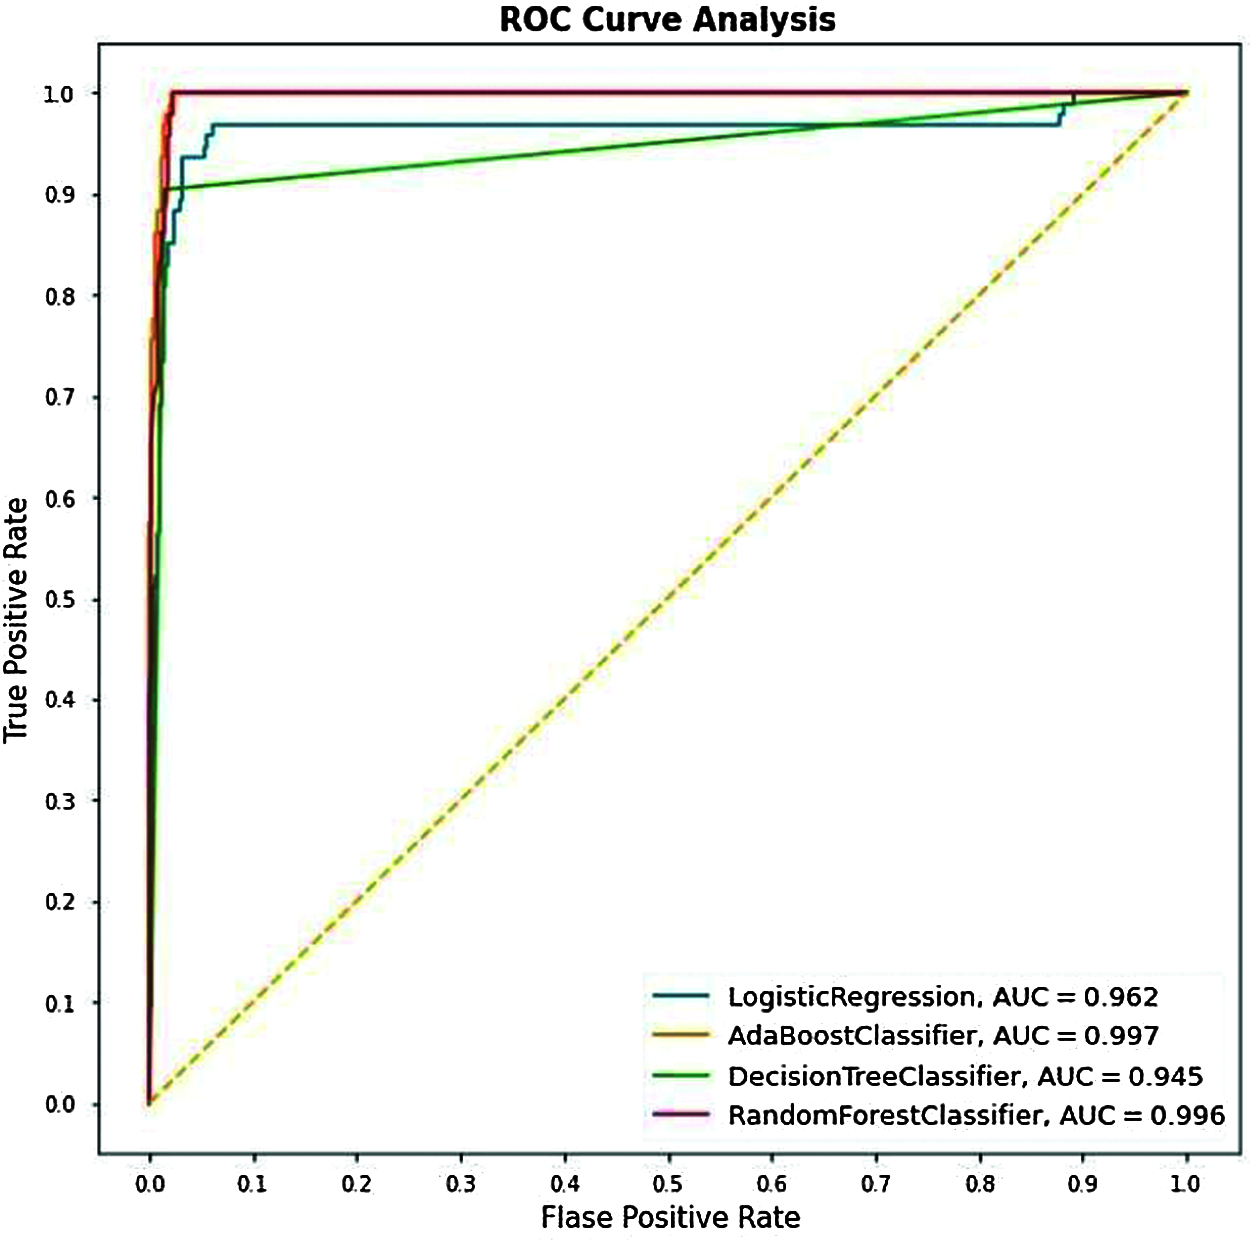
Figure 15: Cumulative ROC graphs for LR, Adaboost, DT, and RF
From Fig. 15, we can see that the AUC scores for the Testing data for different algorithms we have used got scores for the Adaboost Classifier with 99.7%, and the AUC scores for the other algorithms, i.e., RF, LR & DT have resulted as 99.5%, 96.2% & 93.5% respectively.

Figure 16: Validation curve. (a) LR, (b) RF, (c) Adaboost, (d) DT
Fig. 16a displays a validation curve for the logistic regression classifier. As can be noticed, the model has been under-fitted for the iterations in the range 0–50. However, that quickly changes from iterations 100–700; the model fits the training data right and handles the validation data with excellent accuracy.
Fig. 16b displays a validation curve for the Adaboost classifier. This classifier’s training and cross-validation curves have also reached a point of stability that demonstrates a good fit validation curve. This implies a stable accuracy score for both training and validation, which means that this classifier is also generalizable to new input.
Fig. 16c displays a validation curve for the random forest classifier. This model’s curve is the perfect demonstration of a good fit validation curve. The plot of training and cross-validation steadily increases to a state of stability.
Fig. 16d displays a validation curve for the decision tree classifier. We can observe that the accuracy scores for training and cross-validation have remained reasonably constant throughout the different iterations. This implies that the accuracy score of the classifier is not affected by the random data splitting process. It is a good fit validation curve throughout.
Prevention is better than cure. This undoubtedly applies to the current scenario of COVID19 Effects before even considering vaccination. It is better to run the previous data and analyze which factors affect when a vaccine is provided. Therefore, the vaccination can be avoided for that particular demographic factor (Ages or Genders of a particular area).
This paper is based on implementations on the dataset provided by VAERS. The dataset contained the data of individuals living in the United States of America. This paper could benefit other countries by applying similar techniques to understand and analyze the vaccination’s effects. This paper is mainly based on current scenarios of covid-19 vaccination. We have used ML algorithms, i.e., AdaBoost, DT, RF, LR, and analyzed the dataset showing the results of most affected demographic factors after getting the vaccine by certain vaccines, namely MODERNA and PFIZER\BIONTECH. The work can be further extended to any other vaccinations and diseases datasets. For the sake of proper implementation, we have restricted the no of symptoms to 5. This can be taken a step further and analyze the predictions based on multiple symptoms more than five by automating the system. Whenever new data enters the dataset, the automation can process new predictions based on the factors at that current movement.
Funding Statement: The authors would like to thank for the support from Taif University Researchers Supporting Project number (TURSP-2020/239), Taif University, Taif, Saudi Arabia.
Conflicts of Interest: The authors declare that they have no conflicts of interest to report regarding the present study.
1. M. A. Ahmad, C. Eckert and A. Teredesai, “Interpretable machine learning in healthcare,” in BCB '18: In Proc. of the 2018 ACM Int. Conf. on Bioinformatics, Computational Biology, and Health Informatics, Washington DC, USA, pp. 559–560, 2018. [Google Scholar]
2. X. Zhu, B. Song, F. Shi, Y. Chen, R. Hu et al., “Joint prediction and time estimation of COVID-19 developing severe symptoms using chest CT scan,” Medical Image Analysis, vol. 67, no. 7, pp. 101824–101860, 2021. [Google Scholar]
3. L. T. Roland, J. G. Gurrola, P. A. Loftus, S. W. Cheung and J. L. Chang, “Smell and taste symptom-based predictive model for COVID-19 diagnosis,” International Forum of Allergy & Rhinology, vol. 10, no. 7, pp. 832–838, 2020. [Google Scholar]
4. IHME COVID-19 Forecasting Team, “Modeling COVID-19 scenarios for the United States,” Nature Medicine, vol. 27, no. 1, pp. 94–105, 2021. [Google Scholar]
5. C. Iwendi, A. K. Bashir, A. Peshkar, R. Sujatha, J. M. Chatterjee et al., “COVID-19 patient health prediction using boosted random forest algorithm,” Frontiers in Public Health, vol. 8, no. 1, pp. 497, 2020. [Google Scholar]
6. K. B. Prakash, S. S. Imambi, M. Ismail, T. P. Kumar and Y. N. Pawan, “Analysis, prediction and evaluation of covid-19 datasets using machine learning algorithms,” International Journal of Emerging Trends in Engineering Research, vol. 8, no. 5, pp. 2199–2204, 2020. [Google Scholar]
7. M. Abdar, W. Książek, U. R. Acharya, R. S. Tan, V. Makarenkov et al., “A new machine learning technique for an accurate diagnosis of coronary artery disease,” Computer Methods and Programs in Biomedicine, vol. 179, no. 13, pp. 104992–105003, 2019. [Google Scholar]
8. M. E. Shipe, S. A. Deppen, F. Farjah and E. L. Grogan, “Developing prediction models for clinical use using logistic regression: An overview,” Journal of Thoracic Disease, vol. 11, no. S4, pp. S574–S584, 2019. [Google Scholar]
9. S. Uddin, A. Khan, M. E. Hossain and M. A. Moni, “Comparing different supervised machine learning algorithms for disease prediction,” BMC Medical Informatics and Decision Making, vol. 19, no. 1, pp. 1–16, 2019. [Google Scholar]
10. F. S. H. Souza, N. S. Hojo-Souza, E. B. Santos, C. M. Silva and D. L. Guidoni, “Predicting the disease outcome in covid-19 positive patients through machine learning: A retrospective cohort study with brazilian data,” MedRxiv, 2020. [Online]. Available: https://www.medrxiv.org/content/10.1101/2020.06.26.20140764v1. [Google Scholar]
11. R. Sujatha, J. M. Chatterjee and A. E. Hassanien, “A machine learning forecasting model for COVID-19 pandemic in India,” Stochastic Environmental Research and Risk Assessment, vol. 34, no. 7, pp. 959–972, 2020. [Google Scholar]
12. S. Dhamodharavadhani, R. Rathipriya and J. M. Chatterjee, “Covid-19 mortality rate prediction for India using statistical neural network models,” Frontiers in Public Health, vol. 8, no. 1, pp. 441–453, 2020. [Google Scholar]
13. E. Ong, M. U. Wong, A. Huffman and Y. He, “COVID-19 coronavirus vaccine design using reverse vaccinology and machine learning,” Frontiers in Immunology, vol. 11, no. 1, pp. 1–13, 2020. [Google Scholar]
14. P. Sv, J. Tandon and H. Hinduja, “Indian citizen’s perspective about side effects of COVID-19 vaccine-A machine learning study,” Diabetes & Metabolic Syndrome: Clinical Research & Reviews, vol. 15, no. 4, pp. 1–5, 2021. [Google Scholar]
15. O. Shahid, M. Nasajpour, S. Pouriyeh, R. M. Parizi, M. Han et al., “Machine learning research towards combating COVID-19: Virus detection, spread prevention, and medical assistance,” Journal of Biomedical Informatics, vol. 117, pp. 1–17, 2021. [Google Scholar]
16. S. Swaminathan, “Logistic regression—Detailed overview,” Towards Data Science, 2018. [Online]. Available: https://towardsdatascience.com/logistic-regression-detailed-overview-46c4da4303bc. [Google Scholar]
17. A. Kumar, “The ultimate guide to AdaBoost algorithm | What is AdaBoost algorithm?,” Great Learning, 2020. [Online]. Available: https://www.mygreatlearning.com/blog/adaboost-algorithm/. [Google Scholar]
18. Anon, “Random forest algorithm,” Java T Point, 2018. [Online]. Available: https://www.javatpoint.com/machine-learning-random-forest-algorithm. [Google Scholar]
19. Anon, “Decision tree classification algorithm,” Java T Point, 2018. [Online]. Available: https://www.javatpoint.com/machine-learning-decision-tree-classification-algorithm. [Google Scholar]
20. USA Govt, “Vaccine Adverse Event Reporting System (VAERS2021. [Online]. Available: https://vaers.hhs.gov/data/datasets.html. [Google Scholar]
 | This work is licensed under a Creative Commons Attribution 4.0 International License, which permits unrestricted use, distribution, and reproduction in any medium, provided the original work is properly cited. |