DOI:10.32604/iasc.2022.019133
| Intelligent Automation & Soft Computing DOI:10.32604/iasc.2022.019133 | |
| Article |
Heart Failure Patient Survival Analysis with Multi Kernel Support Vector Machine
1School of Information Technology & Engineering, Vellore Institute of Technology, Vellore, 632014, India
2Lord Buddha Education Foundation & Scientific Research Group in Egypt (SRGE), Kathmandu, 44600, Nepal
3School of Computer Science and Engineering SCE, Taylors University, Slangor, 47500, Malaysia
4Material Science Research Institute, King Addulaziz City for Science and Technology (KACST), Riyad, 6086, Kingdom of Saudi Arabia
5General Administration of Research and Development Laboratories, King Abdulaziz City for Science and Technology (KACST), Riyad, 6086, Kingdom of Saudi Arabia
*Corresponding Author: Zahrah A. Almusaylim. Email: zalmusaylim@kacst.edu.sa
Received: 03 April 2021; Accepted: 05 May 2021
Abstract: Heart failure (HF) is an intercontinental pandemic influencing in any event 26 million individuals globally and is expanding in commonness. HF healthiness consumptions are extensive and will increment significantly with a maturing populace. As per the World Health Organization (WHO), Cardiovascular diseases (CVDs) are the major reason for all-inclusive death, taking an expected 17.9 million lives per year. CVDs are a class of issues of the heart, blood vessels and include coronary heart sickness, cerebrovascular illness, rheumatic heart malady, and various other conditions. In the medical care industry, a lot of information is as often as possible created. Nonetheless, it is frequently not utilized adequately. The information shows that the produced picture, sound, text, or record has some shrouded designs and their connections. Devices used to remove information from these data sets for clinical determination of illness or different reasons for existing are more uncommon. 4 cases out of 5 CVD dying are due to heart attacks and strokes, 33% of these losses of life happen roughly in peoples under 70 year of age. In the current work, we have tried to predict the survival chances of HF sufferers using methods such as attribute selection (scoring method) & classifiers (machine learning). The scoring methods (SM) used here are the Gini Index, Information Gain, and Gain Ratio. Correlation-based feature selection (CFS) with the best first search (BFS) strategy for best attribute selection (AS). We have used multi-kernel support vector machine (MK-SVM) classifiers such as Linear, Polynomial, radial base function (RBF), Sigmoid. The classification accuracy (CA) we received using SM is as follows: SVM (Linear with 80.3%, Polynomial with 86.6%, RBF with 83.6%, Sigmoid with 82.3%) and by using CFS-BFS method are as follows: SVM (Linear with 79.9%, Polynomial with 83.3%, RBF and Sigmoid with 83.6%).
Keywords: Heart Failure (HF); Cardiovascular diseases (CVD); Scoring method (SM); Correlation-Based Feature Selection (CFS); Best First Search (BFS); MK-SVM; Classification accuracy (CA); Classifiers
Healthcare monitoring frameworks include preparing and investigating information recovered from smartphones, watches, wristbands, just as different sensors and wearable gadgets. Such frameworks empower persistent observing of patient’s mental and medical issue by detecting and sending estimations, for example, pulse, electrocardiogram, internal heat level, respiratory rate, chest sounds, or circulatory strain. Heart failure (HF) is a medically complex disease. HF, otherwise known as congestive HF or congestive cardiac failure, is where the heart cannot pump sufficiently to keep up the circulation system to address the body’s tissues. Conditions depict it, for instance, shortness of breath, etc., that may be joined by signs, for example, aspiratory snaps, & periphery edema, realized by assistant & furthermore useful heart or non-cardiovascular inconsistencies. HF is a certified concern related to high demise rates. As demonstrated by the European Society of Cardiology (ESC), twenty-six thousand adults exhaustively are resolved to have HF, while three thousand six hundred are as of late investigated per year. 17%–45% of the persons encountering HF pass on inside the fundamental years and the remainder of the failure miserably inside 5 yr. The board prices related to HF are approximately 1%–2% of every human help utilization, with an enormous segment of them associated with redundant emergency center affirmations [1]. Extended regularity, increasing costs for human administration, rehabilitated hospitalizations, reduced quality of life (QoL), and premature death have transformed HF into a global scourge. Include the necessity for premature assurance (revelation of the closeness of HF & approximation of its earnestness) & appropriate treatment. A clinical investigation, including physical appraisal, is reinforced by subordinate tests, for instance, blood tests, chest radiography, electrocardiography (ECG) & echocardiography (echo) [2].
There are past models of risk for HF sufferers [3]. Every use of a single patient partner and, therefore, their generalizability to specific populations is sketchy. The development of each model is of a restricted partner scale, recognizing the need to gauge the concept of effective risk estimation truly. Likewise, most models are restricted to individuals with reduced left-ventricular ejection (EF) fractions, thus debating numerous HF sufferers with rescued EF. The Global Meta-Analysis Global Group in Chronic HF (MAGGIC) offers a massive opportunity to create a prognostic model in HF patients with reduced and assured EF [4]. With more than 10 million ECGs per year in Medicare patients alone, ECG is essential for demonstrating cardiology [5]. From these image details, cardiologists usually evaluate some estimates to appear at a final clinical understanding, given the section characteristics of a patient & many clinical histories. This clinical understanding helps in assessing, conceiving tenacious outcomes, and eventually supervising supporting decisions. With the expanding proportion of obtained picture information & estimations from the photos, individuals may not now choose to decode this information near the rapidly developing proportion of electronic health record (EHR) information.
E.g., at our establishment, there are more than 500 estimates obtained from the echo. Each echo consists of millions of pictures, and there is 76 International Classification of Diseases, Tenth Revision (ICD-10), significant level indicative codes falling within the class of “circulatory system disorders”. With this information measure & the restricted time available to doctors for translation, the full potential of echo information is not recognized in flow clinical practice.
Machine learning (ML) can help solve these hurdles by providing automated analysis of large clinical datasets [6]. Believe it or not, ML has been bit by bit infiltrating into cardiovascular investigation starting at now, with late models in the composing demonstrating its ability to do the going with 1) outfit help with testing differential examinations, for instance, restrictive cardiomyopathy vs. constrictive pericarditis [7] & physiological versus fanatical cardiovascular hypertrophy [8]; 2) consistency of the coronary tomography data [9]; 3) predict the fatality of in-crisis facilities in patients with a treatment program for stomach aortic aneurysm [10]; & 4) make specific groupings or ‘phenotypes’ of patients with cardiovascular failure and protected ejection fraction [11]. These examinations exhibited the assurance of ML in cardiovascular prescription. In any case, test sizes in these tests are typically limited for ML to take from various features, especially given the propensity to overfit small data sets [12]. Likewise, a huge segment of these studies probably used wide and full data sets obtained, which might not reflect brief therapeutic applications that would be possible with EHR data.
Recently, there has been no move to use ML to exploit traditional clinical & echo data to help specialists anticipate bringing about the large populations of patients experiencing echo during daily clinical thinking. We believed that nonlinear ML techniques would have superior accuracy over differentiated and direct mortality models that utilizing all estimations got from routine echo would outfit unparalleled desire exactness differentiated & standard clinical data (checking fundamental clinical danger scores [13]) & specialist itemized left ventricular ejection fraction (LVEF).
The main contributions of this paper are:
• In the proposed work, we are using two feature selection methods, namely correlation-based and ranking-based methods.
• In the correlation-based method, we apply the Correlation-based feature selection (CFS) for selecting the best features and in the ranking-based method we have used Information Gain, Gain Ration & Gini Index for selecting the best features.
• In both the cases after feature selection, we applied MK-SVM classifiers to predict the patient’s survival, and rank the features corresponding to the most critical risk factors.
• The decision of treatment based on the patient’s condition could be substantiated with this system’s guidance.
The rest of the artifact is structured as follows: Section 2 depicts the existing works on this area. The proposed approach is detailed in Section 3 along with feature selection and other ML methods used here. Section 4 presents the dataset in detail. Section 5 presents the MK-SVM in detail. Section 6 presents the performance analysis in detail and the conclusion of the present work is discussed in Section 7 along with the future scope.
We have reviewed some of the existing works in this area as evaluated the exhibition of SHFM utilizing EHRs at Mayo Clinic and tried to build up a hazard forecast model utilizing ML procedures that apply routine clinical consideration information. Tripoliti et al. [14] meant to introduce the best in a class of the AI philosophies applied to evaluate cardiovascular breakdown. Hsich et al. [15] discussed the estimation of a natural, vigorous way to deal with variable selection, random survival forests (RSF), is an enormous clinical associate. Austin et al. [16] thought about presenting present-day grouping and regression techniques with order and regression trees to characterize patients with HF into one of two unrelated classes (HFPEF Vs. HFREF) to foresee the likelihood of the nearness of HFPEF. Samad et al. [17] presented a prescient report indicating how AI could help distinguish patients at the most elevated hazard for mortality and recognize the most significant variables identified with this raised hazard. Kalscheur et al. [18] tried to utilize an ML calculation to build up a model to anticipate results after CRT. Taslimitehrani et al. [19] suggested to use a grouping calculation, Contrast Pattern Aided Logistic Regression (CPXR(Log)) with the probabilistic misfortune function, to create & approve prognostic hazard models to anticipate 1, 2, & multiyear survival in HF utilizing information from EHRs at Mayo Clinic. Venkatesh et al. [20] tried the capacity of RSF, an ML method, to anticipate 6 cardiovascular results in contrast with standard cardiovascular hazard scores. Chicco et al. [21] investigate a dataset of 299 ill persons with HF gathered in 2015 and applied a few ML methods to both foresee the patient’s survival & rank the features relating to the maximum significant hazard characteristics. Kwon et al. [22] planned to create and approve a deep-learning-utilized acute HF (DAHF) algorithm for foreseeing mortality. Miao et al. [23] built up an extensive risk model for anticipating HF mortality with a significant stage of exactness utilizing an improved random survival forest (iRSF). Guidi et al. [24] introduced a clinical decision support system (CDSS) for the investigation of HF ill persons, giving different yields, for example, an HF seriousness assessment, HF-type forecast, just as an administration interface that looks at the changed patients’ subsequent meet-ups. Alashban et al. [25] expected to characterize blood glucose levels for CHD risk agents utilizing the exceptionally disproportionate Framingham Heart Study dataset & to distinguish an appropriate dietary arrangement that lessens the risk of creating CHD. Vankara et al. [26] tried to depict a novice ensemble learning technique that empowers high heart disease forecast precision with negligible erroneous reporting. Jiang et al. [27] worked on a three-tiered investigation by incorporating transcriptional information & pathway data to investigate HF’s shared characteristics from various aetiologies. Wang et al. [28] showed that LV diastolic dyssynchrony (diastolic LVMD) boundaries have important prognostic qualities for DCM patients. Nascimento et al. [29] surveyed how four non-morphological feature selection techniques gave valuable ECG characterization and suggested an advancement in the arrangement of the structural co-occurrence matrix (SCM) by including it with the Fourier transform to remove the principal frequencies of the sign. As per [30], CVDs are the major reason for deaths globally than any other disease. Finding out the chances of CVD in a very early stage is most important and increases the patient survival rate. And in this case, ML can perform an outstanding role, so, in the current work, we have tried to foresee the survival chances of HF patients using methods such as attribute selecting & ML. In Ishaq et al. [31], a successful and effective ML based procedure is recommended for the expectation of heart patients’ endurance. ML procedures incorporate LR, AdaBoost, RF, GBM, G-NB, SVM and SMOTE is applied to manage class awkwardness issue. The point of [32]’s investigation is to distinguish the best indicators of mortality among clinical, biochemical and progressed echocardiographic boundaries in acute heart failure (AHF) patients conceded to coronary care unit (CCU). The reason and curiosity of [33]’s investigation is to characterize another customized monitoring device abusing the time-varying meaning of drug adherence, inside a joint modeling approach.
To provide a practical system, the selection of attributes along with algorithms plays a vital role. The discussion of our work focused on two methods, with the set of ML algorithms. In the initial phase of both works, the entire dataset is taken into consideration. Following that set of attributes is selected based on their importance using two different approaches and ML algorithms. Fig. 1, illustrates the working of the HF prediction system.
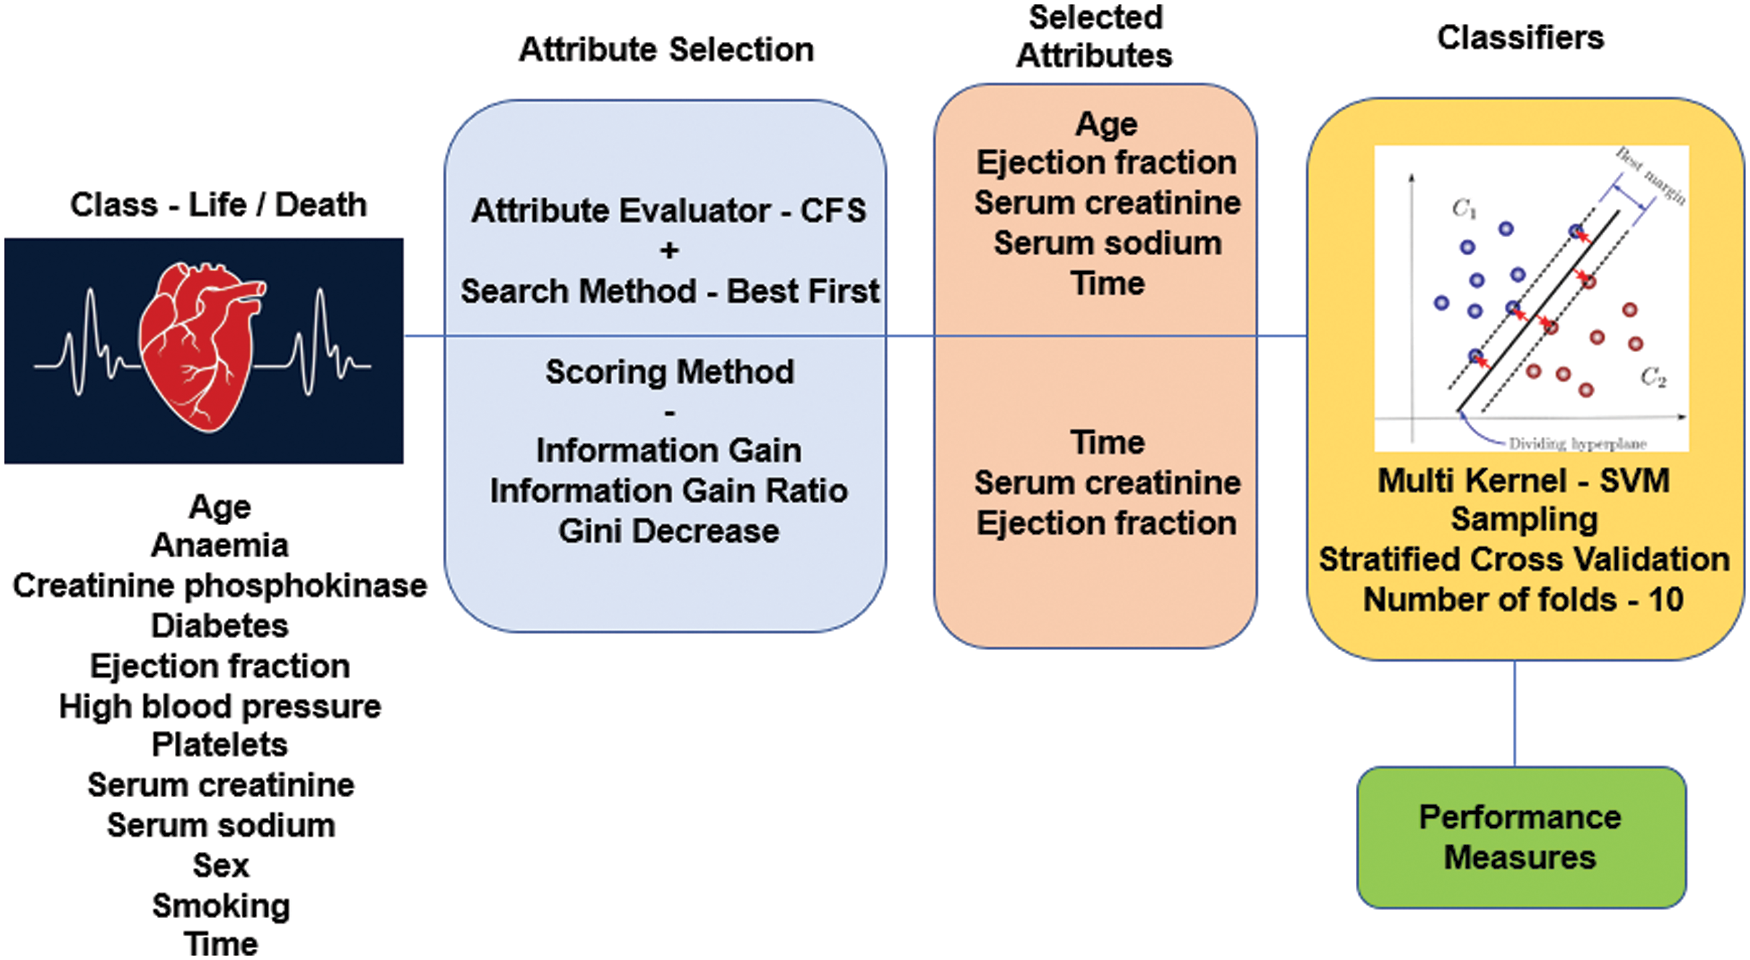
Figure 1: Working of HF prediction system
It is one of the main thoughts in ML, which tremendously influences the introduction of any model. One can utilize the information features to set up the ML models to sway the show one can achieve. Unimportant or not entirely appropriate features can oppositely influence model execution FS should be the first and most noteworthy development of any model organizing. FS is the place you like this or truly choose the features that devote most to the figure variable you are enthused about. Considering unimportant features in the data can diminish the models’ precision and cause your model to learn subject to superfluous features. Minimizes Overfitting: Less repetitive information implies less chance to settle on decisions dependent on the commotion.
• Enhances Accuracy: Less misleading information implies displaying exactness improves.
• Minimizes Training Time: less information focuses on lessening algorithmic complexities & trains algorithm quicker [34].
Multiple SMs available to make the best feature selection from the dependent variable. The score is meant to assess the worth of the feature based on the classification task. Usually, class labels’ values depend on the value of the features, and hence the feature selection process is too vital in deciding the performance of the entire system.
IG is also known as mutual information. It quantifies the decrease in entropy by parting a dataset as indicated by a given estimation of an arbitrary variable. It works fine for most cases, except if you have a couple of variables that have an enormous number of classes. IG is one-sided towards picking attributes with countless qualities as root nodes [35,36].
Here ‘p’ denotes probability, which is an entropy function in Eq. (1).
This is an alteration of IG that diminishes its predisposition and is generally the ideal alternative. GR beats IG by considering the number of branches that would result before doing the split. It adjusts IG by considering the inherent data of a split [37].
It is also known as Gini impurity, which computes the probability of a specific feature that is classified wrongly when selected arbitrarily. If every element is connected through a single class, it can be called pure distribution [38].
Here ‘Pi’ represents the probability of a feature being classified for a distinct class in Eq. (2).
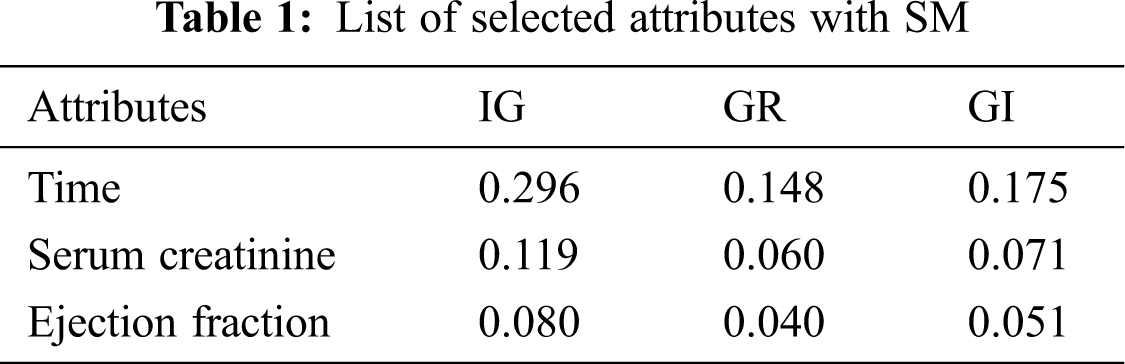
By applying the scoring methods, the best 2 attributes are selected to optimize the CA and training model in the HF prediction system. Tab. 1 provides the selected attributes with the values that show the importance of selection.
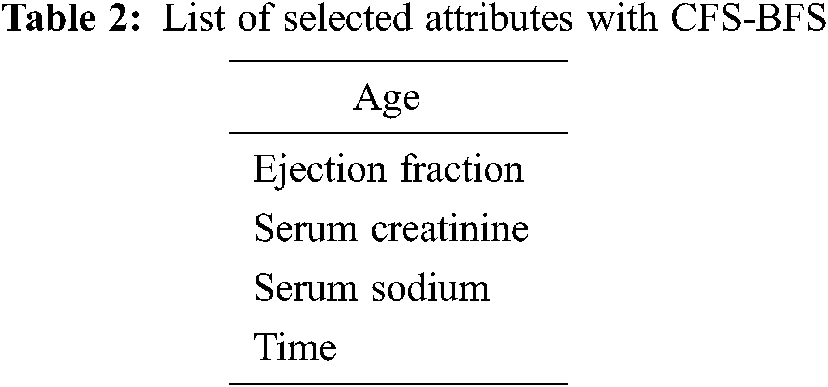
AS typically holds two parts having an attribute evaluator and search method. A central issue in ML recognizes a representative arrangement of features from which to construct a portrayal model for a particular task. CFS positions attribute, as shown by a heuristic evaluation work subject to relationships. The limit computes subsets made of trademark vectors that were related to the class mark, etc. The CFS procedure acknowledges that unessential features depict the estimation should neglect a low association with the class & in this way. Of course, excess features should be assessed, as they usually are determinedly related within any event, one of the various attributes. The standard utilized to study a subset of features could be imparted as follows: the appraisal of a subset of involving features is the typical relationship regarding features & class names & is the ordinary connection among two features [39]. Best first works on the principle of a greedy algorithm [40]. In this work, close search after five node expansions and the best subset found is 0.579 using full training set option and target as death event—the selected attributes with this process given in Tab. 2.
HF clinical record dataset considered for our ML work is the benchmark dataset available in the UCI ML repository [41]. The primary dataset is populated in the year 2017 from Government College University, Faisalabad, Pakistan by Tanvir Ahmad et al. and recently in the year January 2020, it is updated by Davide Chicco of Krembil Research Institute, Toronto, Canada. 13 clinical features are considered out of which 12 tries to map to the class label death event. The number of instances is 299 and life-related dataset without missing values. The twelve feature value acts as the deciding factor of the deceased in case of HF condition.
• Age – Mentioned in Years
• Anemia – Hemoglobin deficiency indicated in Boolean
• High Blood Pressure – Hypertension indicated in Boolean
• Creatinine Phosphokinase (CPK) – Enzyme level in blood given in mcg/L
• Diabetes – Presence of blood sugar indicated in Boolean
• Ejection Fraction – % of blood leaving at each contraction measured in percentage
• Platelets – number of blood cells that help in clot expressed in kiloplatelets/mL
• Sex – Woman/Man indicated in Binary
• Serum Creatinine – Indication about renal blood flow indicated in mg/dL
• Serum Sodium – The level of blood sodium in m Eq/L
• Smoking – Sufferer is smoker or non-smoker in Boolean
• Time – Check out period provided in Days
• Death Event – Patient deceased in between the checkout period indicted in Boolean and act as a class label.
The values of each feature help in mapping the patient who is prone to death or not. This data acts as a great aid to take the necessary action in the subsequent diagnosis of the different patients with similar symptoms. The medical field intervened with the data analysis, and treatment rendering has enormous potential. The way of handling the vast existing data and applying suitable algorithms with the feature selection approach makes the system highly reliable in exhibiting good performance measures.
4 The Multi-Kernel Support Vector Machine (MK-SVM)
Different sets of attributes are received from two different approaches in the Tabs. 1 and 2 are applied to the SVM for training purposes. Sampling with a 10-fold stratified cross-validation method is utilized in the training phase. An SVM is a supervised AI model that utilizes order calculations for two-bunch grouping issues. In the wake of giving an SVM model arrangement of named preparing information for every class, they’re ready to classify new content [42].
The SVM computation’s main goal is to figure out a hyperplane in an N-dimensional area (N — the number of features), which unquestionably groups the data [43]. SVM calculations utilize a bunch of numerical functions that are characterized as the kernel. The kernel can accept information as information and change it into the necessary structure. Distinctive SVM calculations utilize various sorts of piece functions. These functions can be of various sorts. Here we have considered SVM kernels, namely linear, nonlinear, polynomial, RBF, and sigmoid.
It is utilized for data that can be separated in a linear fashion, which is defined as data that can be divided into two groups using only a single straight line. It aims to increase this margin as much as possible in order to improve its generalization potential.
The linear function is defined as the dot product of 2 vectors z1 & z2 as in Eq. (3):
It’s a more generalized linear kernel representation.
A polynomial kernel is defined as:
where e is the degree of the polynomial and vectors z1 & z2 in Eq. (4).
Gaussian is one such kernel giving good linear separation in higher dimensions for many nonlinear problems.
where, α > 0 & α = 1/2σ2 in Eq. (5).
The parameter that you can adjust Sigma has a significant impact on the kernel’s efficiency and should be fine-tuned to the specific problem at hand. When the exponential is overestimated, it behaves almost linearly, and the higher-dimensional projection loses its non-linear power. On the other hand, if the feature is undervalued, it will lack regularization, and the decision boundary will be extremely sensitive to noise in the training data. The value of its function is determined by the distance from the origin or from a specific point.
This kernel uses the tanh function. This can be used as a proxy for a neural network shown in Eq. (6).
where α is the slope & d is the intercept constant. A common value for α is 1/N, where N is the data dimension. Function is analogous to a 2-layer perceptron neural network model, which is used as an artificial neuron activation function.
ML tasks of characterization proficiency demonstrated with the assistance of boundaries like True Positive (TP), True Negative (TN), False Positive (FP) & False Negative (FN). These qualities go about as a spine in measuring the model’s characterization. The referenced 4 boundaries are the piece of the arrangement dataset. PC with 8 GB RAM was utilized for the test reason utilizing Orange data mining software. Eqs. (7–10) provides a way of computing the metrics to illustrate the classifier working.
A confusion matrix is the matrix format that represents achieving the target compared to actual and predicted values. In Fig. 2, 240 instances are correctly classified in the Linear SVM model, and 59 instances are misclassified. Polynomial SVM, as shown in Fig. 3, has 259 correctly and 40 misclassified instances. Similarly, in Fig. 4, RBF SVM 250 instances are correctly classified, whereas 49 misclassified instances are there. In Fig. 5, Sigmoid SVM, 246 instances are correctly classified, but 53 instances are wrongly classified.
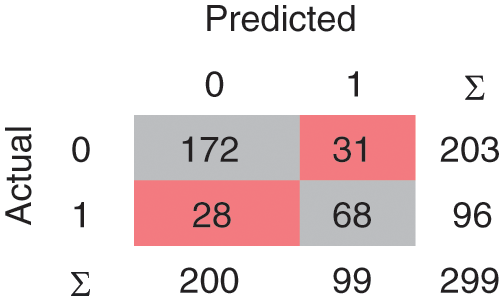
Figure 2: CM of SVM-Linear
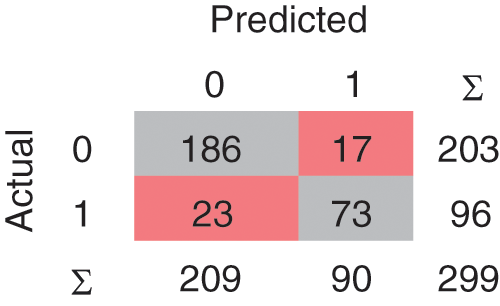
Figure 3: CM of SVM-Polynomial
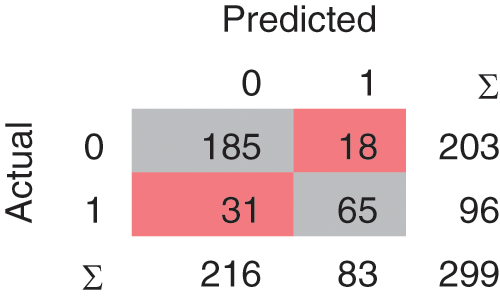
Figure 4: CM of SVM-RBF
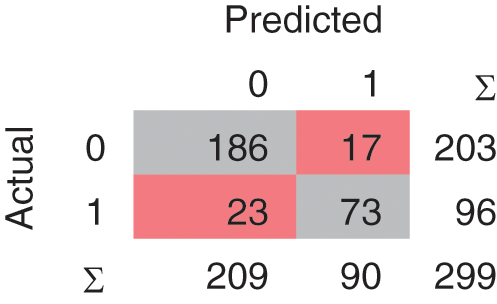
Figure 5: CM of SVM-Sigmoid
ROC curves, which map sensitivity as a function of specificity for all limits imaginable, demonstrate a classifier’s trade-off among true positives and false negatives. For a given specificity value, a higher sensitivity value implies higher performance. The region under the ROC curve (AUC) is a widely used metric for determining a classifier’s perfectness. Sensitivity is the term that provides insight into the number of actual positive cases predicted by the model correctly. Other names are recall and true positive rate.
On the other hand, specificity is the number of times the model predicts the actual negative cases perfectly. In the SM feature selection system, the AUC of SVM-RBF is highest than the other methods as per the ROC curve discussion point of view. Fig. 6. Represents the ROC curve for the SM with various classification approaches.

Figure 6: ROC Plot – Scoring Method (SM)
5.2 Evaluation Results in CFS-BFS
In the Linear SVM model, as shown in Fig. 7, 239 instances are correctly classified and 60 instances are misclassified. The Polynomial SVM model as shown in Fig. 8, have 249 correctly classified instances followed by 50 misclassifications. Similarly, in Fig. 9, SVM RBF has 250 correct classified instances followed by 49 misclassified instances and in Fig. 10, Sigmoid SVM 250 instances are correctly classified with 49 misclassified cases.
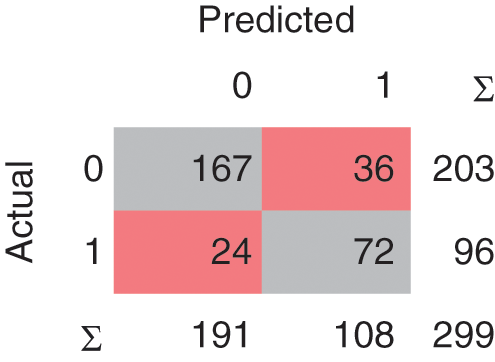
Figure 7: CM of SVM-Linear
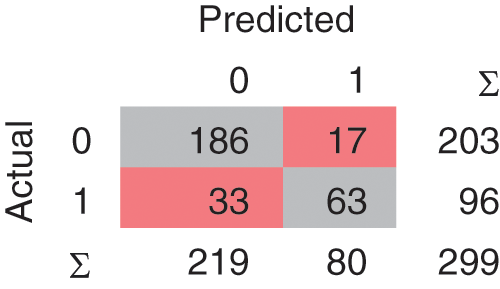
Figure 8: CM of SVM-Polynomial

Figure 9: CM of SVM-RBF
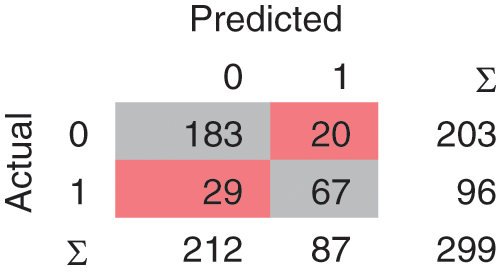
Figure 10: CM of SVM-Sigmoid
In the CFS – BFS method, the AUC of NB is highest than that of other methods used as per the ROC curve discussion point of view. Fig. 11, represents the ROC curve for the CFS-BFS with various classification approaches. In the CFS-BFS feature selection system, the AUC of SVM-RBF is highest than the other methods per the ROC curve discussion point of view.
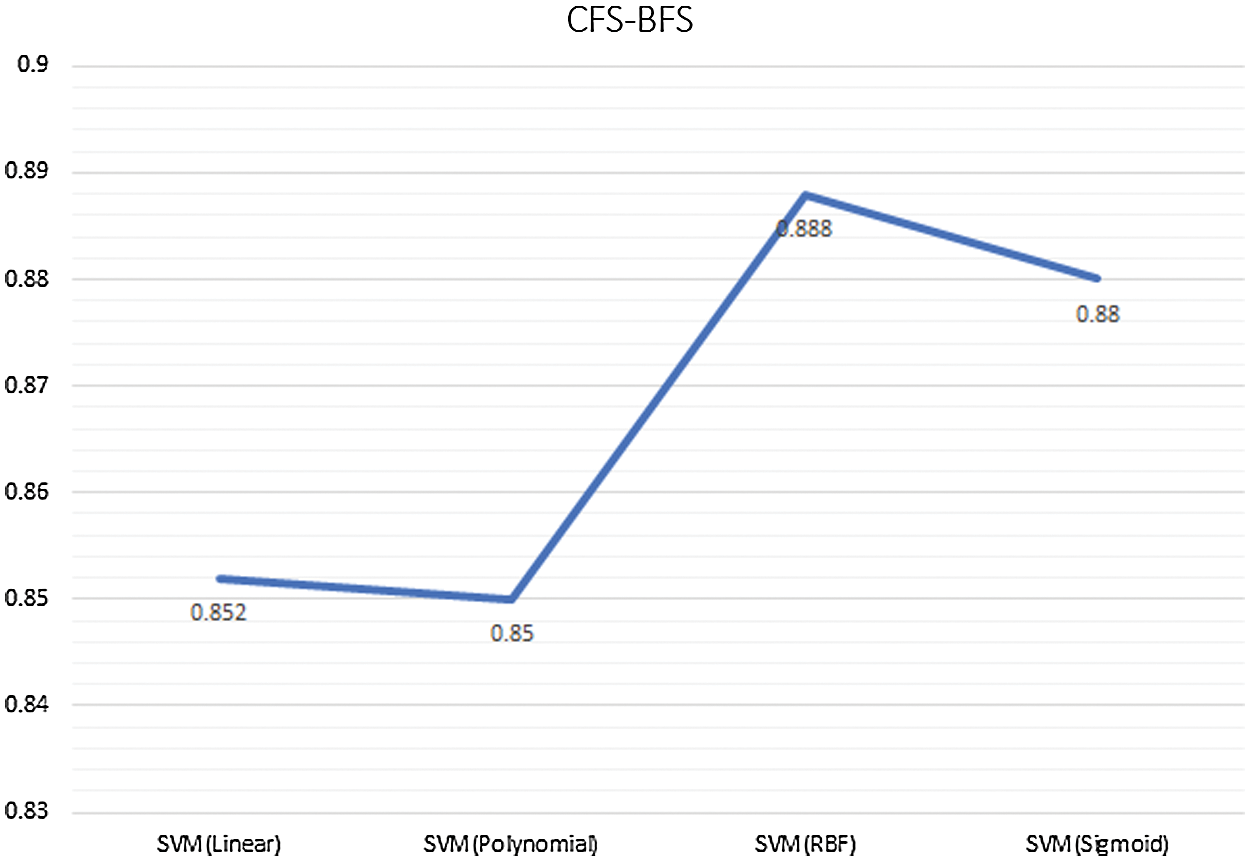
Figure 11: ROC Plot – CFS - BFS Method
5.3 Comparison of SM and CFS-BFS with MK-SVM
Comparing both the AS with the classifier models, as mentioned in Tab. 3, provides the insight that SM is showing good accuracy results. In the case of SM, the classifier model SVM (RBF & Sigmoid) gives good accuracy, and in the case of CFS-BFS SVM Polynomial so overall, the SVM method is advisable. Based on the dataset and approaches used, the results are varying. Fig. 12, presents the CA comparison between SM & CFS-BFS methods.
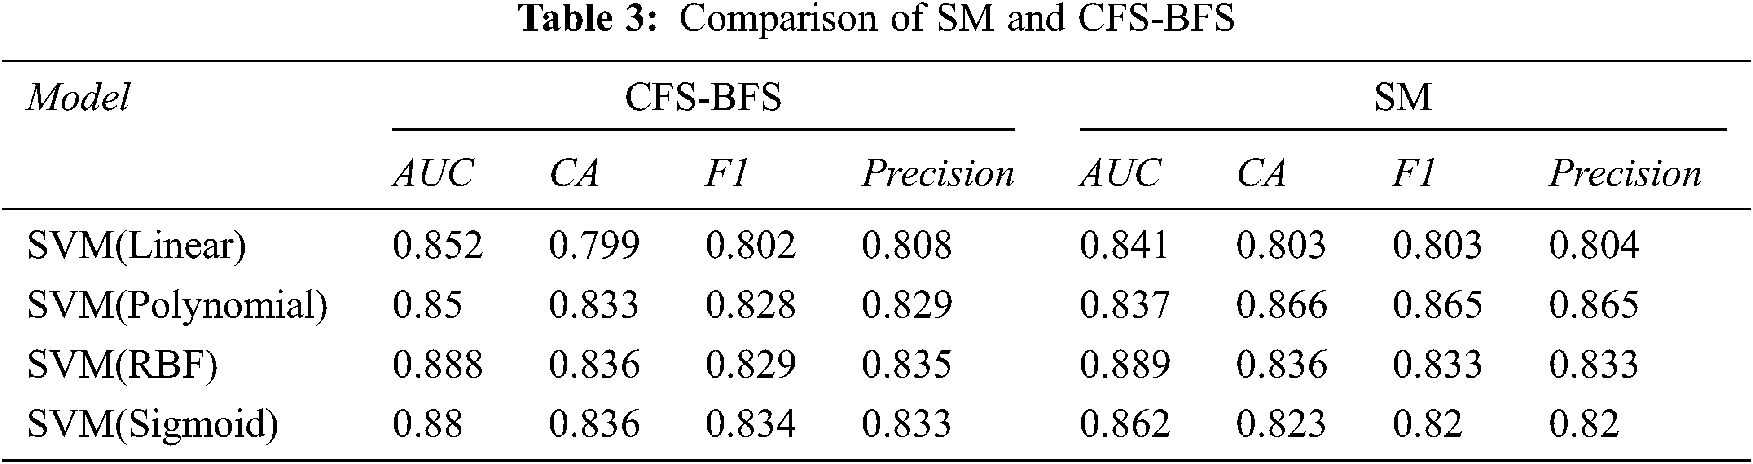
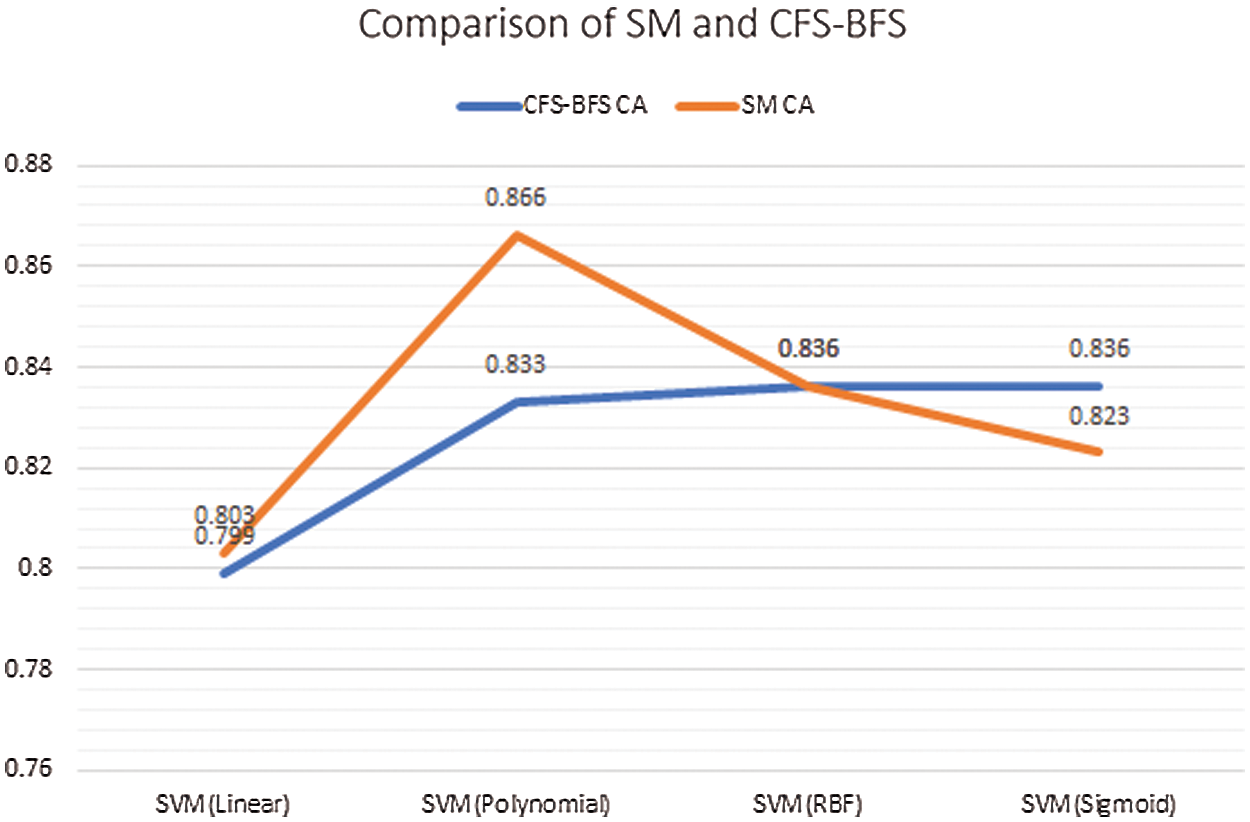
Figure 12: Comparison between SM & CFS-BFS based on CA
In common ML intervening, health care helps provide the earlier indication of the patient’s criticality. Various parameters are responsible for the illness, and the present lifestyle and eating habits greatly impact people’s health conditions. Selecting the attributes that provide the perfect decision-making is the need of an hour. Prediction of the HF by cumulating various related parameters with expert knowledge is a common perspective in the healthcare industry. To make accurate decision making in the presence of the few parameters followed by applying the ML is the hybrid method that builds the system. The mortality rate is high due to HF and we need accurate systems that can tell these in an earlier phase. In this work, we hybridized the ML with two types of AS approaches. In the first approach, an SM combination of IG, GR & GI is used. In the second approach, CFS with BFS is utilized. The selected attributes from each process are applied to MK-SVM (linear, polynomial, RBF, sigmoid). Based on the results received from our experimentation, we can state that SM methods are best while predicting HF than multi CFS-BFS methods. As future work, we plan to use a bio-inspired feature selection process and deep learning to get optimized results. Concentrating more on the parameters and discussion with medical experts will provide more insight into the collected data structure. Basic awareness about the food and lifestyle will help to reduce death due to HF. Avoiding fast food, smoking, alcohol, and maintaining a peaceful mind will be added to social messages that reduce the casualty.
Acknowledgement: We would like to thank the Prince Sattam Bin Abdulaziz University, Alkharj, Saudi.
Funding Statement: The authors received no specific funding for this study.
Conflicts of Interest: The authors declare that they have no conflicts of interest to report regarding this research work.
1. P. Ponikowski, A. A. Voors, S. D. Anker, H. Bueno, J. G. F. Cleland et al., “2016 ESC Guidelines for the diagnosis and treatment of acute and chronic heart failure: The Task Force for the diagnosis and treatment of acute and chronic heart failure of the European Society of Cardiology (ESC) Developed with the special contribution of the Heart Failure Association (HFA) of the ESC,” European Heart Journal, vol. 37, no. 27, pp. 2129–2200, 2016. [Google Scholar]
2. C. S. Son, Y. N. Kim, H. S. Kim, H. S. Park and M. S. Kim, “Decision-making model for early diagnosis of congestive heart failure using rough set and decision tree approaches,” Journal of Biomedical Informatics, vol. 45, no. 5, pp. 999–1008, 2012. [Google Scholar]
3. C. M. O’ Connor, D. J. Whellan, D. Wojdyla, E. Leifer, R. M. Clare et al., “Factors related to morbidity and mortality in patients with chronic heart failure with systolic dysfunction: The HF-ACTION predictive risk score model,” Circulation: Heart Failure, vol. 5, no. 1, pp. 63–71, 2012. [Google Scholar]
4. S. J. Pocock, C. A. Ariti, J. J. McMurray, A. Maggioni, L. Køber et al., “Predicting survival in heart failure: a risk score based on 39 372 patients from 30 studies,” European Heart Journal, vol. 34, no. 19, pp. 1404–1413, 2013. [Google Scholar]
5. B. W. Andrus and H. G. Welch, “Medicare services provided by cardiologists in the United States: 1999-2008,” Circulation: Cardiovascular Quality and Outcomes, vol. 5, no. 1, pp. 31–36, 2012. [Google Scholar]
6. K. Shameer, K. W. Johnson, B. S. Glicksberg, J. T. Dudley and P. P. Sengupta, “Machine learning in cardiovascular medicine: are we there yet?,” Heart, vol. 104, no. 14, pp. 1156–1164, 2018. [Google Scholar]
7. P. P. Sengupta, Y. M. Huang, M. Bansal, A. Ashrafi, M. Fisher et al., “Cognitive machine-learning algorithm for cardiac imaging: A pilot study for differentiating constrictive pericarditis from restrictive cardiomyopathy,” Circulation: Cardiovascular Imaging, vol. 9, no. 6, pp. e004330, 2016. [Google Scholar]
8. S. Narula, K. Shameer, A. M. S. Omar, J. T. Dudley and P. P. Sengupta, “Machine-learning algorithms to automate morphological and functional assessments in 2D echocardiography,” Journal of the American College of Cardiology, vol. 68, no. 21, pp. 2287–2295, 2016. [Google Scholar]
9. M. Motwani, D. Dey, D. S. Berman, G. Germano, S. Achenbach et al., “Machine learning for prediction of all-cause mortality in patients with suspected coronary artery disease: A 5-year multicentre prospective registry analysis,” European Heart Journal, vol. 38, no. 7, pp. 500–507, 2017. [Google Scholar]
10. A. T. Monsalve, D. R. Fernandez, O. M. Alonso, A. S. Payá, J. C. Mackenzie et al., “Using machine learning methods for predicting in hospital mortality in patients undergoing open repair of abdominal aortic aneurysm,” Journal of Biomedical Informatics, vol. 62, pp. 195–201, 2016. [Google Scholar]
11. S. J. Shah, D. H. Katz, S. Selvaraj, M. A. Burke, C. W. Yancy et al., “Phenomapping for novel classification of heart failure with preserved ejection fraction,” Circulation, vol. 131, no. 3, pp. 269–279, 2015. [Google Scholar]
12. J. Lever, M. Krzywinski and N. Altman, “Points of significance: Model selection and overfitting,” Nature Methods, vol. 13, pp. 703–704, 2016. [Google Scholar]
13. D. C. Goff Jr, D. M. L. Jones, G. Bennett, S. Coady, R. B. D’Agostino et al., “2013 ACC/AHA guideline on the assessment of cardiovascular risk: A report of the American College of Cardiology/American Heart Association Task Force on Practice Guidelines,” Journal of the American College of Cardiology, vol. 63 (25 Part B), pp. 2935–2959, 2014. [Google Scholar]
14. E. E. Tripoliti, T. G. Papadopoulos, G. S. Karanasiou, K. K. Naka and D. I. Fotiadis, “Heart failure: diagnosis, severity estimation and prediction of adverse events through machine learning techniques,” Computational and Structural Biotechnology Journal, vol. 15, pp. 26–47, 2017. [Google Scholar]
15. E. Hsich, E. Z. Gorodeski, E. H. Blackstone, H. Ishwaran and M. S. Lauer, “Identifying important risk factors for survival in patient with systolic heart failure using random survival forests,” Circulation: Cardiovascular Quality and Outcomes, vol. 4, no. 1, pp. 39–45, 2011. [Google Scholar]
16. P. C. Austin, J. V. Tu, J. E. Ho, D. Levy and D. S. Lee, “Using methods from the data-mining and machine-learning literature for disease classification and prediction: A case study examining classification of heart failure subtypes,” Journal of Clinical Epidemiology, vol. 66, no. 4, pp. 398–407, 2013. [Google Scholar]
17. M. D. Samad, A. Ulloa, G. J. Wehner, L. Jing, D. Hartzel et al., “Predicting survival from large echocardiography and electronic health record datasets: Optimization with machine learning,” JACC: Cardiovascular Imaging, vol. 12, no. 4, pp. 681–689, 2019. [Google Scholar]
18. M. M. Kalscheur, R. T. Kipp, M. C. Tattersall, C. Mei, K. A. Buhr et al., “Machine learning algorithm predicts cardiac resynchronization therapy outcomes: Lessons from the COMPANION trial,” Circulation: Arrhythmia and Electrophysiology, vol. 11, no. 1, pp. e005499, 2018. [Google Scholar]
19. V. Taslimitehrani, G. Dong, N. L. Pereira, M. Panahiazar and J. Pathak, “Developing EHR-driven heart failure risk prediction models using CPXR (Log) with the probabilistic loss function,” Journal of Biomedical Informatics, vol. 60, pp. 260–269, 2016. [Google Scholar]
20. B. A. Venkatesh, X. Yang, C. O. Wu, K. Liu, W. G. Hundley et al., “Cardiovascular event prediction by machine learning: the multi-ethnic study of atherosclerosis,” Circulation Research, vol. 121, no. 9, pp. 1092–1101, 2017. [Google Scholar]
21. D. Chicco and G. Jurman, “Machine learning can predict survival of patients with heart failure from serum creatinine and ejection fraction alone,” BMC Medical Informatics and Decision Making, vol. 20, no. 1, pp. 16, 2020. [Google Scholar]
22. J. M. Kwon, K. H. Kim, K. H. Jeon, S. E. Lee, H. Y. Lee et al., “Artificial intelligence algorithm for predicting mortality of patients with acute heart failure,” PLoS One, vol. 14, no. 7, pp. e0219302, 2019. [Google Scholar]
23. F. Miao, Y. P. Cai, Y. X. Zhang, X. M. Fan and Y. Li, “Predictive modeling of hospital mortality for patients with heart failure by using an improved random survival forest,” IEEE Access, vol. 6, pp. 7244–7253, 2018. [Google Scholar]
24. G. Guidi, M. C. Pettenati, P. Melillo and E. Iadanza, “A machine learning system to improve heart failure patient assistance,” IEEE Journal of Biomedical and Health Informatics, vol. 18, no. 6, pp. 1750–1756, 2014. [Google Scholar]
25. M. Alashban and N. F. Abubacker, “Blood Glucose Classification to Identify a Dietary Plan for High-Risk Patients of Coronary Heart Disease Using Imbalanced Data Techniques,” in Computational Science and Technology. Singapore: Springer, pp. 445–455,2020. [Google Scholar]
26. J. Vankara and G. L. Devi, “PAELC: Predictive Analysis by Ensemble Learning and Classification heart disease detection using beat sound,” International Journal of Speech Technology, vol. 23, no. 1, pp. 31–43, 2020. [Google Scholar]
27. Z. Jiang, N. Guo and K. Hong, “A three-tiered integrative analysis of transcriptional data reveals the shared pathways related to heart failure from different aetiologies,” Journal of Cellular and Molecular Medicine, vol. 24, no. 16, pp. 9085–9096, 2020. [Google Scholar]
28. C. Wang, J. Shi, J. Ge, H. Tang, Z. He et al., “Left ventricular systolic and diastolic dyssynchrony to improve cardiac resynchronization therapy response in heart failure patients with dilated cardiomyopathy,” Journal of Nuclear Cardiology: Official Publication of the American Society of Nuclear Cardiology, vol. 13, pp. 1–14, 2020. [Google Scholar]
29. N. M. M. Nascimento, L. B. Marinho, S. A. Peixoto, J. P. V. Madeiro, V. H. C. Albuquerque et al., “Heart arrhythmia classification based on statistical moments and structural co-occurrence,” Circuits, Systems and Signal Processing, vol. 39, no. 2, pp. 631–650, 2020. [Google Scholar]
30. World Health Organization: WHO, “Cardiovascular diseases (CVDs),” 2017. [Online]. Available at: https://www.who.int/news-room/fact-sheets/detail/cardiovascular-diseases-(cvds)#:%7E:text=Key%20facts,to%20heart%20attack%20and%20stroke. [Accessed 14-Aug-2020]. [Google Scholar]
31. A. Ishaq, S. Sadiq, M. Umer, S. Ullah, S. Mirjalili et al., “Improving the prediction of heart failure patients’ survival using SMOTE and effective data mining techniques,” IEEE Access, vol. 9, pp. 39707–39716, 2021. [Google Scholar]
32. C. Sciaccaluga, G. E. Mandoli, C. Nannelli, F. Falciani, C. Rizzo et al., “Survival in acute heart failure in intensive cardiac care unit: A prospective study,” International Journal of Cardiovascular Imaging, vol. 37, pp. 1–9, 2021. [Google Scholar]
33. M. Spreafico and F. Ieva, “Dynamic monitoring of the effects of adherence to medication on survival in heart failure patients: A joint modeling approach exploiting time-varying covariates,” Biometrical Journal, vol. 63, no. 2, pp. 305–322, 2021. [Google Scholar]
34. R. Shaikh, “Feature Selection Techniques in Machine Learning with Python,” Medium, 2018.https://towardsdatascience.com/feature-selection-techniques-in-machine-learning-with-python-f24e7da3f36e, [Accessed 1-Jul-2020]. [Google Scholar]
35. J. Brownlee, “Information Gain and Mutual Information for Machine Learning,” Machine Learning Mastery, 2019.https://machinelearningmastery.com/information-gain-and-mutual-information/.[Accessed August 2020]. [Google Scholar]
36. Wikipedia contributors, “Information gain ratio,” Wikipedia, 2019.https://en.wikipedia.org/wiki/Information_gain_ratio.[Accessed 14-Aug-2020]. [Google Scholar]
37. Oraware, “Information Gain vs. Gain Ratio,” RapidMiner Community, 2015.https://community.rapidminer.com/discussion/30340/information-gain-vs-gain-ratio. [Accessed 5-Aug-2020]. [Google Scholar]
38. N. Tyagi, “Understanding the Gini Index and Information Gain in Decision Trees,” Medium, 2020.https://medium.com/analytics-steps/understanding-the-gini-index-and-information-gain-in-decision-trees-ab4720518ba8.[Accessed 5-Aug-2020]. [Google Scholar]
39. A. Wosiak and D. Zakrzewska, “Integrating correlation-based feature selection and clustering for improved cardiovascular disease diagnosis,” Complexity, vol. 2018, pp. 11 pages,Article ID 2520706,2018. [Google Scholar]
40. B. Patankar and V. Chavda, “Effect of feature selection using best first search on the performance of classification,” International Journal of Scientific Research in Science and Technology, vol. 2, no. 5, pp. 1–3, 2016. [Google Scholar]
41. UCI Machine Learning Repository: Heart failure clinical records Data Set,UCI Machine Learning Repository, 2020.https://archive.ics.uci.edu/ml/datasets/Heart+failure+clinical+records. [Accessed 5-Jul-2020]. [Google Scholar]
42. B. Stecanella, “Introduction to support vector machines,” Monkey Learn, 2020.https://monkeylearn.com/blog/introduction-to-support-vector-machines-svm/#:~:text=A%20support%20vector%20machine%20(SVM,able%20to%20categorize%20new%20text. [Accessed 15-Aug-2020]. [Google Scholar]
43. R. Gandhi, “Support Vector Machine — Introduction to Machine Learning Algorithms,” Medium, July 5 2018.https://towardsdatascience.com/support-vector-machine-introduction-to-machine-learning-algorithms-934a444fca47, [Accessed 1-Aug-2020]. [Google Scholar]
 | This work is licensed under a Creative Commons Attribution 4.0 International License, which permits unrestricted use, distribution, and reproduction in any medium, provided the original work is properly cited. |