DOI:10.32604/iasc.2022.021310
| Intelligent Automation & Soft Computing DOI:10.32604/iasc.2022.021310 | |
| Article |
Early Detection of Alzheimer’s Disease Using Graph Signal Processing and Deep Learning
Department of Electrical Engineering, Indian Institute of Technology, Delhi, 110016, India
*Corresponding Author: Himanshu Padole. Email: Himanshu.Pramod.Padole@ee.iitd.ac.in
Received: 29 June 2021; Accepted: 30 July 2021
Abstract: Many methods have been proposed in the literature for diagnosis of Alzheimer's disease (AD) in the early stages, among which the graph-based methods have been more popular, because of their capability to utilize the relational information among different brain regions. Here, we design a novel graph signal processing based integrated AD detection model using multimodal deep learning that simultaneously utilizes both the static and the dynamic brain connectivity based features extracted from resting-state fMRI (rs-fMRI) data to detect AD in the early stages. First, our earlier proposed state-space model (SSM) based graph connectivity dynamics characterization method is used to design a modified dynamic connectivity based AD detection model. After verifying its utility, this dynamic connectivity based model is integrated with our earlier designed static connectivity based AD detection model using the intermediate level integration approach of the multimodal deep learning, to construct our proposed integrated AD detection model. To verify the effectiveness of the designed AD detection models, the models are applied on the rs-fMRI data, extracted from ADNI dataset. Superior performance of our proposed AD diagnosis method corroborates its utility in AD detection application.
Keywords: Graph convolutional neural network; graph signal processing; multimodal deep learning; convolutional neural network; Alzheimer's disease; state-space model
Alzheimer's disease (AD) is a chronic neurological disease, causing degeneration of brain cells that results in memory loss and cognitive decline, and thereby hindering a person's independent functionality. It affects nearly 44 million people worldwide and is likely to affect 130 million people by the year 2050 [1]. In spite of the earnest efforts made to cure AD, currently available treatments are unable to cure it reliably. However, accurate diagnosis of mild cognitive impairment (MCI), the initial stage of AD, is quite helpful in combating the disease [2]. So, in this paper, we work on the challenge of early diagnosis of AD, which essentially helps in controlling this neurodegenerative disease.
For solving this early detection problem, many approaches have been proposed using different domains, e.g., machine learning [3–5], graph signal processing (GSP) [6–9], network science [10]. With the recent advancement in machine learning, and in particular, in deep learning, variety of solutions have been proposed for early diagnosis of AD using the machine learning methods. In [3], authors proposed a deep learning based multimodal stacked deep polynomial network (MM-SDPN) algorithm for early diagnosis of AD. The algorithm consists of two-stage SDPNs, wherein at the first stage, two separate SDPNs are trained to extract the features from magnetic resonance imaging (MRI) data and positron emission tomography (PET) data respectively, that are then fused and fed as input to another SDPN for the final classification purpose. In [4], authors designed a multimodal deep learning based AD detection model that combines multimodal neuroimaging and neuropsychological data. Two independent convolutional neural networks (CNN) are designed for extracting the features from MRI and PET data respectively, the results of which are then combined with the neuropsychological diagnosis for the final classification. In a similar work [5], Suk et al. proposed a deep Boltzmann machine (DBM) based AD detection model wherein the discriminating features are extracted from the multimodal neuroimaging data using DBM that are then used for training a support vector machine (SVM) classifier that acts as a final classifier. Although these machine learning based approaches provided satisfactory results in AD detection, their performance is fundamentally limited by their inability to extract the additional relational information among distinct brain regions. So, to overcome this limitation, in recent years, graph-based methods for early diagnosis of AD have become more popular, thanks to their capability to utilize the relational information among distinct brain regions [6,11,12]. In [6], Hu et al. developed a matched signal detection theory for signal lying on the graph structure and used the same for AD detection. They assumed the brain graph signal to be smooth on the associated graph and then applied a matched subspace detector for differentiating the MCI subjects from the normal controls (NC). In [7], authors constructed the functional connectivity network from functional MRI (fMRI) data using the correlation coefficients between time series of different brain parts. This correlation coefficient data, along with some other phenotypic data, is then used to train the deep autoencoder network model which classifies the NC and the MCI subjects. In [8], authors first extracted multiscale features from three different functional networks viz. static functional network, dynamic functional network and higher order functional network that are constructed using correlation coefficients and sliding time windows. The multiscale features thus extracted are then combined and reduced using LASSO feature selection method to train an SVM based classifier for early diagnosis of AD. Although the superior classification capabilities of the aforementioned graph based models demonstrated the applicability of the graph based approach in AD detection application, their performance is still limited by the use of conventional classifiers like SVM or standard neural networks that are not optimized for the signals lying on the graph structure. To overcome this limitation, Parisot et al. [9] proposed a semi-supervised AD classification model using a graph convolutional neural network (GCNN) classifier wherein the subject population is represented by a sparse graph constructed using neuroimaging-based feature vectors. However, this model lacks the generalization ability as the model needs to be trained from scratch, whenever it encounters a new subject. So, to circumvent the drawbacks associated with the existing AD detection methods, in this work, we design a novel integrated AD detection model using the concepts of GSP that exploits both the static and the dynamic graph connectivity based features extracted from resting-state fMRI (rs-fMRI) signal for diagnosis of AD at the early stages.
In the present age of data deluge, where the constraint of structural regularity required for the conventional signal processing is often violated, GSP grabbed serious attention, thanks to its capability to analyze and process the signals with the irregularly structured domains, e.g., sensor networks, biological networks. As far as the basics of graph signal processing are concerned, that involves extension of fundamental operations in the regular domain, e.g., shifting, frequency transformations, sampling to the graph domain [11–13]. In addition to these fundamental operations, many complex concepts in conventional signal processing, e.g., time-frequency analysis, convolutional neural networks, wavelet transform, are also being generalized to the graph domain, constituting the advanced GSP [14–17]. In contrast to the conventional signal processing based methods, the GSP based methods possess the unique capability of utilizing the extra relational information among different data points. Consequently, the GSP has been applied in variety of fields ranging from sensor networks [18], biological networks [6,19], machine learning [16,17] and image processing [20]. In our previous works [21,22], we designed an AD detection model using GSP wherein the highly discriminating features were extracted using the novel graph frequency based feature extraction method that were then classified using a properly designed GCNN classifier.
Although the conventional GSP approach has yielded excellent performance in various applications including the AD detection, it assumes the graph adjacency or the connectivity matrix to be static, i.e., time invariant. However, unlike the theoretical assumption of the static graph connectivity, in many practical applications, including brain imaging, the graph adjacency matrix often varies significantly over time [23,24]. Recently, the researchers working in the paradigm of time varying graph connectivity have discovered the alterations in the dynamics of brain graph connectivity [25–27] in case of AD, which makes it a plausible biomarker for early diagnosis of AD. So, to make use of the information present in the graph connectivity variation of a time varying graph for AD detection, in our previous work [28], we designed a dynamic connectivity based AD detection model wherein a novel state-space modelling (SSM) based method was proposed to characterize the time varying nature of the graph. In the present work, we first modify this basic dynamic connectivity based AD detection model wherein we design a more sophisticated deep neural network based classifier for classifying the SSM based features. Efficacy of the modified dynamic connectivity based AD detection model is then validated by applying it on the rs-fMRI data from the ADNI dataset [29]. Having verified the efficacy of both the static and the dynamic connectivity based AD detection models independently, we then integrate both of these models using multimodal deep learning [30,31], to exploit both the static and the dynamic connectivity features simultaneously to improve the AD detection performance further. We use the intermediate level integration approach [30] to combine the features and then train this integrated neural network using the rs-fMRI data used in the previous analysis. The integrated AD detection model outperforms the existing methods for early diagnosis of AD [4,7,8,32], in different classification performance measures, and thus corroborates its utility in AD detection.
The remaining of the paper is organized as follows. Section 2 consists of the brief description of Alzheimer's disease, followed by an overview of graph signal processing that would be helpful in appreciating our proposed work. Section 3 is devoted to our proposed GSP based integrated AD detection model wherein we integrate our previously proposed static connectivity based AD detection model with our modified dynamic connectivity based AD detection model using multimodal deep learning. Section 4 analyzes the performance of the proposed AD diagnosis models using rs-fMRI data from ADNI dataset and also compares it with that of the existing models for AD diagnosis. Section 5 presents the conclusions of the paper along with the directions for some interesting future work.
2 Basic Preliminaries and Related Work
This section briefly reviews the literature about Alzheimer's disease (AD) and the graph signal processing (GSP) that is required to appreciate the work presented in the subsequent sections.
2.1 Alzheimer's Disease Overview
Alzheimer's disease (AD) is a chronic, progressive neurological disease causing brain cells to waste away, leading to gradual loss of thinking capability, social and behavioral aptitude of the affected patient. With around 44 million affected people worldwide, AD causes fourth largest number of deaths just below the deaths caused by the heart-disease, cancer and the stroke [4]. Also, AD is one of the financially costliest diseases, thus increasing its severity further. As discussed earlier, in spite of serious efforts, currently existing medication cannot cure AD or reverse its progression. However, accurate diagnosis of mild cognitive impairment (MCI), the initial stage of AD, is found to be quite helpful in combating the disease or at least slowing the progression of the disease, making the early diagnosis of AD, far more important [2]. But diagnosis of AD in the early stages is quite challenging, as the pathological manifestation of AD initiates several years prior to any observable clinical symptom, and when the symptoms can be observed, considerable neurodegeneration has already happened [33]. So, various diagnosis methods have been proposed for early detection of AD, ranging from cerebrospinal fluid (CSF) examination, neuropsychological tests, genetic detection, to the analysis of neuroimaging data [4,34].
Although the pathogenesis of AD is not completely understood, it is commonly believed to be caused by: i) the extracellular Amyloid-β deposits called Amyloid plaque (known as Amyloid-β hypothesis), and ii) formation of neurofibrillary tangles caused by the abnormalities of tau protein (known as tau hypothesis), that cause damage and loss of neurons and synapses [4]. So, attempts have been made to exploit the abnormalities in the concentrations of Amyloid-β and tau proteins in CSF and use them as the biomarkers for early detection of AD [4,34]. As far as the use of Amyloid-β concentration as a disease biomarker is concerned, although it is one of the earliest disease indicators, it is not very reliable in disease prognosis as the concentration of Amyloid-β nearly saturates in the preclinical phase [34]. Although tau pathology is better in this aspect, measurement of both the Amyloid-β and the tau concentration in CSF, require the invasive examination methods like lumbar puncture and PET, thus limiting their applicability [34]. Apart from these CSF based methods, various clinical neuropsychological methods, e.g., mini-mental state examinations (MMSE), activity of daily living (ADL), clinical dementia rating (CDR), Weissler intelligence scale (WAS-RC), are also used by the clinicians for the auxiliary diagnosis of AD and determine its severity [4].
With the recent advancements in neuroimaging techniques, the neuroimaging based AD detection methods using different modalities like MRI, fMRI, PET, have gained significant attention [3–9]. As far as AD is concerned, synaptic dysfunction, is also believed to be one of the earliest disease indicators, and can be observed even before the abnormalities in Amyloid-β concentration occurs [34]. This synaptic dysfunction can be indirectly measured using two methods viz. FDG-PET (invasive method), and fMRI (non-invasive method). Along with the advantage of non-invasive measurement, fMRI is also readily available, thus making it a better choice for early detection of AD. So, owing to these advantages of fMRI, in recent years, different approaches and biomarkers for AD detection have been proposed in the literature using the analysis of fMRI data wherein the graph based analysis has been more popular, due to its advantages discussed earlier [6–9]. Hence, in this work, we design a graph signal processing based AD detection model using rs-fMRI data, more about which is explained in the following sections.
Graph signal processing (GSP) is an emerging field of signal processing that focusses on analysis and processing of datasets that have some relational information between its data samples, usually encoded using some connectivity metric. So, for an N point dataset
Exploiting the isomorphism in the above definition, a graph signal s is equivalently expressed using an N-dimensional vector (s1,s2,…,sN)T [11]. Graph Laplacian, an important attribute of graph
This notion of graph and the signal defined over it, lead to the development of two major approaches of graph signal processing that generalized the fundamental operations in regular domain like shifting, frequency transformation, sampling, to the graph domain [13]. In the first GSP approach [12], the graph Laplacian matrix L is used to define various operations in graph domain whereas the second GSP approach [11] employs the graph adjacency matrix A as its basic building block. Satisfactory performance of these conventional GSP approaches in various applications [13] though validated their utility, the performance of these conventional approaches is fundamentally limited by their underlined stationarity assumption which constrains the graph adjacency matrix to remain time invariant, with only graph signal values being allowed to vary. However, in contrast to this stationarity assumption, in many practical graph applications, adjacency matrix of a graph varies significantly over time [23]. But the stationarity constraint of the conventional GSP approaches restricts them from utilizing the information in the graph connectivity variation which indeed is quite beneficial in certain applications, e.g., brain disease detection [25,35,36].
To circumvent this issue, in recent years, various signal processing techniques have been applied to analyze the time varying graph [23,24]. As far as applications are concerned, many attempts have been made to capture and summarize the information in the graph connectivity variation of a time varying graph which is then employed in different practical applications, e.g., gamma ray radiation detection [24], AD detection [27], Schizophrenia detection [35]. In this work, we use the SSM based characterization of graph connectivity dynamics to construct our dynamic connectivity based AD detection model.
This section describes in detail the proposed GSP based integrated AD detection model that integrates both the static and the dynamic brain graph connectivity based AD detection models using multimodal deep learning technique. First, we describe in brief our previously proposed static connectivity based AD detection model [21,22]. Then we describe our novel dynamic connectivity based AD detection model, the preliminary version of which is presented in [28]. Finally, we explain our proposed integrated AD detection model wherein we combine the static and the dynamic graph connectivity based features extracted from the above models using the intermediate level integration approach.
3.1 Static Connectivity Based AD Detection Model
Here, we briefly discuss our previously proposed static graph connectivity based AD detection model [21,22] as the same would be used in the design of the proposed integrated model for early diagnosis of AD. The static connectivity based AD detection model includes:
1) Feature extraction using graph frequency analysis.
2) Classifier design using GCNN.
In this GSP based AD detection model, first, a novel graph frequency based hypothesis is proposed to extract the discriminating features from input fMRI signal. The extracted features are then used for training a GCNN classifier that labels the subjects as: normal control (NC) or MCI patient. The hypothesis of detecting AD using the graph frequency characteristics of brain signal is motivated by the results of two independently conducted neurological experiments. The first experiment [37] investigated the relation between task switching capabilities of the subjects and the corresponding graph frequency content. The study observed an almost linear relationship between the switch cost of subjects and their graph high frequency content. In the second experiment [38], the authors examined the task switching capabilities of the normal subjects, the subjects with MCI and the subjects with AD, by measuring their switch cost during some specified tasks and observed a higher switch cost in subjects with MCI or AD. So, by jointly analysing the conclusions of the above switching experiments, it can be inferred that the subjects with MCI or AD should possess larger graph high frequency content and thus leading to our hypothesis of employing the high graph frequency content of brain signal as a distinguishing feature for early diagnosis of AD. Having discussed the feature extraction part, we next explain the classifier design using GCNN.
The first step in the design of GCNN classifier is to represent the input rs-fMRI data in the form of a graph signal which in turn is represented by a matrix X ∈ RN×T, with N being the number of brain parcels and T denoting the time points in the input fMRI signal. In this analysis, MIST brain parcellation technique [39] was used to construct a graph of size N = 325 and T = 130. By construction, each column in the matrix X can be treated as a graph signal obtained at one of the T time points, which then can be labelled using the class label of X, i.e., NC or MCI. Having obtained the labelled graph signal, the next step in classifier design is the feature extraction for which the graph signal is passed through a graph-HPF as discussed in our feature extraction hypothesis. These filtered graph signals with their class labels are then used for training a GCNN. With this trained GCNN classifier at our disposal, to classify an unknown subject with a data matrix Y ∈ RN×T, the given matrix is first decomposed into T distinct graph signals, each of which is then labelled using the trained GCNN classifier (with network structure as shown in Fig. 1). Finally, the subject is labelled with a class having majority of graph signals belonging to it. Fig. 2 shows the block diagram of the proposed model for AD diagnosis.
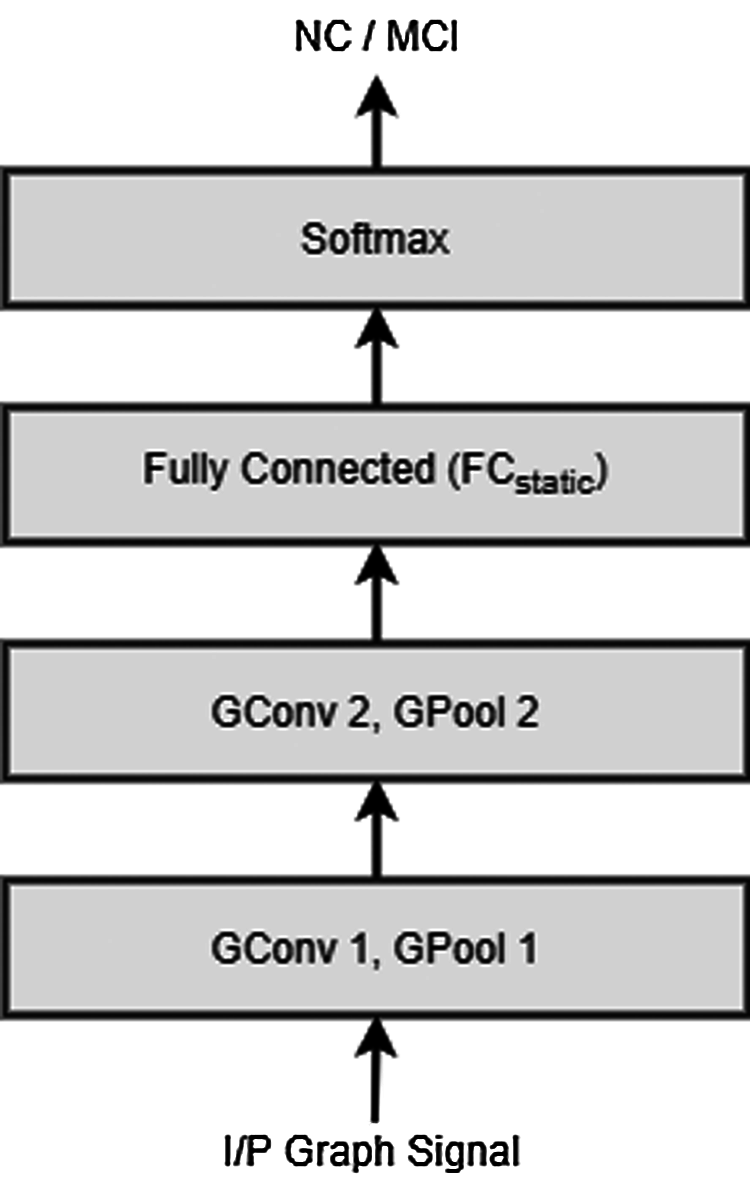
Figure 1: Network structure of the GCNN classifier extracting the static connectivity based features
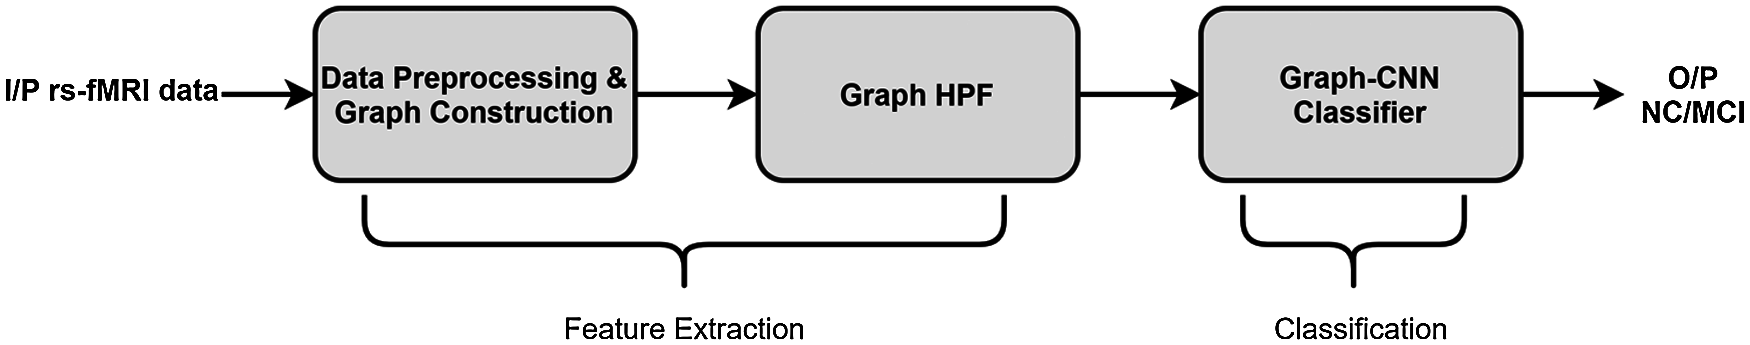
Figure 2: Block diagram of the static connectivity based AD detection model
3.2 Dynamic Connectivity Based AD Detection Model
Although the static connectivity based AD detection model discussed above performed well and provided superior classification performance, it assumed the graph adjacency matrix to be static, i.e., time-invariant. However, in many practical applications, including brain imaging, the underlying graph adjacency matrix undergoes a significant variation, as opposed to the graph stationarity assumption [23]. Also, contemporary research in the field of time evolving GSP has discovered the correlation between the alterations in graph connectivity variation and the AD, thus giving rise to a new disease indicator [25–27]. To utilize the information in the brain connectivity variation for AD detection, in our previous work [28], we proposed a novel SSM based method to characterize the alterations in the graph connectivity matrices and used it to design a dynamic connectivity model for early diagnosis of AD. In this work, we design a modified dynamic connectivity based AD diagnosis model wherein the discriminating features extracted using the SSM based method are classified using a properly designed convolutional neural network classifier to improve the model performance. Next, we explain our SSM based method for characterizing the dynamics of the graph connectivity matrices followed by our modified dynamic connectivity based AD diagnosis model that employs the SSM based graph variation characterization for the feature extraction purpose.
1) Characterization of Graph Connectivity Dynamics Using SSM:
The classical discrete time linear state-space model [40] is defined using the equations:
where xj∈ Rn and yj∈ Rmindicate the state vector and the observation, at time j, respectively, F ∈ Rn×n and H ∈ Rm×n indicate the state transition matrix and observation matrix repectively, while ujdenotes the process noise vector and vj denotes the measurement noise vector, at time j.
Now, in most of the practical GSP applications, the graph connectivity matrix often varies gradually, and can be modeled as a time evolving state vector. As far as the instantaneous connectivity matrix of a graph is concerned, the matrix depends on the graph signal value at that instant and hence can be transformed appropriately to predict the graph signal. So, a time evolving graph can be analysed using a state-space model which is formulated as below.
Consider a time varying N-vertex graph
with F representing the evolution of graph adjacency matrices and H modelling the relationship between graph adjacency matrix and the graph signal.
With instantaneous graph connectivities being represented as the states of the system, the state transition matrix F here, intrinsically encodes the variation in graph adjacency matrices. This matrix F, characterizing the graph connectivity variation, is employed in our proposed model for AD detection.
2) AD Diagnosis Using Graph Connectivity Dynamics:
As stated previously, AD or MCI can be identified using alterations in brain graph connectivity variation and the graph connectivity variation, in turn, is encoded by state transition matrix F of the SSM discussed above. Hence, in our proposed dynamic connectivity based AD detection model, the state transition matrix F is used as a discriminating feature for distinguishing between NC and the MCI patient. The construction of the proposed AD classifier is as follows.
For extracting the required discriminating feature, i.e., state transition matrix from the input rs-fMRI data, first, a graph having N vertices is constructed for every individual subject by applying the MIST brain parcellation method [39] on the corresponding data. The resulting time varying graph is then modelled using the SSM discussed above, to obtain a state transition matrix Fj corresponding to the subject j. These state transition matrices are then used as input to train a CNN classifier (with network structure as shown in Fig. 3) which distinguishes between NC and MCI patients using the associated state transition matrix. Fig. 4 depicts the block diagram of the dynamic connectivity based AD diagnosis model.
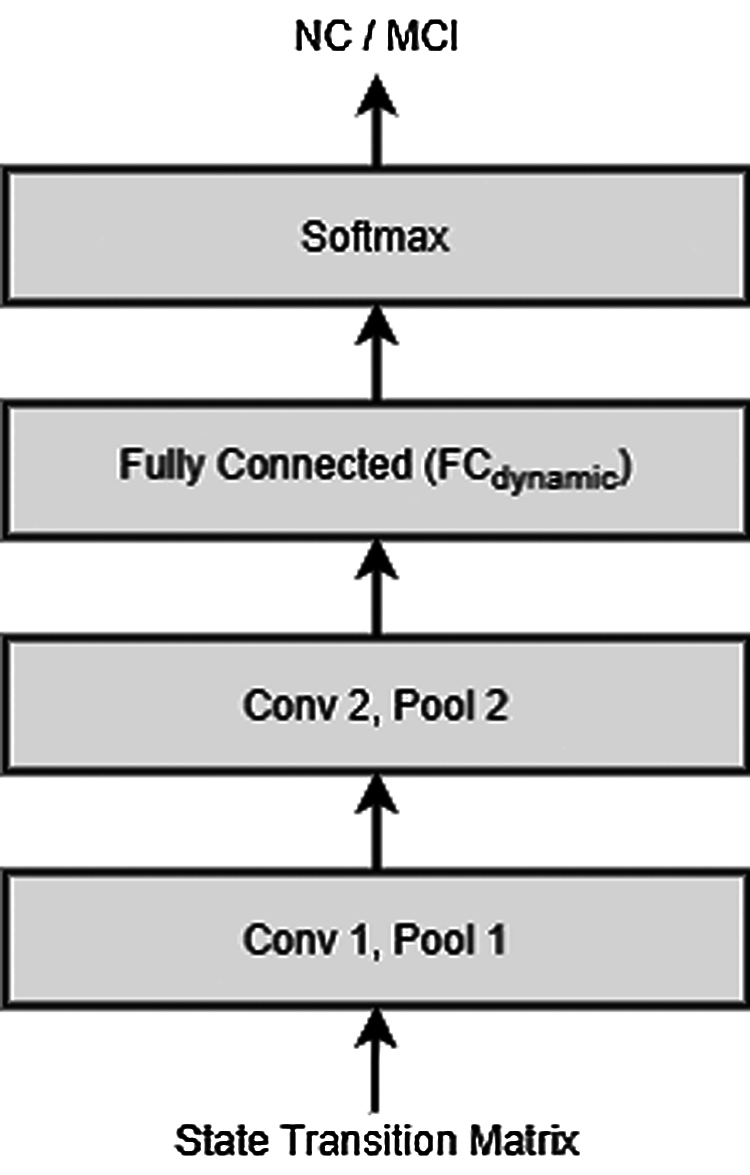
Figure 3: Network structure of the CNN classifier extracting the dynamic connectivity based features
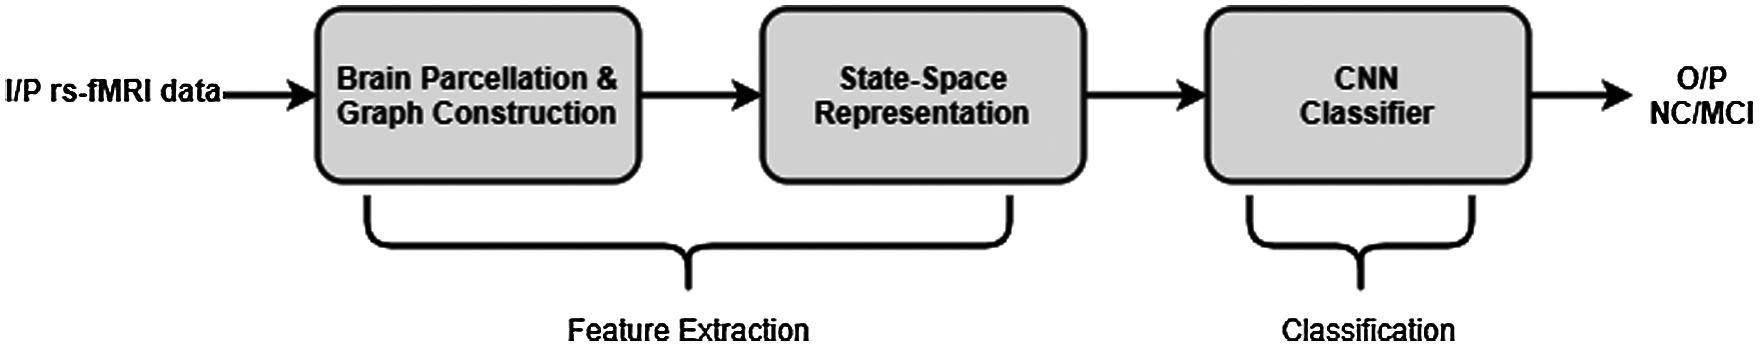
Figure 4: Block diagram of the dynamic connectivity based AD diagnosis model
While the overall construction of the dynamic connectivity based AD diagnosis model is described in Fig. 4, the details of the model implementation are deferred until Section 4 wherein we also apply the proposed model on the rs-fMRI data to experimentally validate its applicability.
3.3 Integrated AD Detection Model
In the aforementioned analysis, first a static connectivity based AD detection model is presented, followed by the modified dynamic connectivity based AD detection model. Although both of these models classified the normal subjects and the subjects with MCI successfully, each one of them uses either the static or the dynamic connectivity based features for the classification purpose. So, in order to improve the classification performance further, we now integrate both of these approaches to exploit both the static as well as the dynamic connectivity based features simultaneously.
Many approaches have been proposed in the machine learning literature to perform the classification task using multimodal information [41–45]. However, as far as deep neural networks are concerned, the most common approaches include early integration, late integration, and intermediate integration [30]. In the early integration approach, data from different modalities is combined at input level itself and then provided to a neural network for further processing. As the data from different modalities is fused directly, without extracting any modality specific features, this approach fails to extract the useful intra-modality information. As opposed to this, in the late integration approach, different networks classify the data from different modalities independently and the final decision is obtained by fusing their individual estimates. As this approach does not share any representation between different modalities, it loses a potentially useful cross-modality relational information. So, to overcome the limitations of the above approaches, a new approach called intermediate level integration has been proposed wherein the fusion takes place at the intermediate level, i.e., after extracting the modality specific features but before making an individual modality based decision [30]. As the intermediate level approach has the advantage of sharing the representations between different modalities and still extracting the modality specific information, we used the same to integrate our static and the dynamic connectivity based AD detection models.
In our present AD detection application, the two modality specific classifiers are designed: (i) GCNN classifier extracting the static connectivity based features, described in Section 3.1 and (ii) CNN classifier extracting the dynamic connectivity based features, described in Section 3.2. Figs. 1 and 3 show the structures of the respective classifier networks.
As discussed above, the intermediate level integration approach fuses the information from different modalities at the intermediate level, i.e., after extracting the modality specific features using the corresponding neural network classifiers. Now, since the convolution layers in the neural networks perform the feature extraction part, we employ the feature fusion step after the final convolution layers of both the classifiers by concatenating the layers FCstatic and FCdynamic (shown in Figs. 1 and 3 respectively). Overall structure of the proposed integrated AD detection model is depicted using a block diagram shown Fig. 5.

Figure 5: Block diagram of the proposed GSP based integrated AD detection model
To validate the effectiveness of the designed AD detection model, we perform the experiments on the dataset employed in our earlier investigation. Its classification score and its comparison with the existing methods for AD diagnosis is presented in the following section.
In this section, we first apply the modified dynamic connectivity based AD detection model on the rs-fMRI data obtained from the ADNI dataset and compare its classification score with that of the existing AD detection methods. After verifying its efficacy in AD detection, we quantify the performance of our proposed integrated AD diagnosis model employing the same rs-fMRI data and validate its utility through a comparative performance analysis.
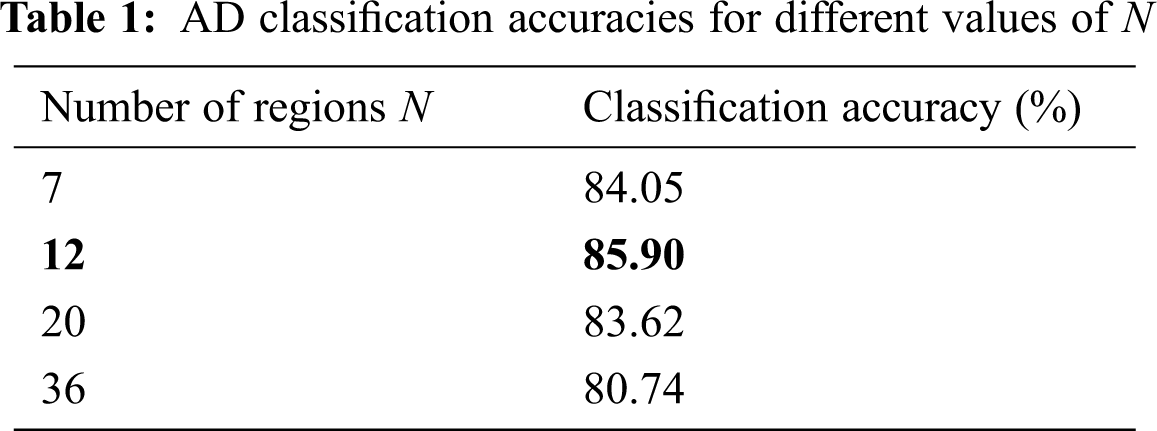
To analyse the performance of our proposed AD detection models, we use here the rs-fMRI data of 180 subjects from ADNI dataset, of which 90 are normal subjects and 90 subjects have the MCI. Now, in order to apply the proposed dynamic connectivity based AD diagnosis approach on this data, first a graph corresponding to this data needs to be constructed, the variations in which is then characterized using the SSM. So, for a given rs-fMRI data, we first parcellate it into N regions to construct a corresponding graph with N vertices. Now, the dimension of the state transition matrix which acts as an input to CNN, depends on the size of the connectivity matrix which in turn depends on the graph size N. So, for the optimum classification performance, we first determine the appropriate graph resolution as the lower N may not be adequate for bringing out the necessary discriminative information while the higher value of N can blow up the feature dimensions.
For selection of suitable graph resolution N, we employed a multiresolution brain parcellation method stated in [39] and constructed the graphs of different resolutions from the rs-fMRI data that are then analysed to obtain the corresponding state transition matrices. These state transition matrices are then provided as the input to a convolutional neural network shown in Fig. 3 for the classification purpose. The first convolutional layer therein produces 64 feature maps while the second produces 128 feature maps. Both of these layers are followed by the max pooling layers with size 2 × 2. The fully connected layer outputs a 256 length vector which is connected to a softmax decision layer. Adam optimizer is used to train the above network with a learning rate of 0.001. Tab. 1 shows the classification accuracy values obtained using 5-fold cross validation, for different graph resolutions N, predefined in [39].
With the appropriate graph resolution as obtained above, the classification performance of our modified dynamic connectivity based AD detection method is evaluated using the same dataset employed in our earlier analysis. The obtained classification performance is then compared with the performance of the existing graph connectivity variation based AD diagnosis methods using three classification measures described below.
where TP indicates true positive, TN indicates true negative, FP indicates false positive and FN indicates the false negative. Fig. 6 compares classification scores of different dynamic connectivity based AD diagnosis methods.
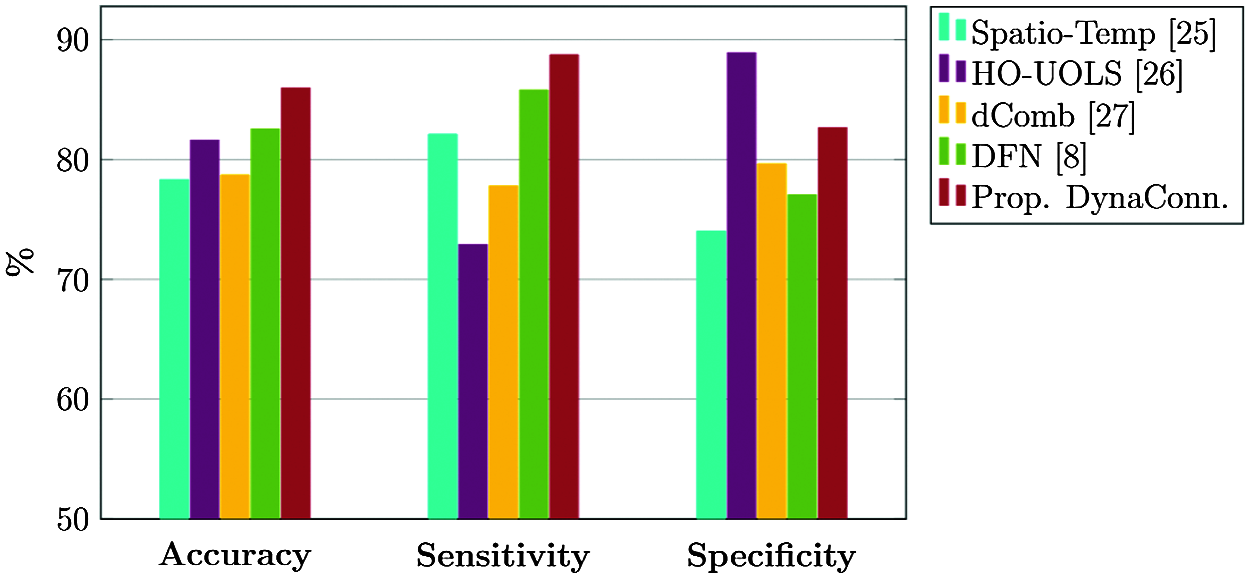
Figure 6: Classification performance of various dynamic connectivity based AD diagnosis methods
Classification scores of all the three metrics in Fig. 6 indicate the superior performance of our proposed dynamic connectivity based AD diagnosis model over most of the prevalent AD diagnosis models, thereby corroborating its superiority.
So, having validated the effectiveness of the modified dynamic connectivity based AD diagnosis method, we next evaluate the performance of the integrated AD detection model. Maintaining the consistency with our previously proposed model, we again perform the experiments on the same rs-fMRI data of 180 subjects from ADNI dataset. This data is then parcellated into appropriate resolutions to construct the corresponding graph signals. As far as static connectivity based classifier is concerned, the graph signal is first passed through a graph-HPF and this filtered graph signal is then provided at the input of a graph convolutional neural network. The GCNN architecture contains two graph convolution layers with the first layer having 32 feature maps while the second having 64 feature maps. Output of both convolution layers are pooled by our proposed graph coarsening algorithm [22]. These layers are followed by a fully connected layer containing 256 neurons, denoted by FCstatic in Fig. 1.
Considering the dynamic connectivity based classifier, the connectivity dynamics of the graph corresponding to each subject is first encoded by state transition matrix of the associated SSM, described in Section 3.2. This state transition matrix is then provided as an input to a CNN consisting of two convolution layers having 64 and 128 convolutional units, respectively. Each of this convolutional layer is followed by a max pooling layer of size 2 × 2. These layers are followed by a fully connected layer of output size 256 which is denoted by FCdynamic in Fig. 3.
Now, in order to integrate the above modality specific classifiers, the fully connected layers FCstatic and FCdynamic, representing the static and the dynamic connectivity based features respectively, are concatenated to form a shared representation vector of length 512, as shown in Fig. 5. The output of this vector is provided to a softmax layer for the final decision making. The above network is trained using Adam optimizer for 30 epochs with a learning rate of 0.001. Similar to our earlier AD detection model, we evaluated the classification score of the above model using 5-fold cross validation and measured it using the same three metrics as used in the earlier analysis. To corroborate the efficacy of the proposed AD diagnosis model, the obtained classification score is compared with the classification scores of the existing AD diagnosis methods, and the comparison results are plotted in Fig. 7.

Figure 7: Classification performance of various AD diagnosis methods
The results in Fig. 7 show that the proposed integrated AD diagnosis model performs better than the prevailing AD diagnosis methods as well as our previously proposed models, in all the three classification measures, thus corroborating its utility in AD diagnosis application. This refinement in the classification performance can be ascribed to the design of a novel integrated AD classifier wherein our static connectivity based AD classifier is integrated with the dynamic connectivity based classifier to exploit both the static and the dynamic connectivity based features simultaneously.
In this paper, a novel GSP based integrated AD detection model is designed wherein both the static and the dynamic brain connectivity based features extracted from rs-fMRI data are simultaneously utilized for early detection of AD. To construct the proposed integrated AD detection model, first, a modified dynamic connectivity based AD detection model was designed using our earlier proposed SSM based method to encode the connectivity variation of a time evolving graph. The features extracted using this model were then fused with the static connectivity based features using the multimodal deep learning method to construct the integrated AD detection model. Performance of the proposed models was evaluated using the rs-fMRI data from ADNI dataset and the resulting classification score was compared with different AD diagnosis techniques. Improvement in all the classification metrics attested the superiority of our designed AD detection models.
Although our designed AD diagnosis model achieved state-of-the-art classification performance, its performance is still constrained by restricting itself to the fMRI data only, and can be improved further by using the multimodal information. Also, since diseases like schizophrenia, autism spectrum disorder, are also known to be associated with the altered brain connectivity dynamics, use of our modified dynamic connectivity based AD detection model can be extended for detection of these diseases as well.
Funding Statement: The authors received no specific funding for this study.
Conflicts of Interest: The authors declare that they have no conflicts of interest to report regarding the present study.
1. Alzheimer's Disease International (ADI). [Online]. Available: http://www.alz.co.uk/. 2018. [Google Scholar]
2. Alzheimer's Association. 2017 “Alzheimer's disease facts and figures,” Alzheimer's Dement, vol. 13, no. 1, pp. 325–373, 2017. [Google Scholar]
3. J. Shi, X. Zheng, Y. Li, Q. Zhang and S. Ying, “Multimodal neuroimaging feature learning with multimodal stacked deep polynomial networks for diagnosis of Alzheimer's disease,” IEEE Journal of Biomedical and Health Informatics, vol. 22, no. 1, pp. 173–183, 2017. [Google Scholar]
4. F. Zhang, Z. Li, B. Zhang, H. Du, B. Wang et al., “Multi-modal deep learning model for auxiliary diagnosis of Alzheimer's disease,” Neurocomputing, vol. 361, no. 1, pp. 185–195, 2019. [Google Scholar]
5. H. I. Suk, S. W. Lee and D. She, “Hierarchical feature representation and multimodal fusion with deep learning for AD/MCI diagnosis,” NeuroImage, vol. 101, no. 1, pp. 569–582, 2014. [Google Scholar]
6. C. Hu, J. Sepulcre, K. A. Johnson, G. E. Fakhri, Y. M. Lu et al., “Matched signal detection on graphs: Theory and application to brain imaging data classification,” NeuroImage, vol. 125, no. 1, pp. 587–600, 2016. [Google Scholar]
7. R. Ju, C. Hu and Q. Li, “Early diagnosis of Alzheimer's disease based on resting-state brain networks and deep learning,” IEEE/ACM Transactions on Computational Biology and Bioinformatics, vol. 16, no. 1, pp. 244–257, 2017. [Google Scholar]
8. Z. Jiao, Z. Xia, X. Ming, C. Cheng and S. H. Wang, “Multi-scale feature combination of brain functional network for eMCI classification,” IEEE Access, vol. 7, no. 1, pp. 74263–74273, 2019. [Google Scholar]
9. S. Parisot, S. I. Ktena, E. Ferrante, M. Lee, R. Guerrero et al., “Disease prediction using graph convolutional networks: Application to autism spectrum disorder and Alzheimer's disease,” Medical Image Analysis, vol. 48, no. 1, pp. 117–130, 2018. [Google Scholar]
10. C. Hu, X. Hua, J. Ying, P. M. Thompson, G. E. Fakhri et al., “Localizing sources of brain disease progression with network diffusion model,” IEEE Journal of Selected Topics in Signal Processing, vol. 10, no. 7, pp. 1214–1225, 2016. [Google Scholar]
11. A. Sandryhaila and J. M. Moura, “Discrete signal processing on graphs,” IEEE Transactions on Signal Processing, vol. 61, no. 7, pp. 1644–1656, 2013. [Google Scholar]
12. D. I. Shuman, S. K. Narang, P. Frossard, A. Ortega and P. Vandergheynst, “The emerging field of signal processing on graphs: Extending high-dimensional data analysis to networks and other irregular domains,” IEEE Signal Processing Magazine, vol. 30, no. 3, pp. 83–98, 2013. [Google Scholar]
13. A. Ortega, P. Frossard, J. Kovacevic, J. M. Moura and P. Vandergheynst, “Graph signal processing: Overview, challenges, and applications,” in Proceedings of the IEEE, vol. 106, no. 5, pp. 808–828, 2018. [Google Scholar]
14. O. Teke and P. P. Vaidyanathan, “Extending classical multirate signal processing theory to graphs—part I: Fundamentals,” IEEE Transactions on Signal Processing, vol. 65, no. 2, pp. 409–422, 2016. [Google Scholar]
15. D. K. Hammond, P. Vandergheynst and R. Gribonval, “Wavelets on graphs via spectral graph theory,” Applied and Computational Harmonic Analysis, vol. 30, no. 2, pp. 129–150, 2011. [Google Scholar]
16. M. Defferrard, X. Bresson and P. Vandergheynst, “Convolutional neural networks on graphs with fast localized spectral filtering,” in Proc. Advances in Neural Information Processing Systems, Barcelona, Spain, pp. 3844–3852, 2016. [Google Scholar]
17. M. M. Bronstein, J. Bruna, Y. LeCun, A. Szlam and P. Vandergheynst, “Geometric deep learning: Going beyond Euclidean data,” IEEE Signal Processing Magazine, vol. 34, no. 4, pp. 18–42, 2017. [Google Scholar]
18. H. E. Egilmez and A. Ortega, “Spectral anomaly detection using graph-based filtering for wireless sensor networks,” in 2014 IEEE international conference on acoustics,” in Speech and Signal Processing (ICASSPFlorence, Italy, pp. 1085–1089, 2014. [Google Scholar]
19. A. Pirayre, C. Couprie, F. Bidard, L. Duval and J. C. Pesquet, “BRANE cut: Biologically-related a priori network enhancement with graph cuts for gene regulatory network inference,” BMC Bioinformatics, vol. 16, no. 1, pp. 1–12, 2015. [Google Scholar]
20. W. Hu, G. Cheung, A. Ortega and O. C. Au, “Multiresolution graph Fourier transform for compression of piecewise smooth images,” IEEE Transactions on Image Processing, vol. 24, no. 1, pp. 419–433, 2014. [Google Scholar]
21. H. Padole, S. D. Joshi and T. K. Gandhi, “Early detection of Alzheimer's disease using graph signal processing on neuroimaging data,” in 2018 european conference on electrical engineering and computer science (EECSBern, Switzerland, pp. 302–306, 2018. [Google Scholar]
22. H. Padole, S. D. Joshi and T. K. Gandhi, “Graph wavelet-based multilevel graph coarsening and its application in graph-cNN for Alzheimer's disease detection,” IEEE Access, vol. 8, no. 1, pp. 60906–60917, 2020. [Google Scholar]
23. F. Grassi, A. Loukas, N. Perraudin and B. Ricaud, “A time-vertex signal processing framework: Scalable processing and meaningful representations for time-series on graphs,” IEEE Transactions on Signal Processing, vol. 66, no. 3, pp. 817–829, 2017. [Google Scholar]
24. K. Smith, L. Spyrou and J. Escudero, “Graph-variate signal analysis,” IEEE Transactions on Signal Processing, vol. 67, no. 2, pp. 293–305, 2018. [Google Scholar]
25. B. Jie, M. Liu and D. Shen, “Integration of temporal and spatial properties of dynamic connectivity networks for automatic diagnosis of brain disease,” Medical Image Analysis, vol. 47, no. 1, pp. 81–94, 2018. [Google Scholar]
26. Y. Li, J. Liu, Z. Peng, C. Sheng, M. Kim et al., “Fusion of ULS group constrained high-and low-order sparse functional connectivity networks for MCI classification,” Neuroinformatics, vol. 18, no. 1, pp. 1–24, 2020. [Google Scholar]
27. X. Chen, H. Zhang, L. Zhang, C. Shen, S. W. Lee et al., “Extraction of dynamic functional connectivity from brain grey matter and white matter for MCI classification,” Human Brain Mapping, vol. 38, no. 10, pp. 5019–5034, 2017. [Google Scholar]
28. H. Padole, S. D. Joshi and T. K. Gandhi, “Characterization of time evolving graph using state-space modelling and its application in Alzheimer's disease detection,” in 2020 Int. Conf. on Electronics, Information, and Communication (ICEICBarcelona, Spain, pp. 1–5, 2020. [Google Scholar]
29. Alzheimer's Disease Neuroimaging Initiative: ADNI. (Accessed on February 16, 2020. [Online]. Available: http://adni.loni.usc.edu. 2020. [Google Scholar]
30. J. H. Choi and J. S. Lee, “Embracenet: A robust deep learning architecture for multimodal classification,” Information Fusion, vol. 51, no. 1, pp. 259–270, 2019. [Google Scholar]
31. V. Radu, C. Tong, S. Bhattacharya, N. D. Lane, C. Mascolo et al., “Multimodal deep learning for activity and context recognition,” proceedings of the ACM on interactive, mobile, Wearable and Ubiquitous Technologies, vol. 1, no. 4, pp. 1–27, 2018. [Google Scholar]
32. F. de Vos, M. Koini, T. M. Schouten, S. Seiler, J. Grond et al., “A comprehensive analysis of resting state fMRI measures to classify individual patients with Alzheimer's disease,” Neuroimage, vol. 167, no. 1, pp. 62–72, 2018. [Google Scholar]
33. C. Y. Wee, S. Yang, P. T. Yap and D. Shen, “Sparse temporally dynamic resting-state functional connectivity networks for early MCI identification,” Brain Imaging and Behavior, vol. 10, no. 2, pp. 342–356, 2016. [Google Scholar]
34. C. Bachmann, H. I. Jacobs, P. Porta Mana, K. Dillen, N. Richter et al., “On the extraction and analysis of graphs from resting-state fMRI to support a correct and robust diagnostic tool for Alzheimer's disease,” Frontiers in Neuroscience, vol. 12, no. 1, pp. 528, 2018. [Google Scholar]
35. Q. Yu, E. B. Erhardt, J. Sui, Y. Du, H. He et al., “Assessing dynamic brain graphs of time-varying connectivity in fMRI data: Application to healthy controls and patients with schizophrenia,” Neuroimage, vol. 107, no. 1, pp. 345–355, 2015. [Google Scholar]
36. M. Assaf, K. Jagannathan, V. D. Calhoun, L. Miller, M. C. Stevens et al., “Abnormal functional connectivity of default mode sub-networks in autism spectrum disorder patients,” Neuroimage, vol. 53, no. 1, pp. 247–256, 2010. [Google Scholar]
37. J. D. Medaglia, W. Huang, E. A. Karuza, A. Kelkar, S. L. Thompson-Schill et al., “Functional alignment with anatomical networks is associated with cognitive flexibility,” Nature Human Behaviour, vol. 2, no. 2, pp. 156–164, 2018. [Google Scholar]
38. S. Belleville, L. Bherer, E. Lepage, H. Chertkow and S. Gauthier, “Task switching capacities in persons with Alzheimer's disease and mild cognitive impairment,” Neuropsychologia, vol. 46, no. 8, pp. 2225–2233, 2008. [Google Scholar]
39. S. Urchs, J. Armoza, C. Moreau, Y. Benhajali, J. St-Aubin et al., “MIST: A multi-resolution parcellation of functional brain networks,” MNI Open Research, vol. 1, no. 1, pp. 3–33, 2019. [Google Scholar]
40. R. E. Kalman, “A new approach to linear filtering and prediction problems,” J. Basic Engineering, vol. 82, no. 1, pp. 35, 1960. [Google Scholar]
41. P. K. Atrey, M. A. Hossain, A. El Saddik and M. S. Kankanhalli, “Multimodal fusion for multimedia analysis: A survey,” Multimedia Systems, vol. 16, no. 6, pp. 345–379, 2010. [Google Scholar]
42. J. Ngiam, A. Khosla, M. Kim, J. Nam, H. Lee et al., “Multimodal deep learning,” in Proc. Int. Conf. Machine Learning ICML, Bellevue, Washington, USA, 2011. [Google Scholar]
43. K. Sohn, W. Shang, and H. Lee, “Improved multimodal deep learning with variation of information,” Advances in Neural Information Processing Systems, vol. 27, no. 1, pp. 2141–2149, 2014. [Google Scholar]
44. T. Baltrušaitis, C. Ahuja and L. P. Morency, “Multimodal machine learning: A survey and taxonomy,” IEEE Transactions on Pattern Analysis and Machine Intelligence, vol. 41, no. 2, pp. 423–443, 2018. [Google Scholar]
45. G. K. Verma and U. S. Tiwary, “Multimodal fusion framework: A multiresolution approach for emotion classification and recognition from physiological signals,” NeuroImage, vol. 102, no. 1, pp. 162–172, 2014. [Google Scholar]
 | This work is licensed under a Creative Commons Attribution 4.0 International License, which permits unrestricted use, distribution, and reproduction in any medium, provided the original work is properly cited. |