DOI:10.32604/iasc.2022.020606
| Intelligent Automation & Soft Computing DOI:10.32604/iasc.2022.020606 | |
| Article |
Modeling the Spread of COVID-19 by Leveraging Machine and Deep Learning Models
1Institute of Computing, Kohat University of Science and Technology, KUST, Kohat, 26000, Pakistan
2Department of Management Information System, College of Business Administration, Taif University, Taif, 21944, Saudi Arabia
3College of Computer Science and Engineering, University of Jeddah, 21959, Jeddah, Saudi Arabia
*Corresponding Author: M.Irfan Uddin. Email: irfanuddin@kust.edu.pk
Received: 31 May 2021; Accepted: 22 July 2021
Abstract: Corona Virus disease 2019 (COVID-19) has caused a worldwide pandemic of cough, fever, headache, body aches, and respiratory ailments. COVID- 19 has now become a severe disease and one of the leading causes of death globally. Modeling and prediction of COVID-19 have become inevitable as it has affected people worldwide. With the availability of a large-scale universal COVID-19 dataset, machine learning (ML) techniques and algorithms occur to be the best choice for the analysis, modeling, and forecasting of this disease. In this research study, we used one deep learning algorithm called Artificial Neural Network (ANN) and several ML algorithms such as Support Vector Machine (SVM), polynomial regression, and Bayesian ridge regression (BRR) modeling for analysis, modeling, and spread prediction of COVID-19. COVID-19 dataset, maintained and updated by JOHNS HOPKINS UNIVERSITY was used for ML models training, testing, and modeling. The cost and error generated during ANN training process was reduced using technique called back propagation which dynamically adjust the synapses weights to perform better predictions. The ANN architecture included one input layer with 441 neurons, 4 hidden layers each have 90 neurons and one output layer. ANN along with other ML algorithms were trained to model the prediction of COVID-19 spread for the next 10 days. Experimental results showed that BRR technique overall performed better prediction of COVID-19 for the next 10 days. The modeling of infectious diseases can help relevant countries to take the necessary steps and make timely decisions.
Keywords: COVID-19; modeling; prediction; deep learning; machine learning; support vector machine; Bayesian modeling
In December 2019, a new type of coronavirus was called COVID-19 was identified in Wuhan, China. The rapid spread of the disease affected thousands of people early in China and within few months reached almost every country worldwide [1]. At present, several countries through effective measures have managed to control this pandemic but have been challenged by the new orientation and shape of this virus resulting in compelling people to lockdown [2]. Currently, the USA, Europe, and South Asian countries have been the center of the COVID-19 outbreak causing thousands of deaths [3]. In early 2020, the World Health Organization (WHO) has declared this virus a “global pandemic” thus compelling researchers globally to work collectively to find the disease cause and subsequently stop it [4]. The new type of virus appears to be more harmful and has caused a great threat to human safety due to its potential harm and fast-spreading power. Consequently, this pandemic has become the prime topic of current research. Recently, many studies have been carried out suggesting the pandemic preventive measures and transmission constraints [5–8]. With the advancement in Internet technologies such as 4G, 5G, and 6G, researchers can instantly collaborate and work in the different parts of the world to come across a solution for the control and spread of COVID-19 [9,10].
In this study, we study the transmission characteristics of COVID-19 by employing DL and ML algorithms such as Artificial Neural Network (ANN) Support Vector Machine (SVM), Bayesian ridge regression (BRR) model, and polynomial regression to model the disease spread process. Due to the COVID-19 high spread across the world, this study also aims to understand, analyze, and model its spread trends.
1.1 COVID-19 Analysis Using Python Libraries
The following Python packages and libraries were important and used for performing basic analysis regarding the disease spread, mortality, recovered cases, and causes. Pandas: for importing and performing various operations on the dataset, i.e., reading the dataset, performing scaling, feature engineering, etc [11]. Numpy: for performing mathematical calculations and supporting Pandas operations [12]. Matplotlib: for plotting graphs and visualizations [13]. Pycountry_convert: Python library for getting countries and continents names [14]. Keras: for creating prediction models [15]. Plotly: for creating interactive plots [16]. Folium: library for working with maps [17].
Four CSV files, namely, timeseries_covid19_confirmed_global.csv, time_series_covid19_deaths.csv, cases_country.csv, and cases_time.csv were initially imported from the JOHNS HOPKINS University Github repository [18]. The dynamic dataset is updated and maintained by JOHNS HOPKINS University daily. It was confirmed that the latest up-to-date version of the dataset is imported and used for analysis and modeling purposes. The dataset is in the form of time-series data from 22 January 2020 to date.
Before performing the analysis and modeling tasks, some data preprocessing steps were carried out. These steps involve renaming column names to more concise and readable names, determining the total number of active COVID-19 cases, changing country names required for the pycountry_convert library, assigning codes to continents names, identifying, and removing invalid entries, and removing outliers.
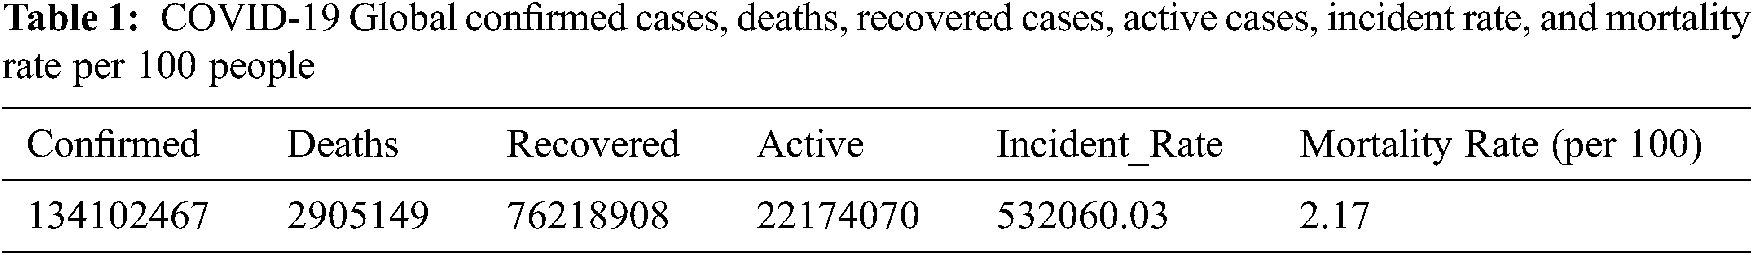
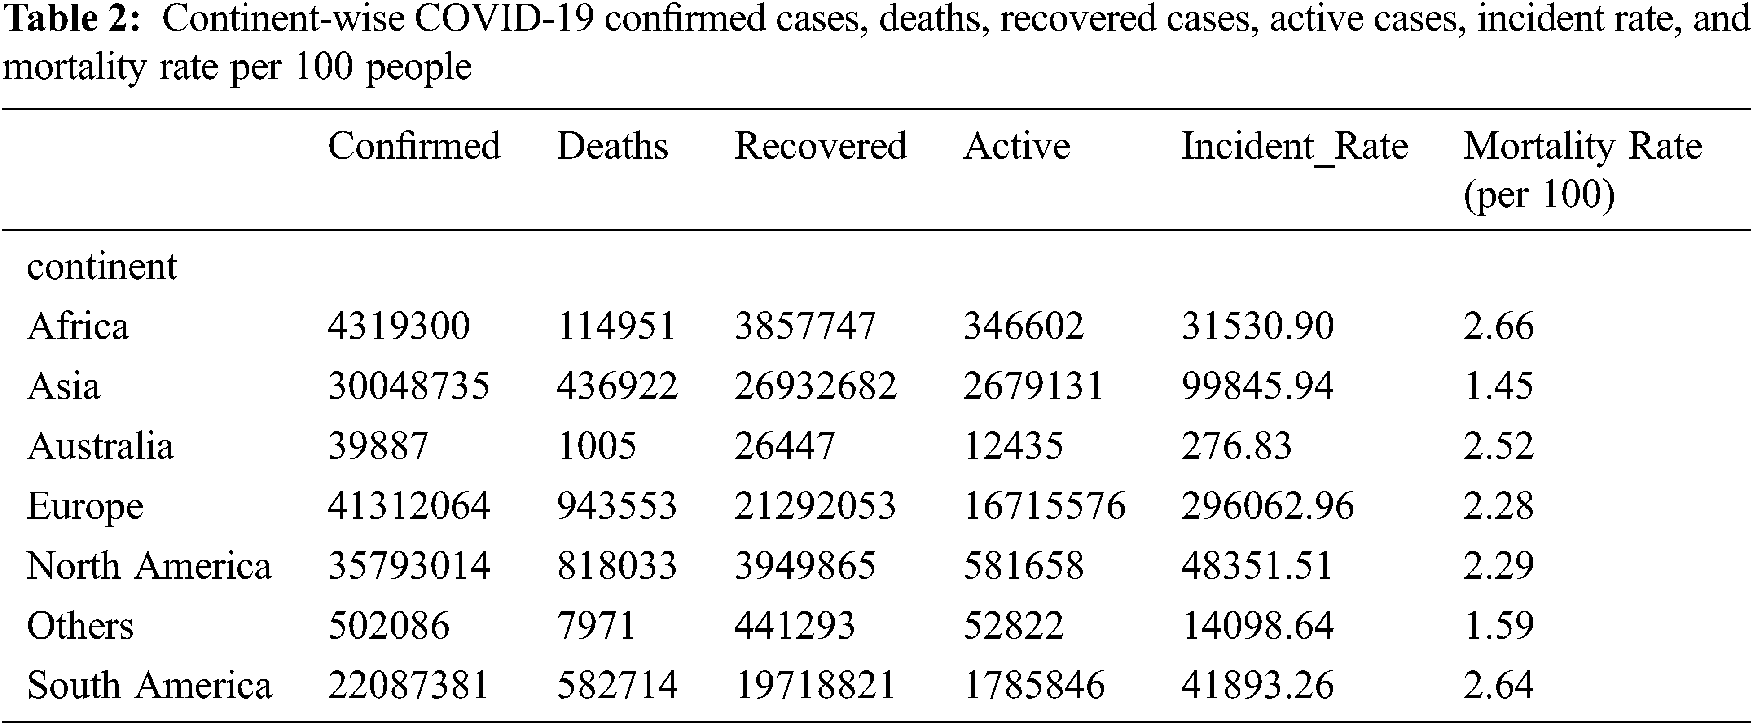
At an abstract level, we performed general data analysis to figure out COVID-19 effects worldwide. Tab. 1 shows global confirmed cases, deaths, recovered cases, active cases, incident rate, and mortality rate per 100 people. These figures reveal that COVID-19 spread is increasing worldwide, but the mortality rate has dropped down in 2021 as it was 3.11 during 2020. Tab. 2 shows continent-wise COVID-19 cases where it can be observed that Europe has the highest incident rate and deaths.
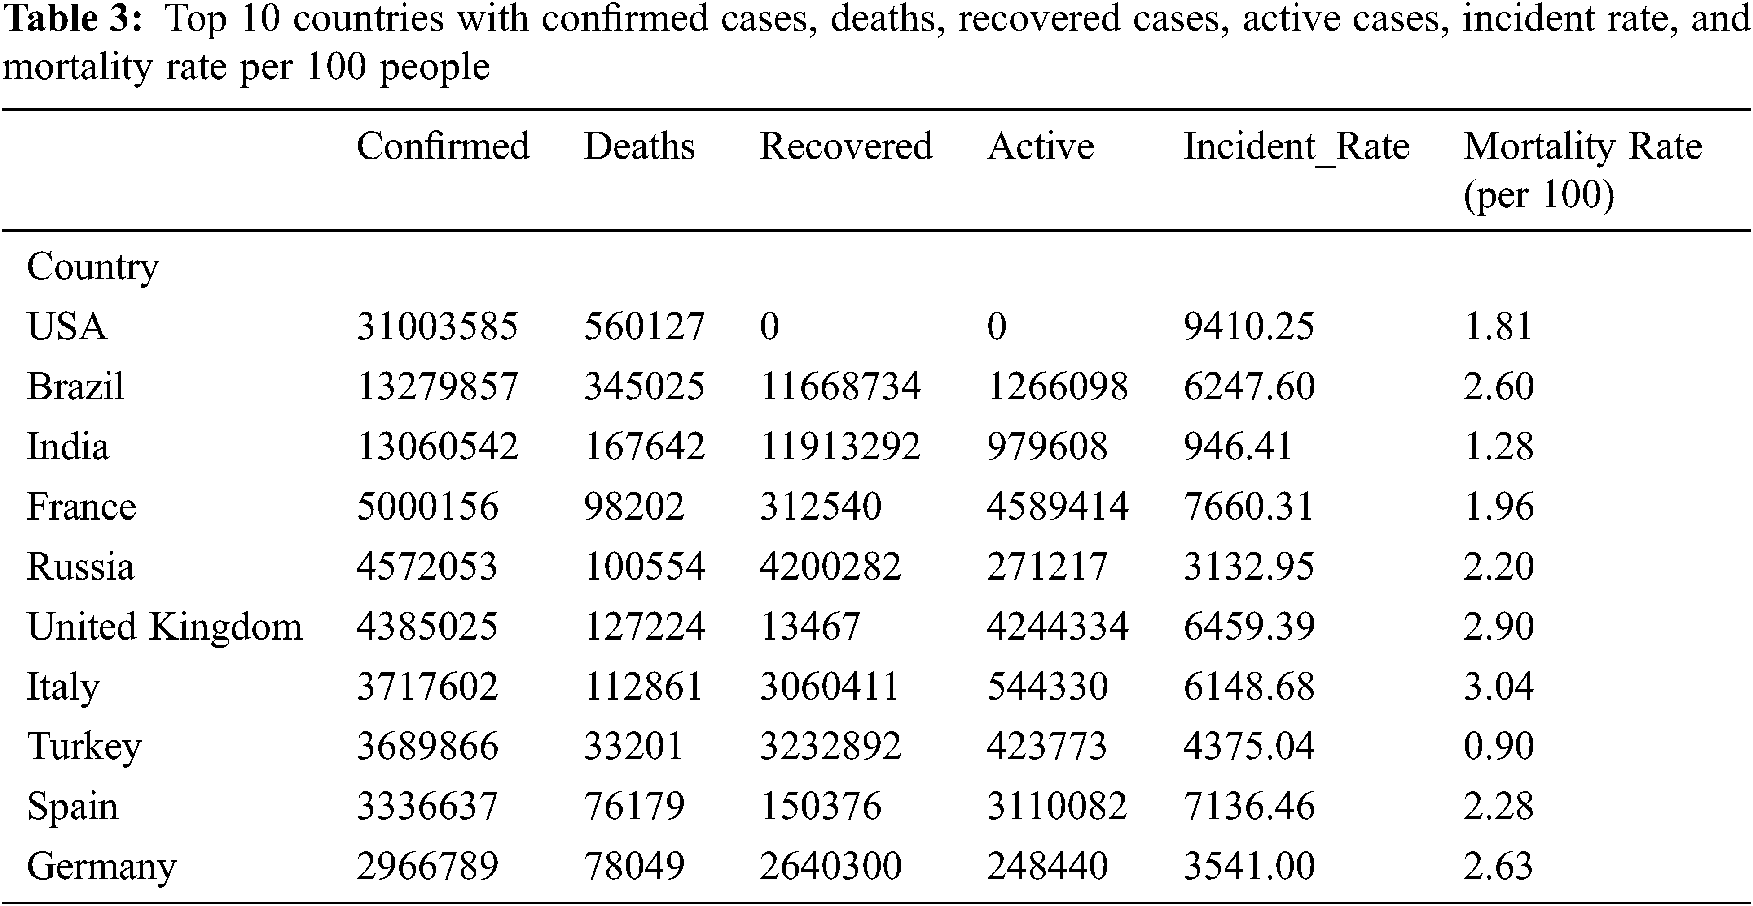
For brevity, we presented the 10 most-affected countries by COVID-19 to date in Tab. 3. Due to effective measures, China is now nowhere in the most affected countries from where the virus was originated, whereas, among these 10 most affected countries, most of them advanced in terms of hospitals, vaccines, and facilities [19]. The COVID-19 figures for the USA are serious with the greatest number of confirmed cases, deaths, and incident rates. The figures also show that if proper measures are not taken immediately, India could surpass the USA in terms of mortality as medical facilities are far less in India compared to the USA. Fig. 1 shows the top 10 countries having confirmed COVID-19 cases with the USA, Brazil, and India at the top three, whereas Fig. 2 shows the top 10 countries with the most mortality with the USA, Brazil, and Mexico at the top three in the list.
To determine how various cases are linearly related, we plotted a heatmap in Tab. 4 of the correlations of confirmed cases, recovered cases, deaths, and active cases. It can be noted that confirmed cases are strongly related to the death rates, which means if more people are infected by the virus, then there will be more mortality.
The correlation between various cases increases if we perform continent-wide correlation as shown in Tab. 5. We can conclude that the correlation between confirmed-death cases, confirmed-recovered cases, confirmed-active cases, and the confirmed-incident rate has become stronger as compared to worldwide cases.
In this section, we perform an analysis of how the COVID-19 virus spread across the globe and spread trends across continents and in most affected countries. The graph in Fig. 3 shows the COVID-19 spread pattern from day 1 to date. On X-axis we have the number of days whereas Y-axis denotes the number of cases in scientific notation. Moreover, a summary is also shown on the graph showing the mortality rate from day 1 up till now, confirmed and death cases in the last 5 days, and confirmed and death cases in the last 24 hours.
As the research study was conducted in Pakistan, therefore, it was deemed to compare the COVID-19 spread pattern in Pakistan with other most affected countries. Referring to Fig. 4, it can be observed that besides Japan, all other countries have a higher virus spread trend as compared to Pakistan. Moreover, the USA has the highest spread rate. It is worthwhile to comprehend the worldwide growth of upsurge in the number of cases over time. There is always an arrangement in any data, but the apprehension is how intensely data follows a trend. The spread of COVID-19 is exponential as it takes 67 days for positive cases of COVID-19 to reach 0.1 million figures while it takes only 11 days to reach 0.2 million, 4 days to reach 0.3 million, and just 2 days to reach 0.5 million. This trend demonstrates how rapidly it spreads.
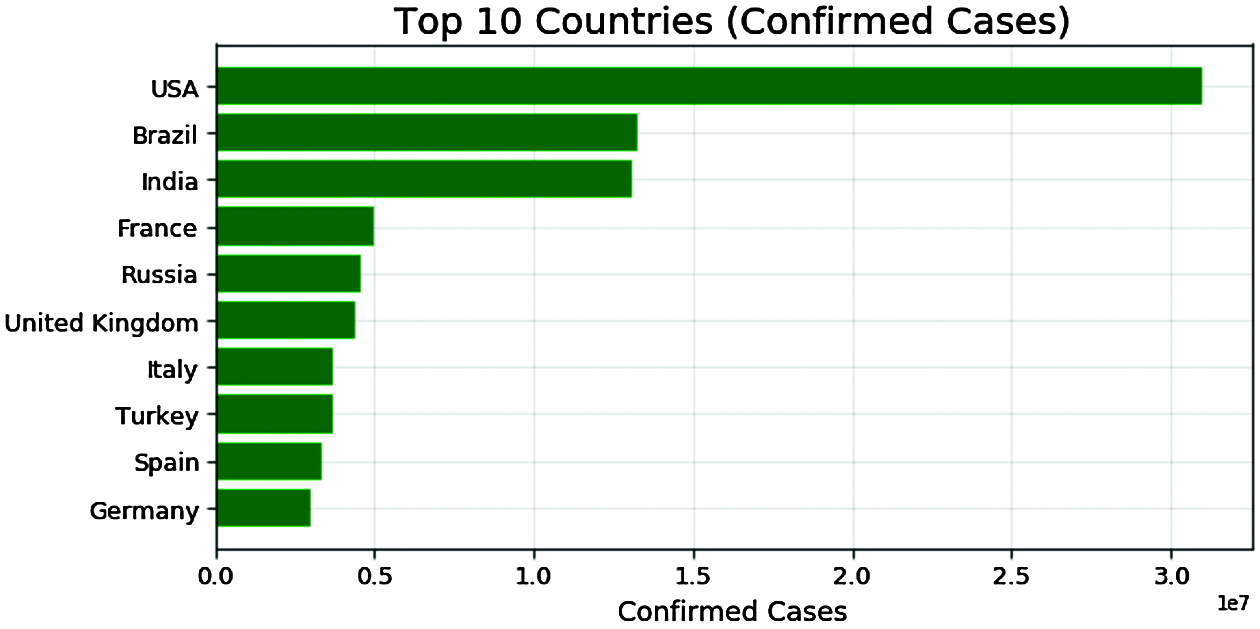
Figure 1: The top 10 countries having confirmed COVID-19 cases with the USA, Brazil, and Mexico at the top
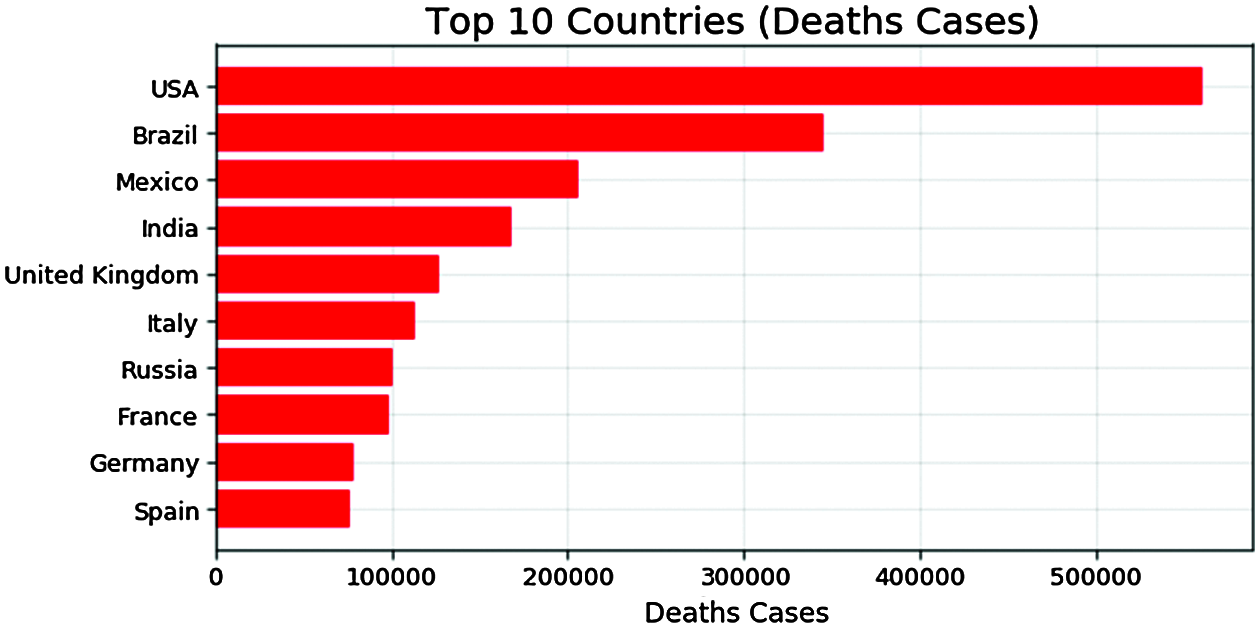
Figure 2: The top 10 countries having death COVID-19 cases with the USA, Brazil, and India at the top
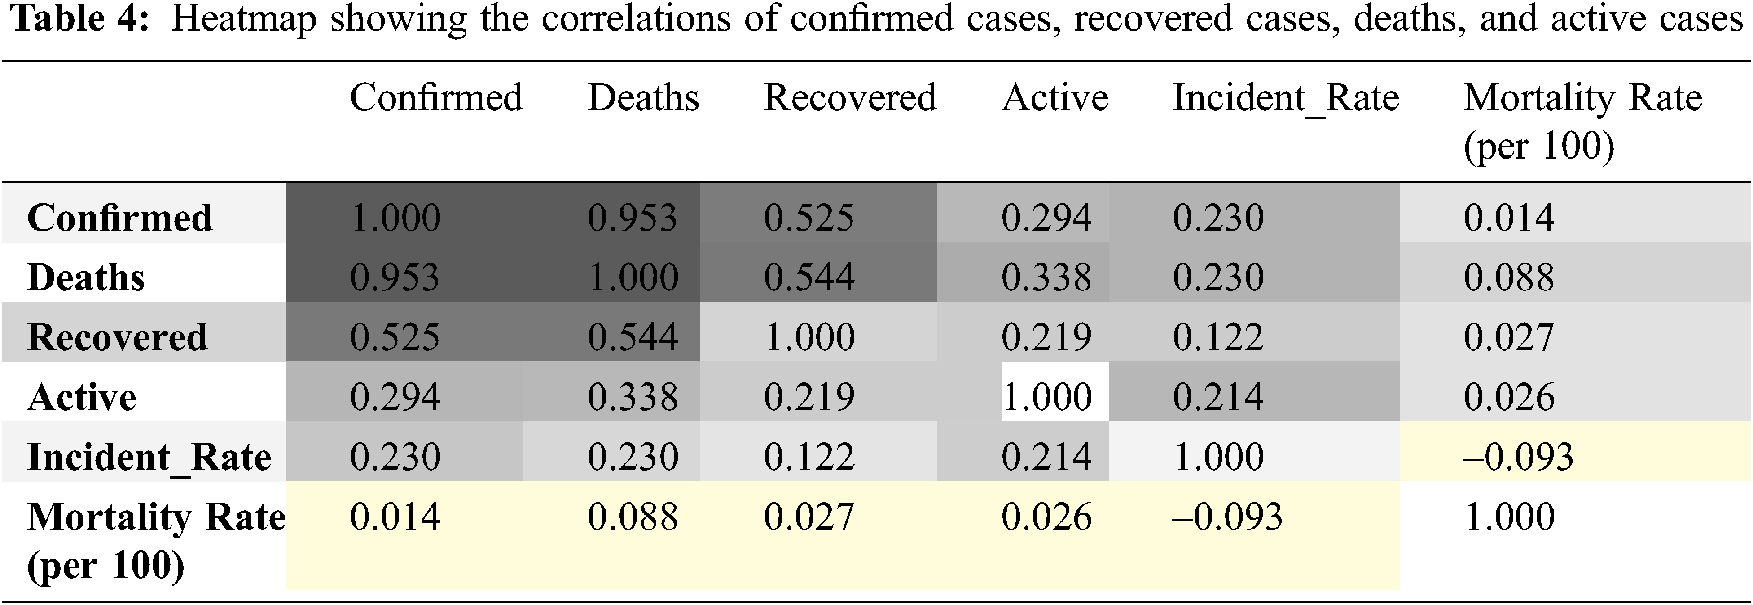
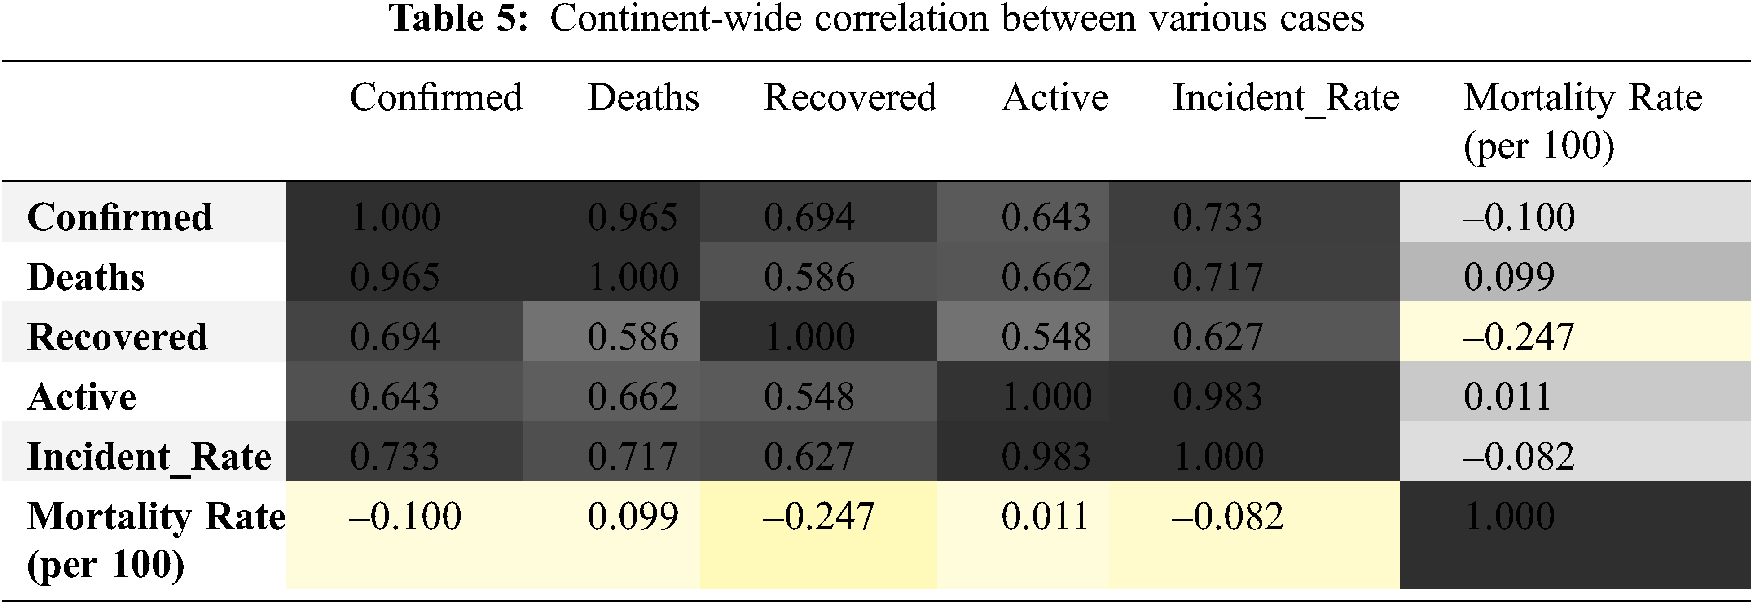
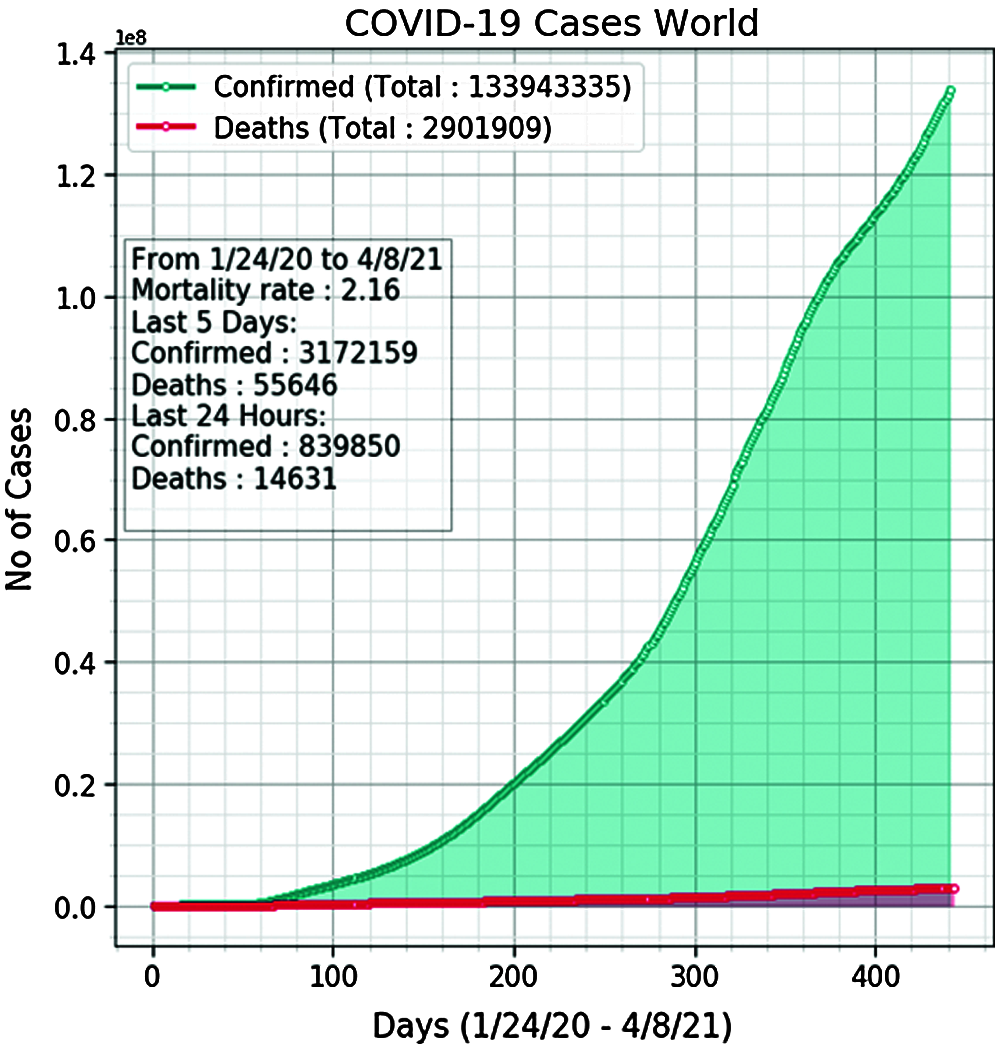
Figure 3: Global COVID-19 spread pattern from day 1 to date
To predict the global spread of COVID-19 in the future we used one deep learning algorithm called Artificial Neural Network (ANN) and several machine learning algorithms such as SVM, polynomial re-regression, and Bayesian Ridge Regression (BRR) modeling [20–22]. The goal of Artificial Intelligence (AI) is to make computers think and act like humans. DL and ML is a subject of AI commonly used for making predictions using existing data and performing classification. DL and ML differ from traditional AI techniques in the way that they use training data instead of hard-coded programming. ML techniques train a model or a system to solve a problem instead of writing hard-coded programming rules. For training the system, the most important element is the data source. A working pattern is developed for a model, which tells what data is provided to the system, how the data is processed, and what type of data is produced. The data produced is used for making future predictions and taking decisions [23–25]. ML models are mathematical and are used to approximate the behavior of a system. ML is further divided into supervised and unsupervised learning, wherein supervised learning inputs and outputs are known and available in the dataset [26–28]. In unsupervised learning, the output labels are not available and patterns/clusters are made out of existing input data [29–32].
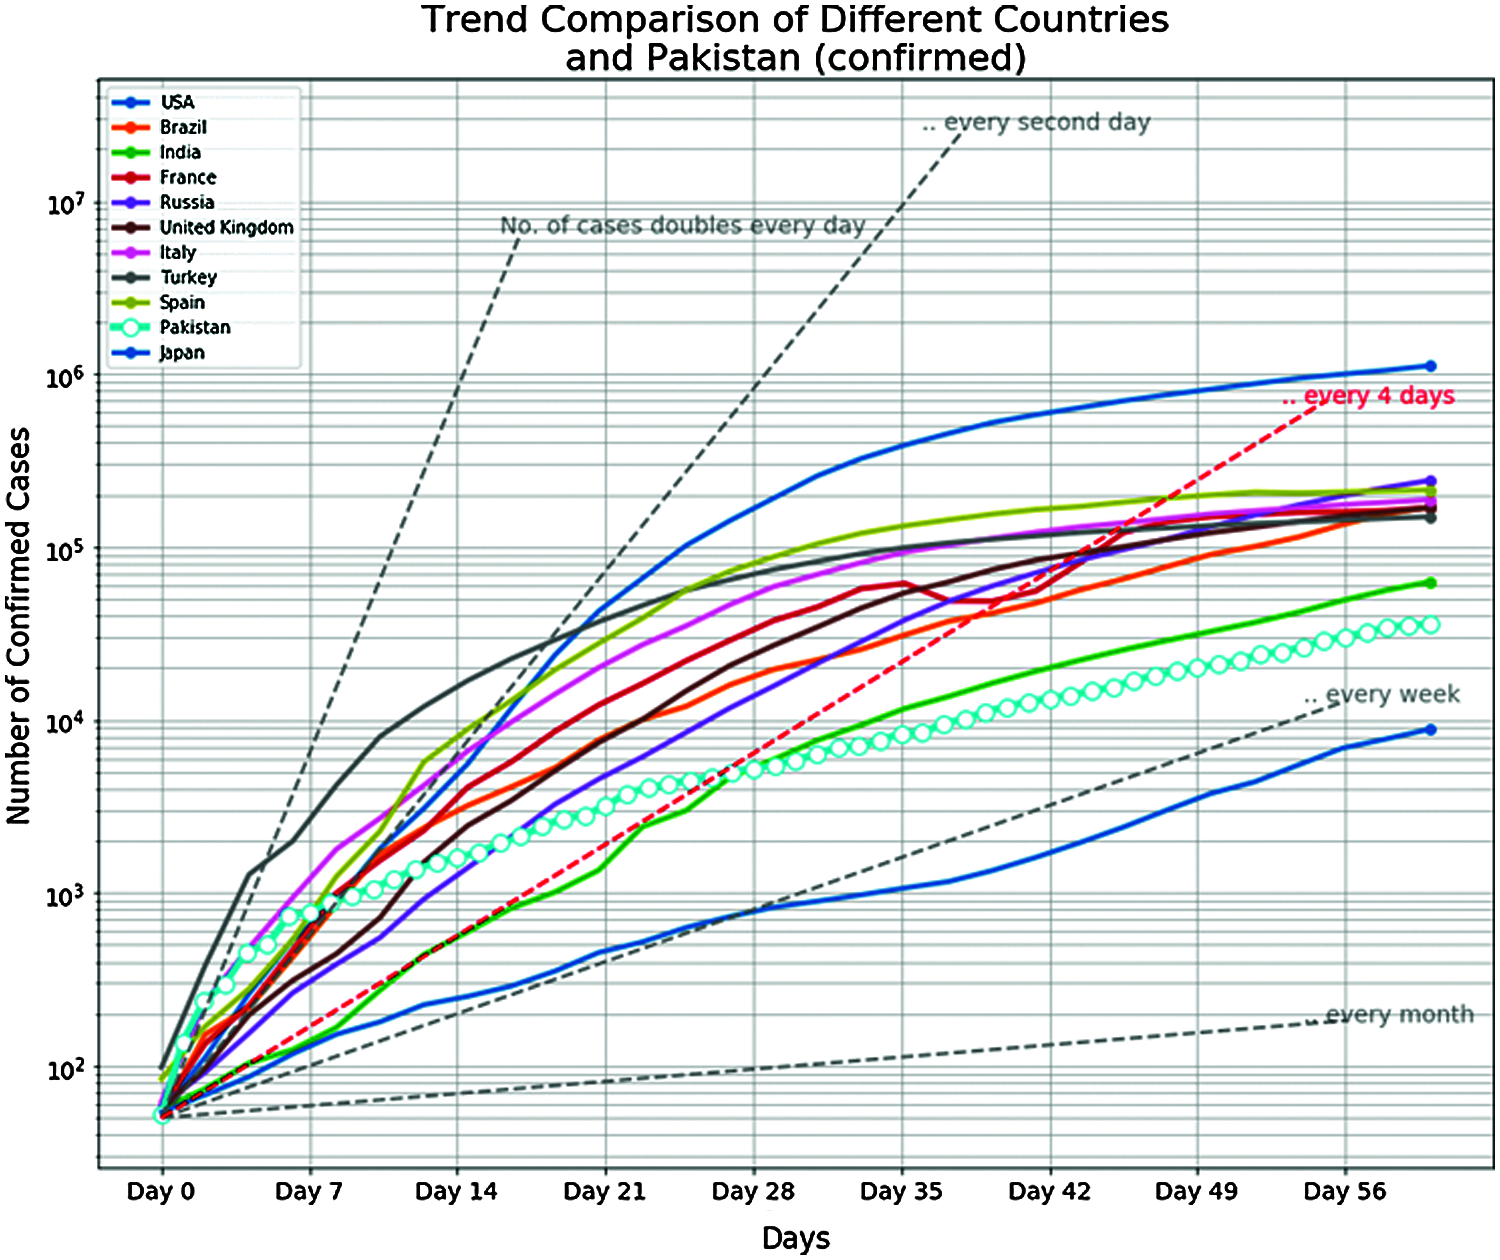
Figure 4: COVID-19 spread pattern in Pakistan with other most affected countries
DL algorithms are an advanced form of ML algorithm where the important features are identified by neural networks instead of telling them what features are important and what are not [33,34]. Therefore, a little feature engineering process is applied as most of the time the hidden patterns and important features are learned by the DL models themselves. While training the DL models, most of the time the feature engineering process is bypassed. DL algorithms will be preferred in most circumstances as not dealing with feature engineering is good as this process become harder and harder especially in those environments where the dataset is large and complex.
3.1 Architecture and Working of Neural Networks
Neural Networks take input data in the form of processed features and make predictions by learning patterns between input and output features. To make accurate predictions, output results are compared to the desired results. The more the data is provided the better the learning and predictions will be. If the actual output results are not equal to or near to desired output results then the architecture, internal weights, and internal states are adjusted to make correct predictions.
Deep neural networks such as artificial neural network (ANN), recurrent neural networks (RNN) [35], convolutional neural networks (CNN) [36], and deep autoencoders [37] differs from traditional ML algorithms in that they use hidden layers (the number of hidden layers can vary from 1 to thousands). Each hidden layer accepts the features that come from the previous layers, transforms them, and makes the desired operations. Each hidden layer performs some feature engineering tasks as each layer extracts some meaning from the data that was received from the previous layer. Deep neural networks can extract meaningful information from any type of data using the same computations. This means that whether the data is in the form of images or text, the same computational model and training process will be used to extract information from them. During the initial stages of the training process of neural networks, random weights are assigned to neuron synapses, biasness is added to the input vectors, predictions are made, and the actual result is compared to the desired result. For reducing prediction costs and errors, the weights and vectors are adjusted to produce more accurate results in the next training cycle. The training process of neural networks is continued until the difference between the actual predicted results and the desired result is minimal. Considering the nature of the data, out of many DL algorithms, the ANN algorithm was selected for modeling the COVID-19 spread process and future prediction. ANN works similar to the way the human brain analyzes and processes information for making decisions [38]. Like other DL algorithms, ANNs have self-learning capabilities, which enable them to produce more accurate predictions as more data is provided. A common and popular type of technique called backpropagation is often used by ANN for learning rules and minimizing the error between actual results and predicted results. As now more and more data is generated by various companies, the practical applications of ANNs are far and wide targeting fields such as education, finance, business, industry, natural language processing (NLP), traffic safety [39], self-driving cars, and identifying spam emails, etc. [40–42].
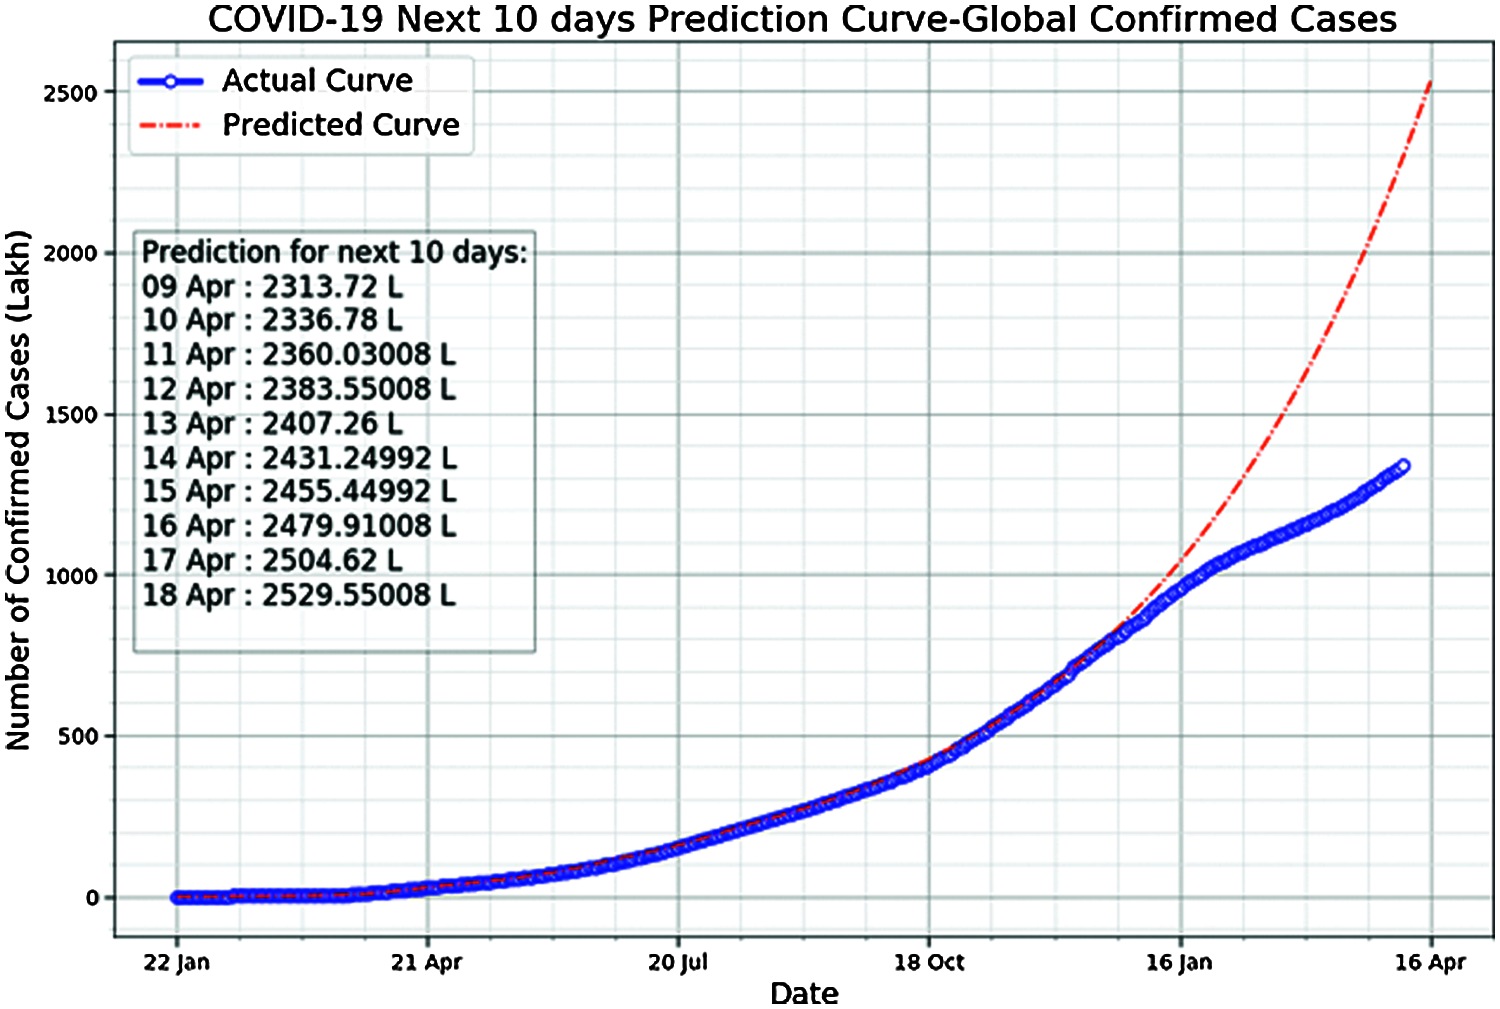
Figure 5: Actual spread curve vs. ANN predicted curve and the next 10 days predictions made by the ANN model
3.2 COVID-19 Modeling and Global Predictions
For modeling COVID-19 spread and making future predictions, the following parameters were set for the ANN configuration and training process. The parameters included the number of neurons at the input layer, the total number of hidden layers, the number of neurons at each hidden layer, the activation functions used in the hidden layers and the output layers, the number of neurons at the output layer, and the number of epochs. The architecture of ANN included 441 neurons at the input layer, 4 hidden layers each having 90 neurons, and one output layer having one neuron. The Leaky ReLU activation function was used in the neurons of the hidden layer to accept, process, and transform the data to subsequent layers. For the configuration and training ANN, a total of 13,201 parameters were used. Moreover, for ANN modeling compilation, the optimizer was set to Adams, the mean squared error was used to measure the model loss whereas accuracy was used as a metric.
The data on the graph in Fig. 5 shows the next 10 days’ predictions made by the ANN model. We can note that the predicted curve is the same as the actual curve from 22 January 2020 to 16 January 2021 but later spread away from the actual curve. The reason for the predicted curve to spread away from the actual curve is that the ANN model is making predictions on previously available COVID-19 cases data and is trained according to previous data. Due to preventive measures followed across the world, the actual curve moves down showing the fewer number of confirmed cases than was predicted.
When trained for the prediction of global death cases, the ANN model showed a similar curve to that of global confirmed cases. The predicted curve in Fig. 6 is similar to the actual curve from 22 January 2019 to 21 April 2019 but later on, up to December 2020, showed a lower number of deaths than the actual deaths. Nonetheless, from 22 January 2019 to December 2020, the predicted curve was very much similar to the actual curve. Interestingly, after December 2020, the predicted curse showed a higher number of death cases than actual deaths. Moreover, the data on the chart presented in Fig. 6 showed predictions for the number of deaths to the next 10 days at the time when this research study was carried out. We noted that the number of deaths increases every day, which is alarming for people globally. The parameters set for training the ANN for global death cases prediction were identical to that of global confirmed cases predictions.
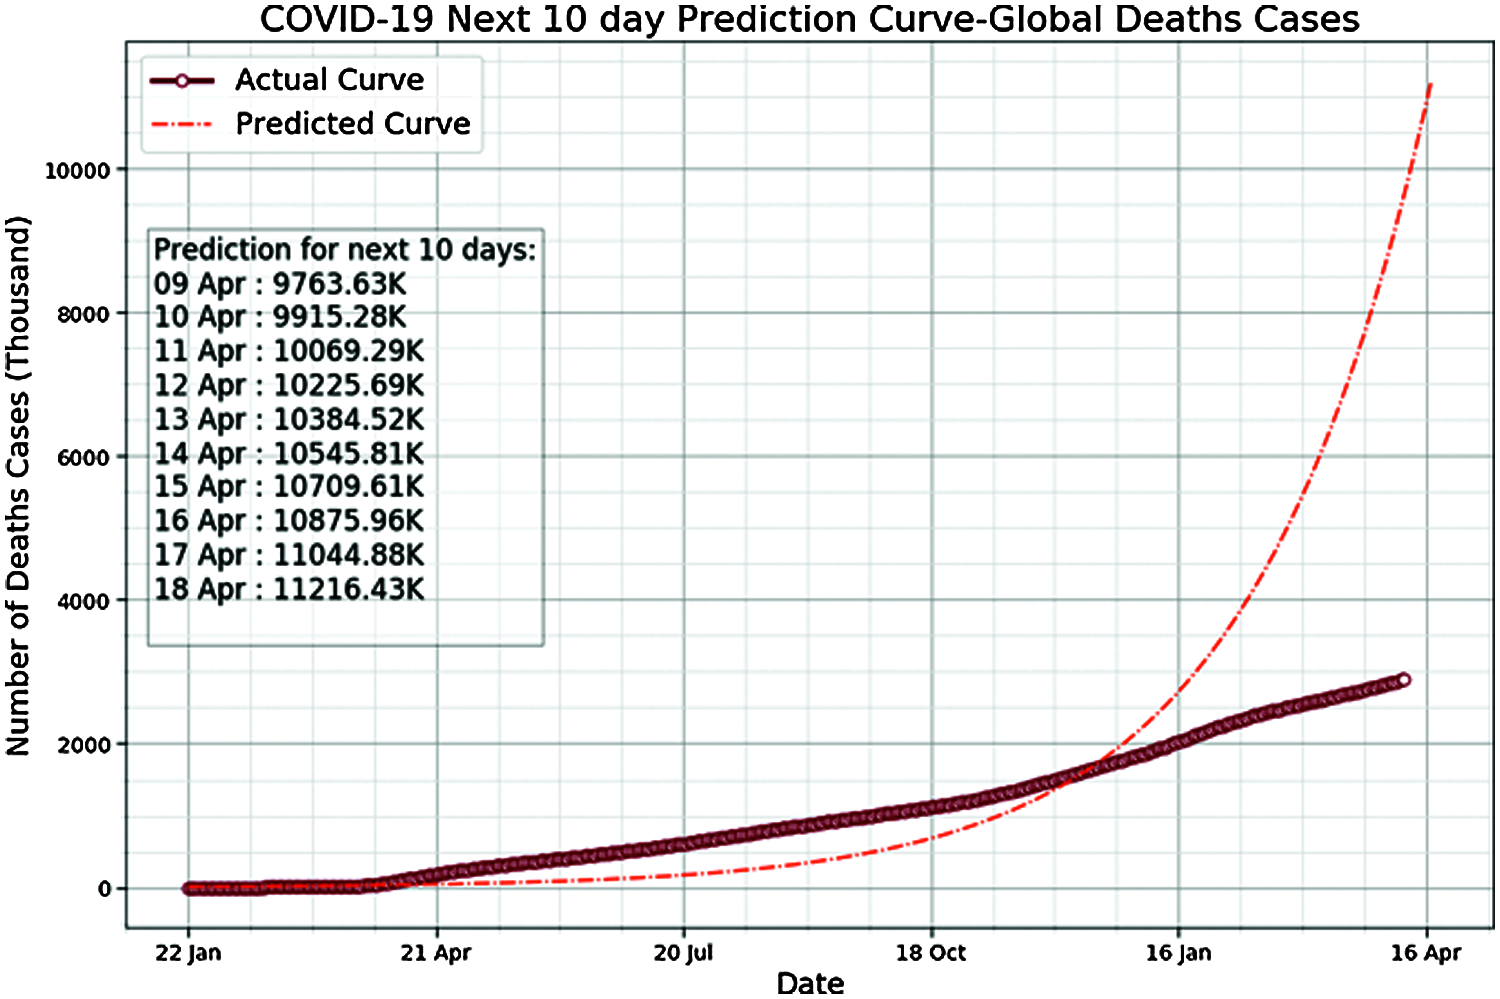
Figure 6: Actual death curve vs. ANN predicted curve and the next 10 days death predictions made by the ANN model
To gain a more accurate and deeper understanding of COVID-19 spread, we plot daily confirmed and death cases from 22 January 2019 to the date shown in Figs. 7 and 8. A rapid increase in confirmed and death cases can be noted from October 2020 onwards, thus urged the global population for strict COVID-19 preventive measures.
3.3 Using ML Techniques for Modeling COVID-19 Spread Predictions
After using the ANN for COVID-19 spread predictions, we used three traditional ML models, namely Support Vector Machine (SVM), Polynomial regression, and Bayesian Ridge Regression (BRR), to predict future COVID-19 cases.
3.3.1 Support Vector Machine (SVM)
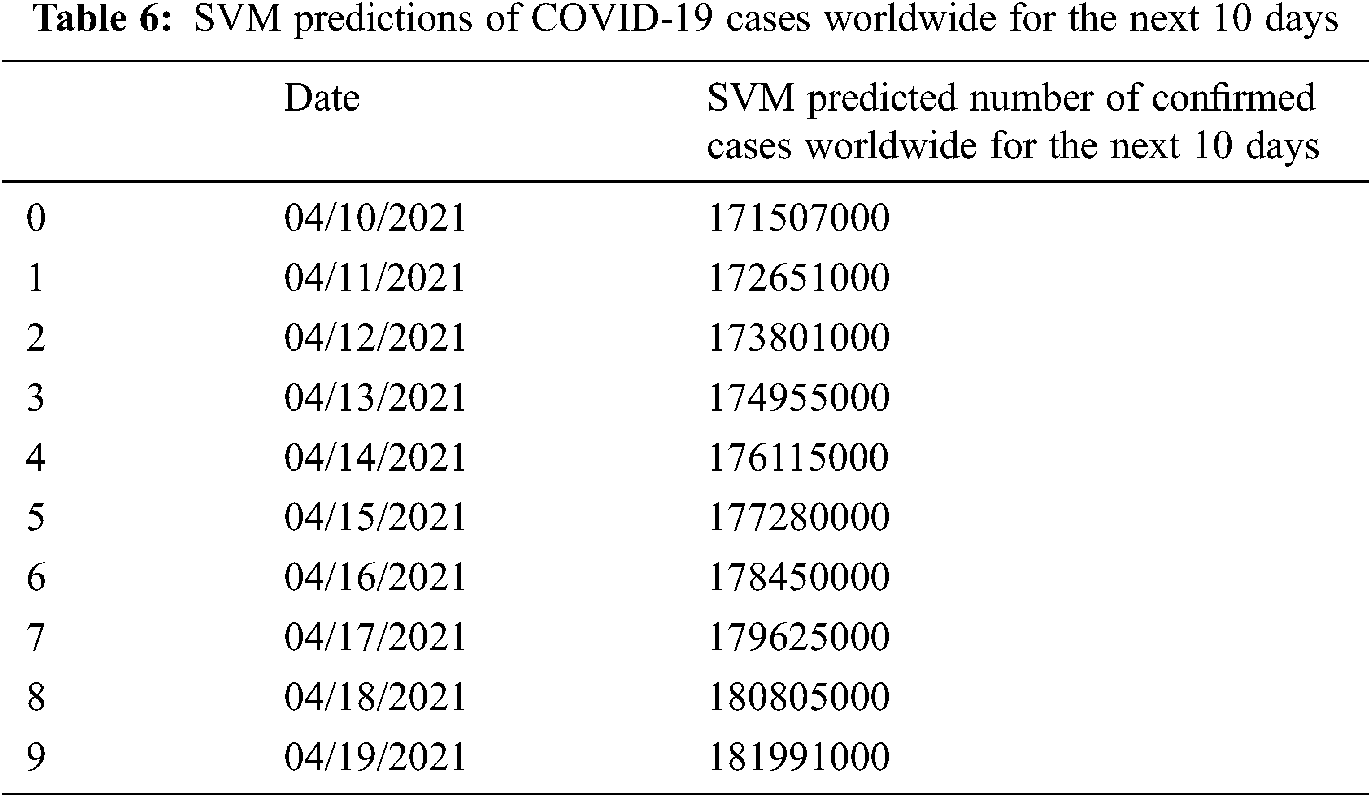
SVM is a supervised ML algorithm generally used for solving classification problems. SVM when provided with the set of labeled training data of each class, can classify a new class. SVM makes categorization by generating a hyperplane that best separates various classes. Fig. 9 shows the SVM future prediction of COVID-19 spread. The SVM model was trained to predict the COVID-19 spread for more than 450 days. In Fig. 9, the blue curve shows the actual confirmed cases worldwide, whereas the red curve indicates the SVM model predictions. We can note that the SVM prediction curve is similar to the actual confirmed cases curve for almost 370 days since 22nd January 2020. However, later, the SVM prediction curve departs away from the curve of the actual case where we can see that the SVM prediction curve is still moving up with the same inclination, whereas the actual confirmed cases curve is stirred down. The reason behind the difference in the confirmed cases curve and SVM prediction curve after 370 days could be a strict preventive measure taken by people to avoid COVID-19 spread and on the SVM model training process, as the model predicts according to the prior data pattern.
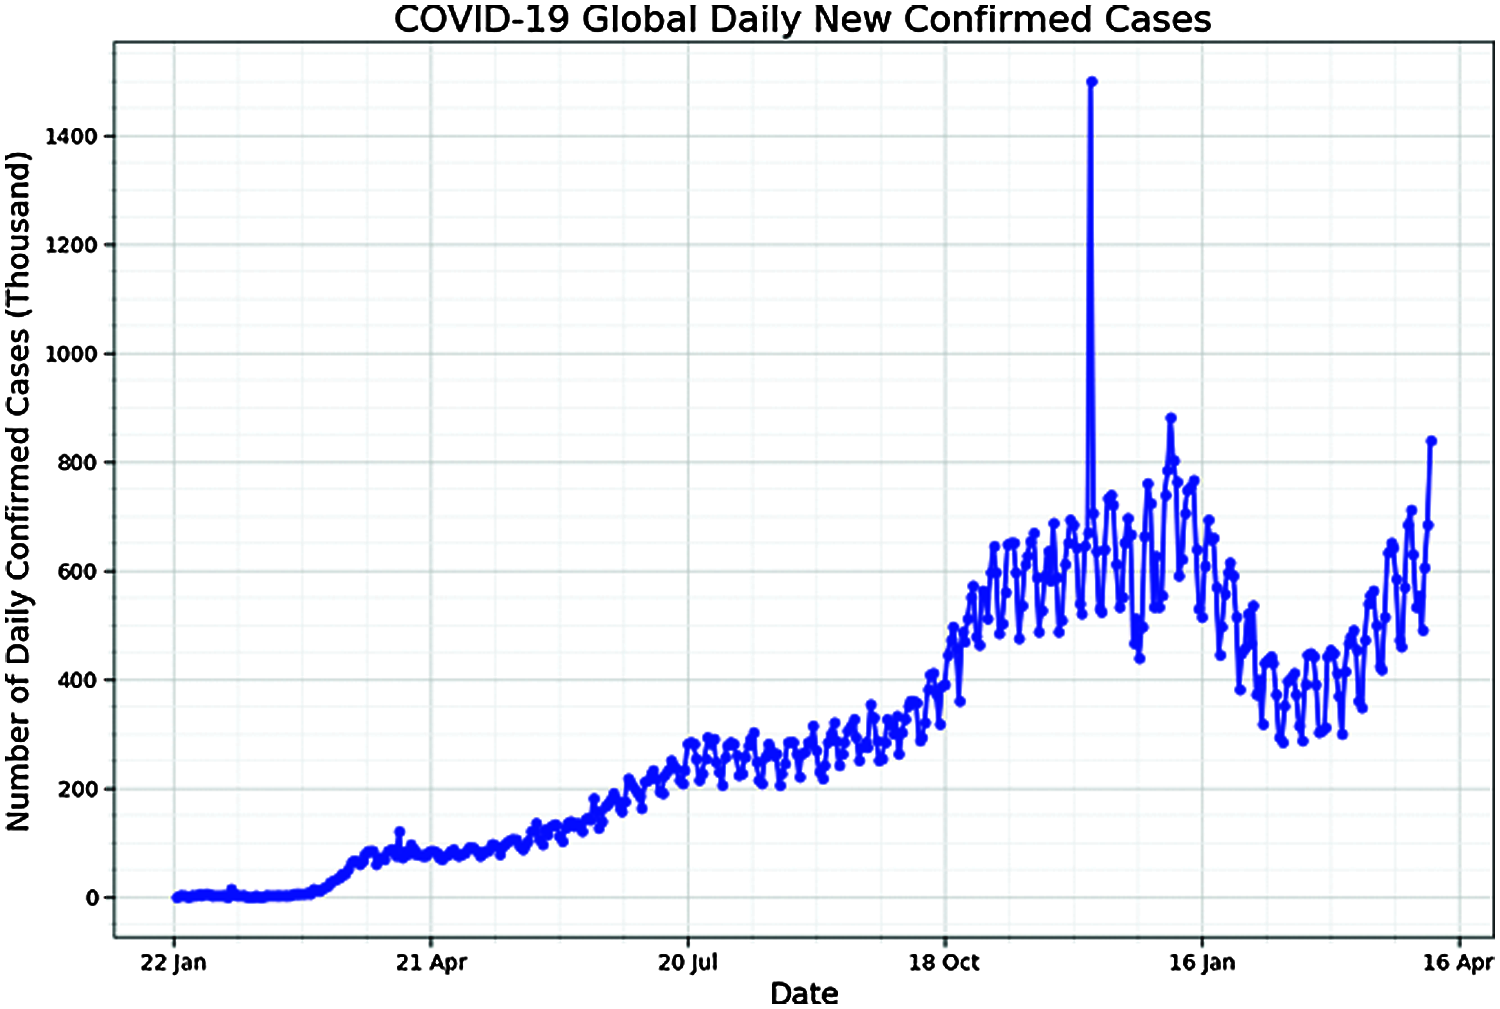
Figure 7: Daily confirmed cases from 22 January 2019 till date
Simple Linear Regression (SLR) is used when we want to determine the relationship between one independent variable and one dependent variable, however, in the case where the relationship between the independent variable and dependent variable is nonlinear, polynomial regression is used. The polynomial regression takes the form:
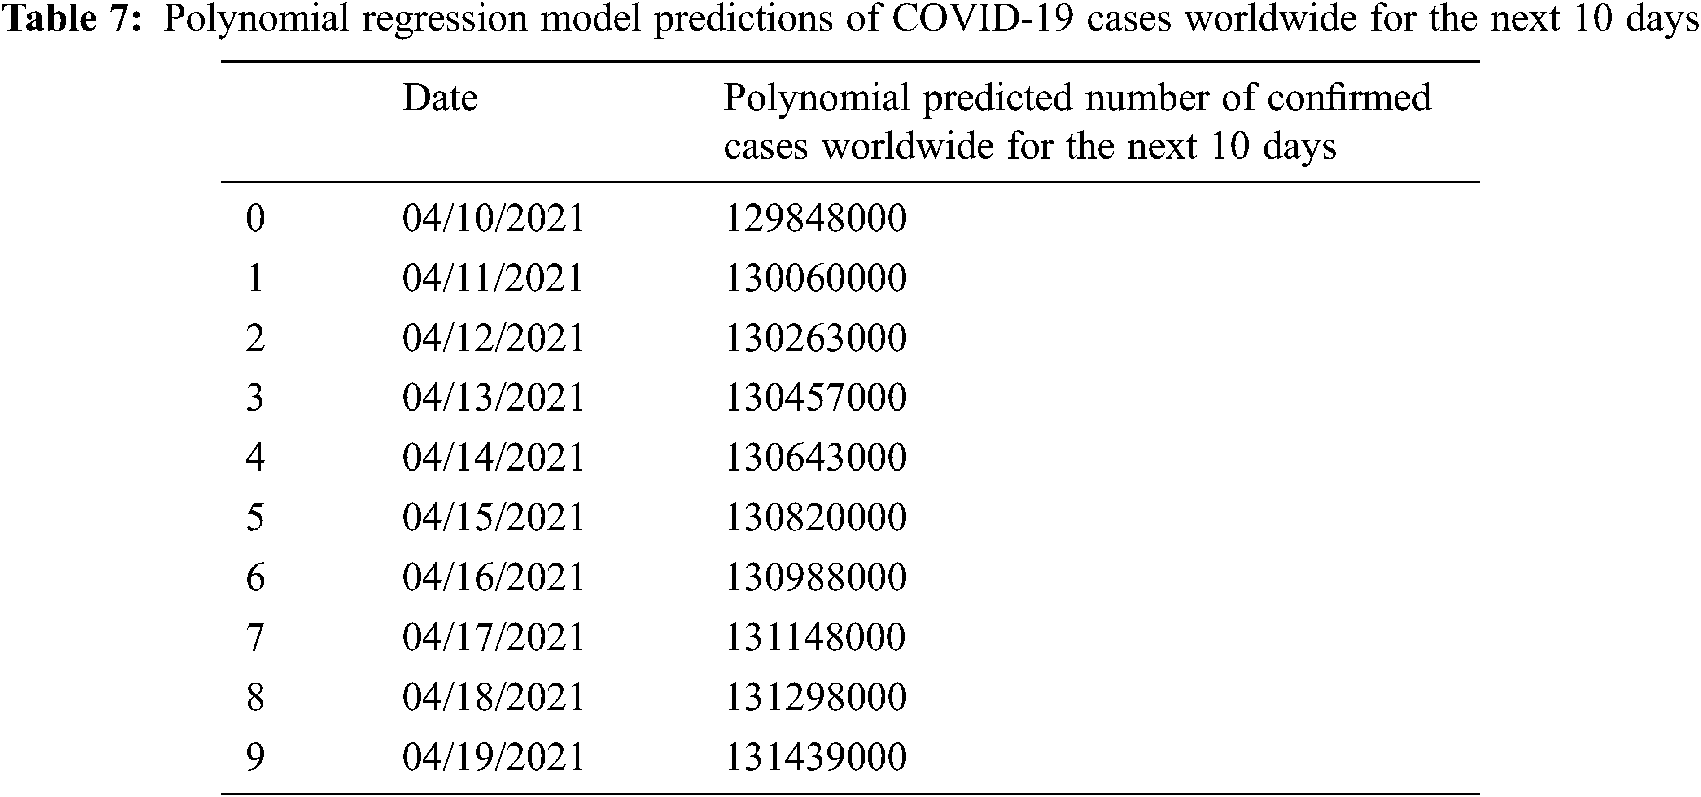
where h denotes the degree of the polynomial. With the increase in the value of h, the polynomial regression model can fit the nonlinear relationship better. The polynomial regression model can also be used when multiple independent variables are trying to predict the dependent variable. Fig. 10 presents the polynomial regression model predictions of COVID-19 spread starting from 22nd January 2020. Looking at the two curves, we can note that the polynomial regression model produced more accurate predictions compared to SVM model predictions. During the first 69 days, the polynomial regression model curve was separated from the curve of the confirmed case due to the lack of training data, but once trained with adequate data, the polynomial regression model was able to predict the COVID-19 more accurately as the predicted curve has almost the same direction as that of the curve of the confirmed case. Next, we discuss how the Bayesian Ridge Regression (BRR) model makes COVID-19 spread prediction.
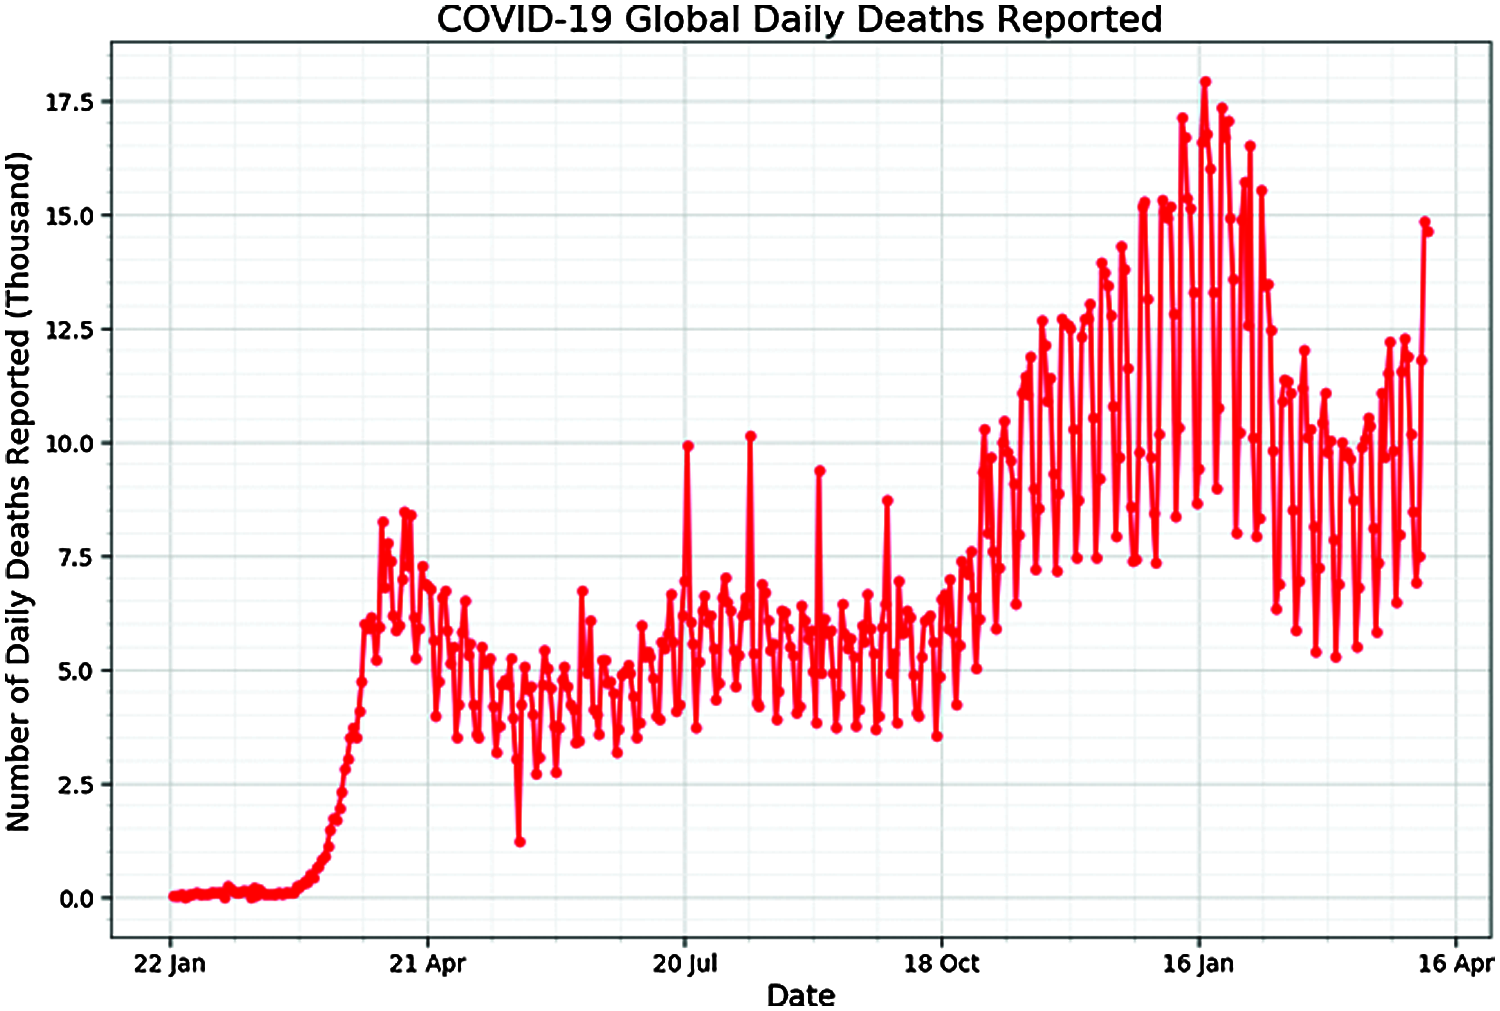
Figure 8: Daily death cases from 22 January 2019 till date
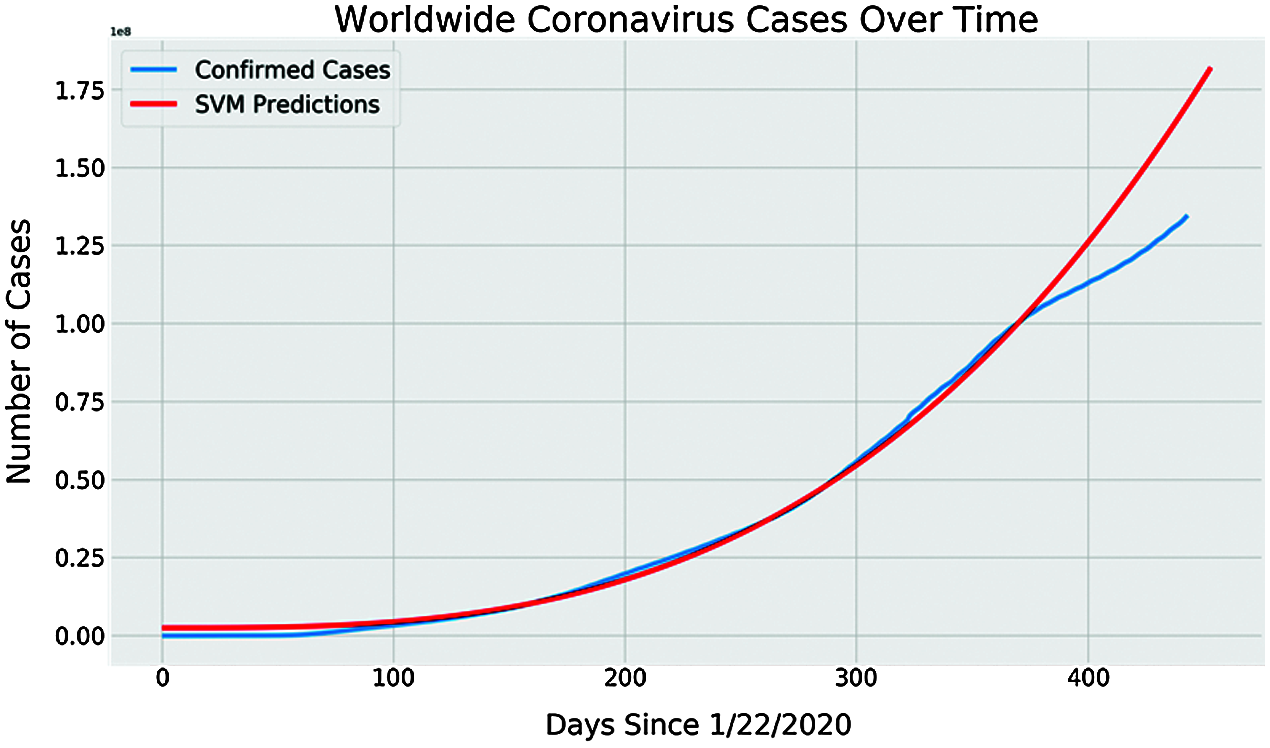
Figure 9: SVM future prediction of COVID-19 spread
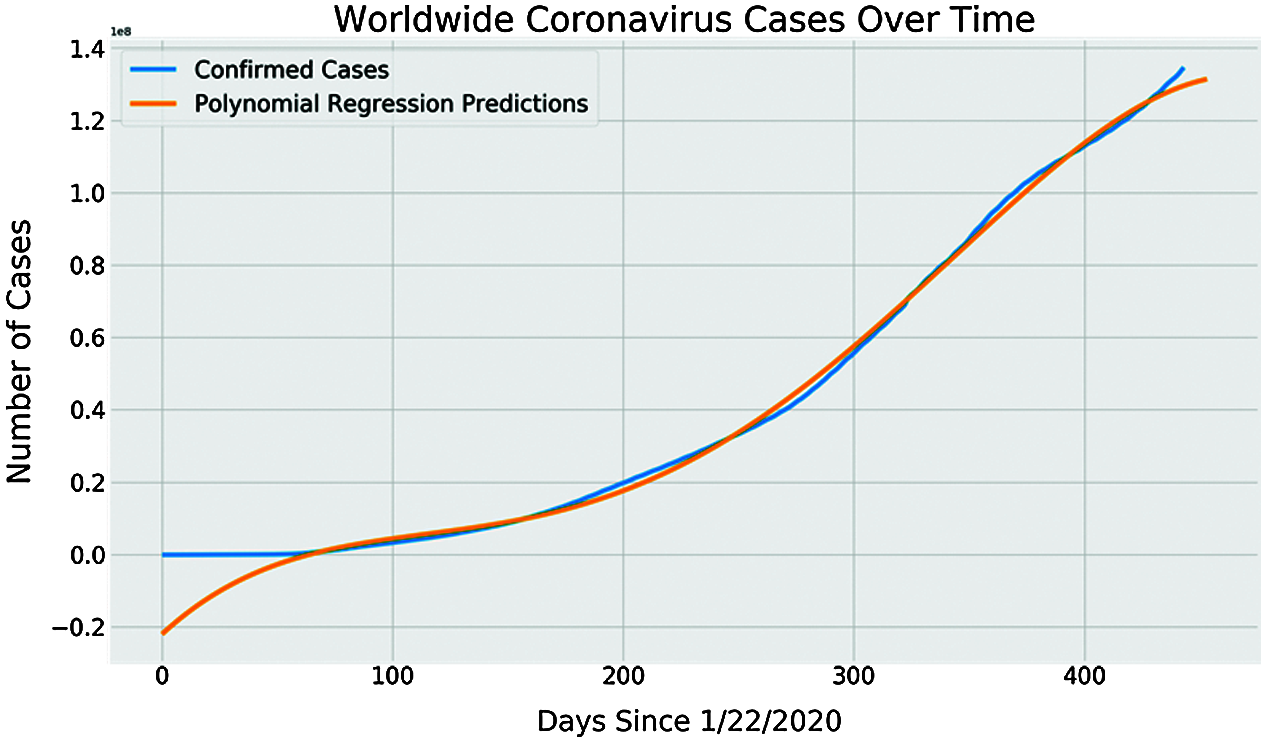
Figure 10: Polynomial regression model predictions of COVID-19 spread starting from 22nd January 2020 and onwards
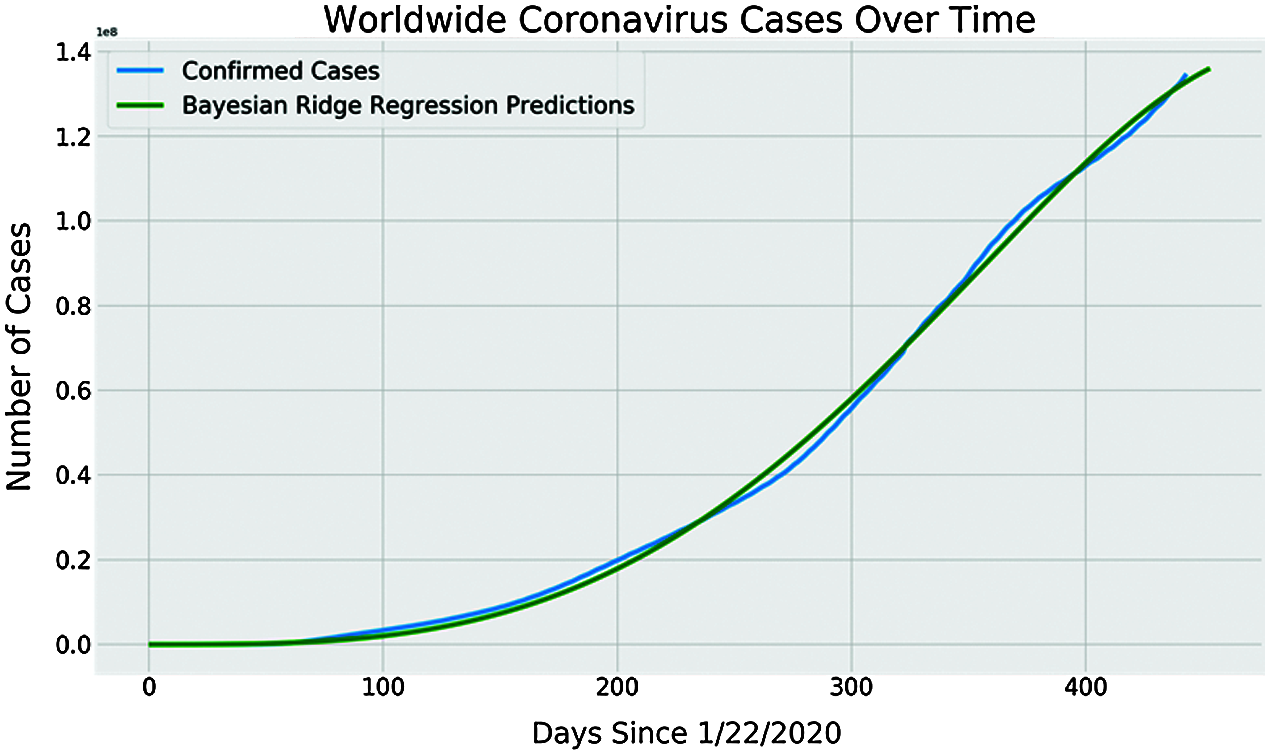
Figure 11: COVID-19 spread prediction model with BRR
To obtain a full BRR model, the predicted value Y is assumed to be Gaussian distributed around XW as shown below.
3.3.3 Bayesian Ridge Regression (BRR) Model COVID-19 Spread Predictions
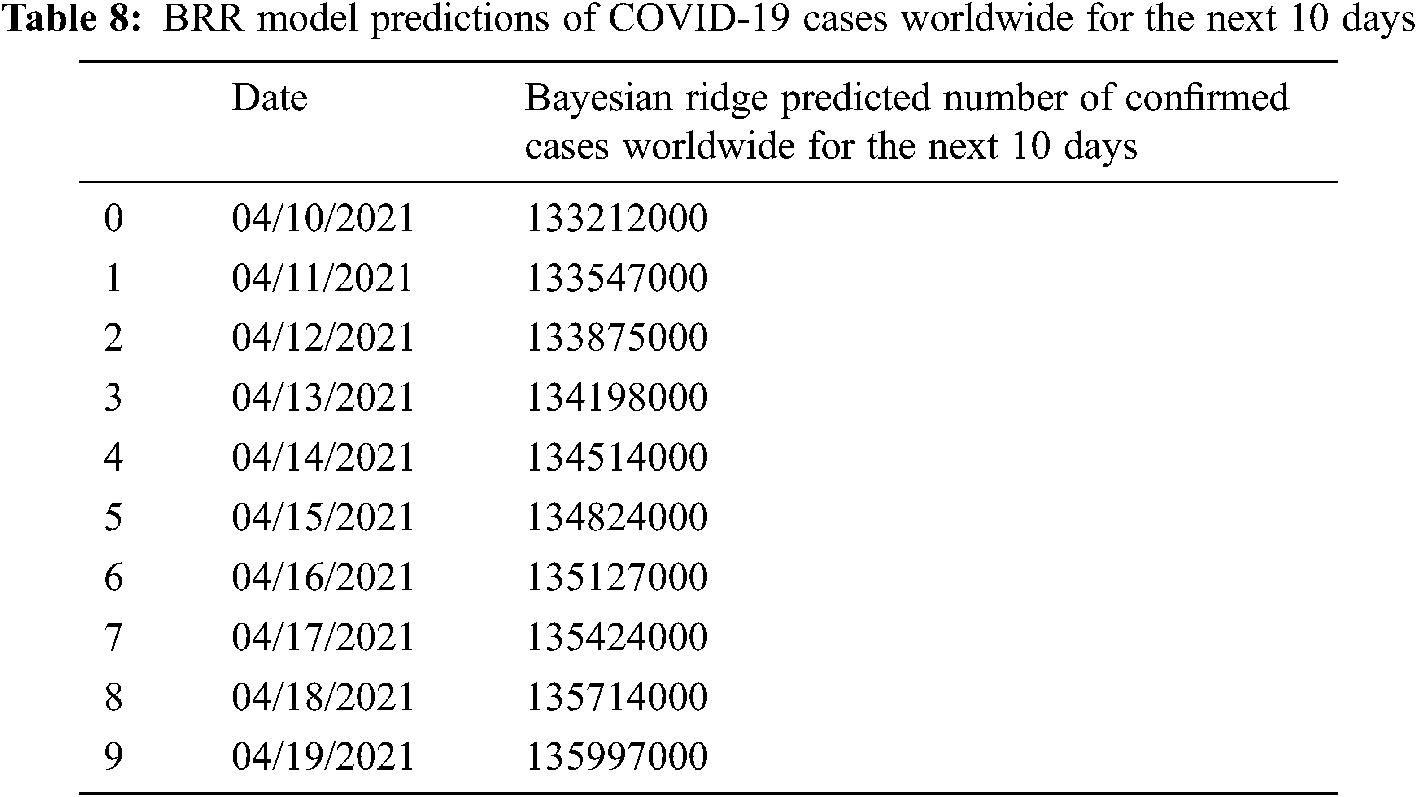
Models trained with BRR allow them to survive in circumstances where the data is poorly distributed or there is insufficient data by using probability distributors for formulating linear problems rather than using point estimates. The prediction is assumed to be drawn from the probability distribution rather than more accurate COVID-19 spread prediction was model with BRR as shown in Fig. 11 where it can be noted that the BRR prediction curve is very much similar to the curve of the confirmed case. Hence the BRR model presents a more accurate prediction of COVID-19 spread compared to SVM and polynomial regression models.
To be more accurate in COVID-19 spread predictions, Tabs. 6–8 present the predicted number of confirmed cases worldwide for the next 10 Days using SVM, polynomial regression, and BRR models. It can be observed that the COVID-19 cases are gradually increasing daily worldwide.
4 Conclusion, Limitations, and Future Work
In this research study, through analyzing and modeling the continuously updated dataset maintained by JOHNS HOPKINS UNIVERSITY, the corresponding DL and ML models were created to predict COVID- 19 spread predictions. Mainly, we modeled the confirmed and death cases worldwide to assist government organizations, medical practitioners, and general masses in analyzing and understanding COVID-19 spread and how can it impact the daily routine. By employing ANN, SVM, Polynomial regression, and BRR models, we predicted the spread pattern of the epidemic and found that the BRR model gives the best prediction curve in terms of the virus spread. Besides, the number of confirmed cases worldwide for the next 10 Days was also predicted using SVM, polynomial regression, and BRR. Additionally, we predict the virus spread development in the seven continents and for other smaller countries not included in any continent. The study will help people in understanding the possible epidemic outbreak, its causes, preventive measures, corresponding control time, and tracing the spread of the virus among the general masses. In the future, we would like to establish models that predict the virus spread locally, i.e., within countries or one area. Moreover, DL algorithms such as recurrent neural networks (RNNs) and Long Short-Term Memory (LSTM) model the spread of the virus daily and tracing the earliest possible transmission causes of it.
Funding Statement: This study was financially supported via a funding grant by the Deanship of Scientific Research, Taif University Researchers Supporting Project number (TURSP-2020/300), Taif University, Taif, Saudi Arabia.
Conflicts of Interest: The authors declare that they have no conflicts of interest to report regarding the present study.
1. A. Cartenì, L. Di Francesco and M. Martino, “How mobility habits influenced the spread of the covid-19 pandemic: Results from the italian case study,” Science of the Total Environment, vol. 741, no. 1, pp. 140489, 2020. [Google Scholar]
2. F. B. Hamzah, C. Lau, H. Nazri, D. V. Ligot, G. Lee et al., “Coronatracker: Worldwide covid-19 outbreak data analysis and prediction,” Bull World Health Organ, vol. 91, no. 4, pp. 264, 2020. [Google Scholar]
3. C. Hoffmann and E. Wolf, “Older age groups and country-specific case fatality rates of covid-19 in Europe, USA and Canada,” Infection, vol. 49, no. 1, pp. 111–116, 2021. [Google Scholar]
4. C. Sohrabi, Z. Alsafi, N. O’Neill, M. Khan, A. Kerwan et al., “World Health Organization declares global emergency: A review of the 2019 novel coronavirus (COVID-19),” Int. Journal of Surgery, vol. 76, no. 1, pp. 71–76, 2020. [Google Scholar]
5. R. Rubin, “The challenge of preventing covid-19 spread in correctional facilities,” Jama, vol. 323, no. 18, pp. 1760–1761, 2020. [Google Scholar]
6. T. Galbadage, B. M. Peterson and R. S. Gunasekera, “Does COVID-19 spread through droplets alone?,” Frontiers in Public Health, vol. 8, no. 1, pp. 7582, 2020. [Google Scholar]
7. H. H. Elmousalami and A. E. Hassanien, “Day level forecasting for coronavirus disease (covid-19) spread: Analysis, modeling and recommendations,” arXive, pp. 1–19, 2020. [Google Scholar]
8. K. Yu, L. Tan, X. Shang, J. Huang, G. Srivastava et al., “Efficient and privacy-preserving medical research support platform against COVID-19: A blockchain-based approach,” IEEE Consumer Electronics Magazine, vol. 10, no. 2, pp. 111–120, 2021. [Google Scholar]
9. L. Zhen, A. K. Bashir, K. Yu, Y. D. Al-Otaibi, C. H. Foh et al., “Energy-efficient random access for LEO satellite-assisted 6g internet of remote things,” IEEE Internet of Things Journal, vol. 8, no. 7, pp. 5114–5128, 2021. [Google Scholar]
10. L. Tan, H. Xiao, K. Yu, M. Aloqaily and Y. Jararweh, “A blockchain-empowered crowdsourcing system for 5G-enabled smart cities,” Computer Standards & Interfaces, vol. 76, no. 2, pp. 103517, 2021. [Google Scholar]
11. P. Lemenkova, “Processing oceanographic data by python libraries numpy, scipy and pandas,” Aquatic Research, vol. 2, no. 2, pp. 73–91, 2019. [Google Scholar]
12. C. R. Harris, K. J. Millman, S. J. van der Walt, R. Gommers, P. Virtanen et al., “Array programming with NumPy,” Nature, vol. 585, no. 7825, pp. 357–362, 2020. [Google Scholar]
13. E. Bisong, Matplotlib and Seaborn. Building Machine Learning and Deep Learning Models on Google Cloud Platform. Springer, pp. 151–165, 2019. [Google Scholar]
14. F. Niephaus, E. Krebs, C. Flach, J. Lincke and R. Hirschfeld, “Polyjus: A squeak/smalltalk-based poly- glot notebook system for the graalvm,” in Proc. of the Conf. Companion of the 3rd Int. Conf. on Art, Science, and Engineering of Programming, pp. 1–5, 2019. [Google Scholar]
15. T. B. Arnold, “Arnold, kerasr: R interface to the keras deep learning library,” Journal of Open Source Software, vol. 2, no. 14, pp. 296, 2017. [Google Scholar]
16. I. Stancˇin and A. Jovic, “An overview and comparison of free python libraries for data mining and big data analysis,” in 2019 42nd Int. Convention on Information and Communication Technology, Electronics and Microelectronics (MIPRO). IEEE, Opatija, Croatia, pp. 977–982, 2019. [Google Scholar]
17. L. Pappalardo, F. Simini, G. Barlacchi and R. Pellungrini, “scikit-mobility: A python library for the analysis, generation and risk assessment of mobility data,” Journal of Statistical software, pp. 1–25, 2021. [Google Scholar]
18. E. Dong, H. Du and L. Gardner, “An interactive web-based dashboard to track COVID-19 in real time,” Lancet Infectious Diseases, vol. 20, no. 5, pp. 533–534, 2020. [Google Scholar]
19. H. Li, S. M. Liu, X. H. Yu, S. L. Tang and C. K. Tang, “Coronavirus disease 2019 (COVID-19Current status and future perspectives,” Int. Journal of Antimicrobial Agents, vol. 55, no. 5, pp. 105951, 2020. [Google Scholar]
20. I. Ahmad, M. Basheri, M. J. Iqbal and A. Rahim, “Performance comparison of support vector machine, random forest, and extreme learning machine for intrusion detection,” IEEE Access, vol. 6, no. 1, pp. 33789–33795, 2018. [Google Scholar]
21. X. Cheng, B. Khomtchouk, N. Matloff and P. Mohanty, “Polynomial regression as an alternative to neural nets,” arXive, pp. 1–23, 2019. [Google Scholar]
22. W. Xu, X. Liu, F. Leng and W. Li, “Blood-based multi-tissue gene expression inference with Bayesian ridge regression,” Bioinformatics, vol. 36, no. 12, pp. 3788–3794, 2020. [Google Scholar]
23. Z. Guo, Y. Shen, A. K. Bashir, M. Imran, N. Kumar et al., “Robust spammer detection using collaborative neural network in internet of thing applications,” IEEE Internet of Things Journal, vol. 2, no. 1, pp. 1–11, 2020. [Google Scholar]
24. Z. Guo, K. Yu, A. Jolfaei, A. K. Bashir, A. O. Almagrabi et al., “A fuzzy detection system for rumors through explainable adaptive learning,” IEEE Transactions on Fuzzy Systems, vol. 1, no. 2, pp. 15–26, 2021. [Google Scholar]
25. Samina Amin and M. Irfan Uddin, “Machine learning approach for covid-19 detection on twitter,” Computers, Materials & Continua, vol. 68, no. 2, pp. 2231–2247, 2021. [Google Scholar]
26. F. Osisanwo, J. Akinsola, O. Awodele, J. Hinmikaiye, O. Olakanmi et al., “Supervised machine learning algorithms: classification and comparison,” Int. Journal of Computer Trends and Technology (IJCTT), vol. 48, no. 3, pp. 128–138, 2017. [Google Scholar]
27. O. I. Abiodun, A. Jantan, A. E. Omolara, K. V. Dada, N. A. Mohamed et al., “State-of-the-art in artificial neural network applications: A survey,” Heliyon, vol. 4, no. 11, pp. e00938, 2018. [Google Scholar]
28. M. Irfan Uddin, Atif Khan and Muhammad Adnan Gul, “Impact of lexical features on answer detection model in discussion forums,” Complexity, vol. 2021, no. 1, pp. 1–8, 2021. [Google Scholar]
29. M. Usama, J. Qadir, A. Raza, H. Arif, K. L. A. Yau et al., “Unsupervised machine learning for networking: Techniques, applications and research challenges,” IEEE Access, vol. 7, no. 1, pp. 65579–65615, 2019. [Google Scholar]
30. N. Shi, L. Tan, W. Li, X. Qi and K. Yu, “A blockchain-empowered aaa scheme in the large-scale hetnet,” Digital Communications and Networks, vol. 2, no. 1, pp. 11–21, 2020. [Google Scholar]
31. A. Chakrabarty, N. Mansoor, M. I. Uddin, M. H. Al-adaileh, N. Alsharif et al., “Prediction approaches for smart cultivation: A comparative study,” Complexity, vol. 2021, no. 1, pp. 1–11, 2021. [Google Scholar]
32. M. Roman, A. Shahid, M. I. Uddin, Q. Hua and S. Maqsood, “Exploiting contextual word embedding of authorship and title of articles for discovering citation intent classification,” Complexity, vol. 2021, no. 1, pp. 1–15, 2021. [Google Scholar]
33. A. Shrestha and A. Mahmood, “Review of deep learning algorithms and architectures,” IEEE Access, vol. 7, no. 1, pp. 53040–53065, 2019. [Google Scholar]
34. J. Zhang, K. Yu, Z. Wen, X. Qi and A. K. Paul, “3d reconstruction for motion blurred images using deep learning-based intelligent systems,” Computers Materials & Continua, vol. 66, no. 2, pp. 2087–2104, 2021. [Google Scholar]
35. A. Sherstinsky, “Fundamentals of recurrent neural network (RNN) and long short-term memory (LSTM) network,” Physica D: Nonlinear Phenomena, vol. 404, no. 8, pp. 132306, 2020. [Google Scholar]
36. M. Tan and Q. Le, “Efficientnet: Rethinking model scaling for convolutional neural networks,” in Int. Conf. on Machine Learning, PMLR, Long Beach, California, USA, pp. 6105–6114, 2019. [Google Scholar]
37. F. Zhuang, X. Cheng, P. Luo, S. J. Pan and Q. He, “Supervised representation learning: Transfer learning with deep autoencoders,” in Twenty Fourth Int. Joint Conf. on Artificial Intelligence, Buenos Aires, Argentina, pp. 4119–4125, 2015. [Google Scholar]
38. Z. Guo, K. Yu, Y. Li, G. Srivastava and J. C. W. Lin, “Deep learning-embedded social internet of things for ambiguity-aware social recommendations,” IEEE Transactions on Network Science and Engineering, vol. 1, no. 1, pp. 1–12, 2021. [Google Scholar]
39. K. Yu, L. Lin, M. Alazab, L. Tan and B. Gu, “Deep learning-based traffic safety solution for a mixture of autonomous and manual vehicles in a 5g-enabled intelligent transportation system,” IEEE Transactions on Intelligent Transportation Systems, vol. 2, no. 1, pp. 1–11, 2020. [Google Scholar]
40. V. Strilets, N. Bakumenko, S. Chernysh, M. Ugryumov and V. Donets, “Application of artificial neural networks in the problems of the patient’s condition diagnosis in medical monitoring systems,” Integrated Computer Technologies in Mechanical Engineering, vol. 1113, no. 1, pp. 173–185, 2020. [Google Scholar]
41. A. Onaolapo and K. Akindeji, “Application of artificial neural network for fault recognition and classification in distribution network,” in Southern African Universities Power Engineering Conf. Robotics and Mechatronics Pattern Recognition Association of South Africa, Bloemfontein, South Africa, pp. 299–304, 2019. [Google Scholar]
42. K. P. Yu, L. Tan, M. Aloqaily, H. Yang and Y. Jararweh, “Blockchain-enhanced data sharing with traceable and direct revocation in IIOT,” IEEE Transactions on Industrial Informatics, vol. 1, no. 2, pp. 1–10, 2021. [Google Scholar]
 | This work is licensed under a Creative Commons Attribution 4.0 International License, which permits unrestricted use, distribution, and reproduction in any medium, provided the original work is properly cited. |