DOI:10.32604/iasc.2022.020464
| Intelligent Automation & Soft Computing DOI:10.32604/iasc.2022.020464 | |
| Article |
Prediction of Transformer Oil Breakdown Voltage with Barriers Using Optimization Techniques
1Department of Electrical Engineering, College of Engineering, Taif University, Taif, 21944, Saudi Arabia
2Electrical Power and Machines Department, Faculty of Engineering, Kafr Elsheikh University, Kafr Elsheikh, Egypt
3Electrical Engineering Department, Faculty of Engineering, Suez University, Suez, 43533, Egypt
*Corresponding Author: Sherif S. M. Ghoneim. Email: s.ghoneim@tu.edu.sa
Received: 25 May 2021; Accepted: 27 July 2021
Abstract: A new procedure to optimally identifying the prediction equation of oil breakdown voltage with the barrier parameters’ effect is presented. The specified equation is built based on the results of experimental works to link the response with the barrier parameters as the inputs for hemisphere-hemisphere electrode gap configuration under AC voltage. The AC HV is applied using HV Transformer Type (PGK HB-100 kV AC) to the high voltage electrode in the presence of a barrier immersed in Diala B insulating oil. The problem is formulated as a nonlinear optimization problem to minimize the error between experimental and estimated breakdown voltages (VBD). Comprehensive comparative analyses are addressed using three recent innovative marine predators, grey wolf, and equilibrium optimization algorithms to reduce the error between the experimental and estimated breakdown voltages. In addition, the experimental results are expressed in two different models via grey and real coding. Finally, simulation results are conducted with statistical indices that show the effectiveness of the proposed models for experimental verification. The total percentage errors of the tested samples between the observed and estimated VBD are 1.207, 1.222, and 1.207 for EO, GWO, MPA, respectively. The marine predator algorithm has the best performance compared with the other two competitive algorithms for grey and actual codes.
Keywords: Insulating oil; barrier effect; prediction equation; marine predators optimization; grey wolf optimization; equilibrium optimization
The insulating oils are used for cooling and insulating purposes in the high voltage (HV) apparatus. The HV apparatus’s failure comes from defects in its insulating systems, such as oil in the transformer. Therefore, enhancing the dielectric strength of the insulating oil is the main task in research [1]. The barrier is a technique utilized to increase the breakdown voltage (VBD) of the insulating oil because it prevents particle movements and avoids the charge development inside the insulating oil [1,2].
Several works discussed the effect of barrier parameters (barrier effect) on the dielectric strength of the insulating oil, such as gap space (d) between the electrode system, the barrier position in the gap space (a/d), the barrier diameter (D), the barrier thickness (th), the electrode configuration, and the oil temperature [1–5].
Gohneim et al. [6] built a prediction equation linking the VBD of the mineral insulating oil with the barrier location in the gap space (a/d)%, the relative permittivity of the barrier materials (εr), the hole radius in the barrier (hr), the barrier thickness (th), and inclined barrier angle (θ) based on the design of experiments (DOE). Jaroszewski et al. [7] investigated the effect of barrier position and its shape on the dielectric strength of cone-plane electrode arrangement immersed in ester oil. Mohd et al. [8] investigated the impact of barrier parameters on the VBD under the inhomogeneous field of a sphere to cone electrode and the homogenous field of the sphere-sphere electrode system when applying AC voltage at 50 Hz. The effect of several barrier parameters was illustrated, such as the gap length, barrier location, and electrode covering, and barrier with the solid insulation.
The researchers tried to build a prediction equation related to the barrier parameters and the VBD of the insulation oils [1–3]. These works were carried out using the Design of Experiments (DOE) technique based on the results of the experimental outcomes. The advantage of the DOE is building the relationship between the inputs and output of a specific experiment with a few experiment runs that decrease the experimental works’ cost. Zitouni et al. [3] presented a relation between the VBD of the insulating oil and some barrier parameters such as the d, (a/d), and D based on the central composite face (CCF), which is one of DOE techniques when applying AC voltage on point-plane gap configuration. Statistical analysis was accomplished to investigate which barrier parameter significantly affects VBD using t-test, P-value, and other statistical parameters. The results explained that the errors between the actual and estimated VBD were significant and exceeded 16% in some cases. Gohneim et al. [1] tried to decrease the error between measured and estimated VBD using Box Behnken Design (BBD), another DOE technique when applying AC voltage hemisphere-to-hemisphere gap configuration. A comparison between CCF results in [3] and BBD in [1] was carried out and indicated that using BBD decreased the error between the measured and estimated VBD.
In this work, a new prediction equation based on the experimental results was developed to explain the relationship between the response (VBD) and the barrier parameters (d, (a/d), and D) using the artificial intelligent optimization technique. The second-order quadratic form is suitable as in (1);
Y is the response representing the VBD. X1, X2, and X3 are the input variables that affect the response referring to d, a/d, and D in the proposed work. The a0 is the constant term that gives the response value when the input variables are zero, and ε refers to the error. Finally, the a0–a9 expresses the equations’ coefficients.
Continuous development in optimization algorithms encourages many researchers to develop these methods for their applications. Among these methods, there are three optimizers, with recent applications in the power system domain, called equilibrium optimizations [9–13], Marine predators [14–18], grey wolf [19–23], and that were characterized with good performances as were reported in the literature [9–23]. The marine predators’ optimizer mimics the different strategies followed by the predators for hunting the prey. The grey wolf optimization explains the social gradation and pack-based hunting process of grey wolves in nature. Finally, the equilibrium optimization simulates the equilibrium states like mass balance models. In this study, these methods are employed to construct a prediction equation between the VBD and the barrier parameters and achieve minor error between the estimated and measured VBD with a few numbers of the experimental runs. The work’s main objective is to decrease the error between the measured and estimated VBD rather than the other techniques. Not only that, but also the experimental results are expressed via grey coding and actual measurements.
The main contribution of the current work can be summarized as follows:
• First, proposing three recent optimization techniques for finding the optimal parameters of the prediction equation of the VBD on the insulating oil in the presence of barriers.
• Two applications, grey and real-based modules, are employed for proving the capability of the proposed optimizers.
• The results are aggregated by applying the AC voltage on the hemisphere-hemisphere gap configuration in the presence of a barrier.
• The prediction equation is built with only a few experiment runs then decreases the cost of the experiment.
• The results indicated the optimization techniques, mainly marine predators, decreased the error between the measured and predicted VBD.
• The solution robustness is proved via statistical indices and comparative convergence curves.
• The high closeness between the measured and estimated models for testing data is observed.
The research gap related to the current work is how to use a few experimental observations to build a prediction equation to facilitate oil VBD computation based on the barrier parameters. Furthermore, how to reduce the errors between the actual and predicted oil VBD using the updated optimizers.
2 Experimental Setup and Its Records
The schematic diagram of the experimental setup is illustrated in Fig. 1. It consists of a tank (25 cm × 25 cm × 35 cm) filling with 18.75 L of insulating oil. The hemisphere-hemisphere electrodes constitute the gap configuration where one is earthed, and the other is the HV electrode. The hemisphere radius is 5 cm. The gap space can be controlled manually using a manual drive. The barrier from acrylic material with 3.5 dielectric constant and 30 kV/mm of dielectric strength. The advantages of using Acrylic as a barrier come from its high strength, which causes a static charge to attract the dust particles, and its excellent resistance to hydrocarbons that develop in the transformer during fault conditions [24]. The AC HV is applied using HV Transformer Type (PGK HB) up to 100 kV AC, and then the voltage is applied on the HV electrode gradually till breakdown. The voltage of PGK HB can be controlled via a selector that uses to increase the voltage gradually. The device includes the voltage measuring devise to illustrate the generated voltage. The insulating oil type was Diala B with the dielectric strength of >30 kV/mm (no treatment) and >70 kV/mm (after treatment) according to international electrotechnical commission IEC 60296 and IEC 60156 [25]. The gap space (d) between the two hemispheres varies as 1, 2, and 3 cm. The barrier was suspended in distances 25%, 50%, 75%, and 100% of the gap length, measuring the barrier place according to the gap space (a/d) %. The barrier diameter (D) varied from 5, 7, and 10 cm to suit with tank size, and the barrier thickness is 2 mm. The experimental works are accomplished in the Extra High Voltage Research Centre of the Egyptian Electricity Holding Company.
2.1 Results for Barrier Location (a/d) % at Different Gap Space (d)
The relationship between a/d% and VBD at different “d” was illustrated in Fig. 2. The (a/d) % was varied as 25%, 50%, 75%, and 100%, i.e., when the gap space is 2 cm, the barrier locates at 0.5, 1, 1.5, and 1.98 cm (due to the thickness of the barrier is 2 mm) from HV electrode. The experimental results explained that the VBD decreased when the barrier moved towards the earthed electrode, which VBD closed to the values without any barrier.
2.2 Results for Barrier Diameter (D) at Different Gap Space (d)
The effect of the barrier diameter (D) on VBD was illustrated in Fig. 3. It is shown that an increase in D led to a rise in the VBD. There was no significant change in VBD with the change of D at 3 cm gap space. The VBD increased when D exceeded the hemisphere diameter, especially at 10 cm. The decrease in D/d increased the VBD, i.e., at constant d, an increase in D associated with VBD. Still, this increase was not significant when d increased with the same value of D. The Effect of D diminished when D was not sufficiently greater than d.
Fig. 4 shows that: d has a significant effect on VBD for the insulating oil with a barrier at D equal to 10 cm. The breakdown voltage of the insulating oil increased when d varied from 1 to 3 cm. The VBD increased from 39 kV at 1 cm of d to 84 kV at 3 cm.

Figure 1: Schematic diagram of experimental setup [1]

Figure 2: The effect of the barrier position on the breakdown voltage at different gap spaces, (gap space (d) = 3 cm, barrier diameter (D) = 5 cm, barrier thickness (th) = 2 mm)

Figure 3: The effect of the barrier diameter on the breakdown voltage at different gap space (d), ((a/d) % = 25, th = 2 mm)
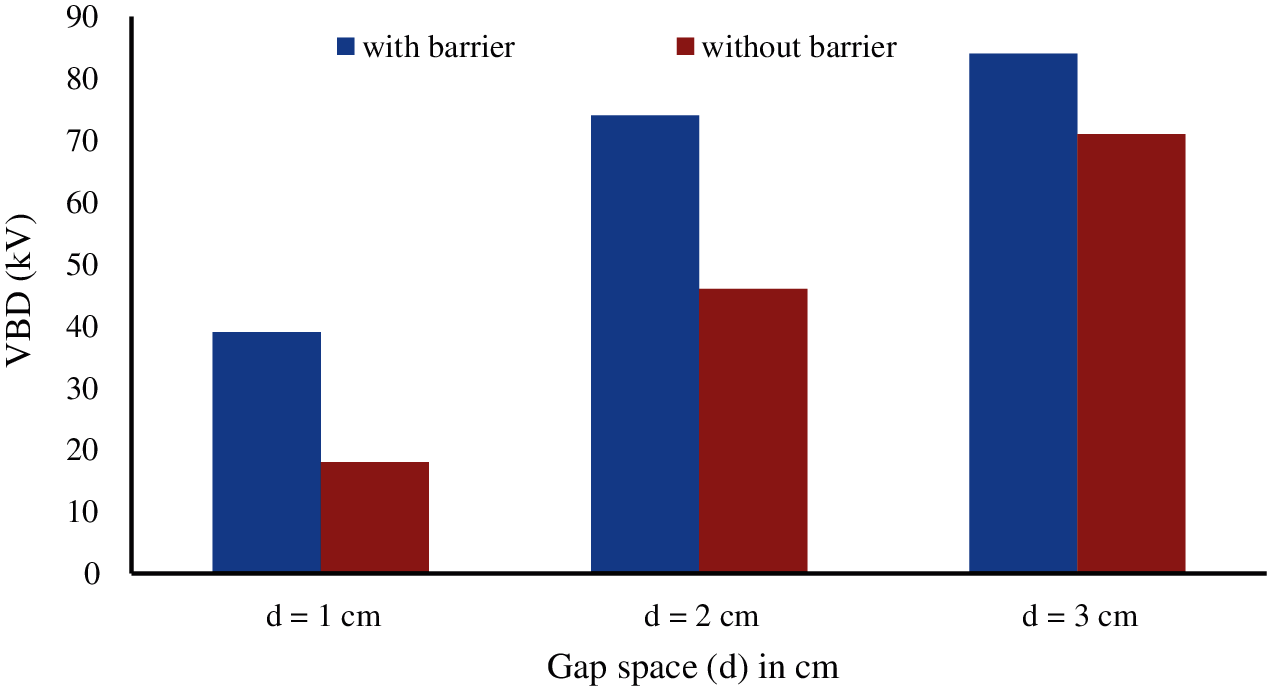
Figure 4: Effect of gap space on the breakdown voltage, (D = 10 cm, (a/d%) = 25, th = 2 mm)
3 Proposed Optimization Algorithms
3.1 Marine Predators Optimization Algorithm (MPOA)
Marine Predators Algorithm (MPA) is a modern nature-inspired optimizer simulated from different methods followed by the predators seeking to hunt the preys [14]. These methods mainly depend on Lévy and Brownian movements progressively advanced via the ecosystem for predators surviving. In MPOA, the predators adopt the suitable chasing and hunting method based on estimating the prey’s velocity, volume, and the encircled environment. The MPOA starts with randomly and uniformly distributed prey’s positions. After that, the top predator is picked out, the fittest solution, and copied to form the Elite matrix [15]. In MPOA, the iterations are considered in three successive portions where three consecutive stages are simulated to describe the searching process of the predators to get the prey [16].
Firstly, the predators are in an exploration phase for observing the encircled region. They run at low speed while the preys have a much higher rate. This scenario is mathematically simulated as follows:
Zi and Z* are the new and current positions of each prey (i), R refers to the vector of random uniformly distributed numbers within the range [0, 1]. The symbol
In the second portion of the MPOA, the transition between exploration and exploitation processes is simulated where the relative speed between the predator and the prey is competitive. In this scenario, the prey is responsible for exploitation while the predator is responsible for exploration. This scenario is mathematically simulated as follows:
where Rn is a random distributed numbers vector that is based on Lévy motion. CIt indicates an adaptive dynamic coefficient that is iteratively varied to adapt to the predator’s locomotion. CIt is mathematically represented as:
In the last portion of the MPOA, the predators hunt the prey, so the predators run faster than their targets. This scenario simulates the exploitation mode in tracking their base. This scenario is mathematically formulated as follows:
where PopS is the population size.
Eqs. (2), (3), and (5) simulate the updating strategy of the prey’s positions which describe the various methods that the predators follow through the iterations. The environmental variations like Fish Aggregating (FA) effects have been supported to be considered in the MPOA as another updating method as:
where ZU and ZL are the vectors related to the upper and lower bounds of the control variables. FA is the probability parameter that represents the effect of fish aggregation. U is the vector of random binary numbers.
After updating the prey’s positions, the Elite matrix and the fitness (Fit) of each prey are upgraded via the memory-saving capability of the predators. It is mathematically formulated in Eqs. (7) and (8):
where E* is the new Elite matrix of the updated positions related to the top predator. ZBt indicates the best position of the prey with the minimum fitness.
3.2 Grey Wolf Optimization Algorithm
Grey Wolf Optimization (GWO) is an effective optimization technique developed in 2014 by Mirjalili et al. [19] to solve complex optimization problems. Essentially, GWO explains the social gradation and pack-based hunting process of grey wolves in nature. They live and hunt in a socially ranked pack. This pack includes four distinct groups of wolves that make up the core of the pack. In the GWO group, alpha (α) is the most powerful member. Beta (β) and delta (Δ) are the remaining subordinates who continue to manage most wolves known to be omega (ω). At the same time, Betas are known to be the helpers of Alphas and the order-transition stage of the Alphas to the remaining Deltas and Omegas. The mathematical simulation of GWO shows that the average value of the best positions is the best solution to the optimization problem is the average of the best positions of Alphas, Betas, and Deltas when hunting the prey [20,21].
When the wolves attempt to kill a target, they work together on a successful hunting strategy described in a series of steps: finding, tracking, engirdling, and attacking. Next, GWO mentions the location of the wolves in addition to the site of the prey. It then changes the position of the wolf in line with the shifting positions of the prey. In GWO, Alpha (the best choice solution), beta, and delta have more excellent knowledge of the possible location of prey. So, the first three best solutions for the number of wolves (Nw) and the other pack members must change their positions in the light of the best three solutions. Such actions can be summarized as follows [22]:
where, Xα, Xβ, XΔ represent the positions of the alpha, beta, and delta. Dα, Dβ, and DΔ are the difference between the alpha, beta, delta, and the actual solution (X). Xnew is a new place for the dog. A and C are co-efficient vectors measured as follows:
where r is a random number. the co-efficient vector a is linearly decreased from 2 to 0 by the following equation:
where iter is the present iteration, and Maxiter is the cumulative number of iterations.
3.3 Equilibrium Optimization Algorithm
The equilibrium Optimization (EO) algorithm is a recent optimizer proposed, for the first time, by Farmarzi in 2020 in [9]. It has a simple structure and adaptive dynamic control parameters. It mimics dynamic and equilibrium states like mass balance models where each concentration (search agent) is randomly modified to achieve the final equilibrium state (optimal fitness) [10,11]. This optimizer has a basic structure and adaptive dynamic control parameters. Like population-based algorithms, the initial concentration of the particles (initial population) with a special number (NPC) and dimensions as:
Cinitial represents the particles’ initial concentrations; Cmin and Cmax are the defined limits of the decision optimization variables. The particles are then modified periodically regarding equilibrium solutions, which are selected as the best-of-the-art candidates. The EO upgrade function follows:
where the existing and new concentration vectors of the particle are X and Xnew, respectively. Xeq is a random concentration vector to be drawn from the balance pool. μ is a random vector between 0 and 1; F is an exponential term specified as:
where G is the generation rate specified as follows:
b1 and b2 are constants (b1 = 2 and ba2 = 1); m1 is a random variable between 0 and 1; T and Tmax are the current and cumulative iterations. r1 and r2 are random numbers between 0 and 1; GP is a given value called the generation likelihood (GP = 0.5). In each iteration, the considered objective shall be measured for the concentration of each particle to approximate its position. Moreover, each iteration of the balance pool is modified to include the best four particles so far.
4 Solution Methodology Using the Proposed Optimization Algorithms
4.1 Mathematical Formulation of the Parameters Optimization Prediction
Generally, the parameters prediction issue can be formulated as a nonlinear optimization problem that minimizes an objective function and subjects to different inequality constraints. The mathematical formulation of the parameters of Eq. (1) prediction can be modified with more nonlinear characteristics and represented as follows:
where the (*) refers to the optimal estimated condition.
An objective function is to find the best closeness between the estimated and experimental VBD to optimize these parameters. Therefore, this objective is simulated by minimizing the Squares Error Sum (SSE) between the experimental data and the simulation results. The proposed optimization problem is represented in Eq (24) as:
where F(u) is the objective function, u refers to the vector of predicted parameters. Nm is the number of recorded measurements. The minimum bounds of the control vector (u) and maximum limits umin and umax, respectively. The control vector (u) is represented as:
Thus, the inequality constraint in Eq. (24) can be investigated in various detailed constraints as follow:
The superscripts "max" and "min" indicate the maximum and minimum limits of each variable.
4.2 Proposed Optimization Algorithms Steps
For handling the parameters prediction optimization problem, three optimization techniques, of GWO, EO, and MPA, are applied for the first time to define the breakdown voltage prediction equation concerning the barriers in the power transformer oil samples. Their development to deal with the parameters prediction problem is illustrated in Fig. 5, where the solution methodology is carried out using three optimization algorithms GWO, EO, and MPA. The steps of the proposed solution methodology are represented by:

Figure 5: Flow chart of the solution methods (a) GWO Algorithm (b) EO Algorithm (c) MPA
• For GWO algorithm:
• Initializing the control variables within the permissible boundaries umin and umax of Eqs. (25)–(34).
• Extracting three grey wolves’ agents called Alfa, Beta, and Gamma agents.
• Updating the movement vectors, A, C, and related Eqs (16)–(18).
• Updating position of each grey wolf according to the procedure Eqs (6)–(15) in the viewpoint of the updated fitness function in Eq. (24) and the constraints of Eqs. (25)–(34).
• For the second optimization algorithm: EO
• Initializing the control variables within ermissible boundaries umin and umax of Eqs. (25)–(34).
• Specifying the equilibrium pool
• Computing the generation rate and exponential factors using Eqs (21) and (22).
• Updating the equilibrium pool using Eq. (20) in the previously extracted pool and the computed fitness function in Eq. (24) and the constraints of Eqs. (25)–(34).
• For the third optimization algorithm, MPA:
• Initializing the control variables within the permissible boundaries umin and umax of Eqs. (25)–(34).
• Estimating the adaptive coefficient of Eq. (4).
• Applying the memory savings is procced using Eq. (7).
• Evaluating the predicators' fitness and update the Elite matrix Eqs (2)–(5).
• Updating the marine’s predators position using Eq. (6).
• Checking the stopping criteria for all tested algorithms are reaching the maximum iteration.
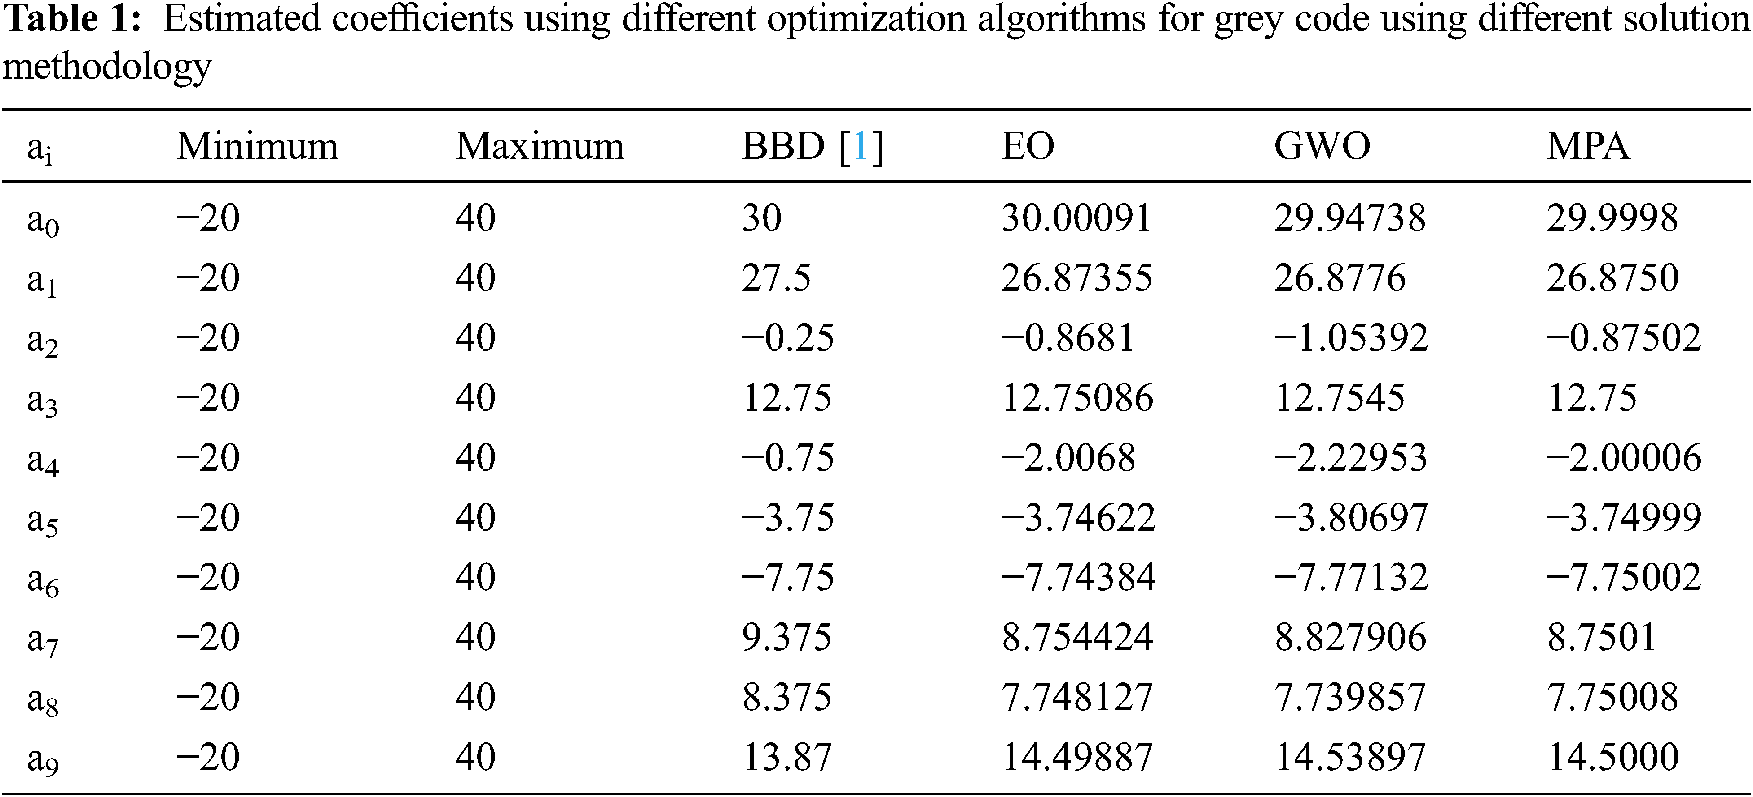
In the first case, the proposed optimization methods are investigated to seek the optimal prediction equation parameters based on grey code developed in [1]. Then, the data for 15 runs is customized from [1].
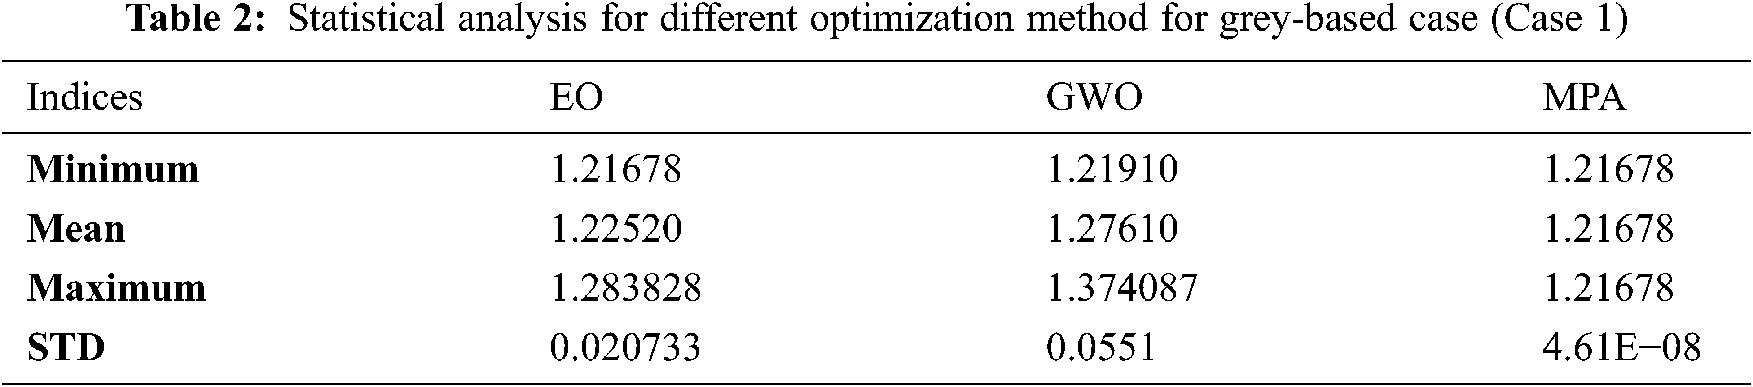
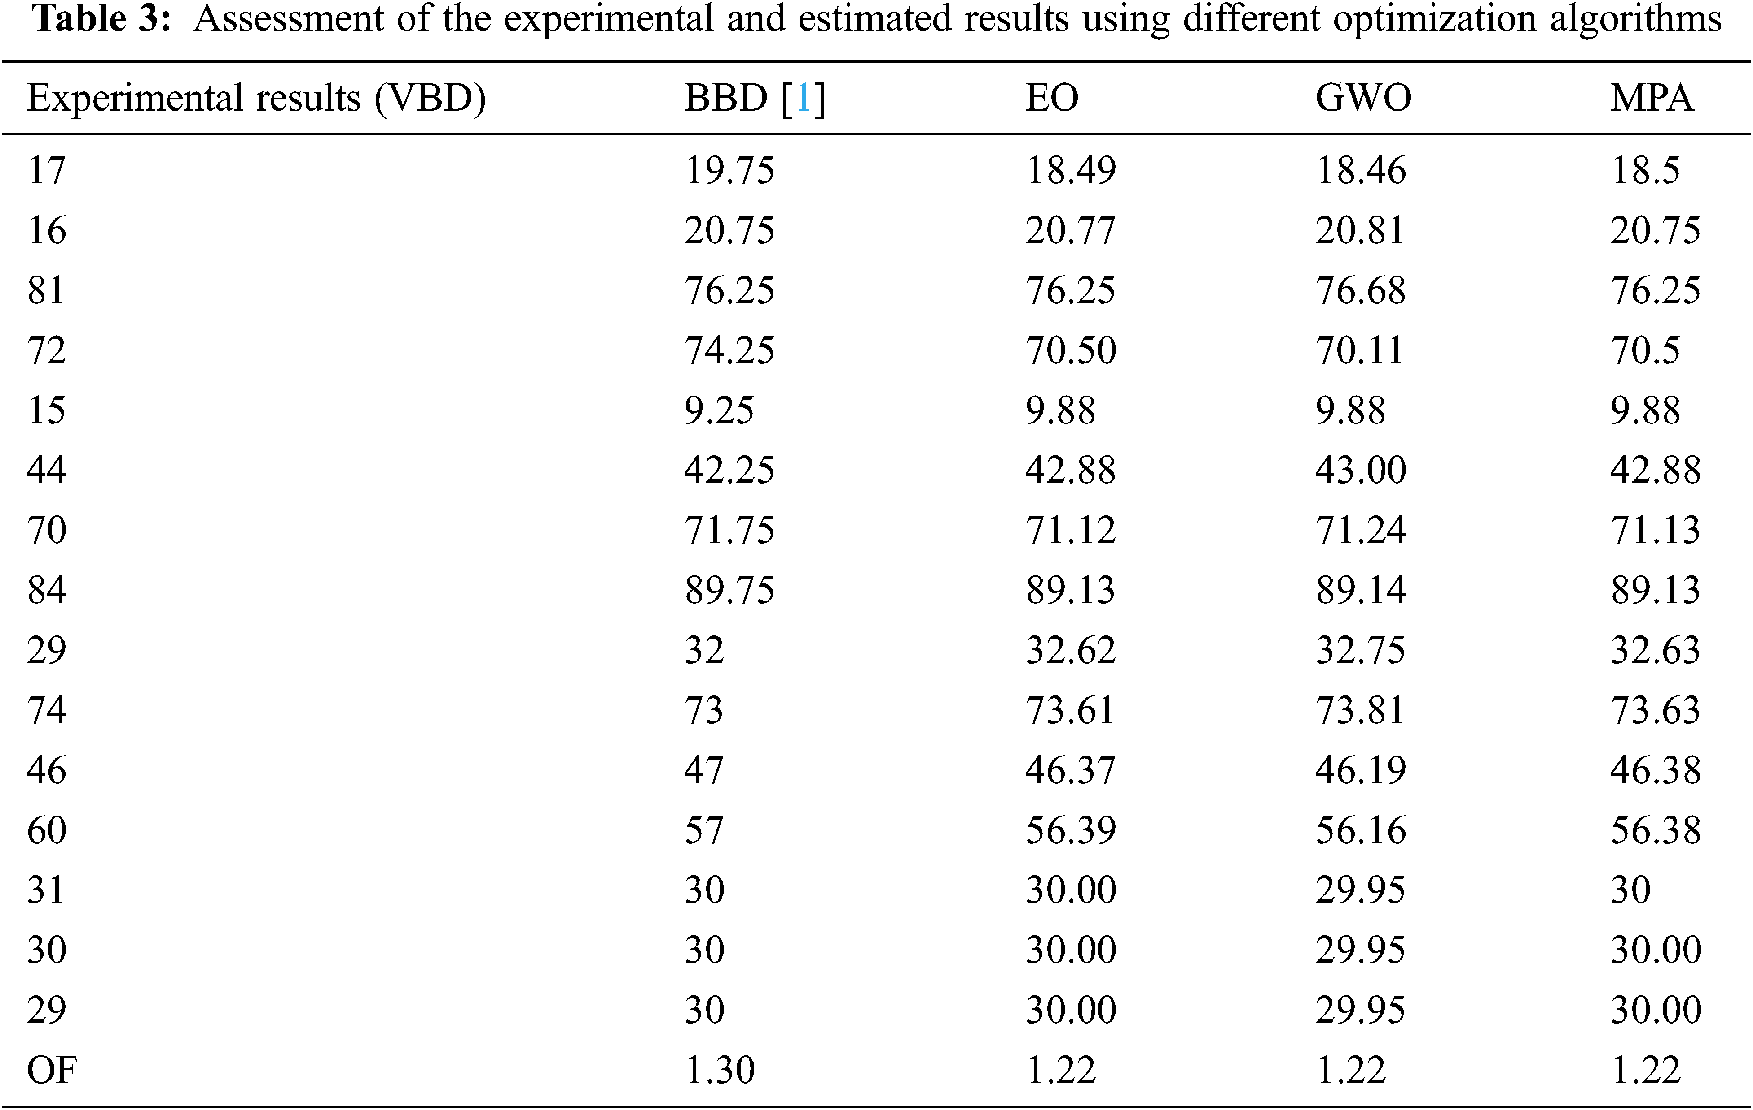
Tab. 1 shows the estimated coefficients obtained by the three competitive algorithms for the predicted equations compared with the grey code method for the actual VBD of 15 experiment runs at different values of d, a/d%, and D based on the grey code model extracted by using Box Behnken Design (BBD). In this table, the coefficients of Eq. (1) a0 to a9, which presented the prediction equation of VBD are illustrated. Tab. 2 illustrates the statistical analysis of the minimum, mean, maximum, and standard deviation (STD) of GWO, EO, and MPA. As seen, the statistical analysis assures the stability of the proposed competitive algorithms. The MPA leads to the lowest standard deviation (4.61 × 10⁻⁸) than EO and GWO of 0.0207 and 0.0551. The measured VBD and the BBD, EO, GWO, MPA are explained in Tab. 3. Another test set for 20 experimental records to assess the obtained prediction equations, which use the three competitive algorithms, is reported in Tab. 4. Based on the results in Tab. 3, the total percentage error of the prediction equation using the BBD in [1] is 1.3%, while the proposed methods reach 1.22%. The total percentage errors of the tested samples in Tab. 4 applying EO, GWO, MPA are 1.207, 1.222, and 1.207, respectively. Therefore, the MPA optimization technique is the best one to reduce the errors between the actual and estimated VBD. Fig. 6 shows the convergence rates for EO, GWO, and MPA. The MPA has the best convergence rates compared with other competitive algorithms.

Tab. 5 illustrates the actual VBD of 20 experiment runs at different d, a/d%, and D. This table is used to construct the prediction equation of the VBD with the optimization techniques. The coefficients of Eq (1) a0 to a9, which presented the prediction equation of VBD are illustrated in Tab. 6. The estimated VBD and the absolute error percentage using EO, GWO, MPA are explained in Tab. 7. The max absolute error of the prediction equation applying EO optimization technique is 15.96, which is at run No. 10. The error % of 5 runs exceeds 10%. Using GWO to develop the prediction equation of VBD seems to be not convenient since it gives seven runs that exceed 10%, and the maximum error % is 21.09 at run No. 7. The MPA technique gives 6 runs that exceed 10%, and the max error percentage is 15.02 at run No. 7.

Figure 6: Convergence rates for different optimization methods
The MPA optimization technique is the best one to reduce the errors between the actual and estimated VBD. However, the average absolute error of MPA is 6.37%, but the absolute error between the actual and estimated VBD of each run is not high. The maximum errors of this technique are 11.75, 10.35, 15.02, 10.85, 11.53, and 11.58 % for run No. 2, 4, 7, 9, 10, and 11, respectively. Fig. 7 illustrates the convergence rates of the three optimization techniques (EO, GWO, and MPA) for the real coded structure (case 2). This Figure shows that the best convergence rates are achieved using the MPA, which is characterized by the minimum error of the prediction equation of VBD based on the actual value results from applying the MPA technique. Tab. 8 illustrates the statistical analysis of the EO, GWO, and MPA. The minimum, mean, and maximum errors for MPA are 0.998, 0.998. and 0.998, respectively, which are considered the lowest values among the three optimization techniques. The results explain that MPA is the best optimization technique to build the prediction equation of VBD with the input parameters d, a/d, and D. The MPA has the lowest errors of 1.22% and 6.37 % for grey code and real based models, Cases 1 and 2, respectively.

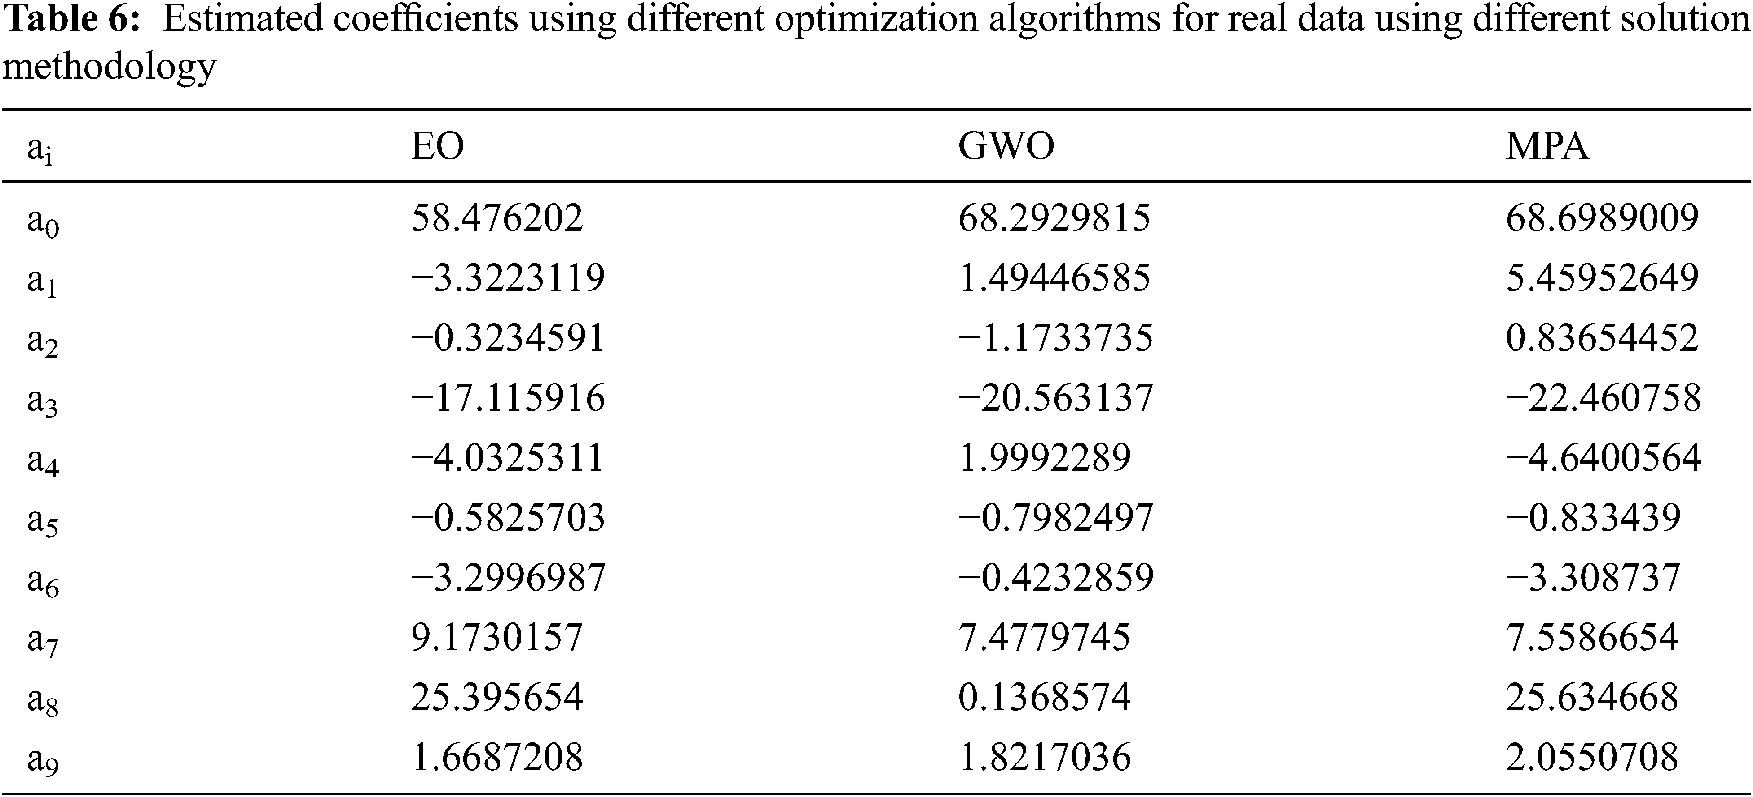

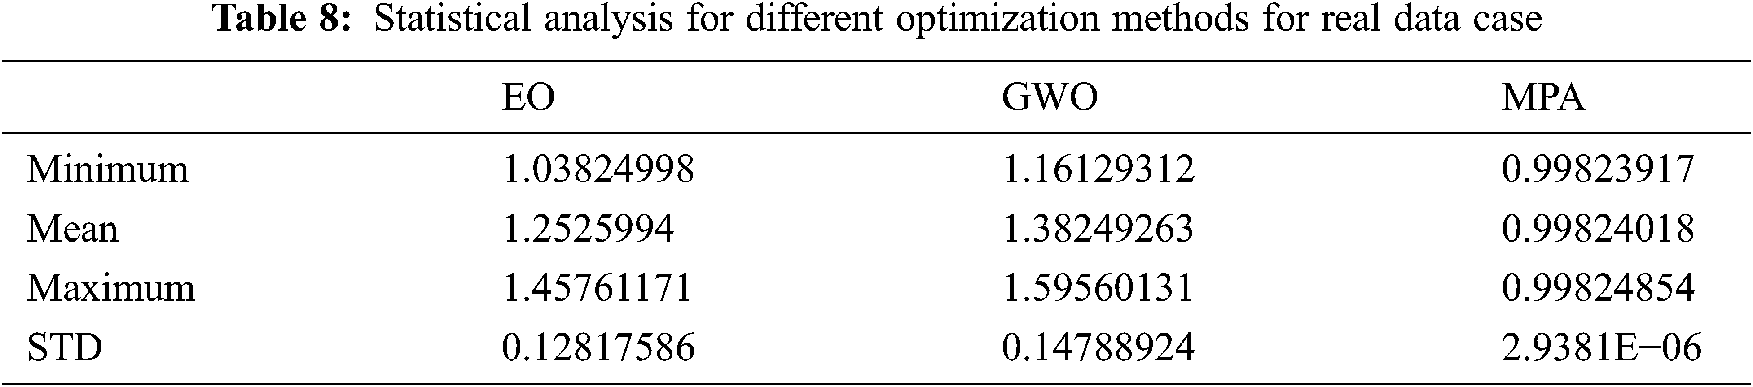
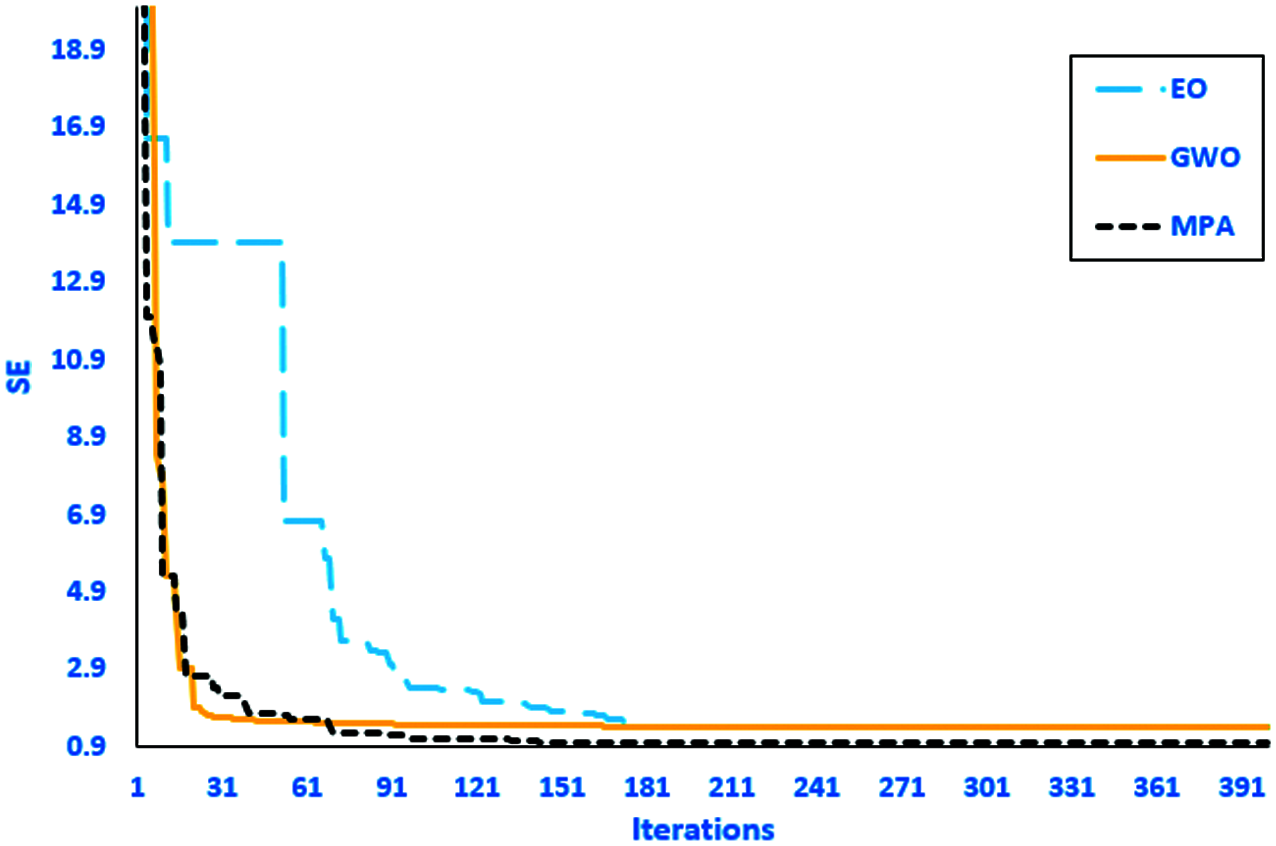
Figure 7: Convergence curves for competitive methods for case 2
This paper has been developed new modeling of barrier effect on the breakdown voltage of transformer oil via Grey and Real-Coded Models. The proposed new models are developed using three modern optimization algorithms called Marine predators, grey wolf, and equilibrium optimizations. Two cases of several runs up to 20 runs are compared with the recorded experimental tests to assess and verify the suggested models’ performance. The obtained results show that the proposed optimization-based models lead to more efficient parameter coefficients of the prediction equation of VBD. Among the results of the corresponding statistical analysis and convergence rates, the Marine predators have outperformance compared with the other two optimization methods: grey wolf and equilibrium optimizations. It has the lowest errors of 1.22% and 6.37% for grey code and real-based models. The convergence rates reflect the high capability in reaching the steady minimum fitness function at least the number of iterations. Also, the MPA has good statistical analysis for all competitive indices, especially for the standard deviation. The lowest levels of standard deviations reflect the solution's stability and robustness.
Acknowledgement: The authors acknowledge the financial support received from Taif University Researchers Supporting Project (Number TURSP-2020/122), Taif University, Taif, Saudi Arabia.
Funding Statement: Mosleh Alharthi is the author who received the financial grant from Taif University Researchers Supporting Project (Number TURSP-2020/122), Taif University, Taif, Saudi Arabia.
Conflicts of Interest: The authors declare that they have no conflicts of interest to report regarding the present study.
1. S. S. M. Ghoneim, S. S. Dessouky, A. A. Elfaraskoury and A. B. Abo Sharaf, “Modelling and experimental verification of barrier effect on breakdown voltage of transformer oil using box-behnken design,” Measurement, vol. 147, no. 4, pp. 1–9, 2019. [Google Scholar]
2. S. S. M. Ghoneim, S. S. Dessouky, A. A. Elfaraskoury and A. B. Abo Sharaf, “Prediction of insulating transformer oils breakdown voltage considering barrier effect based on artificial neural networks,” Electrical Engineering, vol. 100, no. 4, pp. 2231–2242, 2018. [Google Scholar]
3. M. Zitouni, F. Guerbas, L. Boukezzi and A. Boubakeur, “Modelling by design of experiments method of the AC breakdown voltage of transformer oil point-plane gaps with insulating barrier,” IET Generation, Transmission & Distribution, vol. 10, no. 1, pp. 232–239, 2016. [Google Scholar]
4. S. S. Dessouky, S. S. M. Ghoneim, A. A. Elfaraskoury and A. B. Abou Sharaf, “Barrier effect on the dielectric strength of the transformer insulting oils,” in The 20th Int. Symp. on High Voltage Engineering, Buenos, Aires, Argentina, pp. 1–6, 2017. [Google Scholar]
5. F. Guerbas, M. Zitouni, A. Boubakeur and A. Beroual, “Barrier effect on breakdown of point-plane oil gaps under alternating current voltage,” IET Generation, Transmission & Distribution, vol. 4, no. 11, pp. 1245–1250, 2010. [Google Scholar]
6. S. S. M. Ghoneim, S. S. Dessouky, A. Boubakeur, A. A. Elfaraskoury, A. B. Abou Sharaf et al., “Accurate insulating oil breakdown voltage model associated with different barrier effects,” Processes 9, vol. 657, pp. 1–16, 2021. [Google Scholar]
7. M. Jaroszewski, A. Beroual and J. Lachowski, “Insulating barriers efficiency on the dielectric strength of organic ester oil gaps,” Przegląd Elektrotechniczny, R, vol. 94, no. 10/2018, pp. 104–106, 2018. [Google Scholar]
8. A. Mohd and W. Khan, “Breakdown characteristics of ambient medium in presence of barrier under varying field conditions,” International Journal of Advanced Research in Electrical, Electronics and Instrumentation Engineering, vol. 5, no. 6, pp. 5429–5435, 2016. [Google Scholar]
9. A. Faramarzi, M. Heidarinejad, B. Stephens and S. Mirjalili, “Equilibrium optimizer: A novel optimization algorithm,” Knowledge-Based Systems, vol. 191, pp. 1–38, 2020. [Google Scholar]
10. D. T. Abdul-hamied, A. M. Shaheen, W. A. Salem, W. I. Gabr and R. A. El-Sehiemy, “An equilibrium optimizer based multi-dimensions operation of hybrid AC/DC grids,” Alexandria Engineering Journal, vol. 59, no. 6, pp. 4787–4803, 2020. [Google Scholar]
11. A. Mohamed, V. Chang and R. Mohamed, “A novel equilibrium optimization algorithm for multi-thresholding image segmentation problems,” Neural Computing and Applications, pp. 1–34, 2020. [Google Scholar]
12. A. M. Shaheen, A. M. Elsayed, R. A. El-Sehiemy and A. Y. Abdelaziz, “Equilibrium optimization algorithm for network reconfiguration and distributed generation allocation in power systems,” Applied Soft Computing, vol. 98, no. 106867, pp. 1–19, 2021. [Google Scholar]
13. A. A. Abo El-Ela, S. M. Allam, A. M. Shaheen and N. A. Nagem, “Optimal allocation of biomass distributed generation in distribution systems using equilibrium algorithm,” International Transactions on Electrical Energy Systems, vol. 31, no. 2, pp. 1–21, 2020. [Google Scholar]
14. A. Faramarzi, M. Heidarinejad, S. Mirjalili and A. H. Gandomi, “Marine predators algorithm: A nature-inspired metaheuristic,” Expert Systems with Applications, vol. 152, no. 113377, pp. 1–28, 2020. [Google Scholar]
15. A. M. Shaheen, A. M. Elsayed, R. A. El-Sehiemy, S. Kamel and S. S. M. Ghoneim, “A modified marine predators optimization algorithm for simultaneous network reconfiguration and distributed generator allocation in distribution systems under different loading conditions,” Engineering Optimization, pp. 1–22, 2021. [Google Scholar]
16. D. Yousri, T. S. Babu, E. Beshr, M. B. Eteiba and D. Allam, “A robust strategy based on marine predators algorithm for large scale photovoltaic array reconfiguration to mitigate the partial shading effect on the performance of PV system,” IEEE Access, vol. 8, pp. 112407–112426, 2020. [Google Scholar]
17. A. M. Shaheen, R. A. El-Sehiemy, S. Kamel, E. E. Elattar and A. M. Elsayed, “Improving distribution networks’ consistency by optimal distribution system reconfiguration and distributed generations,” IEEE Access, vol. 9, pp. 67186–67200, 2021. [Google Scholar]
18. M. Abdel-Basset, R. Mohamed, M. Elhoseny, A. K. Bashir, A. Jolfaei et al., “Energy-aware marine predators algorithm for task scheduling in iot-based fog computing applications,” IEEE Transactions on Industrial Informatics, vol. 17, no. 7, pp. 5068–5076, 2020. [Google Scholar]
19. S. Mirjalili, S. M. Mirjalili and A. Lewis, “Grey wolf optimizer,” Advances in Engineering Software, vol. 69, pp. 46–61, 2014. [Google Scholar]
20. A. M. Shaheen and R. A. El-Sehiemy, “Optimal co-ordinated allocation of distributed generation units/capacitor banks/voltage regulators by EGWA,” IEEE System Journal, vol. 15, no. 1, pp. 257–264, 2020. [Google Scholar]
21. A. A. El-Ela, R. EL-Sehiemy, A. M. Shaheen and I. Issa, “Optimal coordination of static VAR compensators, fixed capacitors, and distributed energy resources in Egyptian distribution networks,” International Transactions on Electrical Energy Systems, vol. 30, pp. 1–26, 2020. [Google Scholar]
22. H. Faris, I. Aljarah, M. Al-Betar and S. Mirjalili, “Grey wolf optimizer: A review of recent variants and applications,” Neural Computing and Applications, vol. 30, no. 2, pp. 413–435, 2017. [Google Scholar]
23. A. A. El-Ela, R. A. El-Sehiemy, A. M. Shaheen and A. R. Elien, “Optimal allocation of distributed generation units correlated with fault current limiter sites in distribution systems,” IEEE Systems Journal, vol. 15, no. 2, pp. 2148–2155, 2020. [Google Scholar]
24. Altuglas International, General Information and Physical Properties. Philadelphia, USA: Arkema Inc, 2006. [Google Scholar]
25. IEC 60156, “Insulating liquids-determination of the breakdown voltage at power frequency-test method,” 2018. https://webstore.iec.ch/publication/28297. [Google Scholar]
 | This work is licensed under a Creative Commons Attribution 4.0 International License, which permits unrestricted use, distribution, and reproduction in any medium, provided the original work is properly cited. |