DOI:10.32604/iasc.2022.020330
| Intelligent Automation & Soft Computing DOI:10.32604/iasc.2022.020330 | |
| Article |
Utilization of Deep Learning-Based Crowd Analysis for Safety Surveillance and Spread Control of COVID-19 Pandemic
1Department of Information Technology, College of Computers and Information Technology, Taif University, P.O. 11099, Taif 21944, Saudi Arabia
2Department of Electronics and Electrical Communication Engineering, Al-Obour High Institute for Engineering and Technology, Obour 3036, Egypt
3Department of Computer Science, Faculty of Computing and Information Technology, King Abdulaziz University, Jeddah, 21589, Saudi Arabia
4Department of Electrical Engineering, Faculty of Engineering, Menoufia University, Shebin El-Kom, 32511, Egypt
*Corresponding Author: Osama S. Faragallah. Email: o.salah@tu.edu.sa
Received: 20 May 2021; Accepted: 29 June 2021
Abstract: Crowd monitoring analysis has become an important challenge in academic researches ranging from surveillance equipment to people behavior using different algorithms. The crowd counting schemes can be typically processed in two steps, the images ground truth density maps which are obtained from ground truth density map creation and the deep learning to estimate density map from density map estimation. The pandemic of COVID-19 has changed our world in few months and has put the normal human life to a halt due to its rapid spread and high danger. Therefore, several precautions are taken into account during COVID-19 to slowdown the new cases rate like maintaining social distancing via crowd estimation. This manuscript presents an efficient detection model for the crowd counting and social distancing between visitors in the two holy mosques, Al Masjid Al Haram in Mecca and the Prophet’s Mosque in Medina. Also, the manuscript develops a secure crowd monitoring structure based on the convolutional neural network (CNN) model using real datasets of images for the two holy mosques. The proposed framework is divided into two procedures, crowd counting and crowd recognition using datasets of different densities. To confirm the effectiveness of the proposed model, some metrics are employed for crowd analysis, which proves the monitoring efficiency of the proposed model with superior accuracy. Also, it is very adaptive to different crowd density levels and robust to scale changes in several places.
Keywords: Crowd analysis; density map; COVID-19; CNN
On March 2020, the World Health Organization (WHO) reported that COVID-19 had spread in 114 countries around the world with 118,000 active cases and 4,000 deaths [1]. With the increasing number of daily infections, the global community has warned of the COVID-19 seriousness and has begun to look for different ways to stop pandemic. Several of scientists and medical organizations, are trying to develop effective vaccines or drugs especially with the virus variants. Moreover, the respiratory viruses are considered highly contagious like COVID-19 which is transmitted through close contact with an infected person (from coughing and sneezing). WHO suggested the social distancing between individuals to decrease the COVID-19 spread rate via ensuring two meters between two persons as a physical distance in stores, big malls, parks, train stations, celebrations, championships and places of worship [2–4]. Safety management of public spaces has encouraged numerous researchers to analyze and develop schemes for crowd monitoring [5–8]. Consequently, different associated tasks such as density estimation, counting, behavior detection, tracking and localization of crowd scene are studied [9–11]. The most important tasks which receive much attention to fight against COVID-19 are crowd counting and density estimation which the proposed manuscript focused. Since 1990, computer vision researchers have started to discuss virtual environments in many disciplines with some limitations due to lack of information. With continuous population and digital information growth, intelligent environments have become very challenging task to security or safety public management. Therefore, monitoring and analyzing crowd, surveillance cameras have been studied in computer vision issues with respect to social and computational aspects [12–14]. Early years, computer vision algorithms supported strongly the video surveillance systems; however there was a noticeable degradation in recording the identification and tracking mechanism from community to community due to crowd density. Various attributes are employed to analyze the behavior, density estimation and counting of crowd scene [15,16] which is performed in three basic steps: i) Pre-processing by segmentation, ii) Tacking individual and group of an object, iii) Recognition of event and behavior. Because the previous traditional analysis has resulted in long time consumption, scientists have applied artificial intelligent (AI) techniques to analyze and classify the crowd scene. AI allows fast and accurate tracking and estimation in real-time of people numbers in crowded places. Recently, governments used AI technology for many tasks such as surveillance over the internet dating, advertising, recruiting, terrorism prevention and fraud detection. Deep learning (DP) model is a subset of AI technology which consists of multi-layered artificial neural networks (ANNs) to obtain advanced accuracy in several tasks like detection, recognition and classification. The most researches have verified the classification effectiveness of using DP types like CNN and recurrent neural network (RNN). CNN and RNN are applied for analyzing the crowd behavior and classifying digital images or videos [17–22]. The most important religious occasions for Muslims are Hajj and Umrah, which gathers high density crowds in the holy sites as shown in Fig. 1. In 2019, the Saudi Arabia general authority for statistics has recorded more than 2.4 million in Hajj occasion [23]. Tawaf is one of the major pillars of both Hajj and Umrah around the Kaaba which is performed seven times with a noticeable increase in crowd density. An additional part of the Tawaf is kissing the Black Stone which is considered a hard task.
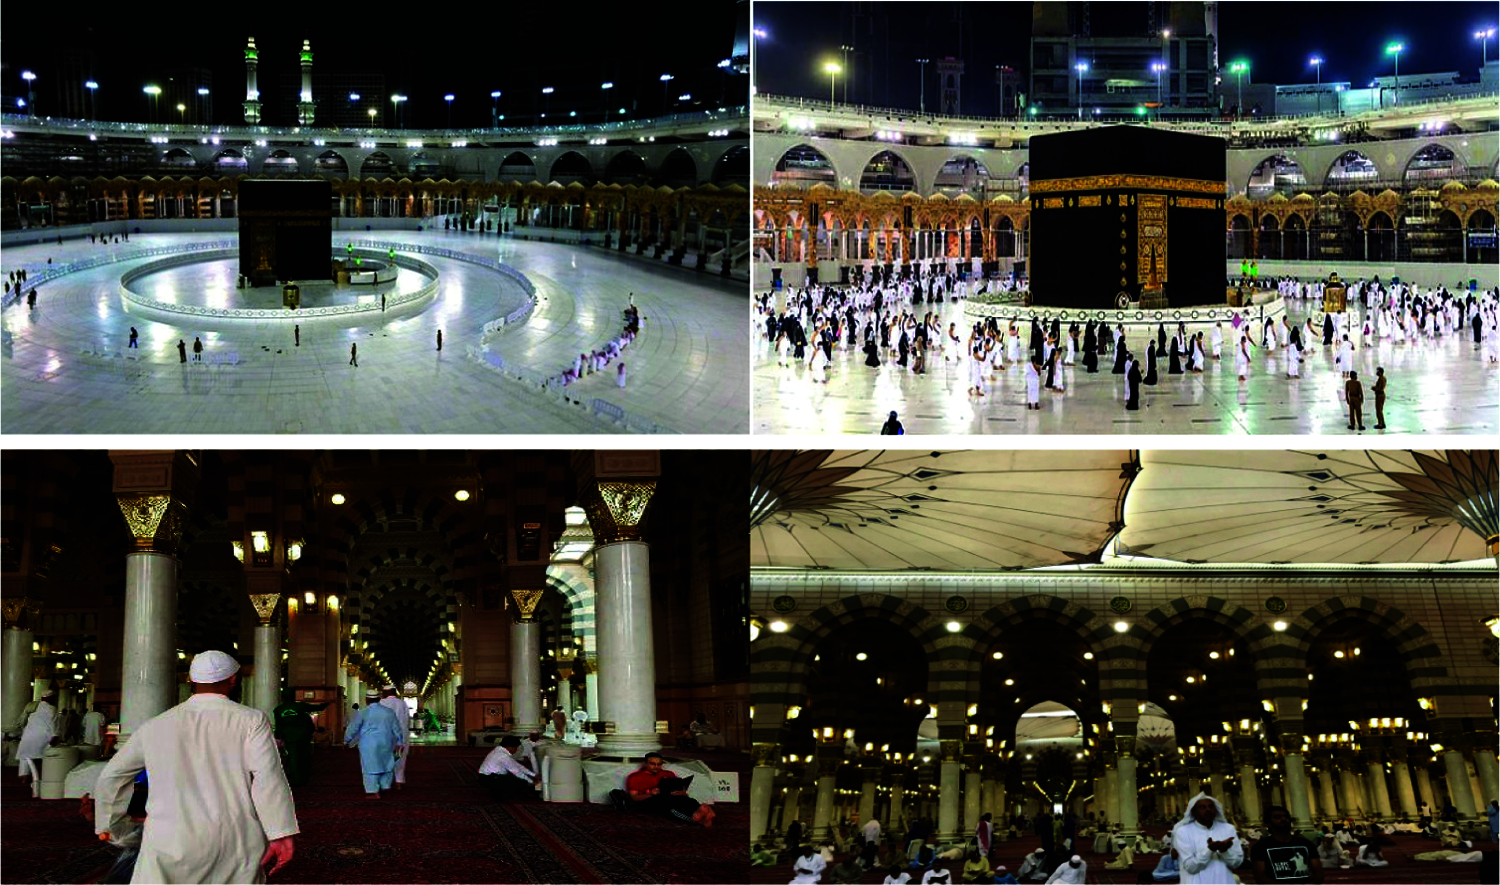
Figure 1: Examples of crowded scenes in the two holy mosques
Motivated by the rampant of COVID-19, which consider crowds its first enemy and social distancing is one key for fighting its spread, the proposed work is presented. This article designed a deep learning CNN model for monitoring the social distancing using digital images and surveillance video in the two holy mosques, Al Masjid Al Haram in Mecca and the Prophet’s Mosque in Medina. The proposed framework is categorized in two processes, crowd counting and crowd recognition using datasets of different densities. The crowd results are analyzed by evaluation metrics to validate the presented CNN model.
The rest sections of this article are constructed as: Section 2 presents the related work. Section 3 introduces the outline methodology of CNN. Section 4 explains the proposed crowd monitoring strategy. Section 5 explores and discusses the outcome results of the proposed crowd monitoring strategy. Section 6 concludes the article.
The crowd demographics are an essential to understanding its risk in the presence COVID-19. Various approaches were done to deal with the crowd counting problems and keep up with the rapidly advancing trends. This section explores the recent state-of-art methods for crowd estimation starting from the first crowd analysis methods in [24] which discusses the researchers’ perspectives in the computer vision field. In [25], the authors survey computer vision methods in crowd estimations, tracking, density and event detection. The work validation is evaluated through different simulations. In [26], the traditional crowd counting three methods detection, regression and density were introduced. The three approaches were analyzed through simulation to explain their features principles. Video imagery for population profiling in public spaces is an effective tool for counting. Therefore, [27] has compared the previous video imagery based crowd counting methods. In [28], a survey on crowd counting strategies in computer vision and their density estimations for visual surveillance was discussed. In [29], a survey on crowd statistics and its behavior is explored for identifying groups with datasets for crowd activity video. In [30], numerous single image crowds counting and its density methods are explored. The work had focused on recent AI approaches based on CNN. In [31], a comprehensive survey of for crowd analysis using current CNN model with the most applied software in researches is introduced. It reviewed the optimization methodologies of CNN with its important aspects for crowding estimation. For Saudi public places, a special crowd algorithm using Internet of Things (IoT) for estimating areas density is presented in [32]. The research employed a dataset of 750 images which were collected from various videos of malls, airports and Makkah. In Switzerland, 508 male soldiers with age of 21 years were infected by COVID-19. In [33], a study for following the infections cases in two spatially separated groups with coronavirus 2 (SARS-CoV-2) before and after social distancing is examined. The results showed that social distancing can slow the SARS-CoV-2 spread and prevent the COVID-19 infection. An innovative localization method to track an object position based on sensors is introduced in [34]. The smart device is used AI technique for maintaining a social distancing especially in COVID-19 environments. It will give an alert if someone in the range of six feet around someone. The results proved the high accuracy and efficiency of the designed device. In [35], a digital solution using Deep Learning technique for detecting the social distancing violation or the extra limit in the people number which allowed being in a certain place via an alert is suggested. With the help of Pose-Net model, a video stream obtained from the CCTV camera for detecting people and keeping a track of the humans present in video stream is designed. This technology can save time, fast analysis and will help CCTV cameras to monitor every gathering place.
Deep CNN is a sequence of different layers that specially designed to deal with visual data. Its layers architecture contain three types: Convolutional, Pooling, and Fully-Connected (F.C) Layers as illustrated in Fig. 2. Every layer uses certain differentiable functions to transform one volume of activations to another. An input image is processed through three rounds of layers to extract its features from and reduce its size.
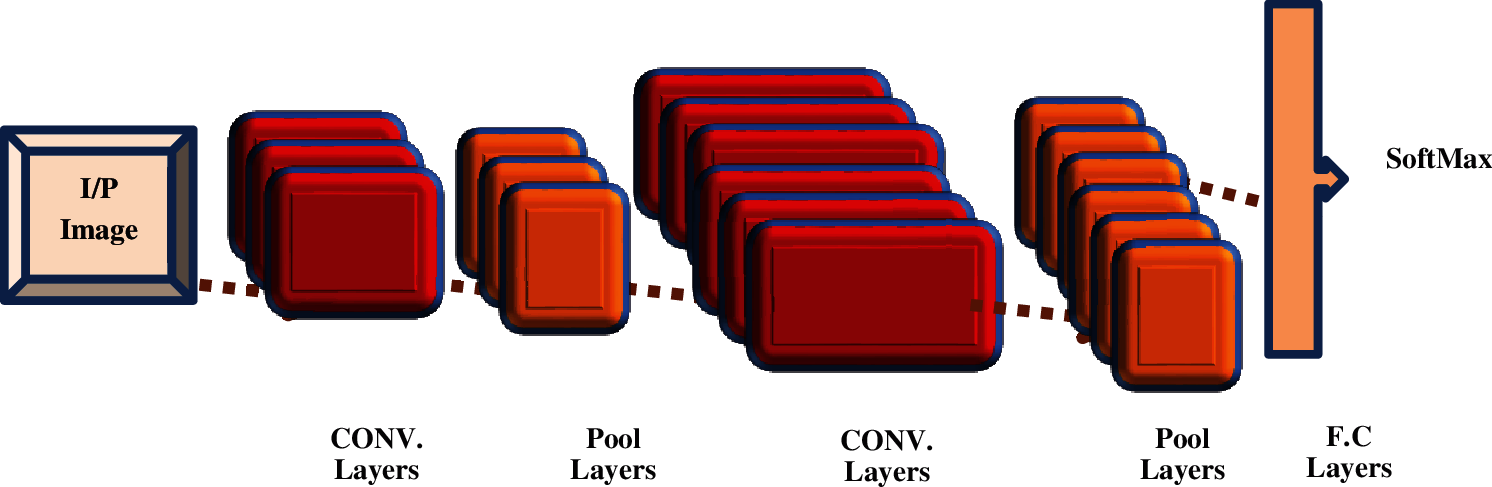
Figure 2: CNN basic architecture
The convolutional (Conv.) layer is contained some convolution kernels to change the input dimensions and compute different feature maps. The feature value at location i × j in the k-th feature map of l-th layer,
The Rectifying Linear Unit (ReLU) layer represents activation functions, which returns a positive value or 0 in place of previous negative values. The activation function is applied to introduce nonlinearities to CNN to determine nonlinear features. Let
The Pooling Layer performed the down-sampling operation to reduce spatial input dimensions. It is placed between two convolutional layers and applied the most used type which is Max Pooling by selecting the maximum element from the window [36].
where Rij is a local neighborhood around i × j location.
The F.C Layer or dense layers is consisted of a defined number of neurons to perform a linear operation in which every input is connected by a weight to every output. Also, it is responsible for final decision making by using an activation function such as soft-max or sigmoid to classify the features outputs.
The crowd counting may be considered a difficult issue because of pedestrian detection and tracking difficulty and varying crowd distributions. The work goal is to train the mapping how to distinguish among low, medium and high level features by counting the crowd. Therefore, the main steps for implementing the proposed algorithm can be summarized as:
1. Generate the normalized crowd density map and density counting as a preprocessing step.
2. Develop an effective features extracted to describe crowd based on the proposed CNN model for better representation.
3. Train additional data for different crowd densities to increase the model capability for analyzing other untrained scenes.
4. The CNN is trained for crowd scenes by learning process with two learning objectives, crowd counts and classification. This proposed CNN learns crowd specific features, which are more robust than handcrafted features. Three main methods are presented to implement the CNN training process namely the proposed algorithm 1, the proposed algorithm 2, and the proposed algorithm 3. The specifications of these methods are described as listed in Tab. 1.
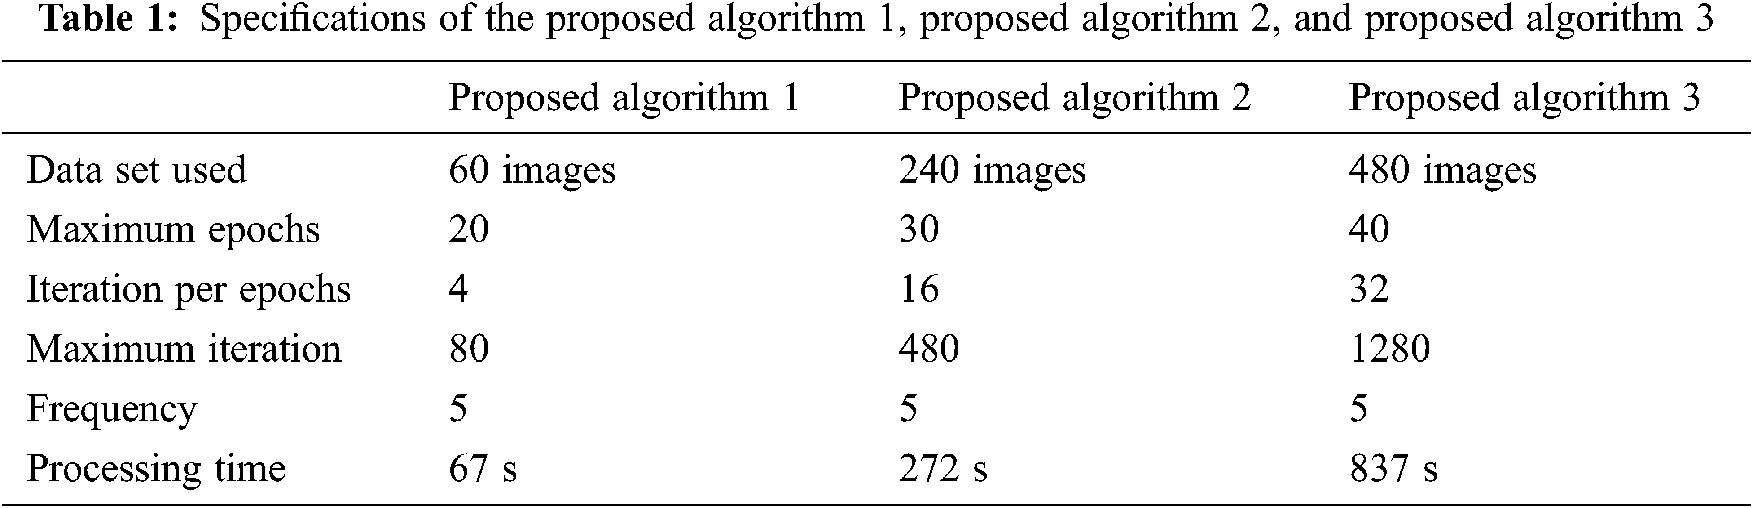
These methods are proposed to introduce the effect of changing the training parameters values and number of training images on the performance and the efficiency of classification process.
The density map integral for a set of objects inside a sub-region, is useful for both counting and tracking. Most of CNN methods construct density maps of low resolution due to the down-sample operations. Therefore, the proposed crowd density map depends on the local features or the probabilistic crowd observation as illustrated in Fig. 3.

Figure 3: Crowd density map calculation with local features extraction (a) Sample image (b) The corresponding density map and crowd estimated (c) Color Histogram analysis in RGB color space
The normalizing process allows learning the mapping F: X → D, where X the low-level features set which extracted from training images and D an image crowd density map. The density map depends on spatial location, human body shape and perspective distortion of images. This mainly has three visible characteristics: 1) a person image has different scales because of the perspective distortion in a crowd scene; 2) its shape is more likely to ellipses than circles; 3) heads and shoulders represent the main indication for counting persons in images. Normalized crowd density map for training is expressed as:
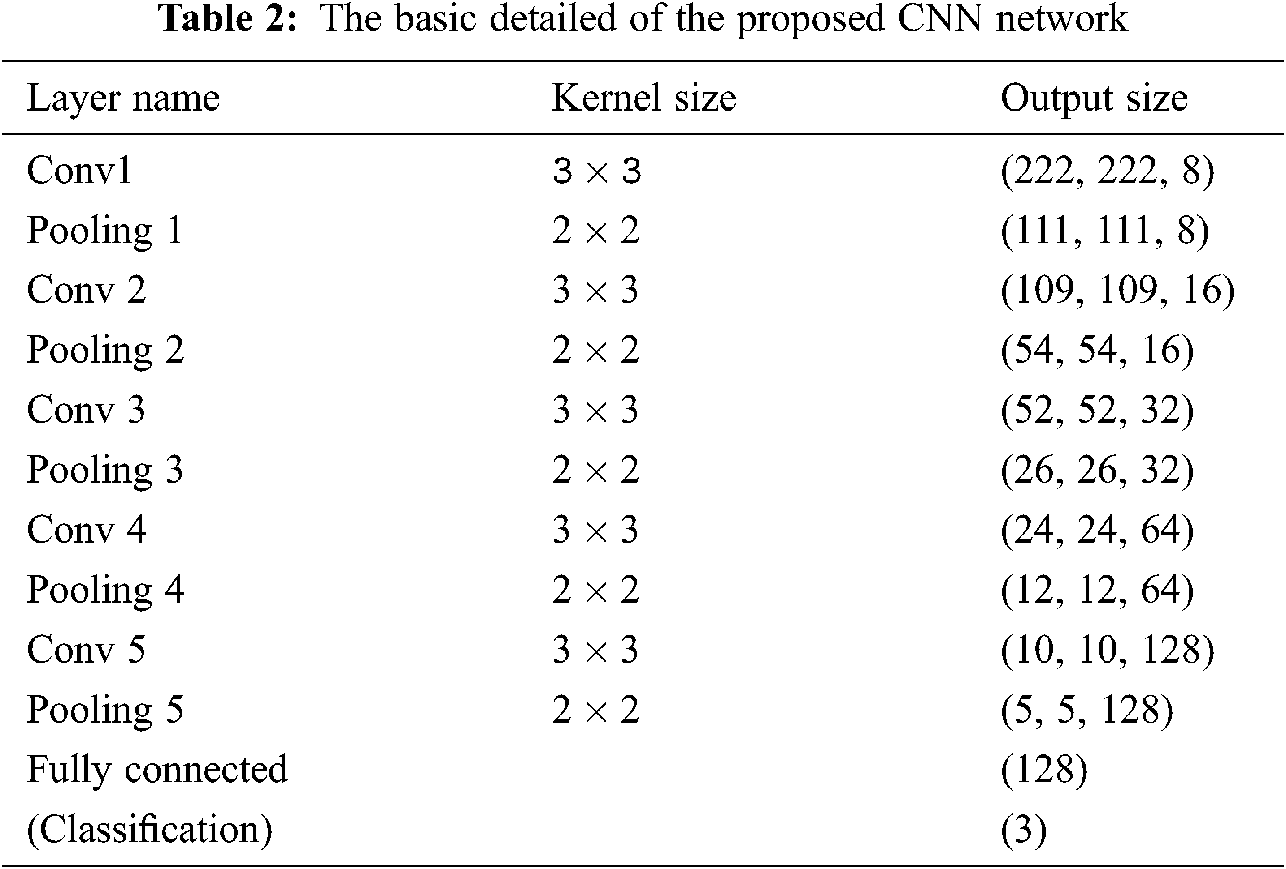
The image patches cropped from the training images represents the crowd CNN model inputs. To have pedestrians of similar proportions, each patch size in different locations is selected according to its center pixel perspective value. The proposed crowd CNN model contains 11 layers: 5 convolutional layers, 5 pooling layers and one FC output layer with the soft-max function as shown in Fig. 4.
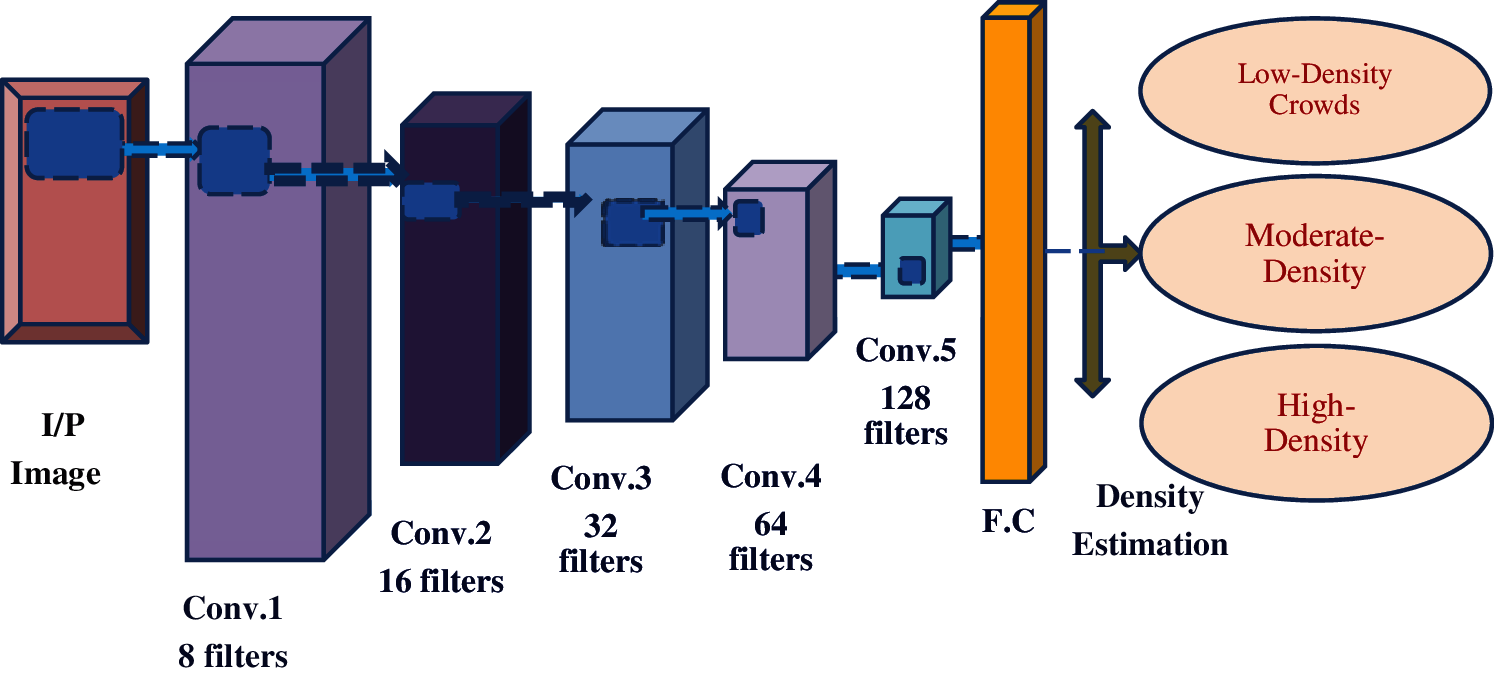
Figure 4: The structure of the proposed crowd convolutional neural network
Conv.1 has 2 × 2 kernel size with 8 filters followed by Max pooling layers with a 2 × 2 kernel size. Then, Conv. 2 has 2 × 2 kernel size with 16 filters followed by Max pooling layers with a 2 × 2 kernel size until the last layer Conv.5 which has 2 × 2 kernel size with 128 filters.
ReLU, which is the activation function applied after every convolutional layer. Tab. 2 shows the detailed of the proposed CNN network. Finally, FC layer and soft-max activation function to connect the output to a number of the classes by predicting according to the density estimation into three categories (Low density crowds, High density crowds and Moderate density crowds).
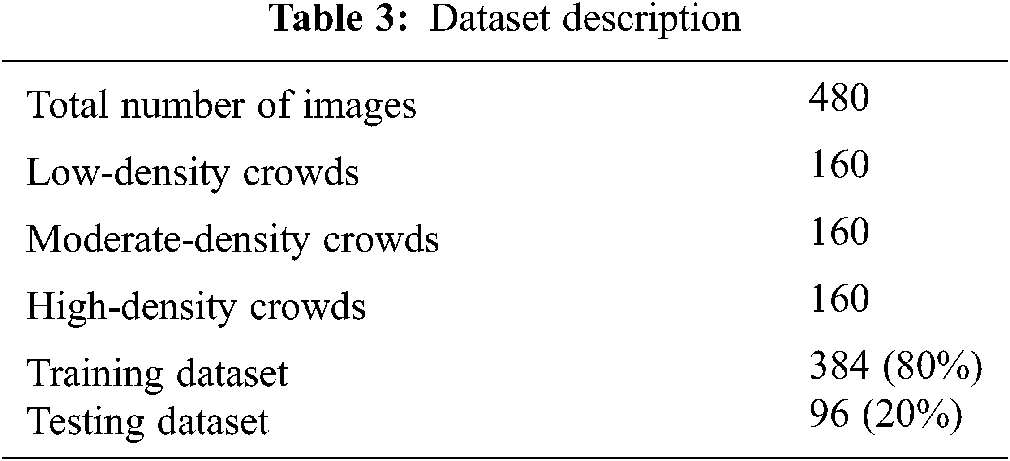
The proposed model is evaluated using crowd scenes database obtained from the Holy Kaaba and the Prophet’s Mosque images according to the latest statistics during COVID-19. The applied dataset total number is 480 images as explored in Tab. 3. The dataset composed of 160 low-density crowds’ images, 160 high-density crowds’ images and 160 moderate-density crowds’ images used for the training and testing phases. The datasets are divided randomly into two groups; first group is 80% of materials used for training the CNN model which repeated 40 times and second group is the remaining 20% for the testing purpose. Fig. 5 illustrates a sample of the studied scenes which shows low, high and moderate-density crowds.

Figure 5: Samples of the input datasets
The proposed deep crowd algorithm will be a useful aid for authorities to control the crowd surveillance in the Holy Mosque and the Prophet’s Mosque to reduce overcrowding during COVID-19. The proposed model provided an accurate and efficient density crowd analysis and classification through a designed training CNN networks and a binary classifier. In the proposed work, the dataset was split into 80% for training and 20% for testing with pre-trained CNN model. Then, deep features were extracted, fused and ranked based on the correlation values between features. The density map and counting estimation process of the input patch are introduced before the classification step which provides much local and detailed information for the CNN algorithm to obtain a better representation of crowd patches. The proposed crowd model classified the crowds into: low, moderate, and high density crowds according to the state of crowding. It depends on estimating the number of people in a square meter area and then provides an indication of the precautions to deal with the situation via disinfection or ventilation proceedings.
The outcomes of the proposed model are compared with the ground truth dataset and evaluated through some statistical measurements such as: accuracy, sensitivity, specificity, F1-score, precision, and Matthews Correlation Coefficient (MCC).
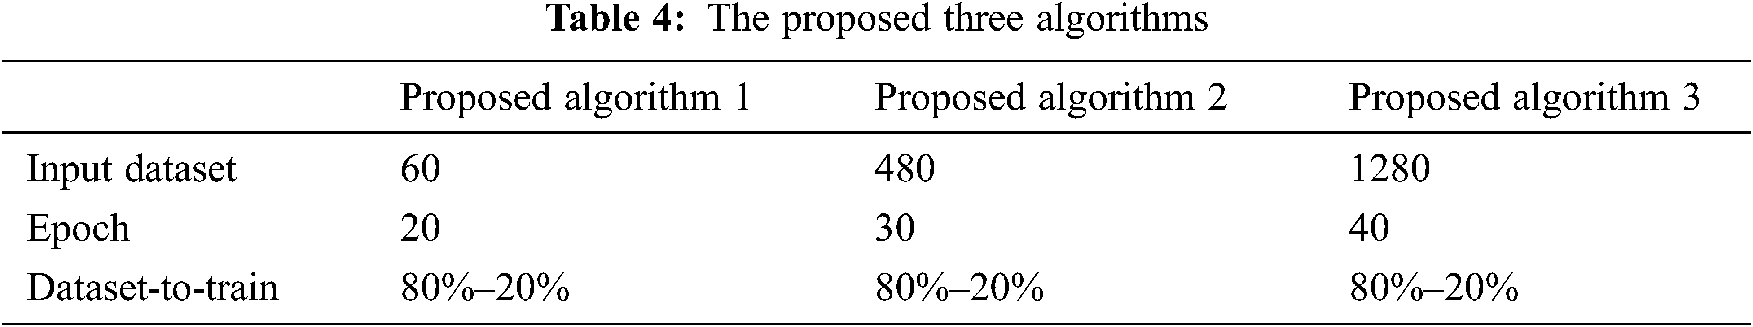
Since the proposed network is training iteratively, the only way to know the optimal number of epochs is by plotting network accuracy vs. epochs. After the network has run for several epochs, the network accuracy started saturating. Therefore, to achieve the desired performance, the network is verified through three different algorithms using some regularization techniques such as (data augmentation, training losses and number of epochs) and tracks their values to avoid over fitting. The proposed three algorithms have been implemented under three different parameter conditions as shown in Tab. 4.
Figs. 6 and 7 show the performance evaluation of the proposed three algorithms in terms of accuracy and cross-entropy (loss) for both the training and testing stage which are implemented up to 1280 iterations. By analyzing the obtained results, it is cleared that the proposed algorithm 3 has significant effects on classifying the crowd density using different datasets. The network could conduct better features extraction with maximum accuracy and minimum loss factor. Therefore, the proposed algorithm 3 is recommended for high accuracy of crowd density classification with the implemented datasets.
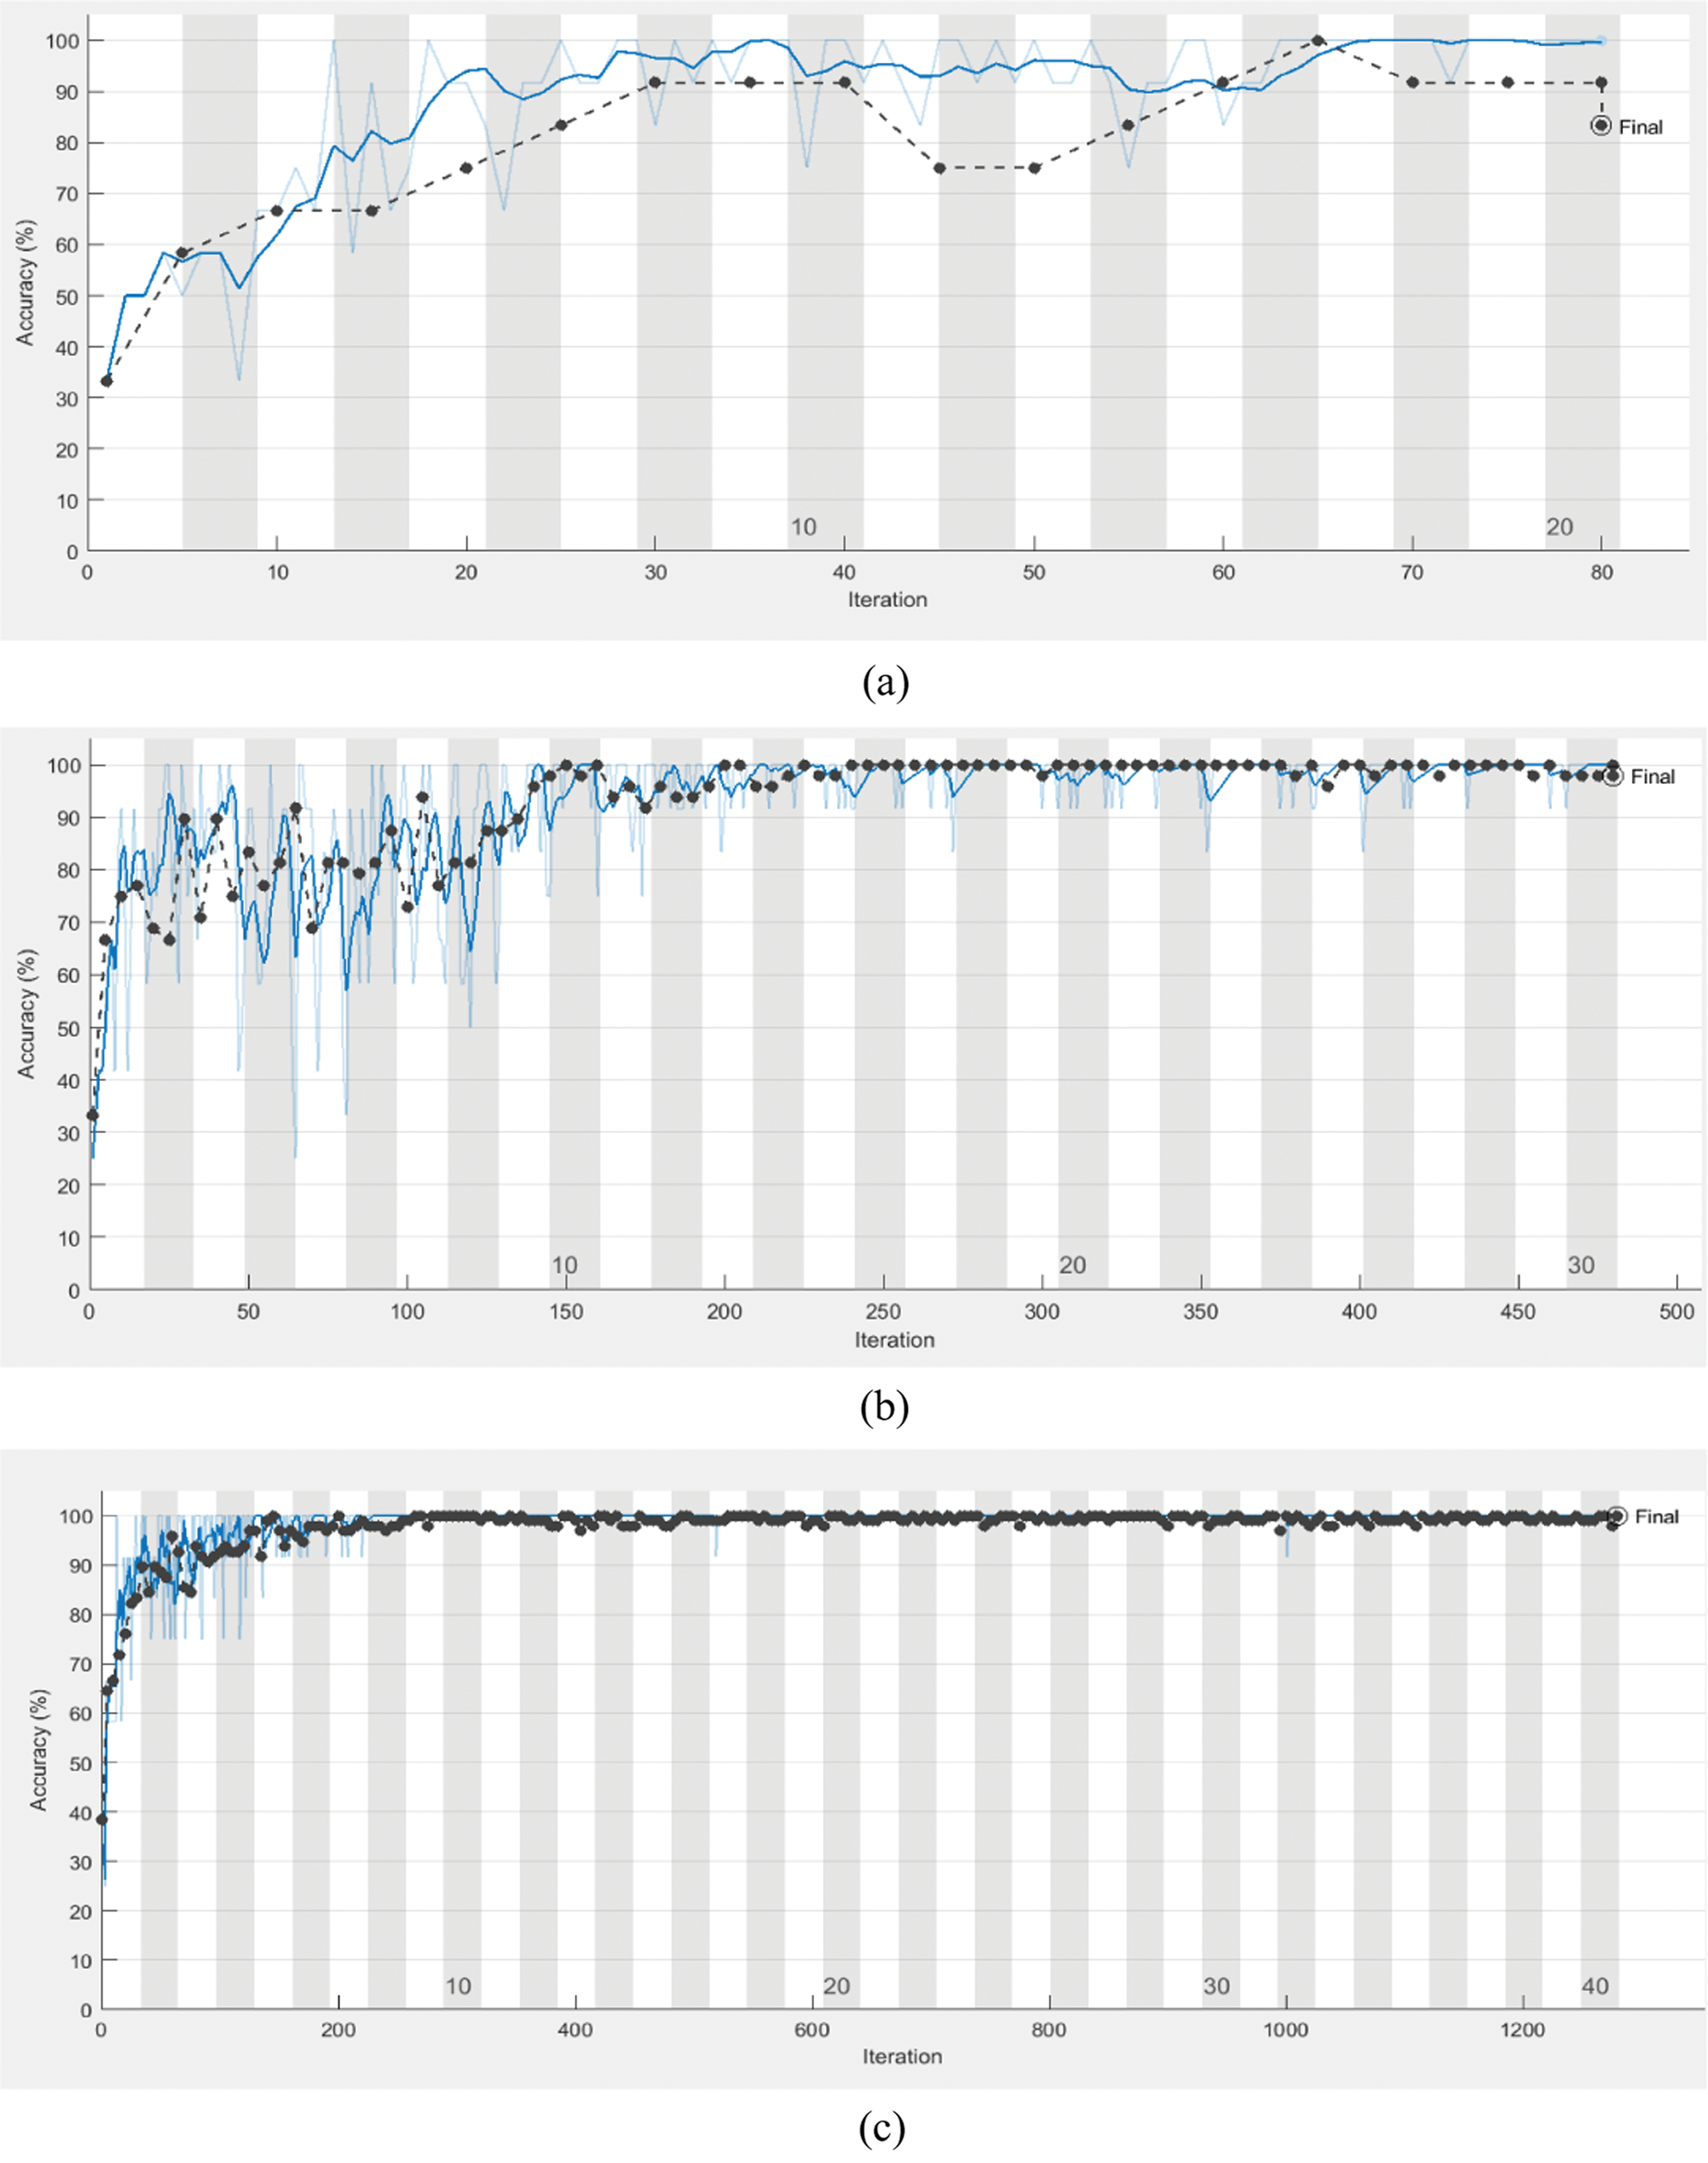
Figure 6: The accuracy for both the training and testing stages for the proposed CNN crowd algorithms (a) Algorithm 1 (b) Algorithm 2 (c) Algorithm 3

Figure 7: The Loss (Cross entropy) for both the training and testing stage for the proposed CNN crowd algorithms (a) Algorithm 1 (b) Algorithm 2 (c) Algorithm 3
The classification performance of the proposed model in terms of accuracy, specificity, sensitivity, precision, F1-score and MCC for three different algorithms are summarized in Tab. 5. The results indicated that, the proposed algorithm 3 has conducted superior performance in classification of low density crowd, moderate density crowd and high density crowd as 100% overall accuracy, 100% specificity, 100% sensitivity, 100% precision, 1 for F1-score and 1 for MCC.
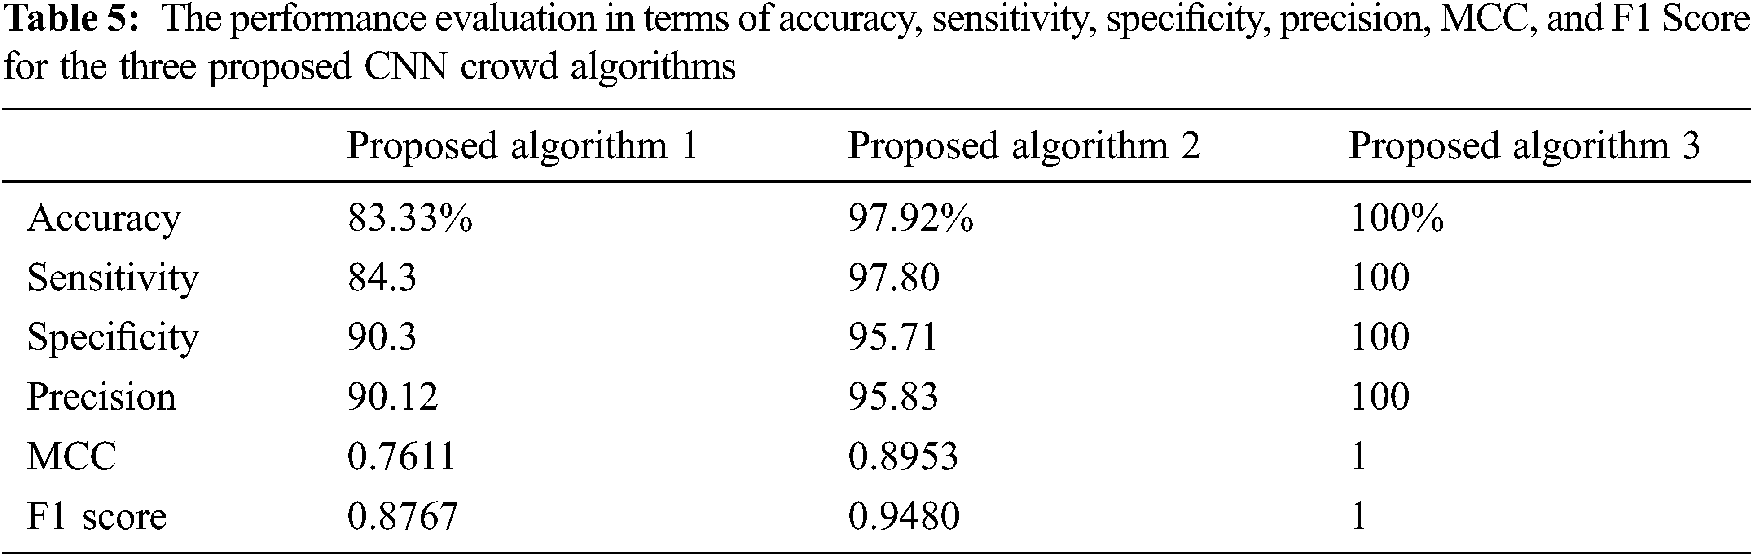
However, the classification performance in the other two algorithms has demonstrated lower overall performance evaluation in all metrics: accuracy, specificity, sensitivity, precision, and MCC due to the lower input dataset images and lower implemented epochs. Thus, the proposed algorithm 3 gives better performance with increasing the input datasets and the number of implemented epochs as shown in Fig. 8.
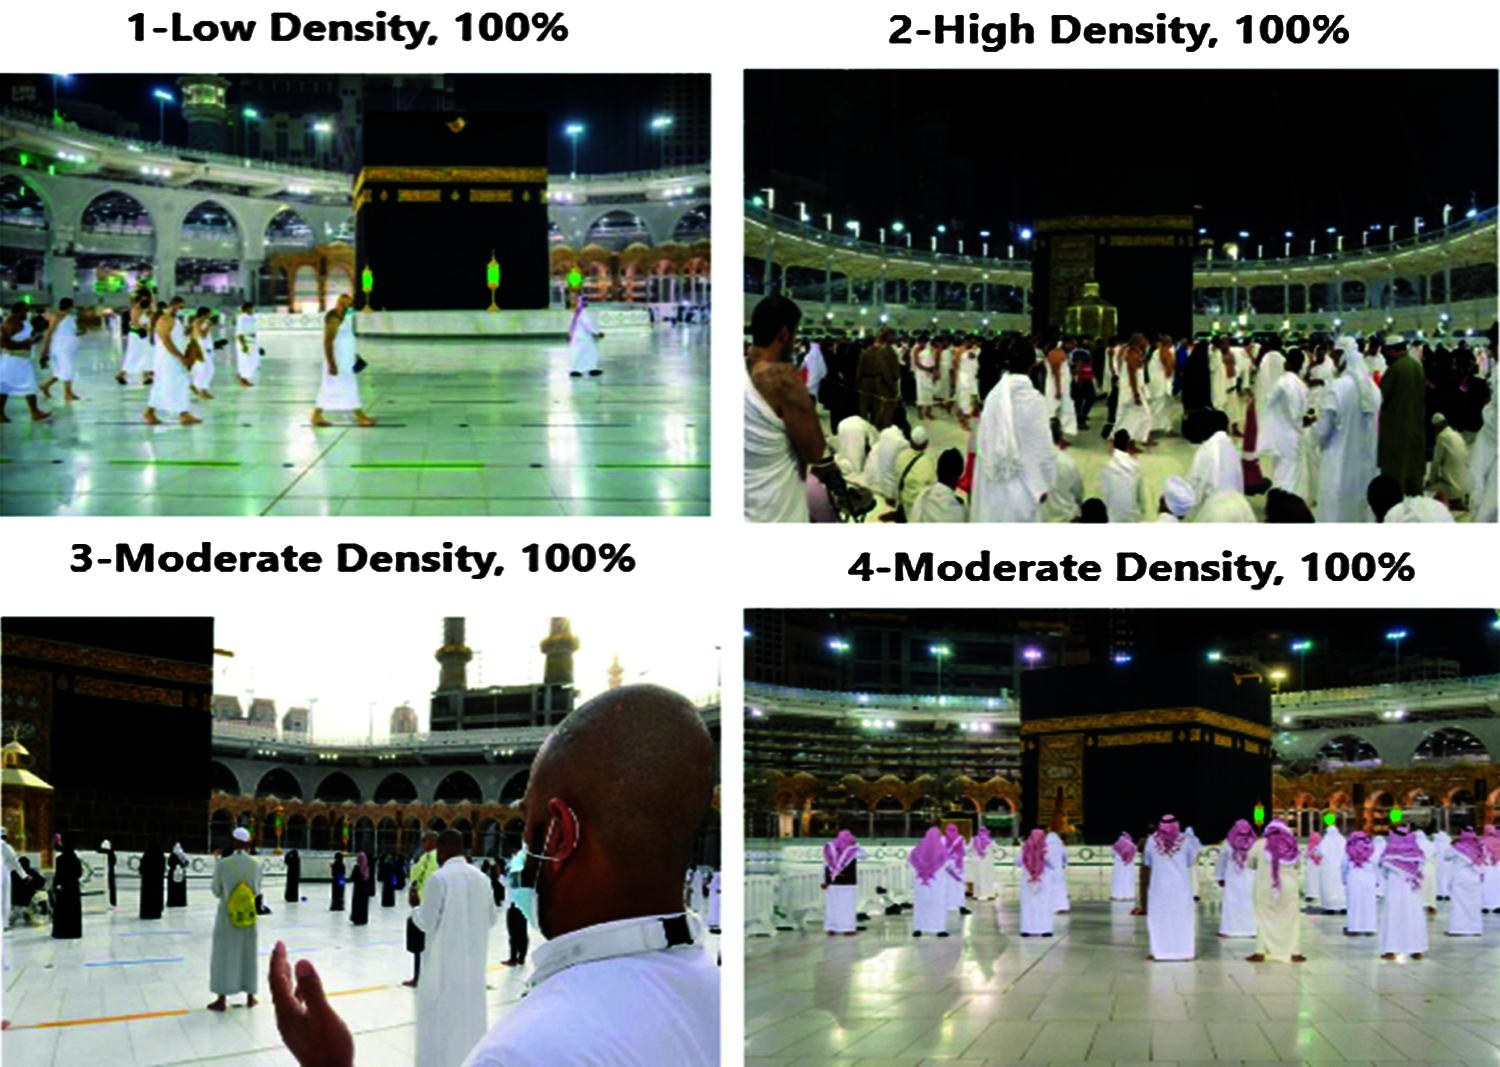
Figure 8: The output testing accuracy of the proposed crowd CNN algorithm 3
The confusion matrix is used to clarify the prediction ratio for different classification as shown in Fig. 9. The confusion matrix is based on the false positive rate and true negative rate considering balanced distribution in dataset which improved the results for prediction ratio and enhanced the model performance. It was found that the proposed algorithm 3 has better and consistent true positive and true negative values which can efficiently classify different crowd densities.

Figure 9: The confusion matrix of the classification process in the proposed crowd CNN for the three algorithms (a) Algorithm 1 (b) Algorithm 2 (c) Algorithm 3
In visual surveillance crowd analysis is a crucial component in security applications. In the time of COVID-19, the computer vision is applied to analyze and collect the visual data from the live worldwide network cameras for observing the human activities and monitoring the social distancing through crowding to prevent the spread of this epidemic. The proposed work is presented to analyze the crowd density of visitors in the two holy mosques, Al Masjid Al Haram in Mecca and the Prophet’s Mosque in Medina for taking the appropriate proceedings to prevent the transmission of infection. Hence, this research design a deep learning CNN model for crowd scenes classification into low, moderate, and high density based on the normalized density map generated. The proposed model carried out on two stages, generating the normalized crowd density map and density counting, then feature extrication and classification the crowd scene. The performance of the proposed models are implemented with different parameters values and evaluated based on various evaluation metrics such as specificity, sensitivity, precision, MCC, and F1 score. An extensive analysis showed an improvement performance and better efficiency by the proposed architecture in crowd density classification with maximum accuracy and minimum loss values.
Acknowledgement: The authors would like to thank the Deanship of Scientific Research, Taif University, Saudi Arabia, for funding the research Project Number 1-441-29.
Funding Statement: This research was supported by the Deanship of Scientific Research, Taif University, Saudi Arabia, under research Project Number 1-441-29.
Conflicts of Interest: The authors declare that they have no conflicts of interest to report regarding the present study.
1. Q. Hu, H. Guan, Z. Sun, L. Huang, C. Chen et al., “Early CT features and temporal lung changes in COVID-19 pneumonia in wuhan, China,” European Journal of Radiology, vol. 128, no. 109017, pp. 1–6, 2020. [Google Scholar]
2. M. Fong, H. Gao, J. Wong, J. Xiao, E. Y. Shiu et al., “Nonpharmaceutical measures for pandemic influenza in nonhealthcare setting social distancing measures,” Emerging Infectious Disease, vol. 26, no. 5, pp. 976–984, 2020. [Google Scholar]
3. X. Cui, Q. Liu, M. Gao and D. Metaxas, “Abnormal detection using interaction energy potentials,” in IEEE Conf. on Computer Vision and Pattern Recognition, Colorado Springs, CO, USA, pp. 3161–3167, 2011. [Google Scholar]
4. R. Mehran, B. Moore and M. Shah, “A streakline representation of flow in crowded scenes,” in European Conf. on Computer Vision, Berlin/Heidelberg, Germany, Springer, pp. 439–452, 2010. [Google Scholar]
5. V. Pham, T. Kozakaya, O. Yamaguchi and R. Okada, “Count forest: Co-voting uncertain number of targets using random forest for crowd density estimation,” in IEEE Int. Conf. on Computer Vision, Santiago, Chile, pp. 3253–3261, 2016. [Google Scholar]
6. F. Zhu, X. Wang and N. Yu, “Crowd tracking with dynamic evolution of group structures,” in Proc. of the European Conf. on Computer Vision, Zurich, Switzerland, pp. 139–154, 2014. [Google Scholar]
7. V. Sindagi and V. Patel, “A survey of recent advances in CNN-based single image crowd counting and density estimation,” Pattern Recognition Lett, vol. 107, pp. 3–16, 2018. [Google Scholar]
8. S. Choudhary, N. Ojha and V. Singh, “Real-time crowd behavior detection using SIFT feature extraction technique in video sequences,” in Int. Conf. on Intelligent Computing and Control Systems, Madurai, India, pp. 936–940, 2017. [Google Scholar]
9. H. Idrees, M. Tayyab, K. Athrey, D. Zhang, S. Al-Maadeed et al., “Composition loss for counting, density map estimation and localization in dense crowds,” in European Conf. on Computer Vision, Munich, Germany, pp. 532–546, 2018. [Google Scholar]
10. Y. Wang and Y. Zou, “Fast visual object counting via example-based density estimation,” in IEEE Int. Conf. on Image Processing, Phoenix, AZ, USA, pp. 3653–3657, 2016. [Google Scholar]
11. Y. Bharti, R. Saharan and A. Saxena, “Counting the number of people in crowd as a part of automatic crowd monitoring: A combined approach,” in Information and Communication Technology for Intelligent Systems, Berlin/Heidelberg, Germany: Springer, pp. 545–552, 2019. [Google Scholar]
12. B. Zhou, X. Wang and X. Tang, “Understanding collective crowd behaviors: Learning a mixture model of dynamic pedestrian-agents,” IEEE Conf. on Computer Vision and Pattern Recognition, Providence, RI, USA, pp. 2871–2878, 2012. [Google Scholar]
13. B. Solmaz, B. Moore and M. Shah, “Identifying behaviors in crowd scenes using stability analysis for dynamical systems,” IEEE Transactions on Pattern Analysis and Machine Intelligence, vol. 34, no. 10, pp. 2064–2070, 2012. [Google Scholar]
14. T. Hospedales, S. Gong and T. Xiang, “Video behaviour mining using a dynamic topic model,” International Journal of Computer Vision, vol. 98, no. 3, pp. 303–323, 2012. [Google Scholar]
15. J. Liu, C. Gao, D. Meng and A. Hauptmann, “Decidenet: Counting varying density crowds through attention guided detection and density estimation,” in IEEE Conf. on Computer Vision and Pattern Recognition, Salt Lake City, UT, USA, pp. 18–23, 2018. [Google Scholar]
16. S. Saleh, S. Suandi and H. Ibrahim, “Recent survey on crowd density estimation and counting for visual surveillance,” Engineering Application on Artificial Intelligent, vol. 41, pp. 103–114, 2015. [Google Scholar]
17. R. Ito, M. Tsukada, M. Kondo and H. Matsutani, “An adaptive abnormal behavior detection using online sequential learning,” in IEEE Int. Conf. on Computational Science and Engineering (CSE) and IEEE Int. Conf. on Embedded and Ubiquitous Computing (EUCNew York, NY, USA, pp. 436–440, 2019. [Google Scholar]
18. A. Khan, J. Shah, K. Kadir, W. Albattah and F. Khan, “Crowd monitoring and localization using deep convolutional neural network: A review,” Application of Science, vol. 10, pp. 4781, 2020. [Google Scholar]
19. M. Saqib, S. Khan, N. Sharma and M. Blumenstein, “Person head detection in multiple scales using deep convolutional neural networks,” in Proc. of the Int. Joint Conf. on Neural Networks, Rio de Janeiro, Brazil, pp. 1–7, 2018. [Google Scholar]
20. Y. Zhang, C. Zhou, F. Chang and A. Kot, “Multi-resolution attention convolutional neural network for crowd counting,” Neurocomputing, vol. 29, pp. 144–152, 2019. [Google Scholar]
21. L. Zhu, C. Li, Z. Yang, K. Yuan and S. Wang, “Crowd density estimation based on classification activation map and patch density level,” Neural Computing and Applications, vol. 32, pp. 5105–5116, 2020. [Google Scholar]
22. S. Basalamah, S. Khan and H. Ullah, “Scale driven convolutional neural network model for people counting and localization in crowd scenes,” IEEE Access, vol. 7, pp. 71576–71584, 2019. [Google Scholar]
23. “Hajj statistics 2019–1440, general authority for statistics,” Kingdom of Saudi Arabia. [Online]. 2019. Available: https://www.stats.gov.sa/sites/default/files/haj_40_en.pdf. [Google Scholar]
24. B. Zhan, D. Monekosso, P. Remagnino, S. Velastin and L. Xu, “Crowd analysis: A survey,” MVA, vol. 19, no. 5–6, pp. 345–357, 2008. [Google Scholar]
25. J. Junior, S. Musse and C. R. Jung, “Crowd analysis using computer vision techniques,” ISPM, vol. 27, no. 5, pp. 66–77, 2010. [Google Scholar]
26. C. Loy, K. Chen, S. Gong and T. Xiang, “Crowd counting and profiling: Methodology and evaluation,” Modeling, Simulation and Visual Analysis of Crowds. Springer, vol. 11, pp. 347–382, 2013. [Google Scholar]
27. C. Loy, K. Chen, S. Gong and T. Xiang, “Crowd counting and profiling: Methodology and evaluation,” MSVAC, vol. 11, pp. 347–382, 2013. [Google Scholar]
28. S. Saleh, S. Suandi and H. Ibrahim, “Recent survey on crowd density estimation and counting for visual surveillance,” EAAI, vol. 41, pp. 103–114, 2015. [Google Scholar]
29. J. Grant and P. Flynn, “Crowd scene understanding from video: A survey,” TOMM, vol. 13, no. 2, no. 19, pp. 2017. [Google Scholar]
30. V. Sindagi and V. Patel, “A survey of recent advances in CNN based single image crowd counting and density estimation,” PRL, vol. 107, pp. 3–16, 2018. [Google Scholar]
31. G. Tripathi, K. Singh and D. Vishwakarma, “Convolutional neural networks for crowd behaviour analysis: A survey,” The Visual Computer, vol. 35, no. 5, pp. 753–776, 2019. [Google Scholar]
32. S. Mohamed and M. Parvez, “Crowd modeling based auto activated barriers for management of pilgrims in mataf,” in 2019 IEEE Int. Conf. on Innovative Trends in Computer Engineering (ITCEAswan, Egypt, pp. 260–265, 2019. [Google Scholar]
33. M. Bielecki, R. Z¨ust, D. Siegrist, D. Meyerhofer, G. Crameri et al., “Social distancing alters the clinical course of covid-19 in young adults: A comparative cohort study,” Clinical Infectious Diseases, vol. 72, no. 4, pp. 598–603, 2021. [Google Scholar]
34. R. Nadikattu, S. Mohammad and P. Whig, “Novel economical social distancing smart device for covid-19,” International Journal of Electrical Engineering and Technology, vol. 11, no. 4, pp. 204–217, 2020. [Google Scholar]
35. A. Ghorai, S. Gawde and D. Kalbande, “Digital solution for enforcing social distancing,” in Proc. of the Int. Conf. on Innovative Computing & Communications, Mumbai, India, pp. 1–5, 2020. [Google Scholar]
36. Y. Boureau, J. Ponce and Y. LeCun, “A theoretical analysis of feature pooling in visual recognition,” in Proc. of the Int. Conf. on Machine Learning, Haifa, Israel, pp. 111–118, 2010. [Google Scholar]
 | This work is licensed under a Creative Commons Attribution 4.0 International License, which permits unrestricted use, distribution, and reproduction in any medium, provided the original work is properly cited. |