DOI:10.32604/iasc.2022.019892
| Intelligent Automation & Soft Computing DOI:10.32604/iasc.2022.019892 | |
| Article |
Fusion-Based Supply Chain Collaboration Using Machine Learning Techniques
1School of Business Administration, National College of Business Administration and Economics, Lahore, 54000, Pakistan
2Center for Cyber Security, Faculty of Information Science and Technology, University Kebansaan Malaysia (UKM), 43600, Bangi, Selangor, Malaysia
3School of Information Technology, Skyline University College, University City Sharjah, 1797, Sharjah, UAE
4School of Computer Science, National College of Business Administration and Economics, Lahore, 54000, Pakistan
5Riphah School of Computing & Innovation, Faculty of Computing, Riphah International University Lahore Campus, Lahore, 54000, Pakistan
6School of Business, Skyline University College, University City Sharjah, 1797, Sharjah, UAE
7Department of Computer Science, Lahore Garrison University, Lahore, Pakistan
8Pattern Recognition and Machine Learning Lab, Department of Software, Gachon University, Seongnam, Gyeonggido, 13120, Korea
*Corresponding Author: Muhammad Adnan Khan. Email: adnan@gachon.ac.kr
Received: 30 April 2021; Accepted: 21 July 2021
Abstract: Supply Chain Collaboration is the network of various entities that work cohesively to make up the entire process. The supply chain organizations’ success is dependent on integration, teamwork, and the communication of information. Every day, supply chain and business players work in a dynamic setting. They must balance competing goals such as process robustness, risk reduction, vulnerability reduction, real financial risks, and resilience against just-in-time and cost-efficiency. Decision-making based on shared information in Supply Chain Collaboration constitutes the recital and competitiveness of the collective process. Supply Chain Collaboration has prompted companies to implement the perfect data analytics functions (e.g., data science, predictive analytics, and big data) to improve supply chain operations and, eventually, efficiency. Simulation and modeling are powerful methods for analyzing, investigating, examining, observing and evaluating real-world industrial and logistic processes in this scenario. Fusion-based Machine learning provides a platform that may address the issues/limitations of Supply Chain Collaboration. Compared to the Classical probable data fusion techniques, the fused Machine learning method may offer a strong computing ability and prediction. In this scenario, the machine learning-based Supply Chain Collaboration model has been proposed to evaluate the propensity of the decision-making process to increase the efficiency of the Supply Chain Collaboration.
Keywords: Business intelligence; k-nearest neighbor; machine learning; simulation; supply chain collaboration; support vector machine
The supply chain is the collaborative controlled and structured movement of components from supplier to producer, manufacturer to wholesaler, wholesaler to retailer, and retailer to end customer. The goal of a sound supply chain system is to minimize inventory errors. Simulation software techniques can be used in the production process to implement more efficient solutions. With the help of sophisticated business intelligence software, it is less difficult to keep track of supply chain coordination and company operations. Business intelligence design and simulation are widely used in different fields, from the supply chain and industry, to military, business, health, and wealth management, as well as from complex systems design to tool development support for decision design. Modern art in the simulation-based optimization of natural complex systems easily suggests the use of a wide variety of scientific approaches, models, techniques, and methods over the years. Multi-objective optimization problems involving multiple stochastic variables must be solved to find proper and optimal solutions in these areas. All product movements, from source to consumer, are included in the product flow. The information flow is linked to the filling of demand, a service venue, and feedback. The finance flow includes all fees, consignment, and title ownership contracts.
As a result, machine learning and machine learning techniques are often integrated into simulation models to increase efficiency and replicate revolutionary control processes that usually require the human element. Supply chain management is a complicated operation, so keeping productivity flowing smoothly and concentrating on poor areas in a chain, where there is always space for improvement, is essential. Day-to-day decisions such as scheduling, lead-time quotes, routing, and truck loading are handled at the organizational level by managers or team leaders [1].
Optimization algorithms inspired by natural observation, combined with machine learning methods, can create practical and robust solutions in supply chains and industries. Simulation approaches have been widely used to investigate industrial plants’ internal logistical problems; simulation models investigate warehouse efficiency and reduce internal logistics costs. Inability to identify potential risk and develop mitigation strategies for hazards with a high probability of occurring may jeopardize business continuity and profit. On the other hand, companies that prioritize risk are more likely to face real issues such as adaptability and responsiveness to unforeseen interests. They take risks for the betterment of their companies. SMBs must develop a comprehensive risk management plan that tackles key and critical threats to the network inventory of suppliers, such as quality and implementation of suppliers, volatility in the supply value, a confusing product and administration mix, a perceived lack of outsourcing operations and connections, and a lack of physical appropriation.
The importance of supply chain management to company operations and socioeconomic growth cannot be overstated. The new supply chain efficiency management and cooperation, on the other hand, are unable to control the risk posed by inefficient supply chain management. Today’s companies are interested in partnering or sharing in the supply chain. Several considerations must be taken into account at the same time. In this regard, an intelligent model based on fusion approaches is proposed to choose an effective Supply Chain Collaboration strategy. To that end, an exhaustive analysis of the literature is used to extract the essential factors for Supply Chain Collaboration. An intelligent simulation model for the supply chain is built using fusion-based approaches and machine learning techniques to reveal the results. This allows an intelligent architecture for the supply chain cooperation to be made through fusion-based methods driven by K-Nearest Neighbor (k-NN) and Support Vector Machines (SVM) which, when integrated with the cloud, can not only increase supply chain coordination, but can also improve the entire process using machine-learning techniques.
The model simulation is conducted on the MATLAB platform, and the model plausibility is analyzed. The study demonstrates that the model presented has a clear functional impact and can be used in real-world Supply Chain Collaboration.
1.1 Supply Chain Collaboration
Many businesses are moving toward digitalization to create cost-effective devices, real-time business connections, and cross-border collaboration [2]. It based on order size, lead time volatility, and supplier scrap rate, they could conclude the effect on consumer delivery time, order consistency, and inventory costs [3]. Regarding inventory level and order lead time, we looked at the impact of order size and inventory management strategy. Digitalization helps companies to reduce their costs while increasing sales, supplier lead times, and efficiency. Organizations are now looking beyond automation and focusing on machine-to-machine connectivity in real-time information systems that impact the global economy [4]. A Coordinated performance system (CPS), knowledge exchange, decision synchronization, reward matching, and innovative supply chain systems are the five main elements of supply chain cooperation which enable effective product and financial data management as shown in Fig. 1. As a result of the continuous growth and dynamic networks, the supply chain became inefficient, with too many processes to track and manage [5]. To decide what constitutes successful or unsuccessful decisions and behaviors, the architectural view of cooperation indicates that chain members must understand the interactions among elements. For example, when deciding what compensation strategy to use to reward success, chain members will decide on the performance goals that generate total values. Design for Supply Chain Collaboration is described as a method for planning and improving collaboration architecture.
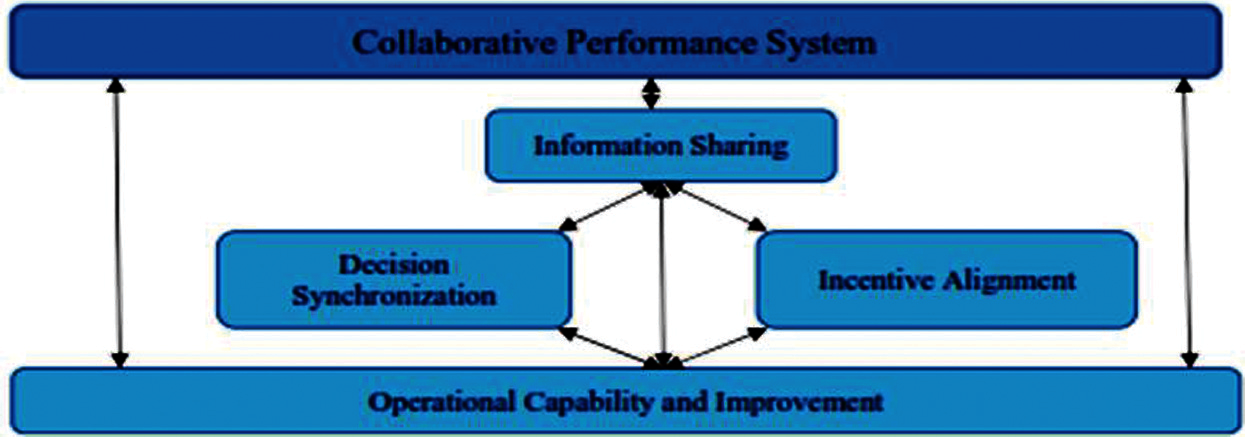
Figure 1: The interplay among five factors of supply chain collaboration [6]
1.2 Adoption of Machine Learning in Supply Chain Collaboration
Machine learning is the use of computer algorithms and is considered part of artificial intelligence. It plays a vital role in the development of computer programs and in accessing data. Machine learning and automation, for example, are helping to increase the efficiency of processes both within the company and among the supply chain partners. Due to the new market environment’s uncertainty and dynamism, supply chain cooperation has become more information intensive. As a result, professionals and researchers have looked at ways to handle data appropriately and use it to make more informed decisions [7]. The prevalent problem for manufacturers is to predict demand vs. supply and minimize production lead times [8]. As a result, they must provide themselves with the necessary tools, procedures, and technologies to develop new goods and provide world-class services [9]. Global competitiveness, a lack of adaptability, and a late entrance into the industry are all factors that affect supply chain management volatility. Technological advancements and the Internet of Things can overcome these obstacles, disrupting the supply chain market dramatically [10]. For example, this technology can track the consignment location and the truck’s pace to inform customers of late deliveries. The Internet of Things (IoT) can be used to remotely track the status of appliances. Supply chain cooperation suffers from confusion or knowledge asymmetry in certain decisions, referred to as the “bullwhip effect” or upstream amplification of demand heterogeneity. As a result, achieving accurate planning for each entity is complex. To put it another way, the decision-making phase in the flow of products and services, as well as Supply Chain Collaboration, includes several dynamic decision-making mechanisms and knowledge barriers.
Machine learning is a huge help when it comes to supply chain collaboration. In supply chains, the need to make choices in the face of volatility is essential [11–15]. Machine learning arose over the last two decades from the increasing capacity of computers to process large amounts of data. Computational Intelligence approaches like Swarm Intelligence [16], Evolutionary Computing [17] like Genetic Algorithm [18], Neural Network [19], Deep Extreme Machine learning [20] and Fuzzy system [21–27] are strong candidate solution in the field of smart city [28–30], smart health [31–33], and wireless communication [34,35], etc. Some machines could also uncover secret patterns and complicated interactions that humans could not, allowing them to make appropriate and accurate judgments in the face of extraordinarily disruptive and discontinuous data. In several decision-making realms, including supply chain coordination, the literature showed that machines could produce more reliable outcomes than humans [12]. With the advent of digitization, information, automation, communication technologies, and machine learning, the “fourth industrial revolution” is underway. In order to avoid fluctuations in demand and financial risk, these advances necessitate catching up. As a result, an organization’s competitiveness in the global marketplace depends on its ability to purchase products, translate materials into finished goods, and distribute goods to consumers using a fluent supply chain [13].
In Fig. 2, the Supply Chain Strategy is formulated. This strategy is comprised of the Supply Chain Strategic plans, which can be changed from time to time for continuous improvement. The Supply Chain participants (suppliers, manufacturers, distributors, retailers, and customers) are the key players. The activities of the supply chain life cycle include Plan, Source, Make, Deliver and Return. The data from the life cycle activities move to Machine learning. The data are moved to the machine learning algorithm. At this stage, 30% of information is transferred for testing purposes, and 70% of data are carried for training purposes.
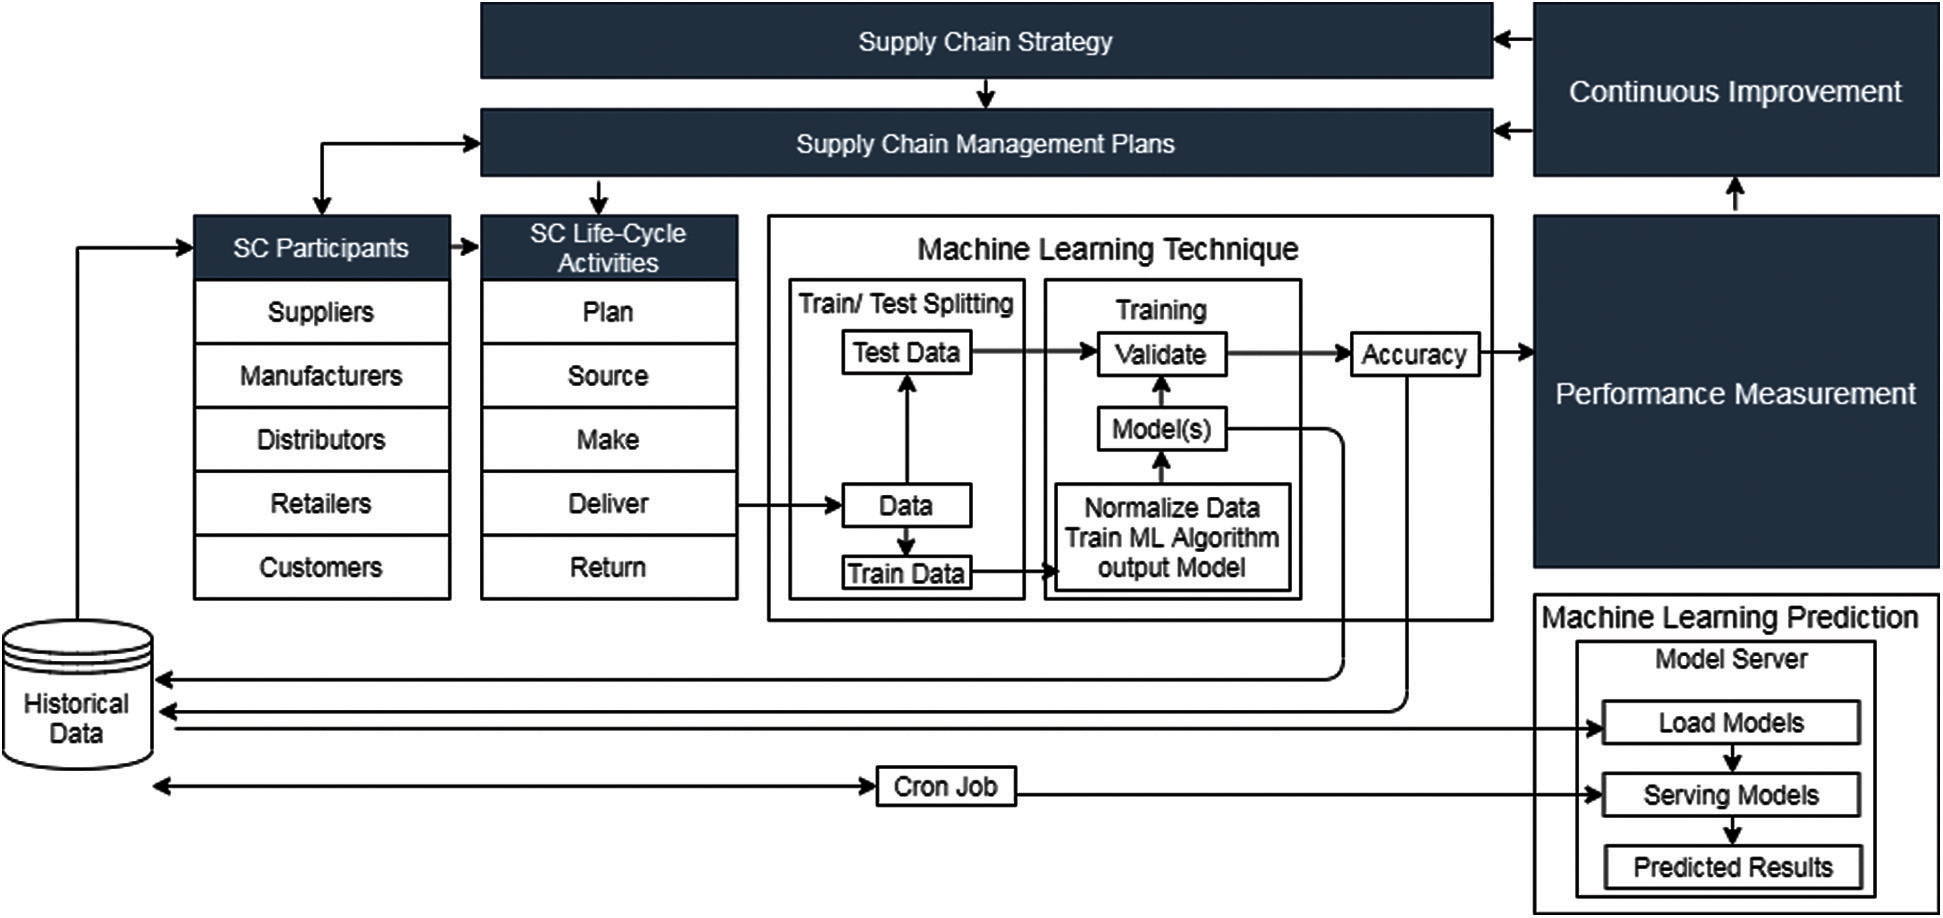
Figure 2: Adapted supply chain strategy and machine learning: A framework of understanding [14]
The 30% normalized data are moved forward for validation purposes, and 70% of machines’ training data are used for validation. The training model and accuracy results are stored in data sources for measuring the performance. The machines are trained by using this data until the required results are obtained. The training, testing, and validation data are stored in the cloud and used for predictive purposes. Machine learning prediction is carried out in the next step. Machine learning models will be used to provide feedback, and the desired projection will be given. Each store’s sales are predicted using machine learning. Based on a time series, the machine-learning algorithm forecasts revenue. After continuous loops, the Cron job updates the data at regular intervals. The data accuracy is checked after the intervals. The accurate data are advanced for performance measurement and then for constant improvement, which helps in minor changes of supply chain strategy and modification of supply chain management plans. These changes increase the efficiency of the product.
The output from the data set of supply chain collaboration, taken from Kaggle, is comprised of the Category, Customer Country, Order Country, and Customer Feedback. The data set is ‘trained’ within the proposed model of supply chain collaboration to check the accuracy of the proposed model. Data are explored, evaluated, and pre-processed according to requirements before launching into model preparation. The data are normalized and divided into 70% and 30%. Seventy percent of the data are cast-off for training purposes and 30% of the data are used for testing and validation purposes.
3 Proposed Intelligent Model of Supply Chain Collaboration Empowered with Fused Machine Learning Techniques
The most appropriate approach to dealing with the stochastic design of genuine current supply chains is to propose an intelligent model for supply chain coordination that provides local optimal solutions for specific challenges affecting the entire supply chain. We can see the effects of different combinations of essential parameters (inventory management policies, lead times, demand volume and uncertainty, knowledge exchange, demand forecasting approaches, etc.) on various output metrics using an intelligent system-based approach in this domain. Machine learning-enabled approaches are a systematic reasoning technique that uses two machine learning algorithms, K-nearest Neighbor Machine and Support Vector Machine, to understand a system’s dynamic actions.
A detailed review must also indicate the role of fast-developing countries in logistics. For several Western firms, there are distribution centers and large markets. To be competitive in these new emerging markets, companies must explore various scenarios and test various supply chain models in terms of multiple factors such as budgets, revenue prices, and local content ratios, among others. Several supply chain scenarios are available for choosing the right solution: simulation combined with comprehensive experimental preparation, combined with sophisticated statistical techniques.
Fig. 3 elaborates on the proposed model for Supply Chain Collaboration. The data set samples obtained through the Data Acquisition layer contain the Category Name, Customer Country, Order Country, Order Item Discount, Order Item Product Price, Order Item Quantity, Shipping Mode, Order Status, and Feedback. The raw data move from the Data Acquisition layer to the Internet of Things via sensors. The data are transferred to the Pre-Processing layer where the raw data are pre-processed and converted into an understandable format. In this layer, the categorized samples are retrieved, the missing values are removed, and the outliers are handled.
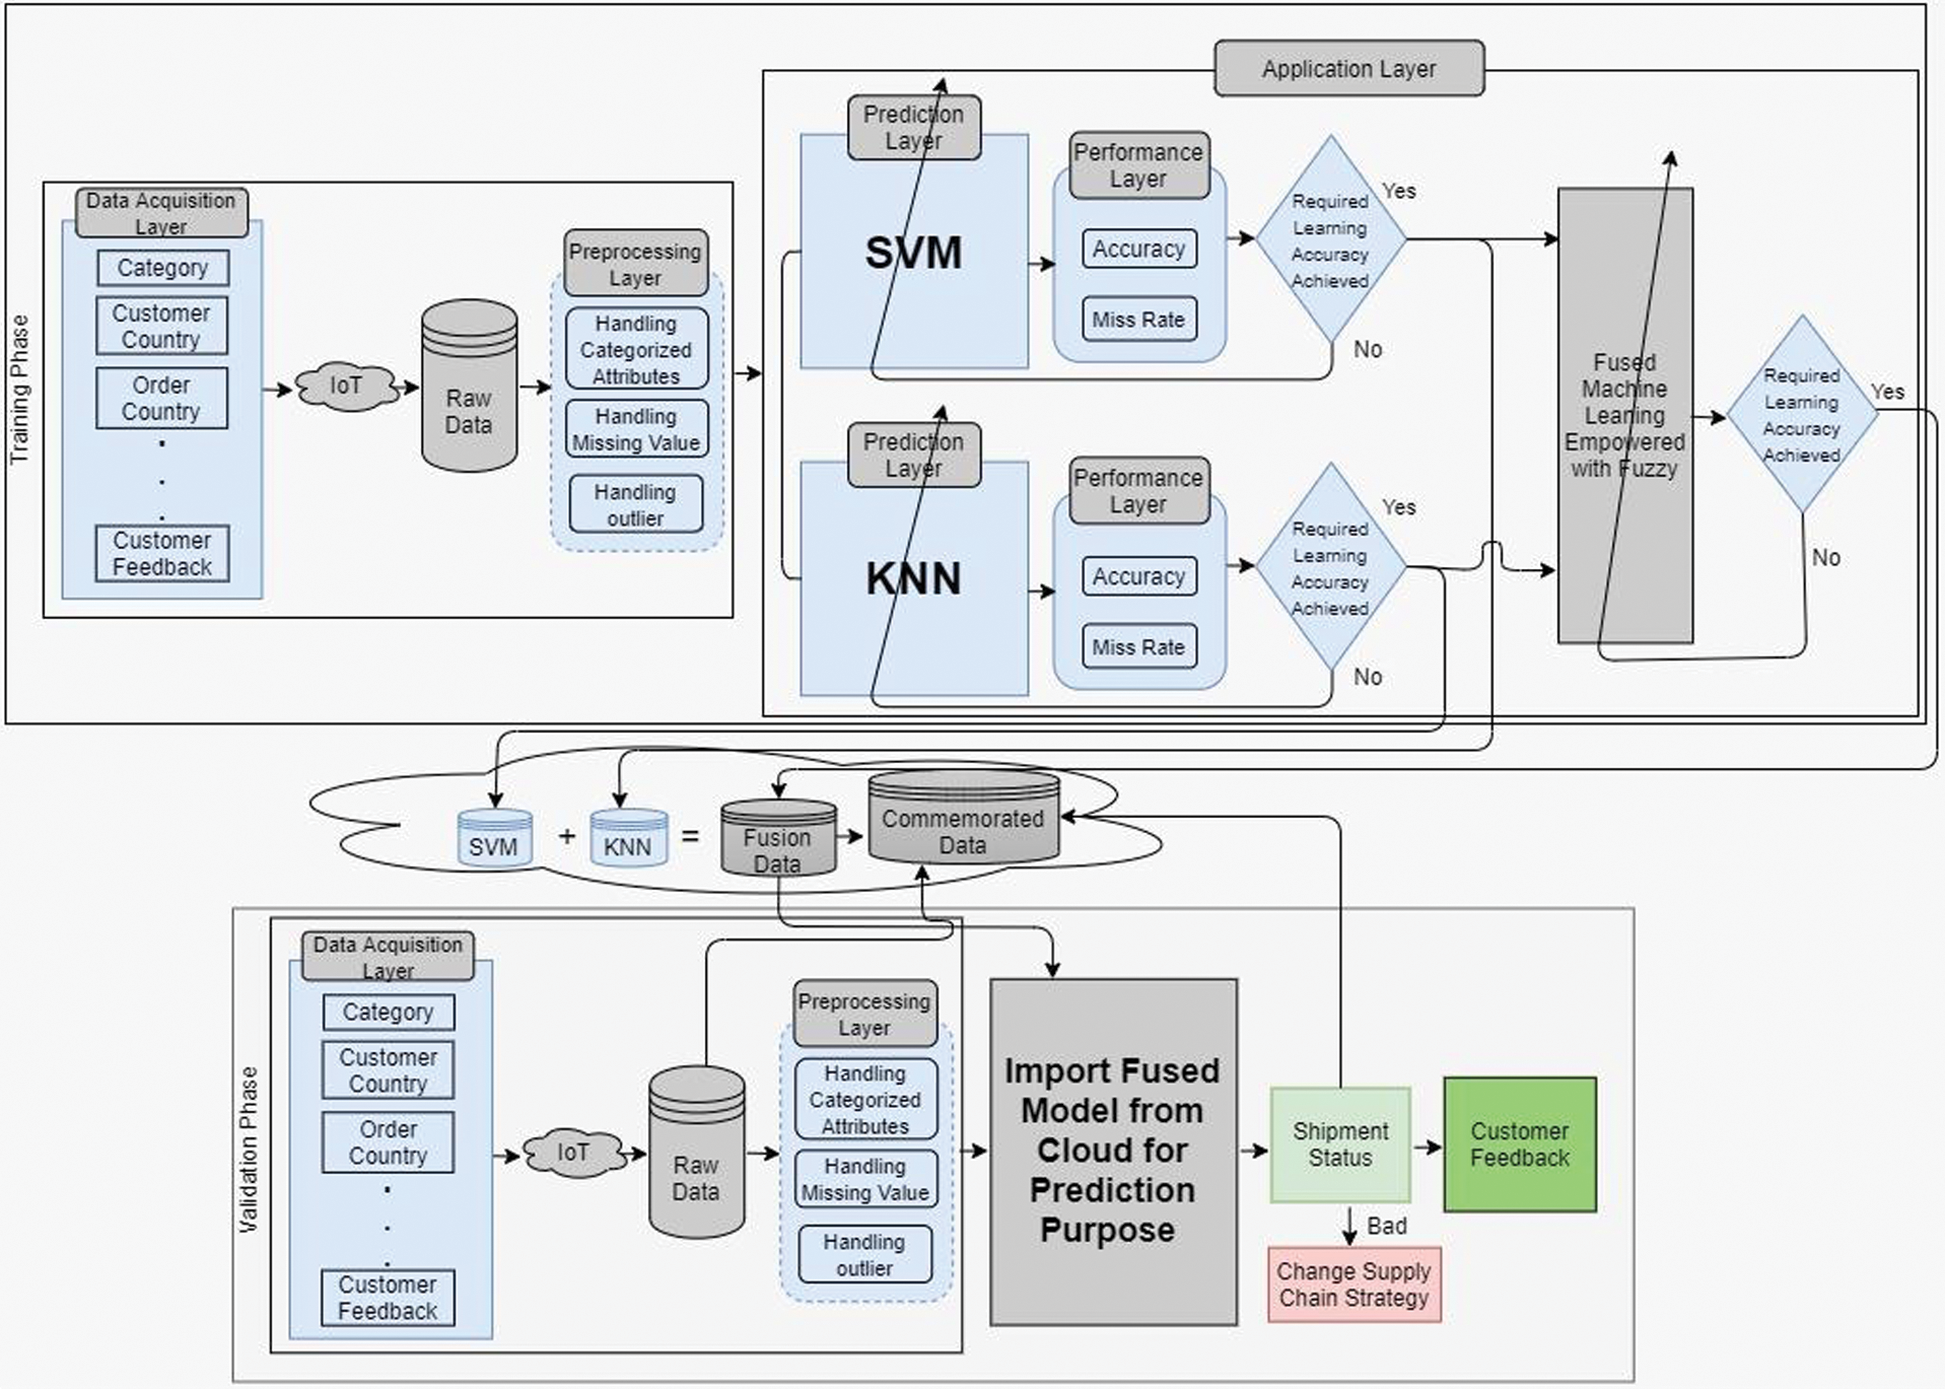
Figure 3: Proposed model of supply chain collaboration empowered with fused machine learning techniques
The data are moved from the Pre-Processing layer to the Application layer, which is further divided into two layers.
i) Prediction layer
ii) Performance Layer
In the Application layer, different algorithms are applied to the Prediction layer. In this proposed intelligent model, two algorithms have been used,
i) Support Vector Machine (SVM)
ii) k-Nearest Neighbor (k-NN)
These two algorithms are further divided into two membership functions:
SVM:
i) Fine gaussian SVM
ii) Cubic SVM
k-NN:
i) Fine k-NN
ii) Weighted k-NN
The data move to the Performance layer, where the accuracy and the Miss rate of the data are checked. If the required learning accuracy is achieved, then the data are moved for fusion and at the same time stored in the cloud. The exact process occurs on the k-NN side. If the required learning is not achieved, then the data are moved back to the SVM or k-NN for retraining, until the necessary understanding is achieved. The same training is done at the Fusion level. After the required learning at the SVM and k-NN levels, the data are fused and retrained for improved results. Although the required results are obtained in this phase, the information is moved and stored at the cloud level. If the necessary learning of fused data is not achieved, the learning loop continues until the desired result is obtained and stored in cloud containers at Fusion Data.
The data are acquired through the Data Acquisition layer, then passed through the IoT sensors and moved to the Raw Data at the validation phase. At this stage, the raw data is then moved to the Pre-Processing layer where the categorized samples are retrieved, the missing values are removed, and the outliers are handled.
The data are then fused and the fused model is exported from the cloud for prediction purposes.
The training data are stored individually in SVM and k-NN cloud containers, and then fused as data fusion. Then all the training and the validation data are stored as ‘learned’ data for future predictions.
At this stage, the shipment status is checked, and the customers’ feedback is obtained. If the customers’ feedback is Satisfactory, Good, or Average, the data are stored as learned data for future predictions. If the customers’ feedback is Bad, the management is advised and asked to change the supply chain collaboration strategies. Management makes desired changes directed by the customers. This entire process can be repeated to obtain continued improved results.
Support Vector Classification (SVC) and Support Vector Regression (SVR) are two types of classification and regression problems for which SVM is used. In machine learning, SVC handles learning models with learning algorithms. SVC analyzes data for classification. Comprehensive data sets are needed to train better-supervised algorithms to identify the existence of scintillation during new measurement research. It is designed to categorize various types of data from multiple disciplines. Both have been used for two-category classification problems and applied to both linear and non-linear data classification operations. The SVM algorithm is effective within higher dimensions. Moreover, it is best suited to data sets where classes are divisible. It is more suitable for extreme cases of binary classification.
One of the most fundamental programming algorithms is k-Nearest Neighbor. This non-parametric classification method makes it easy to implement machine learning. Input values are used to simulate output values in machine learning models. k-NN categorizes the information based on how its neighbor is ranked by classifying new data points based on the similarity measurements of previous data points. For instance, in a dataset containing tomatoes and bananas, k-NN maintains similar criteria, such as shape and color. When a new object is introduced, the color (red or yellow) and the body are identical. Finding a neighbor is not an easy task because a small value of k could exert substantial influence on the result.
The “k” in k-NN represents the number of the nearest neighbors used to classify new data points. k-NN is used when the data are normalized, noise-free, and adequately labeled.
The data set is gleaned from Kaggle and two algorithms, SVM and k-Nearest neighbor are applied. Additionally, two other techniques are used, resulting in 3-fold cross-validation.
Four Simulation Matrices: Results From Applying Fused Machine Learning Techniques to the Proposed Model
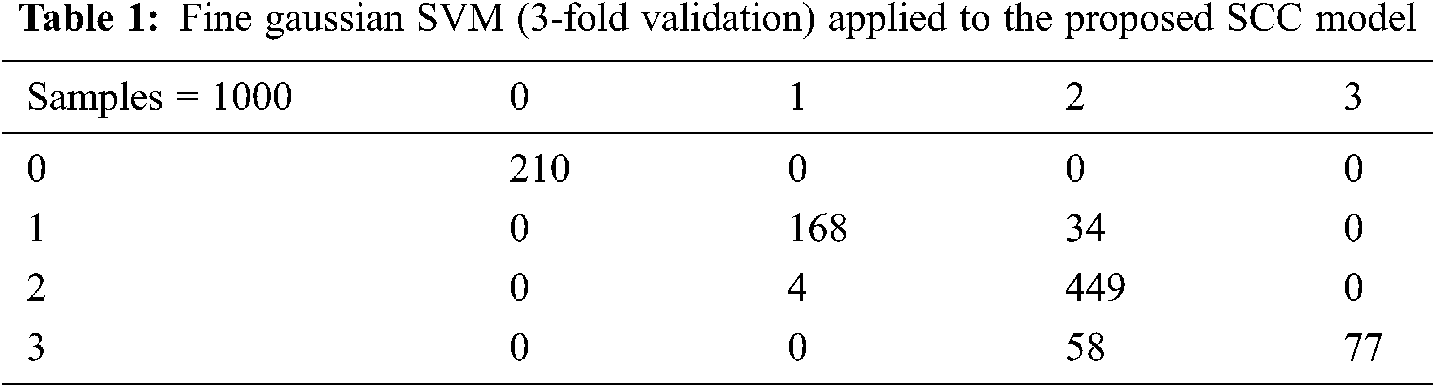
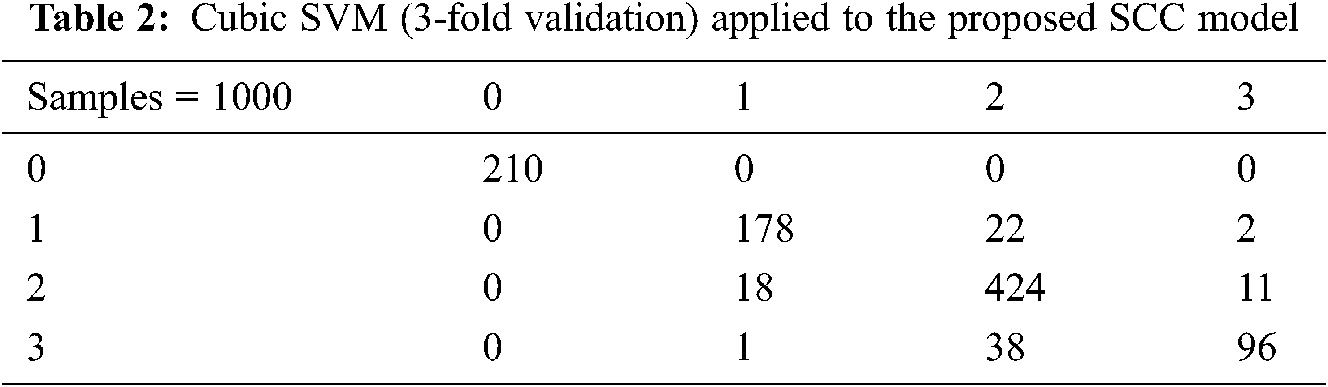
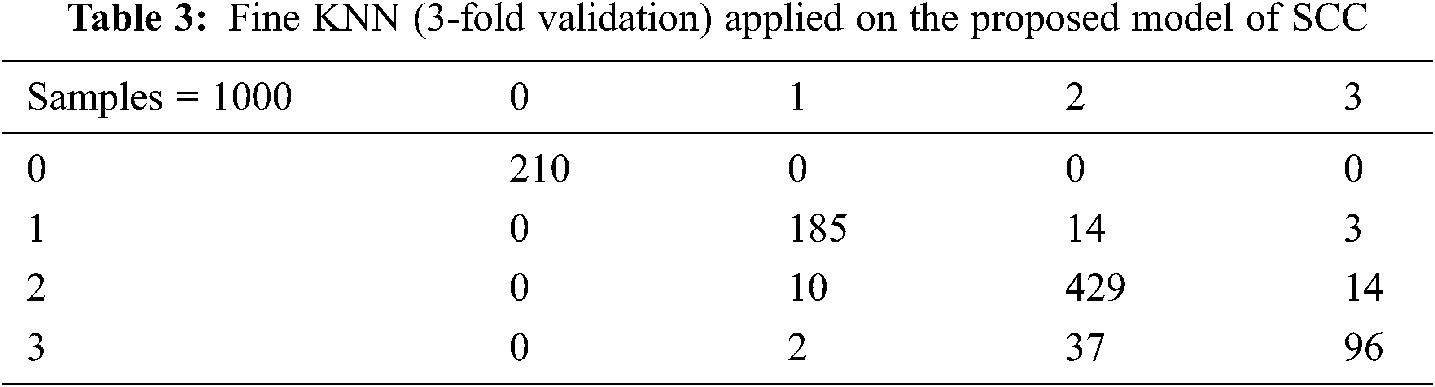
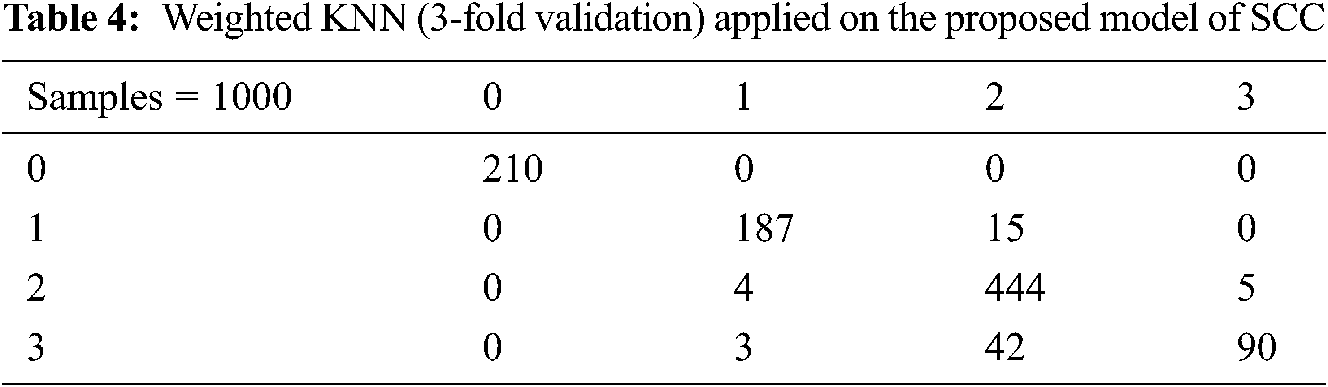
The results of the data set are described in tabular form below. The samples are categorized as 0 = Satisfactory, 1 = Good, 2 = Average, and 3 = Bad.
In Tab. 1 the SVM technique of Fine Gaussian SVM is used. The data set includes a sample of 1,000 responses. The customers’ feedback is indicated using 0 = Satisfactory, 1 = Good, 2 = Average, and 3 = Bad. The results obtained by applying 3-fold validation to this machine learning technique are 90.4%.
In Tab. 2 the SVM technique of Cubic SVM is applied. The data set includes a sample of 1,000 responses. The customers’ feedback is indicated using 0 = Satisfactory, 1 = Good, 2 = Average, and 3 = Bad. The results obtained by applying 3-fold validation to this machine learning technique are 90.8%.
In Tab. 3 the k-Nearest Neighbor, the machine learning technique of Fine k-NN is applied. The data set includes a sample of 1,000 responses. The customers’ feedback is indicated using 0 = Satisfactory, 1 = Good, 2 = Average, and 3 = Bad. The results obtained by applying 3-fold validation to this machine learning technique are 92%.
In Tab. 4 the k-Nearest Neighbor technique of Weighted k-NN is applied. The data set includes a sample of 1,000 responses. The customers’ feedback is indicated using 0 = Satisfactory, 1 = Good, 2 = Average, and 3 = Bad. The results obtained by applying 3-fold validation to this machine learning technique are 93.1%.
3.3 Fusion of Machine Learning Techniques
Every model is processed in the cloud after the machine learning techniques have been optimized. Within the context of this study, the next stage of the Training layer is to develop and apply fuzzy logic to optimized classification algorithms. Fine Gaussian SVM, Cubic SVM, Fine k-NN, and weighted k-NN generate the logic using fuzzy rules as seen below. Conditional or if-then statements are used to create fuzzy logic. Based on these statements, fuzzy rules are constructed as follows:
IF Feedback at (SVM is Satisfactory, and k-NN is Satisfactory THEN overall (Feedback is Satisfactory)).
1. IF Feedback at (SVM is Satisfactory, and k-NN is Good THEN overall (Feedback is Good)).
2. IF feedback at (SVM is Satisfactory, and k-NN is Average THEN overall (Feedback is Good)).
3. IF Feedback at (SVM is Satisfactory, and k-NN is Bad THEN overall (Feedback is Average)).
.
.
.
64. IF Feedback at (SVM is Bad, and k-NN is Bad THEN overall (Feedback is Bad)).
Fig. 4 shows the 3-D view of the ruled surface of the proposed supply chain collaboration based on machine learning techniques of the SVM and k-NN. The yellow shading shows Satisfactory customer feedback; the green shading shows good customer feedback; the blue color shows bad customer feedback for the proposed machine learning surface.
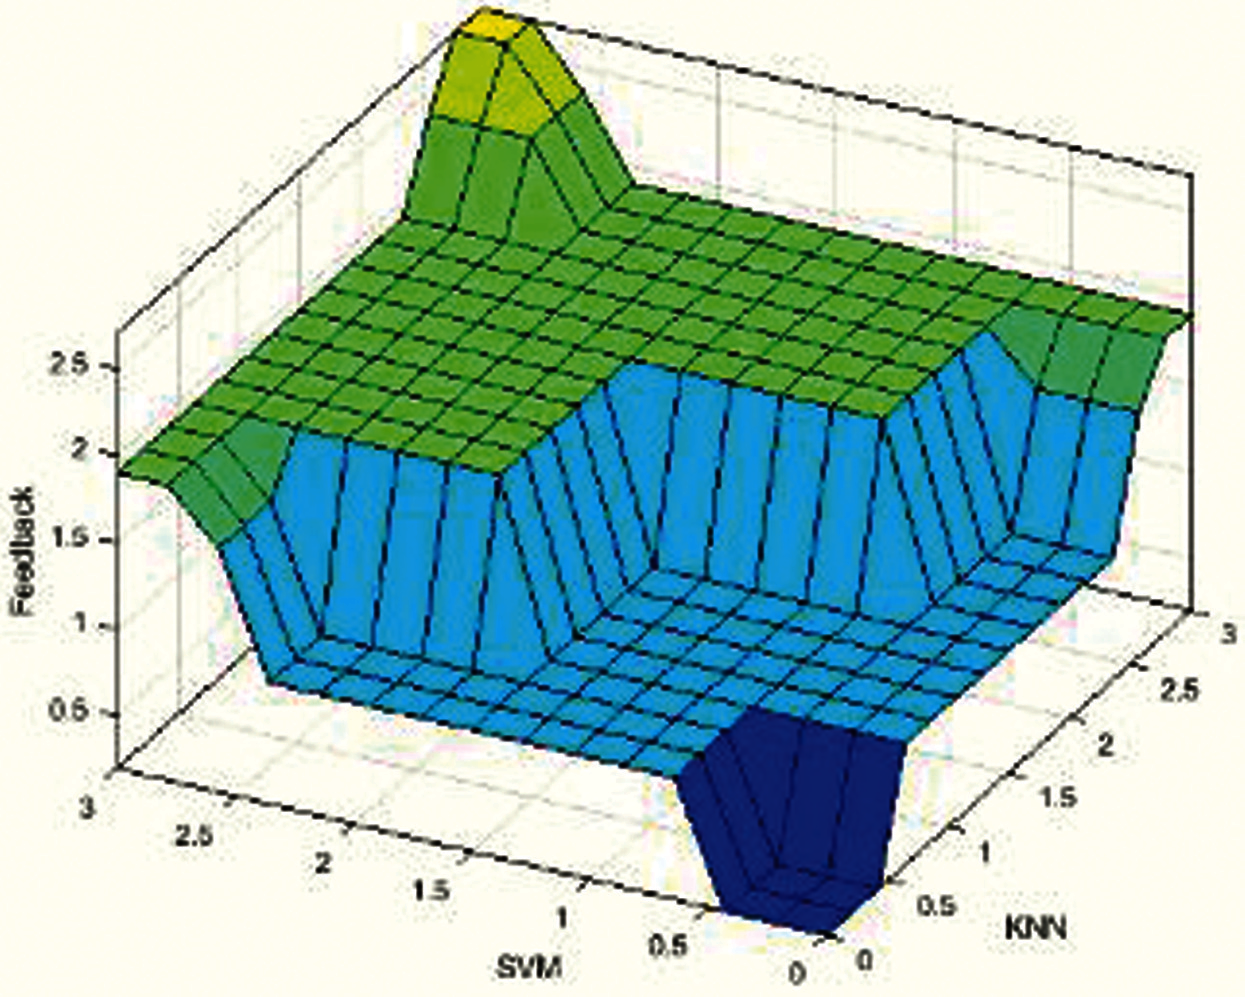
Figure 4: Ruled surface of the proposed SCC
The Input/Output layer contains a total of 64 rules. Some of them are shown in Fig. 8. Fig. 5 shows that if SVM is Satisfactory and k-NN is Good, then feedback will be Good. Fig. 6 shows that if SVM is Satisfactory and k-NN is Bad, then feedback will be Average. Fig. 7 shows that if SVM is Satisfactory and k-NN is Satisfactory, then feedback is also Satisfactory. Finally, Fig. 8 shows that if SVM is Bad and k-NN is Bad, feedback is also Bad.

Figure 5: Lookup diagram of proposed model of ML for SCC (Satisfactory)
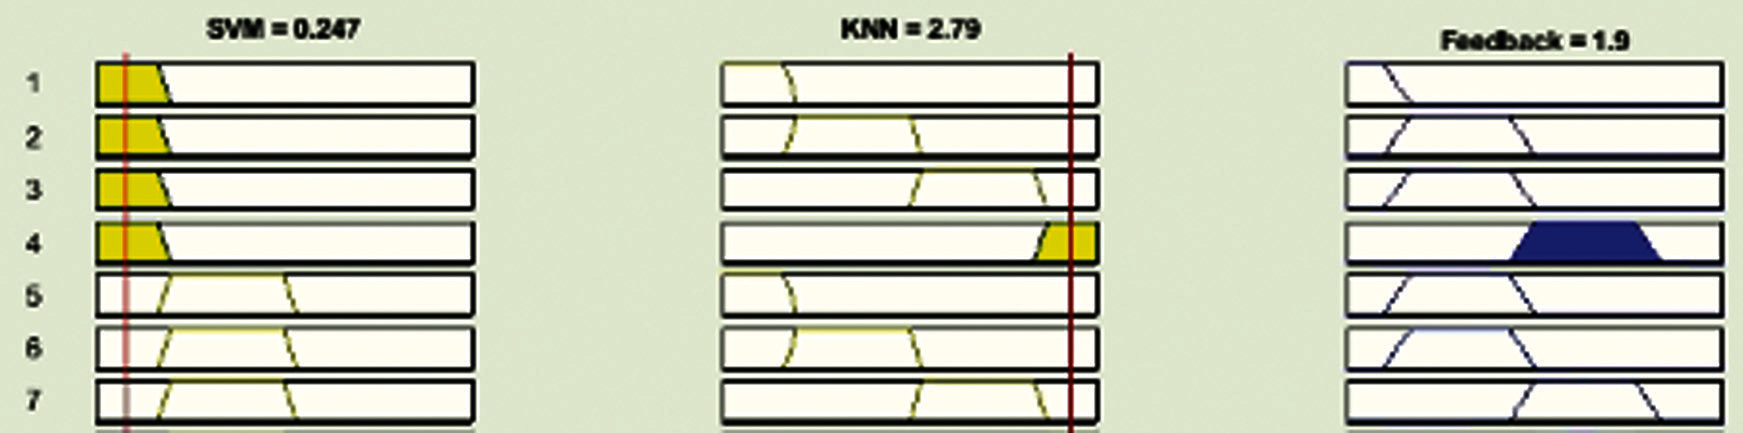
Figure 6: Lookup diagram of proposed model of ML for SCC (Good)

Figure 7: Lookup diagram of proposed model of ML for SCC (Average)

Figure 8: Lookup diagram of proposed model of ML for SCC (Bad)
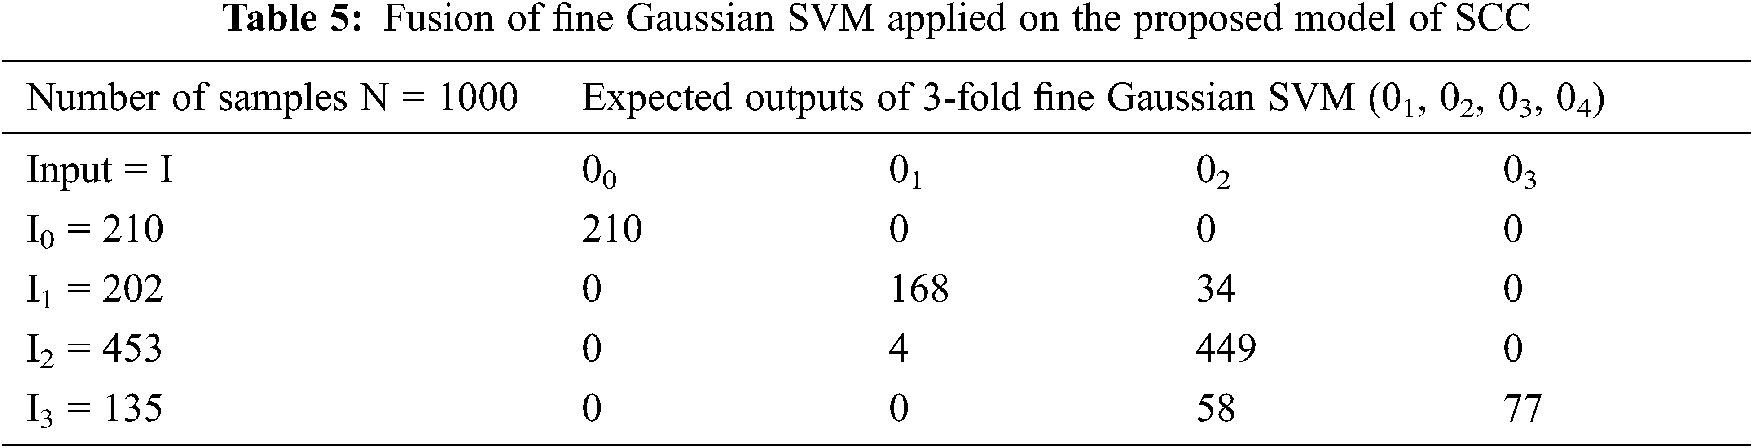
In Tab. 5, the fusion is applied to the proposed model of supply chain collaboration by taking 00 = 210,01 = 202, 02 = 453, 03 = 135 as inputs shown vertically, expressing the sum of information, and 00, 01, 02, 03 as expected outputs. The data set includes a sample of 1,000 responses.
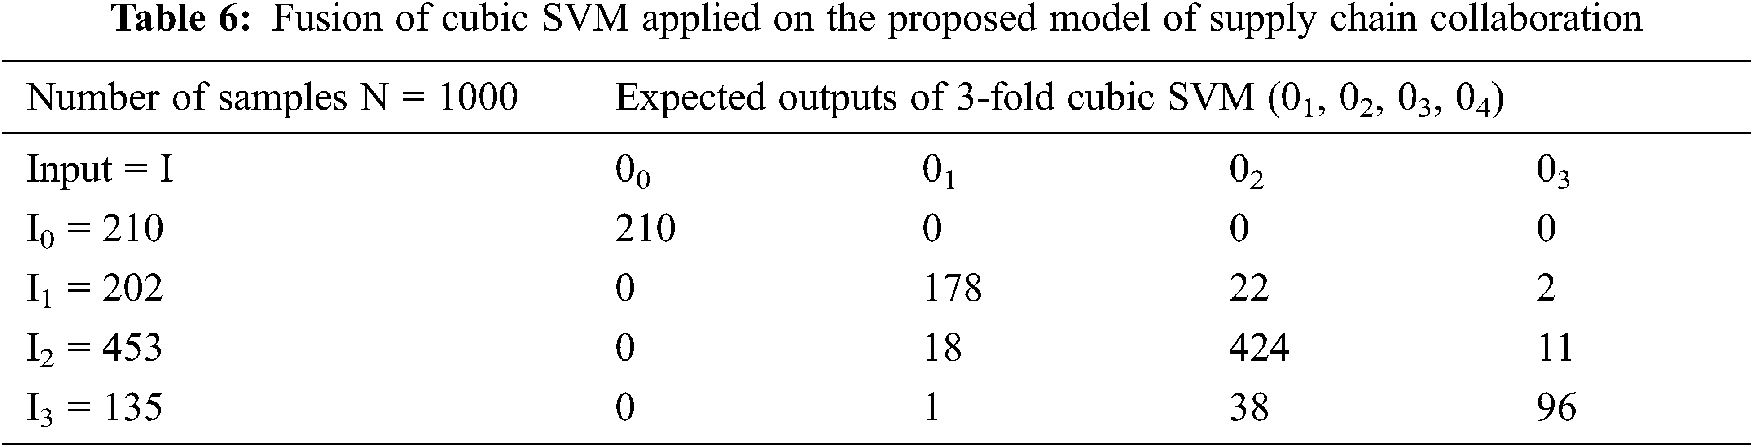
In Tab. 6, the fusion is applied to the proposed supply chain collaboration model by taking I0 = 210, I1 = 202, I2 = 453, and I3 = 135 as inputs, shown vertically 00, 01, 02, 03 as expected outputs. The data set includes a sample of 1,000 responses.
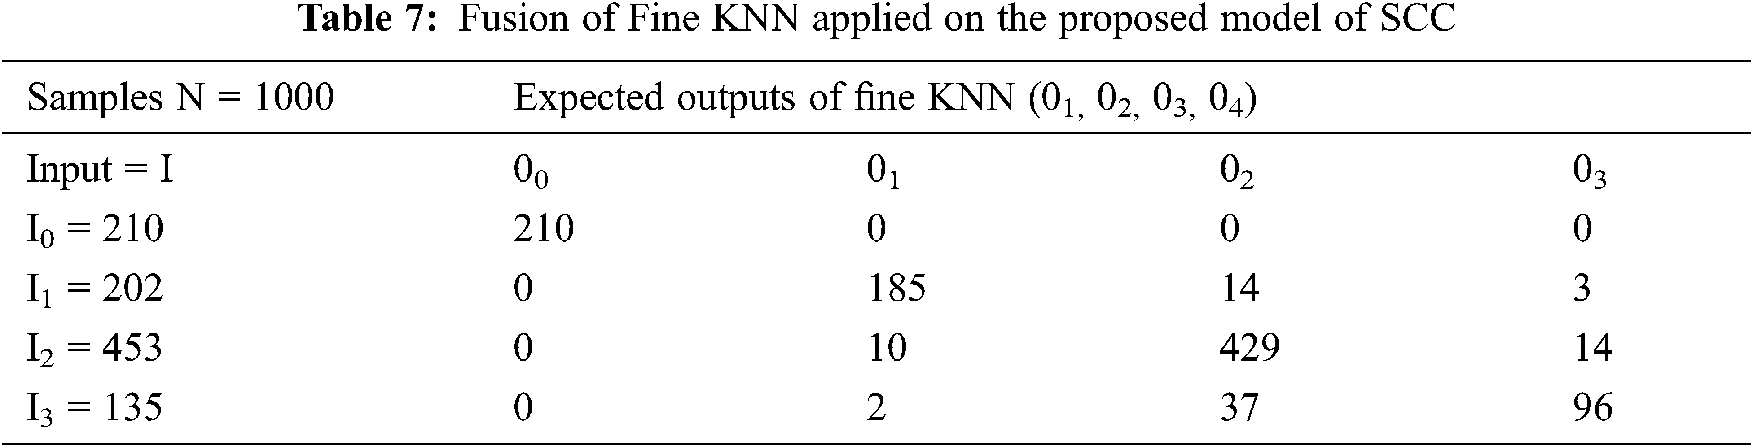
In Tab. 7, the fusion is used on the proposed Supply Chain Collaboration model by taking the 00 = 210, 01 = 202, 02 = 453, 03 = 135 as inputs shown vertically expressing the sum of information and 00, 01, 02, 03 as expected outputs. The data set includes a sample of 1,000 responses.
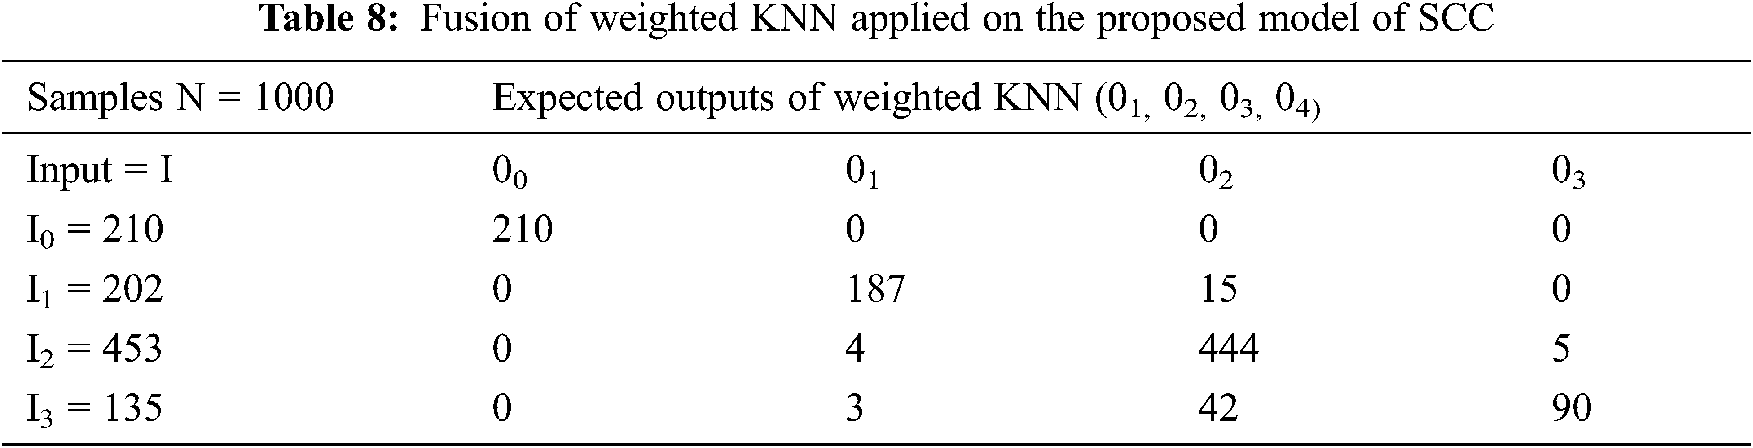
In Tab. 8, the fusion is applied to the proposed Supply Chain Collaboration model by taking the 00 = 210, 01 = 202, 02 = 453, 03 = 135 as inputs, shown vertically the sum of information and 00, 01, 02, 03 as expected outputs. The data set includes a sample of 1,000 responses.
3.4 Simulation Results of Machine Learning Techniques
The outcomes of the confusion matrices of the machine learning techniques applied to the proposed model of the Supply Chain Collaboration are described below.
In Tab. 9, the Confusion Matrices show the results of machine learning techniques applied to the proposed Supply Chain Collaboration model. In the SVM algorithm, two Fine Gaussian SVM methods and Cubic SVM are used. In the k-NN algorithm, the two modes of Fine k-NN and Weighted k-NN are used. The Sensitivity, Specificity, Precision, and F1 Score of the fused machine learning techniques have also been found for each Feedback attribute (0, 1, 2, 3).
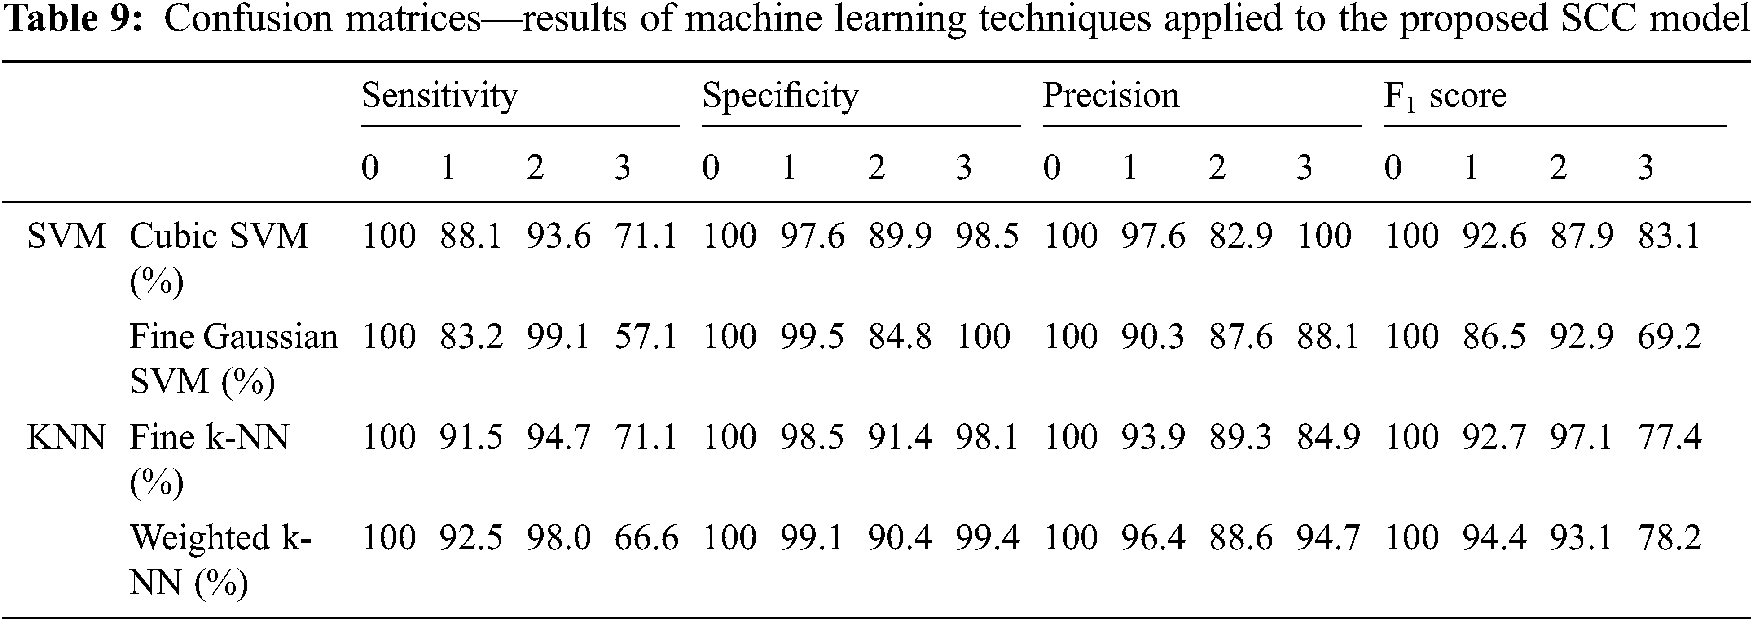
The Sensitivity results for the Confusion Matrices of the SVM algorithm and its first technique of Cubic SVM are 100% for 0, 88.1% for 1, 93.6% for 2, and 71.1% for 3. The Sensitivity results for the Confusion Matrices of the SVM second technique of Fine Gaussian SVM are 100% for 0, 83.1% for 1, 99.1% for 2, and 57.1% for 3. The Sensitivity results for Confusion Matrices of the k-NN algorithm and its first technique of Fine k-NN are 100% for 0, 91.5% for 1, 94.70% for 2, and 71.11% for 3. The Sensitivity results for the Confusion Matrices of the k-NN algorithm and its k-NN second technique of Weighted k-NN are 100% for 0, 92.57% for 1, 98.01% for 2, and 66.67% for 3.
The Specificity results for the Confusion Matrices of SVM algorithm and its first technique of Cubic SVM are 100% for 0, 97.6% for 1, 89.9% for 2, and 98.5% for 3. The Specificity results for the Confusion Matrices of SVM’s second technique of Fine gaussian SVM are 100% for 0, 99.4% for 1, 84.7% for 2, and 100% for 3. The Specificity results for the Confusion Matrices of the k-NN algorithm and its first technique of Fine k-NN are 100% for 0, 98.49% for 1, 91.4% for 2, and 98.1% for 3. The Specificity results for the Confusion Matrices of the algorithm and its k-NN second technique of Weighted k-NN are 100% for 0, 99.1% for 1, 90.4% for 2, and 99.4% for 3.
The Precision results for the Confusion Matrices of the SVM algorithm and its first Cubic SVM technique are 100% for 0, 97.6% for 1, 87.82.9% for 2, and 100% for 3. The Precision results for the Confusion Matrices of SVM second technique of Fine Gaussian SVM is 100% for 0, 90.3% for 1, 87.6% for 2, and 88.1% for 3. The Precision results for the Confusion Matrices of the k-NN algorithm and its first technique of Fine k-NN are 100% for 0, 93.9% for 1, 89.3% for 2, and 84.9% for 3. The Precision results for the Confusion Matrices of the algorithm and its k-NN second technique of Weighted k-NN are 100% for 0, 96.3% for 1, 88.6% for 2, and 94.7% for 3.
The F1 Score results for the Confusion Matrices of SVM algorithm and its first Cubic SVM technique are 100% for 0, 92.6% for 1, 87.9% for 2, and 83.1% for 3. The F1 Score results for the Confusion Matrices of SVM second technique of Fine Gaussian SVM is 100% for 0, 86.5% for 1, 92.9% for 2, and 69.2% for 3. The F1 Score results for the Confusion Matrices of k-NN algorithm and its first technique of Fine k-NN are 100% for 0, 92.7% for 1, 97.1% for 2, and 77.4% for 3. The F1 Score results for the Confusion Matrices of the algorithm and its k-NN second technique of Weighted k-NN is 100% for 0, 94.4% for 1, 93.1% for 2, and 98.2% for 3.
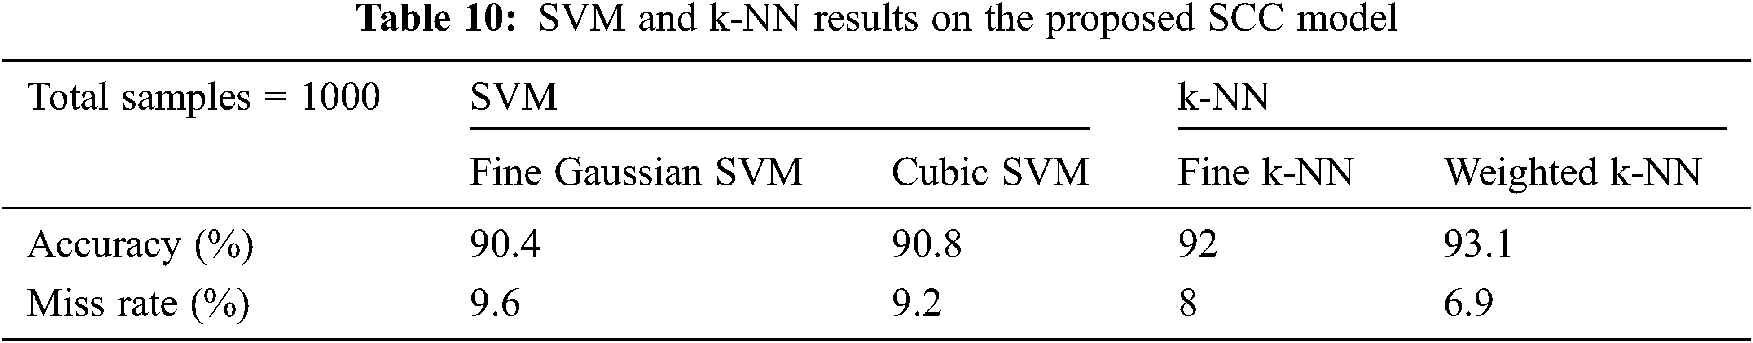
In Tab. 10, after the simulation of the proposed model of Supply Chain Collaboration is fused with machine learning techniques, the accuracy rate of Fine Gaussian SVM is 90.4%, and its Miss rate is 9.6%. The accuracy rate of Cubic SVM is 90.8%, and its miss rate is 9.2%. The accuracy rate of Fine k-NN is 92%, and its Miss rate is 8%. The accuracy rate of Weighted k-NN is 93.1%, and its Miss rate is 6.9%.
To find the simulation results of the Confusion Matrix of fused machine learning techniques, the four (4) eedback samples are Satisfactory = 0, Good = 1, Average = 2, and Bad = 3. Further results are described in Tab. 11.
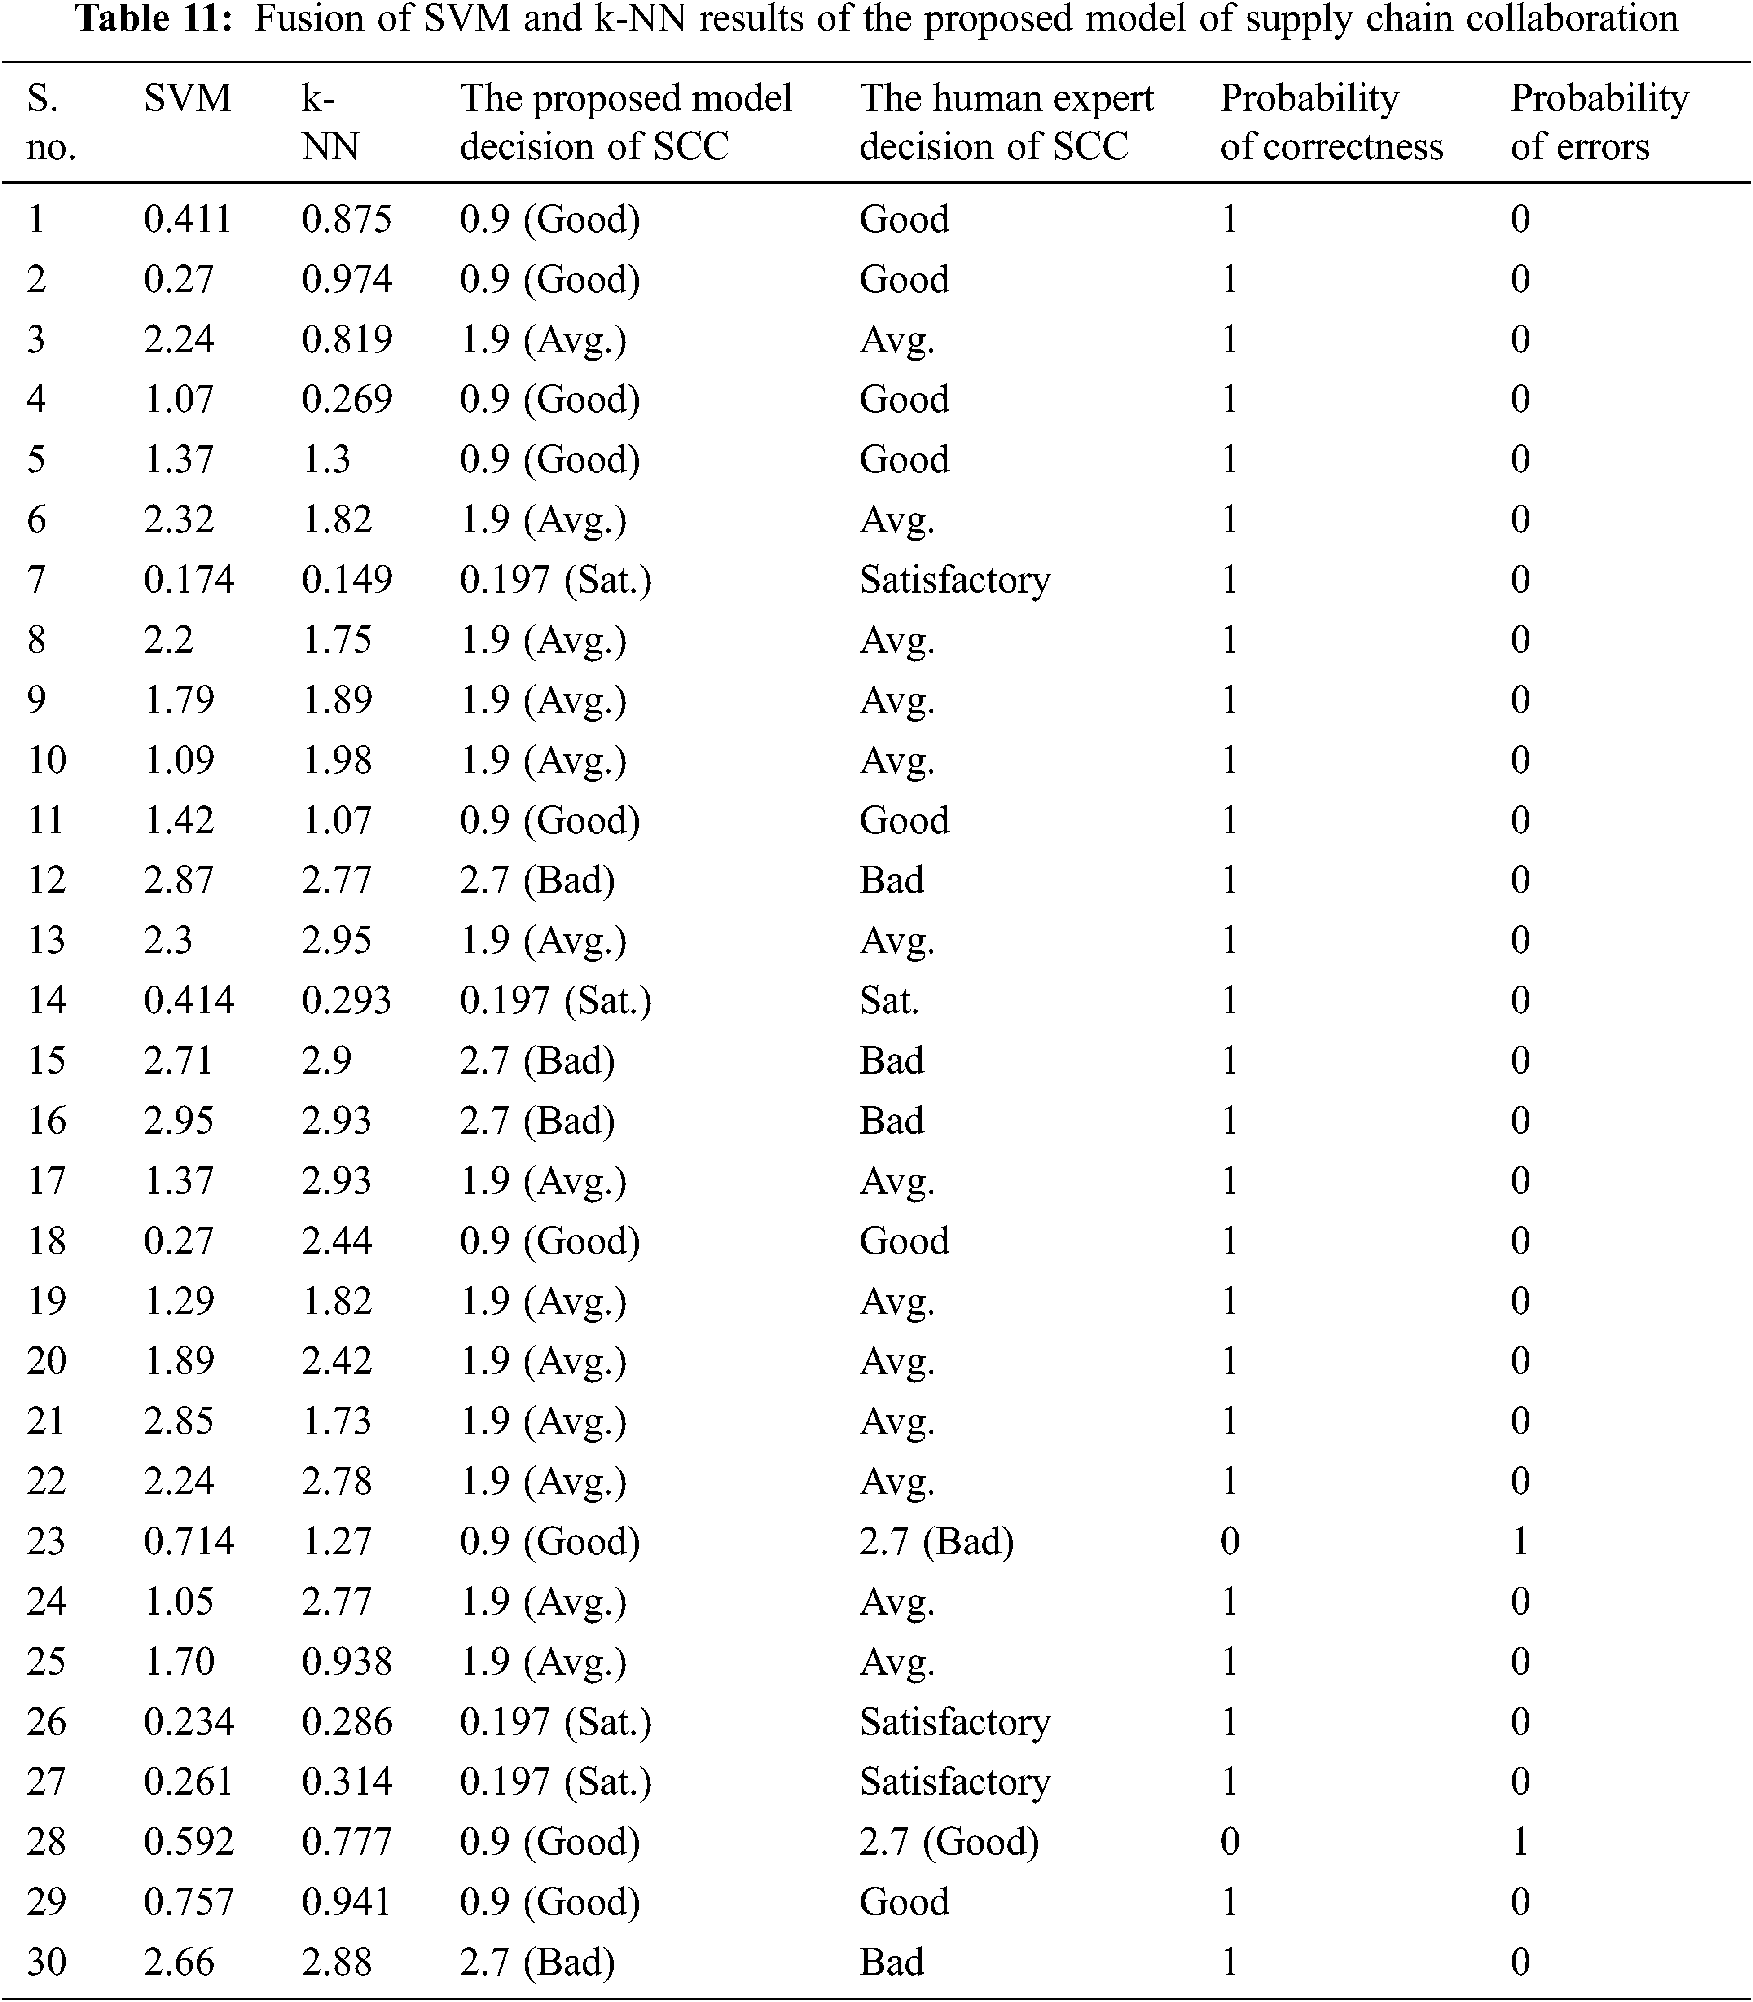
In Tab. 11, 30 random values were manipulated using the fusion of SVM and k-NN; 28 of those random values were accurate, according to human decision-making standards of Supply Chain Collaboration. In contrast, two matters were supposed to be Bad, but were declared Good per the proposed model decision of Supply Chain Collaboration and are taken as incorrect. The actual and the perceived values differed. The probability of correctness is found to be 93.33%, and the likelihood of errors is 6.67%. The Accuracy rate of the Fusion of Support Vector Machine and the k-Nearest Neighbor is 93.33%, and the Miss Rate is 6.67%. In [15], the Ensembles, classification was used to prove human decision-making regarding supplier selection. Ensembles was found to be more stable in making final decisions with an accuracy rate of 88.82%. In this research, fused machine learning techniques of k-NN and SVM have been used, and the accuracy rate is 93.33%.
Machine learning techniques of Support Vector Machine (SVM) algorithm and k-Nearest Neighbor (k-NN) were applied to the data set in this research about Supply Chain Collaboration. This research provides a significant contribution in its field. As an outcome of this research, an intelligent model is proposed for Supply Chain Collaboration, fused with machine learning techniques. It exposes the interrelations among the samples, performance assessment, and customers’ feedback. The methodology developed first conceptualizes a unique digital Supply Chain Coordination framework to handle disruption risks. This framework helps explain how and whenever data analytics can be integrated to govern SCCs, based only on offline decision-making. The best approaches to achieving companies’ goals are crucial in Supply Chain Collaboration, and most organizations prefer to cooperate with reliable and sustainable companies. This model has proposed the authenticity and efficacy of the Supply Chain Collaboration Process. More accurate and improved results will be obtained through this proposed approach compared to previously published techniques for Supply Chain Collaboration.
Acknowledgement: Thanks to the families and colleagues for their moral support.
Funding Statement: The authors received no specific funding for this study.
Conflicts of Interest: The authors declare that they have no conflicts of interest to report regarding the present study.
1. T. Miwa and M. G. Bell, “The efficiency of routing and scheduling system for small and medium-sized enterprises utilizing vehicle location data,” Journal of Intelligent Transportation Systems, vol. 21, no. 3, pp. 239–250, 2017. [Google Scholar]
2. S. H. Liao, D. C. Hu and Y. S. Shih, “Supply chain collaboration and innovation capability: The moderated mediating role of quality management,” Total Quality Management and Business Excellence, vol. 32, no. 3, pp. 298–316, 2021. [Google Scholar]
3. L. Macchion, R. Fornasiero and A. Vinelli, “Supply chain configurations: A model to evaluate performance in customized productions,” International Journal of Production Research, vol. 55, no. 5, pp. 1386–1399, 2017. [Google Scholar]
4. R. D. Angelis, M. Howard and J. Miemczyk, “Supply chain management and the circular economy: Towards the circular supply chain,” Production Planning & Control, vol. 29, no. 6, pp. 425–437, 2018. [Google Scholar]
5. X. Chen, X. Wang and M. Zhou, “Firms’ green r and d cooperation behavior in a supply chain: Technological spillover, power, and coordination,” International Journal of Production Economics, vol. 218, no. 1, pp. 118–134, 2019. [Google Scholar]
6. M. Raza, A. Alshebami and A. Aziz, “Evaluating the effect of information technology on the firm’s supply chain collaboration in Malaysia-examining the moderating role of association among partners,” Innovation, vol. 29, no. 5, pp. 1314–1326, 2020. [Google Scholar]
7. P. Priore, B. Ponte, R. Rosillo and D. D. L. Fuente, “Applying machine learning to the dynamic selection of replenishment policies in fast-changing supply chain environments,” International Journal of Production Research, vol. 57, no. 11, pp. 3663–3677, 2019. [Google Scholar]
8. T. M. Choi and Y. J. Cai, “Impacts of lead time reduction on fabric sourcing in apparel production with yield and environmental considerations,” Annals of Operations Research, vol. 290, no. 1, pp. 521–542, 2020. [Google Scholar]
9. E. Manavalan and K. Jayakrishna, “A review of internet of things embedded sustainable supply chain for industry 4.0 requirements,” Computers & Industrial Engineering, vol. 127, no. 1, pp. 925–953, 2019. [Google Scholar]
10. S. Saberi, M. Kouhizadeh, J. Sarkis and L. Shen, “Blockchain technology and its relationships to sustainable supply chain management,” International Journal of Production Research, vol. 57, no. 7, pp. 2117–2135, 2019. [Google Scholar]
11. M. Lu, Z. Chen and S. Shen, “Optimizing the profitability and quality of service in carshare systems under demand uncertainty,” Manufacturing and Service Operations Management, vol. 20, no. 2, pp. 162–180, 2018. [Google Scholar]
12. B. Li and Y. Li, “Internet of things drive supply chain innovation: A research framework,” International Journal of Organizational Innovation, vol. 9, no. 3, pp. 71–92, 2017. [Google Scholar]
13. Y. Masugi, R. Nishihara, J. Yang, K. Mima, A. D. Silva et al., “Tumour CD274 (PD-L1) expression and t cells in colorectal cancer,” Gut, vol. 66, no. 8, pp. 1463–1473, 2017. [Google Scholar]
14. A. M. Hye, E. M. Nazri and N. A. Mustaffa, “The library supply chain model: A brief,” International Journal of Supply Chain Management, vol. 8, no. 6, pp. 32–44, 2019. [Google Scholar]
15. D. Ni, Z. Xiao and M. K. Lim, “A systematic review of the research trends of machine learning in supply chain management,” International Journal of Machine Learning and Cybernetics, vol. 12, no. 5, pp. 1463–1482, 2019. [Google Scholar]
16. M. A. Alghamdi, M. F. N. Khan, A. K. Khan, I. Khan, A. Ahmed et al., “PV model parameter estimation using modified FPA with dynamic switch probability and step size function,” IEEE Access, vol. 9, no. 4, pp. 42027–42044, 2021. [Google Scholar]
17. L. Nadeem, M. A. Azam, Y. Amin, M. A. Ghamdi, K. K. Chai et al., “Integration of D2D, network slicing, and MEC in 5G cellular networks: Survey and challenges,” IEEE Access, vol. 9, no. 7, pp. 37590–37612, 2021. [Google Scholar]
18. A. H. Khan, M. A. Khan, S. Abbas, S. Y. Siddiqui, M. A. Saeed et al., “Simulation, modeling, and optimization of intelligent kidney disease predication empowered with computational intelligence approaches,” Computers, Materials & Continua, vol. 67, no. 2, pp. 1399–1412, 2021. [Google Scholar]
19. G. Ahmad, S. Alanazi, M. Alruwaili, F. Ahmad, M. A. Khan et al., “Intelligent ammunition detection and classification system using convolutional neural network,” Computers, Materials & Continua, vol. 67, no. 2, pp. 2585–2600, 2021. [Google Scholar]
20. B. Shoaib, Y. Javed, M. A. Khan, F. Ahmad, M. Majeed et al., “Prediction of time series empowered with a novel srekrls algorithm,” Computers, Materials & Continua, vol. 67, no. 2, pp. 1413–1427, 2021. [Google Scholar]
21. S. Aftab, S. Alanazi, M. Ahmad, M. A. Khan, A. Fatima et al., “Cloud-based diabetes decision support system using machine learning fusion,” Computers, Materials & Continua, vol. 68, no. 1, pp. 1341–1357, 2021. [Google Scholar]
22. Q. T. A. Khan, S. Abbas, M. A. Khan, A. Fatima, S. Alanazi et al., “Modelling intelligent driving behaviour using machine learning,” Computers, Materials & Continua, vol. 68, no. 3, pp. 3061–3077, 2021. [Google Scholar]
23. S. Hussain, R. A. Naqvi, S. Abbas, M. A. Khan, T. Sohail et al., “Trait based trustworthiness assessment in human-agent collaboration using multi-layer fuzzy inference approach,” IEEE Access, vol. 9, no. 4, pp. 73561–73574, 2021. [Google Scholar]
24. N. Tabassum, A. Ditta, T. Alyas, S. Abbas, H. Alquhayz et al., “Prediction of cloud ranking in a hyperconverged cloud ecosystem using machine learning,” Computers, Materials & Continua, vol. 67, no. 1, pp. 3129–3141, 2021. [Google Scholar]
25. M. W. Nadeem, H. G. Goh, M. A. Khan, M. Hussain, M. F. Mushtaq et al., “Fusion-based machine learning architecture for heart disease prediction,” Computers, Materials & Continua, vol. 67, no. 2, pp. 2481–2496, 2021. [Google Scholar]
26. A. I. Khan, S. A. R. Kazmi, A. Atta, M. F. Mushtaq, M. Idrees et al., “Intelligent cloud-based load balancing system empowered with fuzzy logic,” Computers, Materials and Continua, vol. 67, no. 1, pp. 519–528, 2021. [Google Scholar]
27. S. Y. Siddiqui, I. Naseer, M. A. Khan, M. F. Mushtaq, R. A. Naqvi et al., “Intelligent breast cancer prediction empowered with fusion and deep learning,” Computers, Materials and Continua, vol. 67, no. 1, pp. 1033–1049, 2021. [Google Scholar]
28. R. A. Naqvi, M. F. Mushtaq, N. A. Mian, M. A. Khan, M. A. Yousaf et al., “Coronavirus: A mild virus turned deadly infection,” Computers, Materials and Continua, vol. 67, no. 2, pp. 2631–2646, 2021. [Google Scholar]
29. A. Ahmed, M. F. N. Khan, I. Khan, H. Alquhayz, M. A. Khan et al., “A novel framework to determine the impact of time varying load models on wind DG planning,” IEEE Access, vol. 9, no. 2, pp. 11342–11357, 2021. [Google Scholar]
30. F. Alhaidari, S. H. Almotiri, M. A. A. Ghamdi, M. A. Khan, A. Rehman et al., “Intelligent software-defined network for cognitive routing optimization using deep extreme learning machine approach,” Computers, Materials and Continua, vol. 67, no. 1, pp. 1269–1285, 2021. [Google Scholar]
31. M. W. Nadeem, M. A. A. Ghamdi, M. Hussain, M. A. Khan, K. M. Khan et al., “Brain tumor analysis empowered with deep learning: A review, taxonomy, and future challenges,” Brain Sciences, vol. 10, no. 2, pp. 118–139, 2020. [Google Scholar]
32. A. Atta, S. Abbas, M. A. Khan, G. Ahmed and U. Farooq, “An adaptive approach: Smart traffic congestion control system,” Journal of King Saud University—Computer and Information Sciences, vol. 32, no. 9, pp. 1012–1019, 2020. [Google Scholar]
33. M. A. Khan, S. Abbas, A. Rehman, Y. Saeed, A. Zeb et al., “A machine learning approach for blockchain-based smart home networks security,” IEEE Network, vol. 35, no. 3, pp. 223–229, 2020. [Google Scholar]
34. M. A. Khan, M. Umair, M. A. Saleem, M. N. Ali and S. Abbas, “CDE using improved opposite-based swarm optimization for MIMO systems,” Journal of Intelligent & Fuzzy Systems, vol. 37, no. 1, pp. 687–692, 2019. [Google Scholar]
35. M. A. Khan, M. Umair and M. A. Saleem, “GA based adaptive receiver for MC-CDMA system,” Turkish Journal of Electrical Engineering & Computer Sciences, vol. 23, no. 1, pp. 2267–2277, 2015. [Google Scholar]
 | This work is licensed under a Creative Commons Attribution 4.0 International License, which permits unrestricted use, distribution, and reproduction in any medium, provided the original work is properly cited. |