DOI:10.32604/iasc.2022.020679
| Intelligent Automation & Soft Computing DOI:10.32604/iasc.2022.020679 | |
| Article |
Deep Transfer Learning Based Rice Plant Disease Detection Model
1Department of Computer Science and Engineering, Anna University, Chennai, 600025, India
2Department of Computer Science and Engineering, Sri Shanmugha College of Engineering and Technology, Sankari, Salem, 637304, India
3Department of ECE, University College of Engineering, Panruti (A Constituent College of Anna University), Panruti, 607106, India
*Corresponding Author: R. P. Narmadha. Email: nammu14@gmail.com
Received: 02 June 2021; Accepted: 08 July 2021
Abstract: In agriculture, plant diseases are mainly accountable for reduction in productivity and leads to huge economic loss. Rice is the essential food crop in Asian countries and it gets easily affected by different kinds of diseases. Because of the advent of computer vision and deep learning (DL) techniques, the rice plant diseases can be detected and reduce the burden of the farmers to save the crops. To achieve this, a new DL based rice plant disease diagnosis is developed using Densely Convolution Neural Network (DenseNet) with multilayer perceptron (MLP), called DenseNet169-MLP. The proposed model aims to classify the rice plant disease into three classes namely Bacterial Leaf Blight, Brown Spot, and Leaf Smut. Initially, preprocessing takes place in three levels namely channel separation, grayscale conversion, and noise removal using median filtering (MF). Then, the fuzzy c-means (FCM) based segmentation process identifies the diseased portion in the rice plant image. The pretrained DenseNet169 technique is used as a feature extractor and the final layer is replaced by the MLP to perform rice plant disease classification. The effectiveness of the proposed model has been validated against benchmark dataset and the simulation outcome is examined under diverse measures. The obtained results defined the superior results of the DenseNet169-MLP model over the recently presented methods with the maximum accuracy of 97.68%.
Keywords: Rice plant disease; segmentation; fuzzy c means; DenseNet model; feature extraction
Agriculture acts as a vital part to obtain food security, alleviate poverty, and strengthen the development. Since the global population is anticipated to be 9.7 billion in 2050 and 11.2 billion at the end of this century [1] the crop productivity should be increased inspite of different crop yield affecting factors such as pest, weed, sunlight, pathogen, nutrient, water, soil deprivation, environment impact, and sparse arable land. The recent developments in technologies find helpful to attain high food productivity. Computer vision (CV) based techniques can automate the crop inspection using in-situ and ex-situ imaging techniques for improvising the entire crop productivity. On the other hand, rice is considered as a major food source provider of protein and energy to atleast 50% of the global population. Besides, the utilization of rice and demand gets increased with a rise in population. For fulfilling the rising food requirements, rice productivity should be raised to greater than 40% by 2030. However, rice plant diseases have resulted in a significant loss in productivity. Presently, the utilization of pesticide and blast-resistant approaches are the major ways available to combat the disease. The abundant utilization of pesticide not only increase the production cost, but it also affects the environment in a significant way.
At present times, computer-aided diagnosis (CAD) models are available to monitor crop diseases and pests using plant images. An automated rice disease diagnosis model can provide details to prevent and control the rice diseases for reducing the financial loss, decrease the pesticide residue, and raise the quality and number of crops. To attain such a model, researches are urged to develop effectual image processing approaches to detect plant diseases. The image processing steps involved in rice disease detection are preprocessing, segmentation, feature extraction, and classification processes. These processes are carried out only on the exterior appearance of the affected plants [2]. Generally, leaves are considered as the major source for plant disease detection. The plant diseases normally vary in size, shape, and color and each disease possesses some unique characteristics. Few diseases appear in yellow or brown in color. At the same time, few diseases are identical in shapes however vary in color, whereas a few others are identical in color and vary in the shapes. Next to the segmentation of affected and healthy portions, the features relevant to the diseases could be extracted.
To detect the leaf diseases, human vision based models are commonly employed in a traditional way. It requires more time and highly expensive. The accurateness of the human vision model is based on the perception of the persons or experts. Machine learning (ML) and deep learning (DL) approaches allow identification of different kinds of diseases, formulate proper decisions, and choose effective treatment. Only a few works have concentrated on the recognition of rice plant diseases using ML and DL models. Presently, owing to the capability of extracting optimal features, CNN models have been employed comprehensively in ML and pattern recognition researches. Reference [3] reported that the multilayer neural network (NN) offers better learning capability and it denotes the actual data appropriate for classification.
CNN offers dedicated learning solutions and extract related high level features straightaway from the input images. The CNN architectural models are based on the visual cortex of cats in Hubel's and Wiesel's earlier works. Particularly, [4] performs the object detection task by the use of deep CNN. It has tracked by the appearance of numerous enhanced approaches and application areas of CNN. In general, the human recognition of plant diseases is naked eye examination of expert that seems to be time-consuming and costly in real-time. It is hard to process and also occasionally it generates an error in the identification of the diseases [5]. Owing to the ignorance of appropriate management for rectifying the rice plant leaves diseases, rice productivity is being decreased recently. For resolving this, an appropriate and accurate rice plant detection model is required. Therefore, this paper develops a novel methodology to detect and categorize the diseases present in rice plant images.
This study proposes effective deep learning (DL) based detection and classification model for rice plant diseases using the DenseNet model and multilayer perceptron (MLP), called the DenseNet169-MLP model. In this work, DenseNet model is chosen due to the following advantages: alleviate the vanishing-gradient problem, strengthen feature propagation, encourage feature reuse, and substantially reduce the number of parameters. The proposed model comprises set of processes such as preprocessing, fuzzy c-means based segmentation, DenseNet169 based feature extractor, and MLP classifier. The MLP model is integrated with the deep features extracted from the DenseNet169 model for investigating and verifying the efficiency of the deep features of the DenseNet169 model.
The remaining sections of the study are arranged here. Section 2 briefs the works related to the proposed model. Section 3 introduces the rice plant detection and classification model. Section 4 validates the work and Section 5 draws the conclusion.
This section reviews the plant disease detection models exist in the literature. In [6], a DL based CNN model is applied to detect the three rice plant diseases in an automated way. In the proposed method, the healthy and infected leaf images are differentiated from a total of 1500 rice images. In [7], a new rice plant disease detection and classification model has been presented. Initially, the rice plant images are acquired by a digital camera and then centroid feeding based K-means clustering is applied for segmenting the images. Then, color, shape, and texture features are extracted. Lastly, Support Vector Machines (SVM) is applied for multiclass classification. The presented model has attained 93.3% and 73.3% accuracy on the training and test data correspondingly.
In [8], a method of recognizing and classifying paddy leaves diseases by the use of Deep Neural Network with Jaya Optimization Algorithm (DNN-JOA) is presented. At the preprocessing stage, the background is removed and the RGB image is transformed into the HSV image. Next, the clustering process is performed to segment the affected and healthy portions of the rice plant images. The classification of diseases takes by the use of DNN-JOA. In [9], an ML-based rice plant disease diagnosis model to identify blast disease in South India has been presented. The presented model can identify blast diseases and minimize crop losses effectively. Reference [10] designed a model using DCNN to automatically recognize and categorize biotic and abiotic paddy crop diseases by the use of images captured from the field. The presented model makes use of a pretrained VGG-16 CNN approach to automatically classify the diseased paddy crop images which are gathered at the time of the booting growth stage. In [11], a rice blast detection model using CNN has been presented and it yields better detection rate.
Reference [12] devised a deep machine vision based model to detect, classify and quantify 8 soybean plant stresses, from a total of 25,000 images of stressed and healthy leaves. This method has achieved a detection rate of 94.13% by the presented deep CNN approach. Reference [13] applied 5 distinct CNN approaches to identify plant diseases by the use of leaf images. Reference [14] designed an automated wheat disease identification model utilizing the supervised DL model. It is tested using a wheat image dataset comprising of 50k labeled leaf images. The proposed model includes four diverse CNN models for recognizing the seven wheat disease classes. The results stated that the VGG-16 model has attained a higher detection rate of 97.95%. Reference [15] developed a rice plant disease recognition model by the use of DL approaches. It is tested using 500 leaf and stem images of rice plants. It makes use of LeNet-5 and AlexNet CNN models. This study revealed that the stochastic pooling improvises the generalization capability of the CNN approach and avoids overfitting.
Based on CNN, an effective rice plant identification model has been designed. It is also tested a dataset comprising 500 images of affected and unaffected leaf and stem of rice plants. The proposed method has classified a set of 10 rice diseases and has obtained better accuracy over the traditional ML models. For evaluating the region of interest (RoI), neutrosophic logic technique is employed [16] to determine the presence of infected regions in the image. Different classification models are applied and the random forest (RF) model has attained better detection performance on the applied set of 400 leaf images.
Reference [17] introduced a disease detection model for rice plants. This method determines the diseased area and then calculates the severity level of the disease. Depending upon the severity level, the pesticides are applied for rice plant diseases. In [18], a new rice plant disease detection method has been developed using the Naive Bayes (NB) classification model. This method has detected and categorized three major kinds of rice plant disease and it has less computation time. Reference [19] developed a recent technique for automatic recognition of rice plant diseases. Once the features are extracted, the classification process is carried out using SVM, NB, back propagation neural network (BPNN) and K nearest neighbors (KNN). Reference [20] examined the performance of the diverse transfer learning methods for DNN based plant classification. Reference [21] make use of CNN to detect weeds in soybeans and categorize the weed between grass and broad leaves. A new image dataset is generated comprising 15000 images. The applied CNN model has exhibited better performance on the detection process compared to existing methods. Though several rice plant disease classification models are available in the literature, there is still a need to improve the detection rate in the rice plant disease diagnosis.
3 The Proposed DenseNet169-MLP Model
The overall workflow involved in the DenseNet169-MLP technique is shown in Fig. 1. The DenseNet169-MLP model undergoes preprocessing to improve the image quality, FCM based segmentation to detect the infected portions, DenseNet169 model for the extraction of the features, and MLP based classification to categorize the images into a different set of class labels. These processes are clearly explained in the subsequent sections.
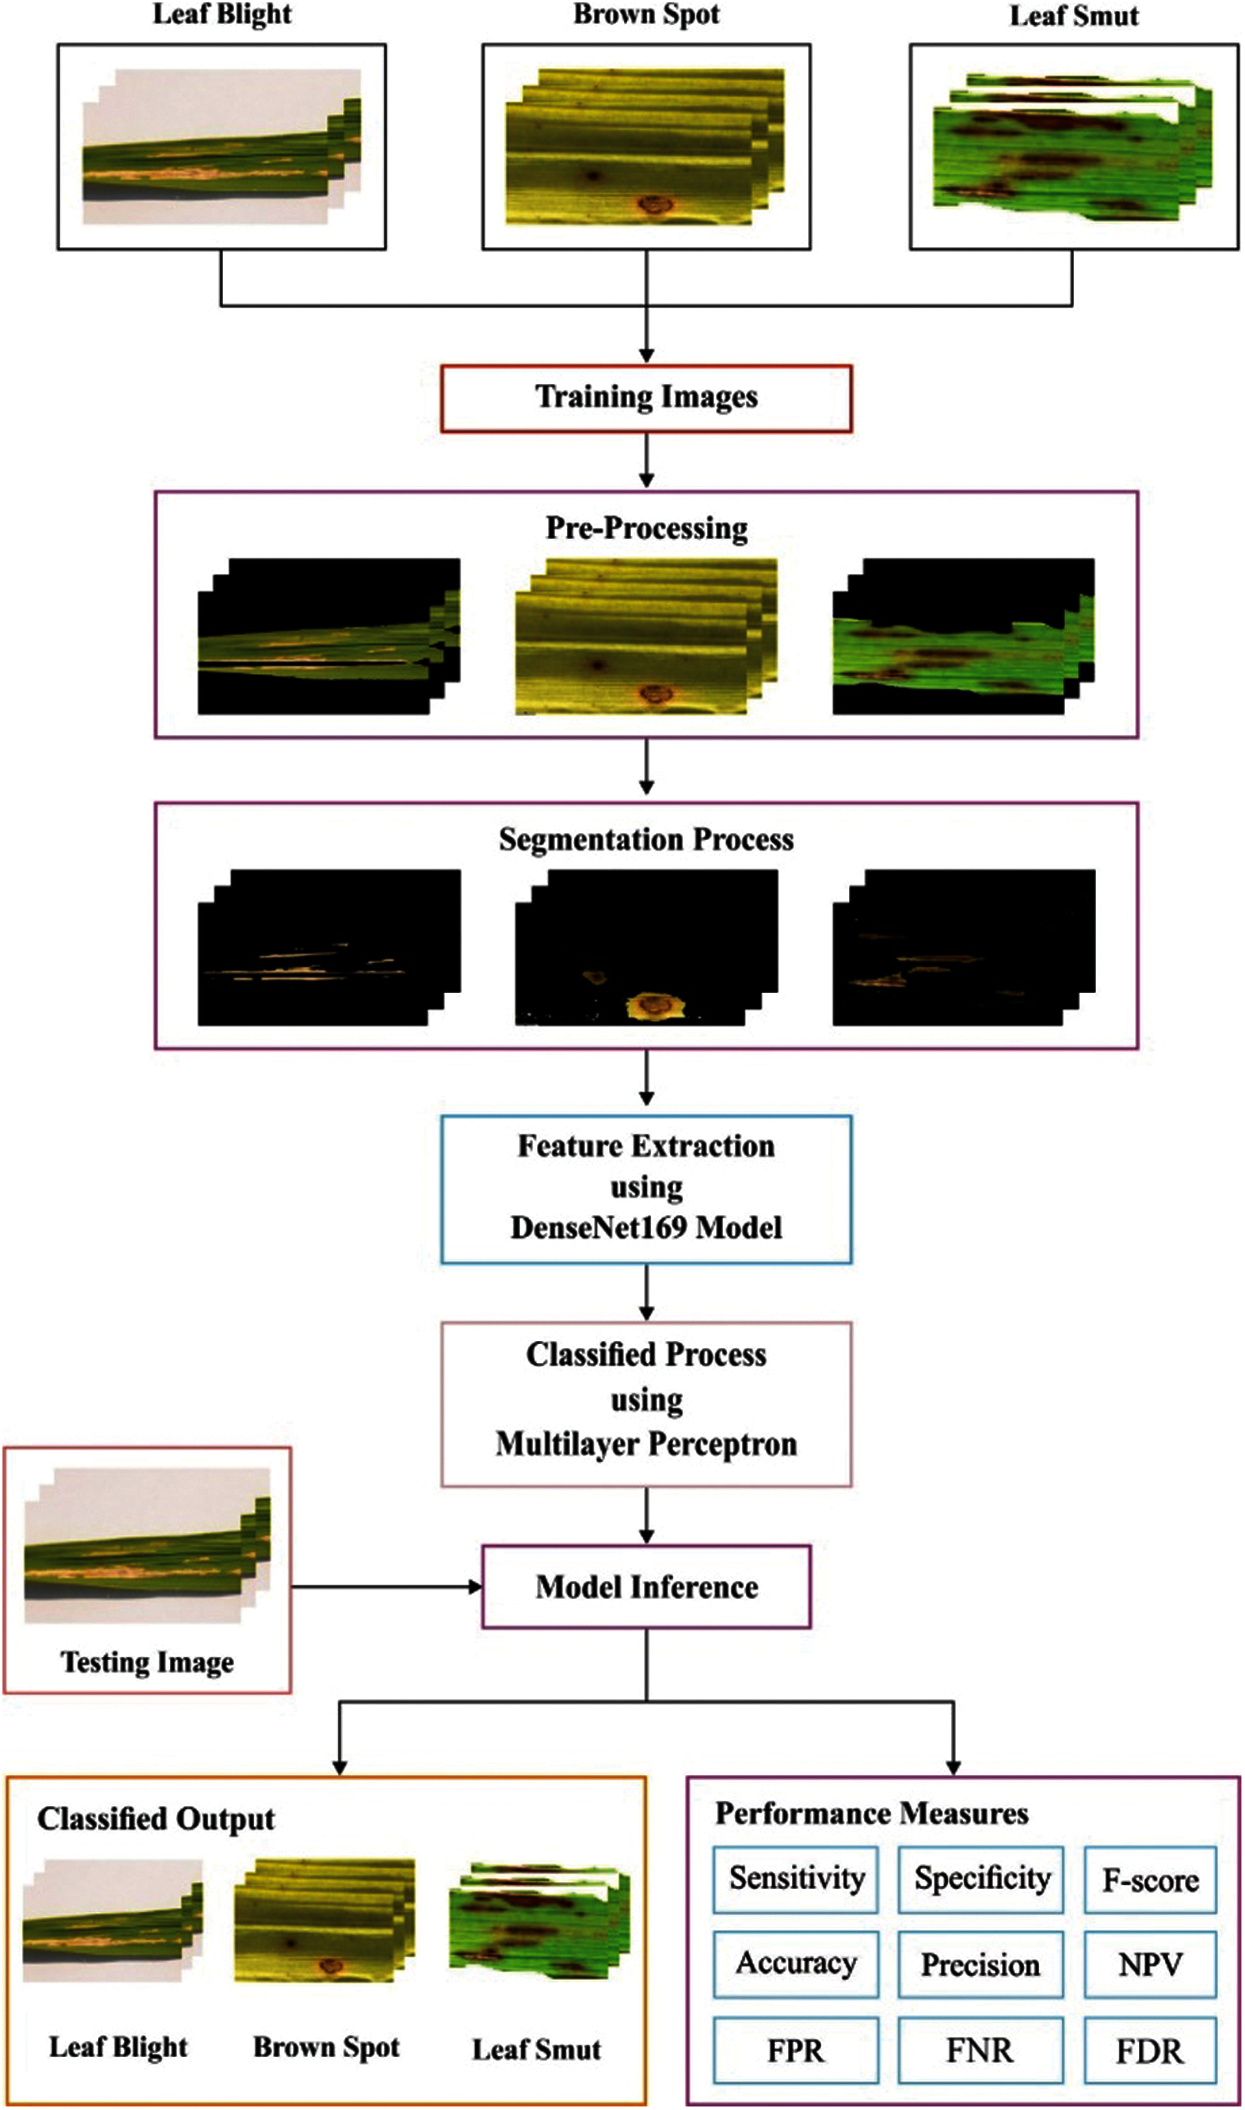
Figure 1: Overall process of proposed method
Image pre-processing is the procedure employed to eliminate the existence of different noise and other objects present in the image. In the earlier stage, the RGB color image of the rice plant undergoes a channel separation process where the three channels R, G, and B are separated from one another. Next, grayscale conversion process takes place where the RGB rice plant image is transformed into grayscale. Afterward, MF is used to boost the quality of the rice plant image and it is a type of non-linear filtering approach which is commonly applied to remove the noise that exists in the image. The MF technique generally replaces every pixel exists in the input image by the median of the grayscale value of nearby pixels. It is also termed as smoothing spatial filter. Once the filtration task gets done, image segmentation using the FCM technique take place to identify the infected or healthy portions of the rice plant image.
Segmentation is considered as an essential process in pattern recognition and image processing based applications. In rice plants, the segmentation process can effectively identify the diseased portions in an automated way. The proposed model make use of FCM based segmention technique and effectively detect the diseased portions from the rice plant leaf images. FCM is commonly employed for soft clustering [22]. It is intended to segment the image X = {x1, x2…xn}, with n pixels, into c segments (two segments namely diseased and healthy portion), such that each pixel falls into a class with a particular membership degree. The fuzzy set (
where μD(xij) → [0, 1] defines membership of pixel xj to a certain cluster i in set D. The μD(xij) of every individual pixel. The FCM can be represented by the following objective function as given in Eq. (2):
where c denotes the cluster count, n is the pixel count, μij is the degree of membership with the limitation such that
FCM has begun by the initialization of the arbitrary values of membership matrix ranges from 0 to 1, subject to membership constraint. The cluster prototype undergo arbitrary initialization. The minimization of the FCM objective function of FCM takes place by the use of the Lagrange multiplier. The cluster prototype (
3.3 Densenet169 Based Feature Extraction
In this study, the DenseNet169 model is applied to extract the valuable features from the segmented rice plant image. Fig. 2 illustrates the architecture of DenseNet. DenseNet is a network architecture in which the layers are straightaway linked to each other in the dense block in a feed forward way. The layers are defined in a way that the activation map of every earlier layer is treated as individual input whereas its activation map is fed as input to every subsequent layer. In DenseNet [23], the features are concatenated to one another before fed into the layer.
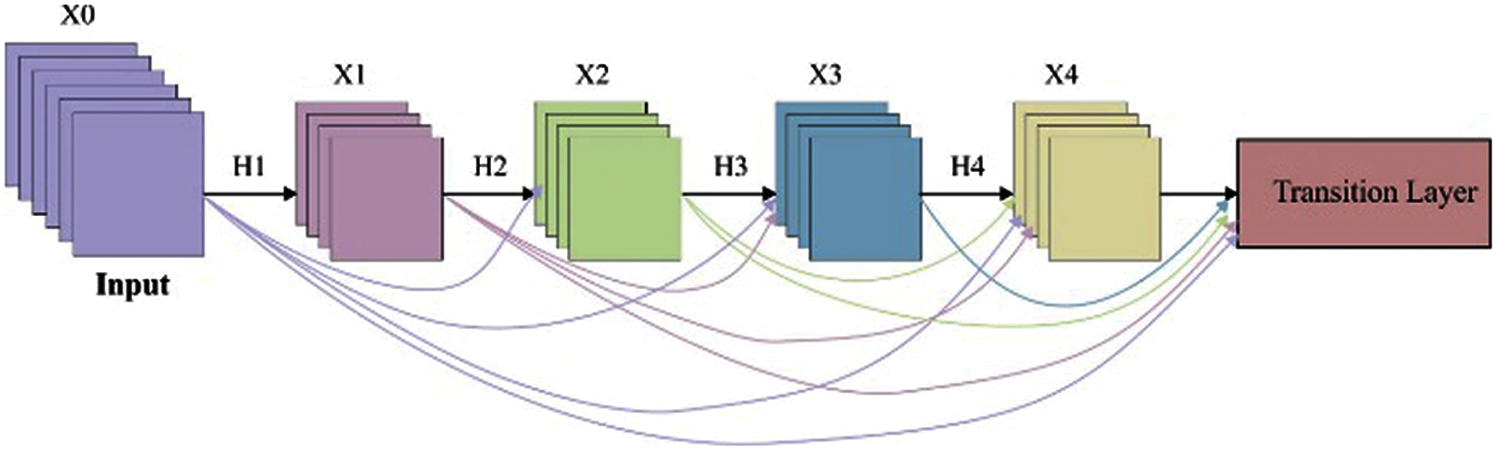
Figure 2: Architecture of DenseNet model
Therefore, the lthe layer has l inputs, comprising the feature map of every preceding convolution block. Then, the feature maps are fed to every L − 1 succeeding layer. It establishes
In this paper, DenseNet-169 is applied which comprises 4 dense blocks and total 169 layers (165- conv + 3-transition + 1-classification). The layered structure of the DenseNet 169 model is shown in Fig. 3.
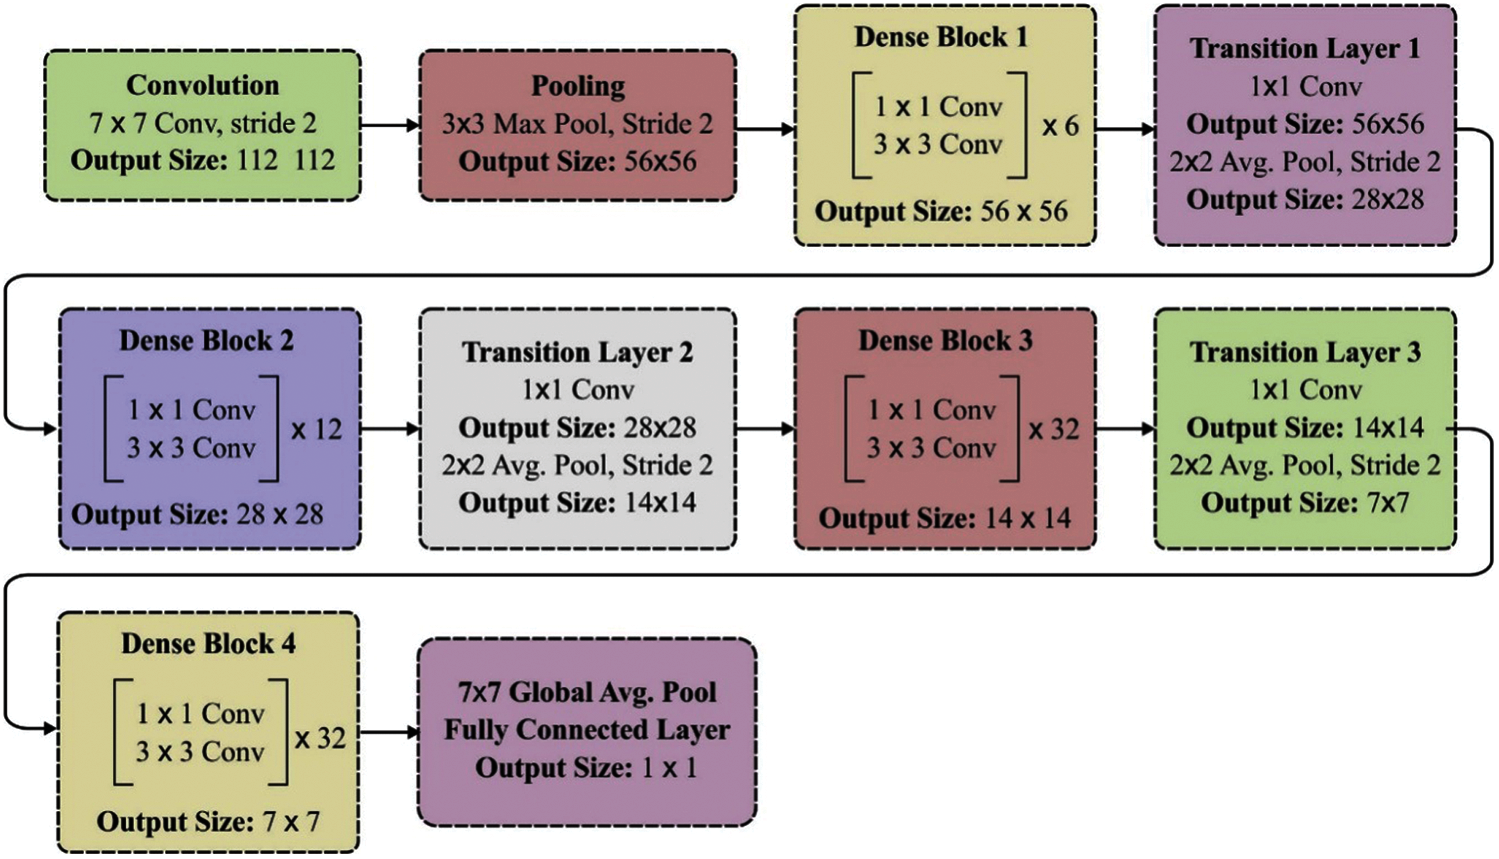
Figure 3: Layered structure of DenseNet-169 model
Transfer learning is performed on pretrained DenseNet-169 for rice plant disease classification. In contrast to fine tuning process, in this study, feature extraction process is done by eliminating the last fully connected layer (classifier layer) of the DenseNet model and considering the output data of the second final layer as extracted features (termed as DenseNet codes), which are generally high dimension vectors and denotes the features of the input images. Then, the MLP is placed as the final layer of the DenseNet model to perform rice plant disease classification using the extracted features. In the entire process, the DenseNet model is applied as the feature extraction technique and has shown effective outcomes over the existing models [24].
MLP model comprises three components namely input, hidden and output layers. The MLP model contains many diverse hidden layers allowing the network to have computation capabilities of generating the network output. Fig. 4 depicts the architecture of MLP model with an individual hidden layer containing some weights linking among the layers to classify the rice plant image into three classes. The output values would be determined as follows. Initially, the sum of the weights is determined as given in Eq. (5):
where xi is the input parameter, wij is the weight among the input parameter xi and neuron j, and βi is the input parameter's bias term. Next, the output value of the neuron in the hidden layer is created from the received value of weighted summation utilizing a sigmoid activation function as given below.
where fj is the sigmoid function for neuron j and Sj is the sum of weight. At last, the outcome of the neuron j can be determined by:
where yj is the outcome of neuron j, wij is the weight among the output parameter yi and neuron j, fj is the activation function for neuron j, and βi is the bias term of the output parameter. The outcome of the MLP represents the appropriate class labels of the applied rice plant images.
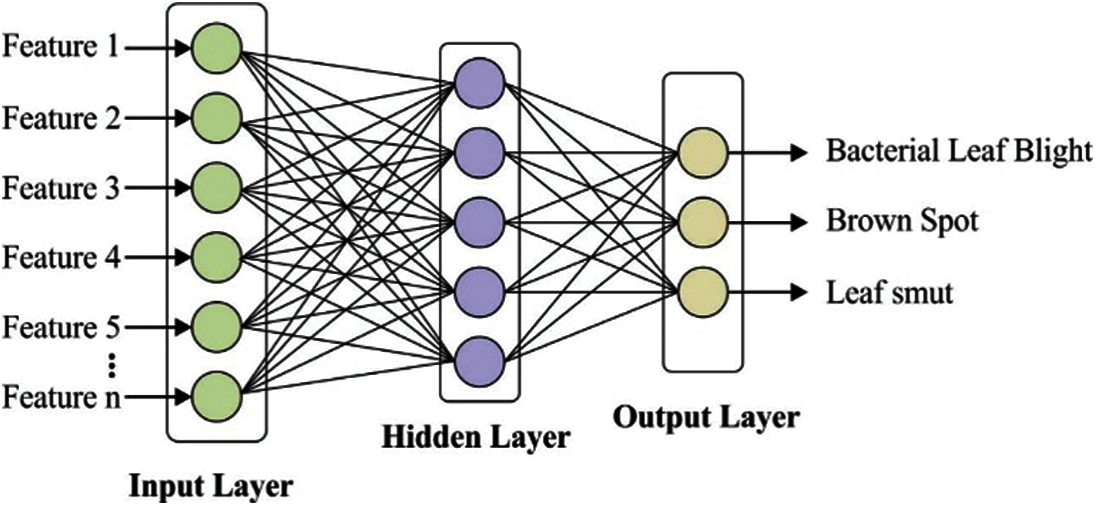
Figure 4: Layered architecture of MLP
In this section, the experimental validation of the DenseNet169-MLP technique has been examined under diverse aspects. The experiments were carried out on a PC i5-8600k processor, GeForce 1050Ti 4GB graphics card, 16GBRAM, and 1TB HDD. The proposed model is simulated using Python 3.6.5 tool. The parameter setting is given as follows: mini batch size: 200, dropout: 0.5, number of hidden layers:3, number of hidden units: 1024, and learning rate: 0.01. The measures used to analyze the results of the DenseNet169-MLP model are Sensitivity, Specificity, Precision, Accuracy, F-score, Negative Predicted Value (NPV), False Positive Rate (FPR), False Negative Rate (FNR) and False Discovery Rate (FDR). For validation, a benchmark rice plant image dataset is used [25]. Some sample test images under every class are provided in Fig. 5.
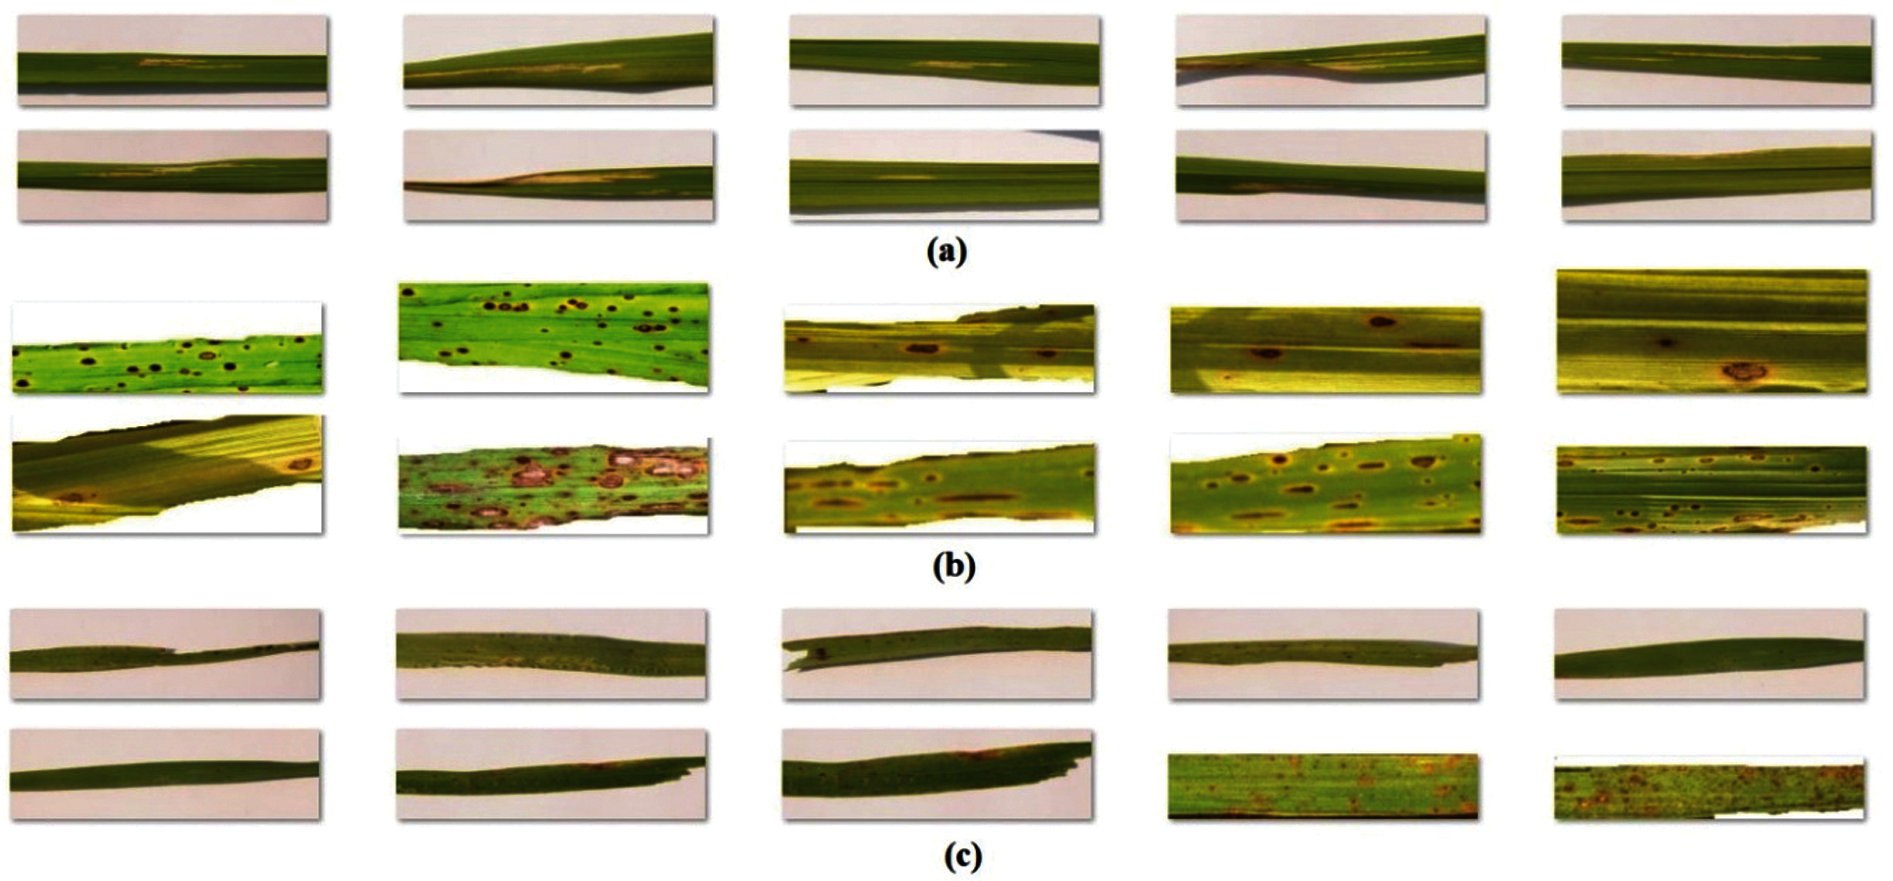
Figure 5: Sample images a) bacterial leaf blight b) brown spot c) leaf smut
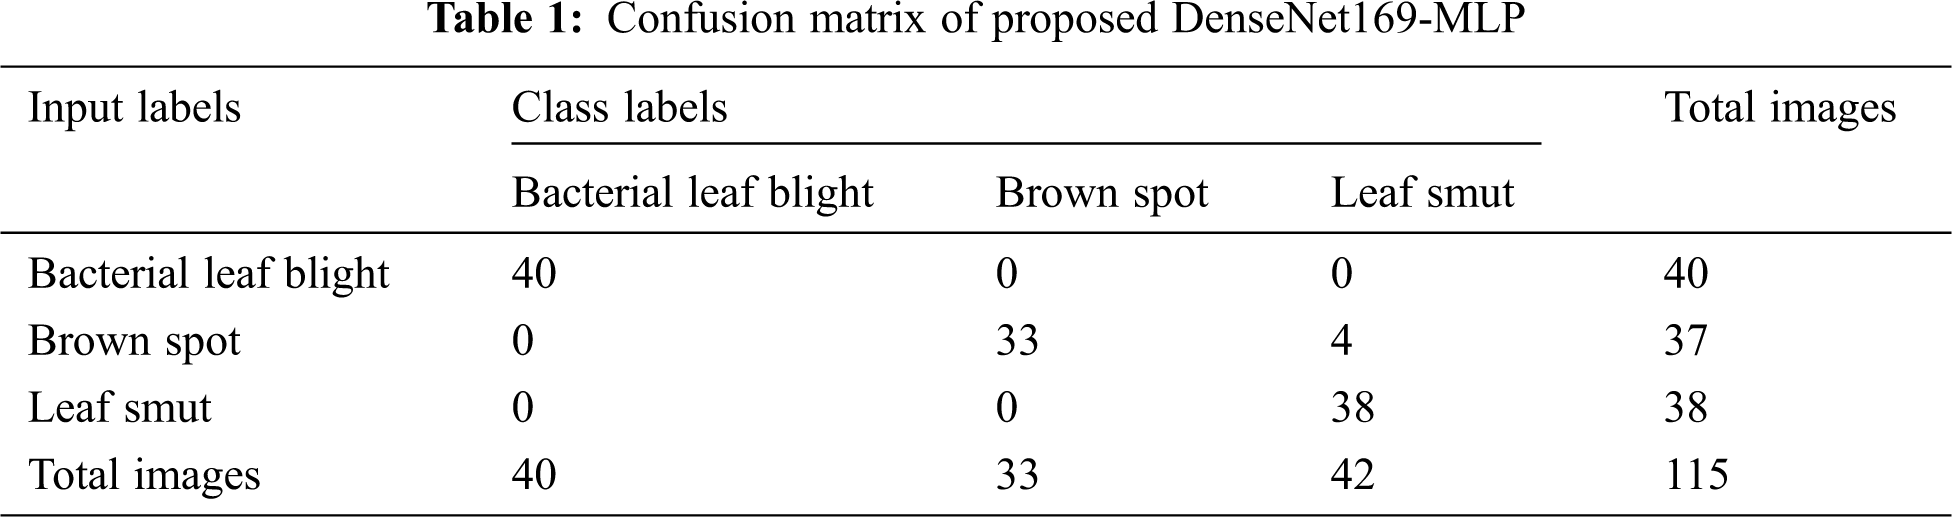
Fig. 6 shows the confusion matrix derived from the DenseNet169-MLP model at the time of execution. The figure states that the DenseNet169-MLP model has correctly classified 40 images under Bacterial Leaf Blight, 33 images under Brown Spot, and 38 images under Leaf Smut classes respectively.
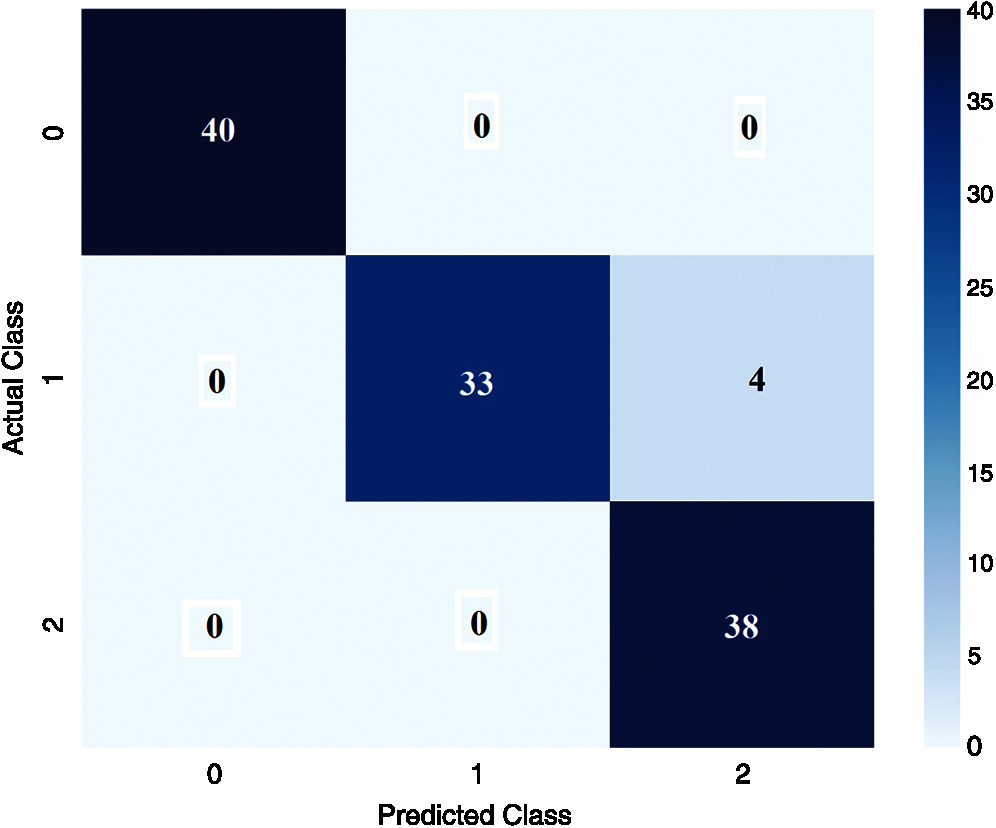
Figure 6: Confusion matrix of proposed DenseNet169-MLP (Execution time)
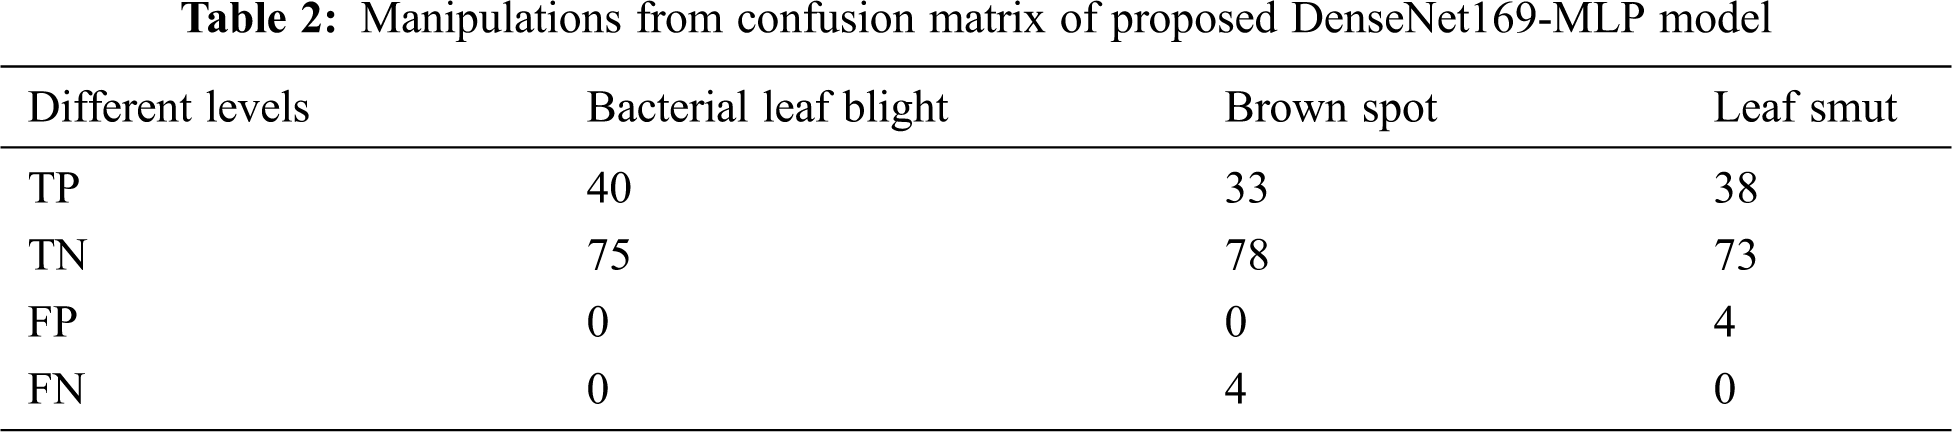
For better understanding, the confusion matrix in the figure is transformed into a tabular form as given in Tab. 1. Besides, the table values are manipulated and represented in TP, TN, FP, and FN values in Tab. 2. The values in these tables are used to determine the classification results of the DenseNet169-MLP model.
Tab. 3, Figs. 7 and 8 demonstrates the classification performance of the DenseNet169-MLP model. The table values indicated that the DenseNet169-MLP model has showcased effective classification performance on the applied images. On the classification of Bacterial Leaf Blight disease, the DenseNet169-MLP model has attained optimal results with the maximum sensitivity, specificity, precision, accuracy, F-score, and NPV of 100. Besides, on the classification of brown spot disease, the DenseNet169-MLP model has obtained a higher sensitivity of 89.19%, specificity of 100%, precision of 100%, accuracy of 96.52%, F-score of 94.29%, NPV of 95.12%, FPR of 0, FNR of 10.81% and FDR of 0.
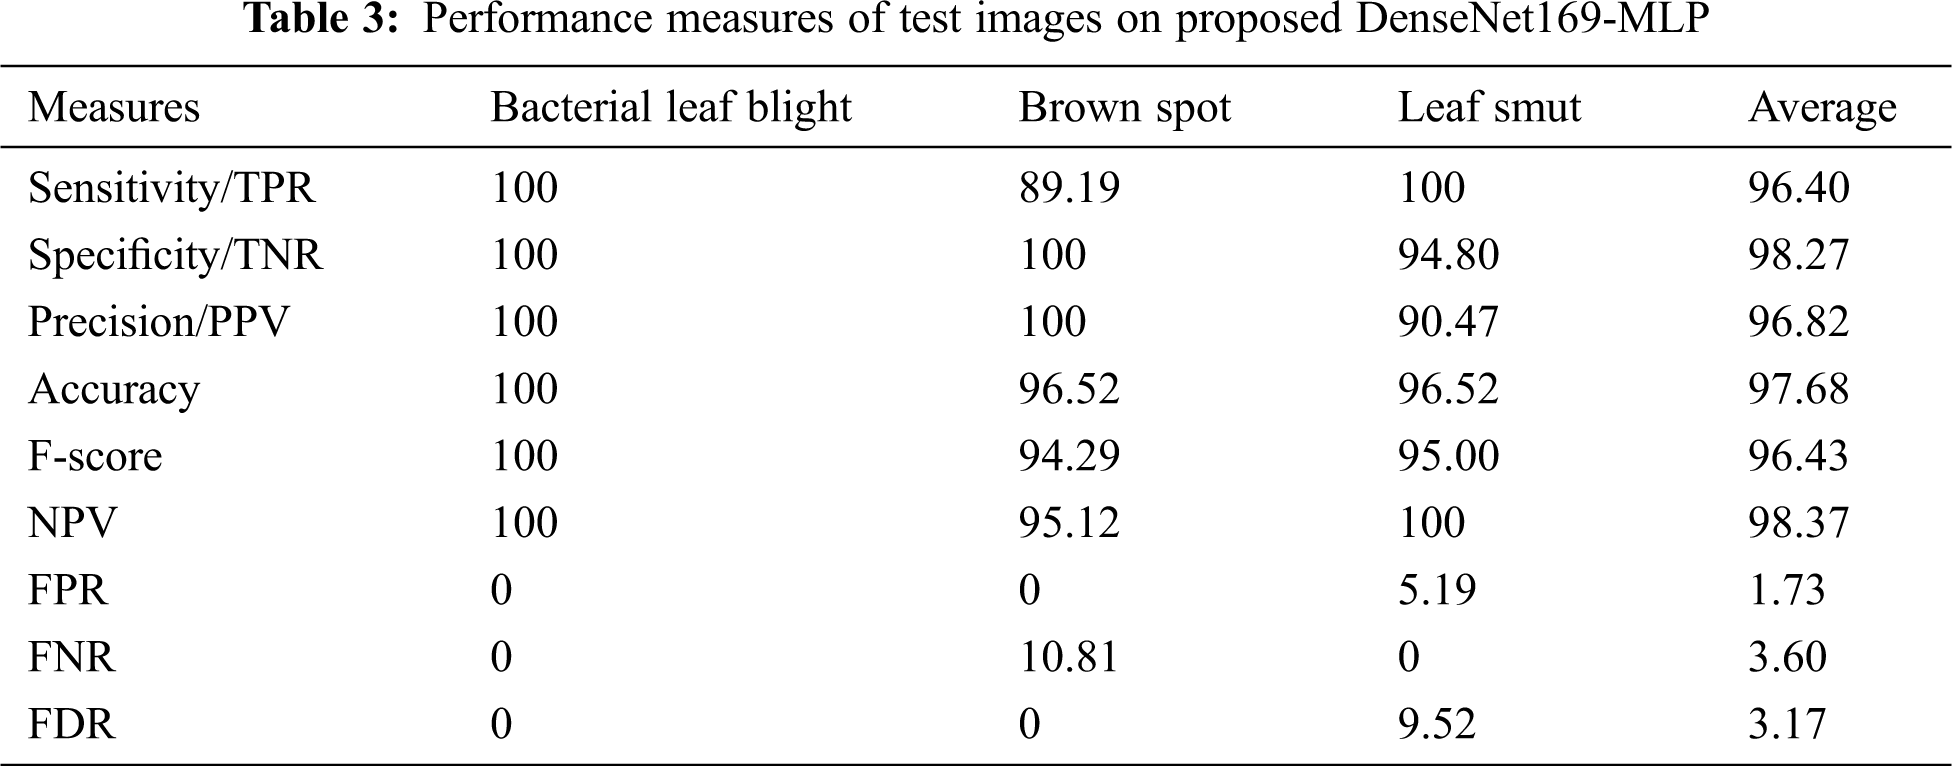
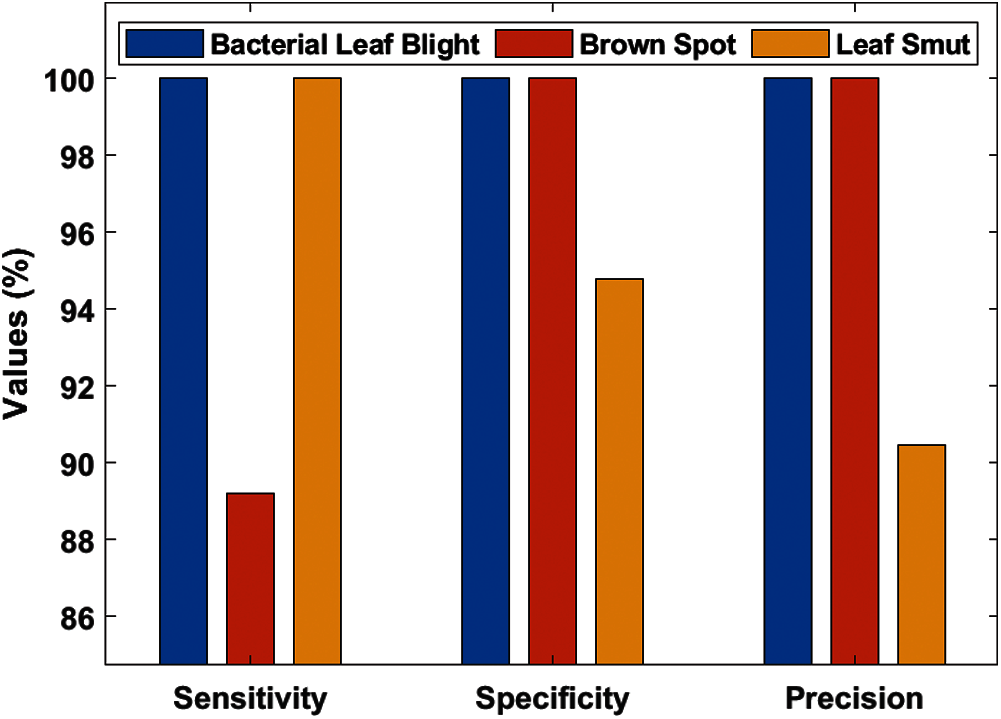
Figure 7: Test image analysis of DenseNet169-MLP model with different measures
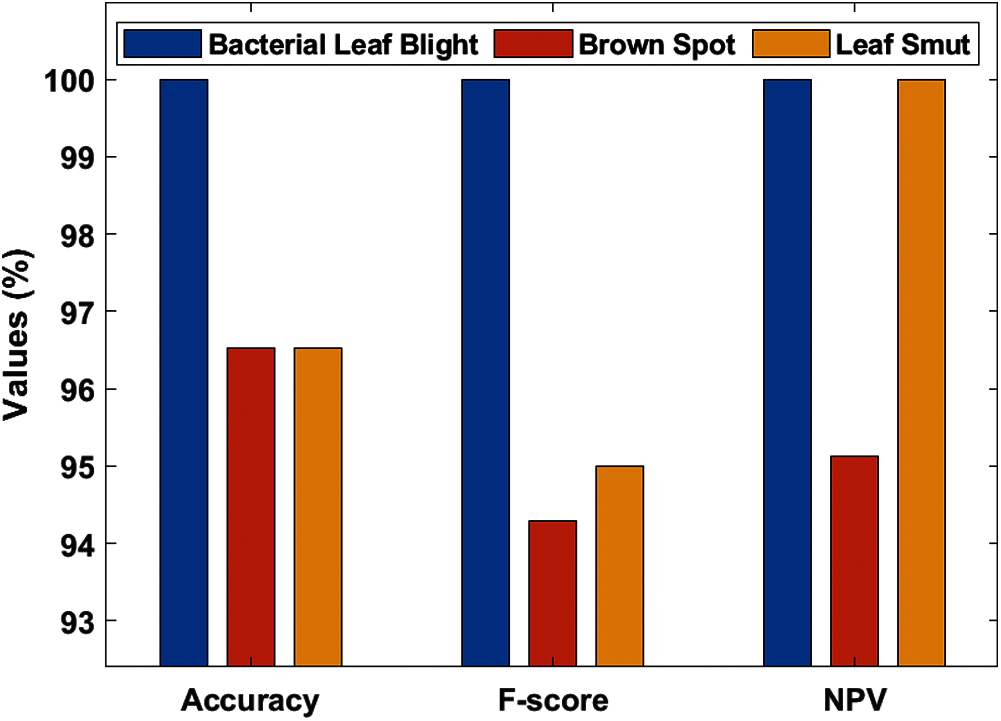
Figure 8: Test image analysis of DenseNet169-MLP model with different measures
Finally, the DenseNet169-MLP model has classified the leaf smut images with the sensitivity of 100%, specificity of 94.80%, precision of 90.47%, accuracy of 96.52%, F-score of 95%, NPV of 100%, FPR of 5.19%, FNR of 0 and FDR of 9.52%. These values demonstrated the proficient characteristics of the DenseNet169-MLP model on the classification of rice plant diseases.
Tab. 4 represents the analysis of the comparative results of the DenseNet169-MLP model with recently proposed models [7–9] interms of different measures. Fig. 9 shows the sensitivity and specificity analysis of the DenseNet169-MLP model with compared methods. The figure portrayed that the ANN model is found to be the worst performance which has attained a minimum sensitivity and specificity of 63.30% and 81.58% respectively. On continuing, closer classification performance to the ANN model has been attained by the KNN model with the sensitivity and specificity of 65% and 78% respectively. Followed by, the DAE model has demonstrated slightly higher sensitivity and specificity of 68.02% and 87.18% respectively. Besides, the DNN model has reached moderate classifier results with sensitivity and specificity of 73.46% and 89.42% respectively.
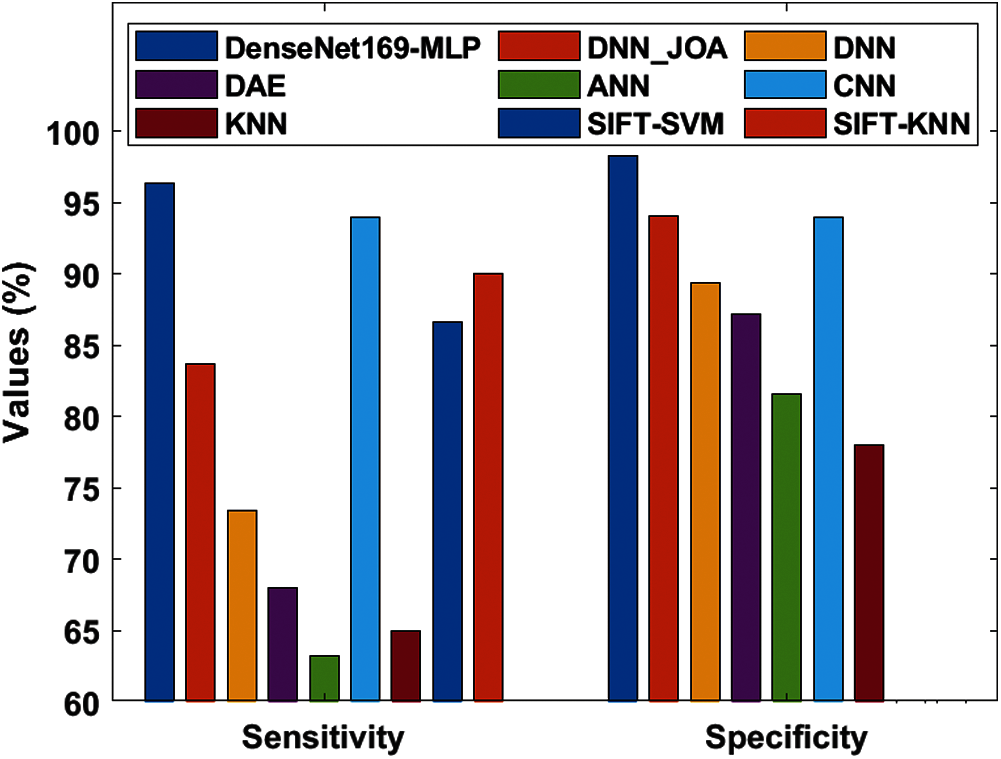
Figure 9: Sensitivity and specificity analysis of DenseNet169-MLP model
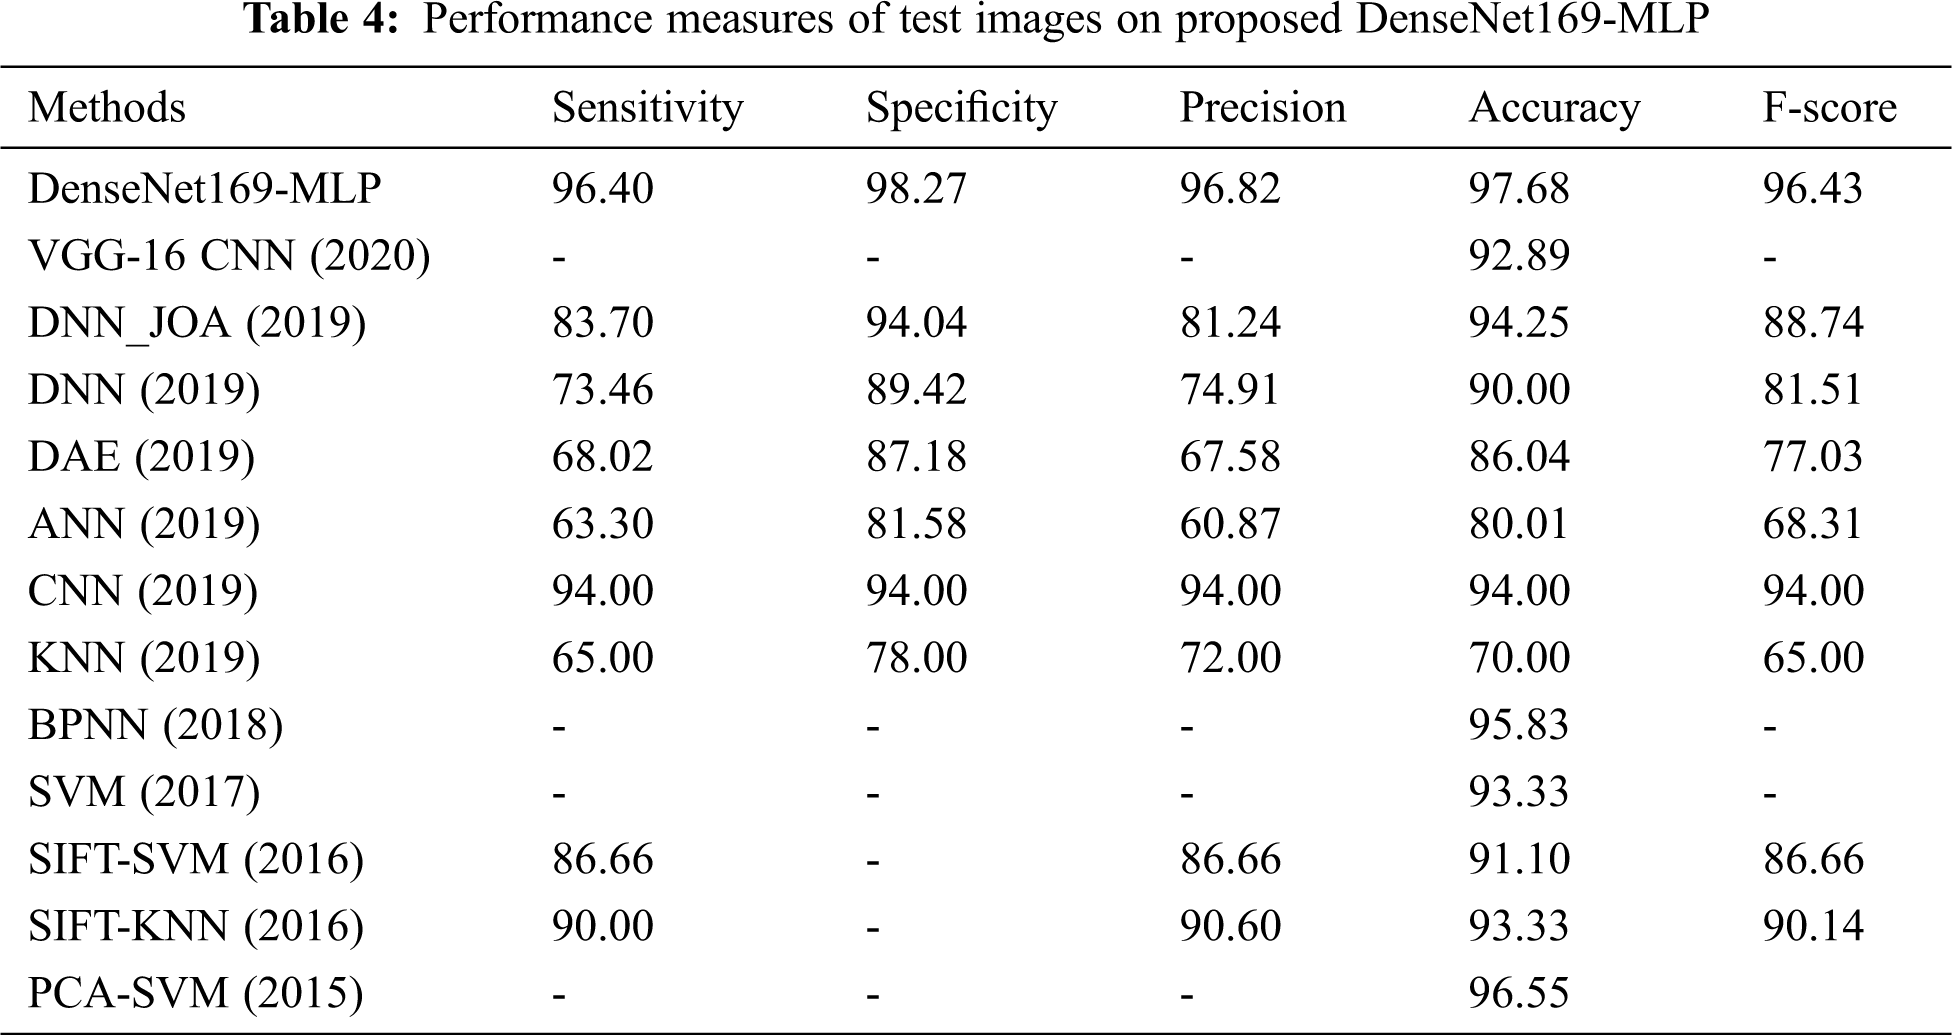
Also, the DNN-JOA model has resulted in somewhat acceptable results with the sensitivity and specificity of 83.70% and 94.04% respectively. Moreover, the SIFT-SVM and SIFT-KNN models have exhibited competitive results with the maximum sensitivity values of 86.66% and 90% respectively. However, the CNN model has a slightly higher result with sensitivity and specificity values of 94% and 94%. At last, the DenseNet169-MLP model has demonstrated superior performance by attaining maximum sensitivity and specificity values of 96.40% and 98.27% respectively.
Fig. 10 depicts the precision and F-score analysis of the DenseNet169-MLP method with previous ones. From the figure, it is clear that the ANN approach is said to be an inferior performance that has reached lower precision and F-score of 60.87% and 68.31% respectively. In line with this, the nearer classification function to the ANN method is accomplished by the DAE approach with the precision and F-score of 67.58% and 77.03% correspondingly. Along with that, the KNN scheme has showcased better precision and F-score of 72% and 65% respectively. On the other hand, the DNN technology has attained gradual classifier results with precision and F-score of 74.91% and 81.51% respectively. Moreover, the DNN-JOA technique has ended with considerable results with the precision and F-score of 81.24% and 88.74% respectively. Also, the SIFT-SVM and SIFT-KNN methodologies have referred competing results with the higher precision and F-score values of 86.66%, 86.66% and 90.60%, 90.14% correspondingly. Hence, the CNN approach implied the moderate result with precision an F-score values of 94% and 94% respectively. Finally, the DenseNet169-MLP framework has illustrated qualified function by reaching higher precision and F-score values of 96.82% and 96.43% correspondingly.
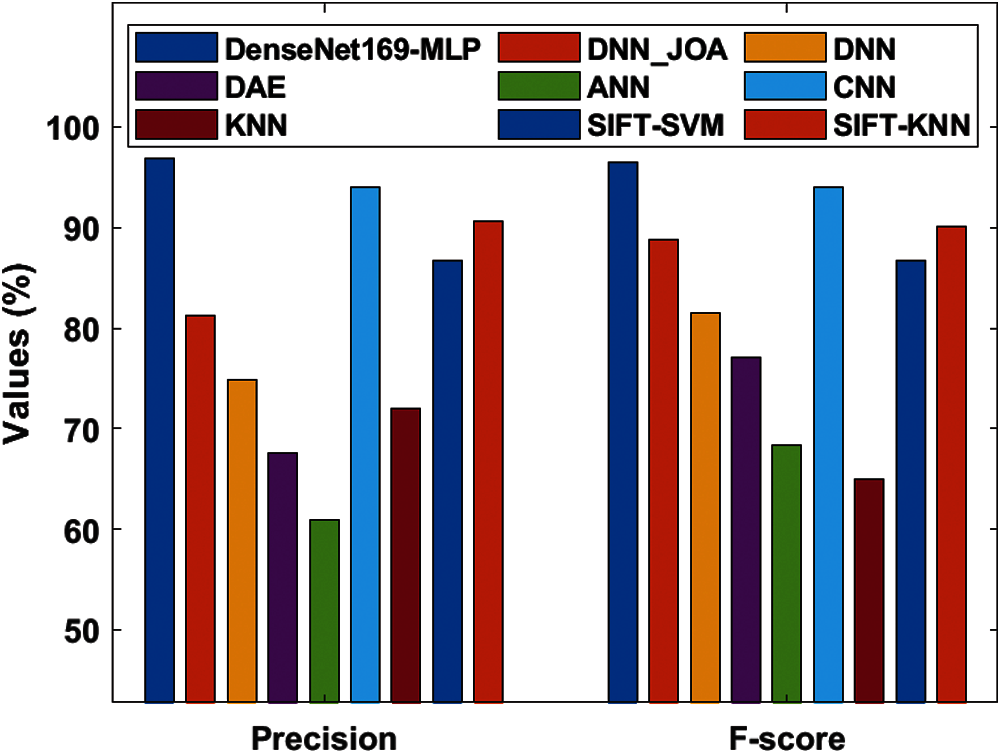
Figure 10: Precision and F-score analysis of DenseNet169-MLP model
Fig. 11 depicts the accuracy analysis of the DenseNet169-MLP approach with previous ones. The figure depicted that the KNN approach is referred to be the poor performance which has achieved the least accuracy of 701%. Likewise, closer classification function to the KNN model is reached by the ANN model with an accuracy of 80.01%. Then, the DAE and DNN frameworks have showcased manageable accuracy of 86.04% and 90% correspondingly. On the other hand, the SIFT-SVM and VGG-16 CNN schemes have attained considerable classifier results with the accuracy of 91.10% and 92.89% respectively. Similarly, the SVM and SIFT-KNN methods have illustrated better and identical result accuracy of 93.33%. Also, the CNN approach has demonstrated a reasonable outcome with an accuracy of 94%. Additionally, the DNN_JOA and BPNN models have shown competing results with greater accuracy values of 94.25% and 95.83% respectively. Therefore, the PCA-SVM models have showcased slightly equitable performance with the accuracy of 96.55%. Consequently, the DenseNet169-MLP approach has implied a supreme function by reaching a higher accuracy value of 97.68%. The above-mentioned experimental values verified the effective detection and classification performance of the DenseNet169-MLP model for rice plant images. The improved performance is due to the inherent advantages of the DenseNet and MLP models. Therefore, the DenseNet169-MLP model can be employed as a proficient method for rice plant disease diagnosis in a real-time environment to assist farmers and improve crop productivity.
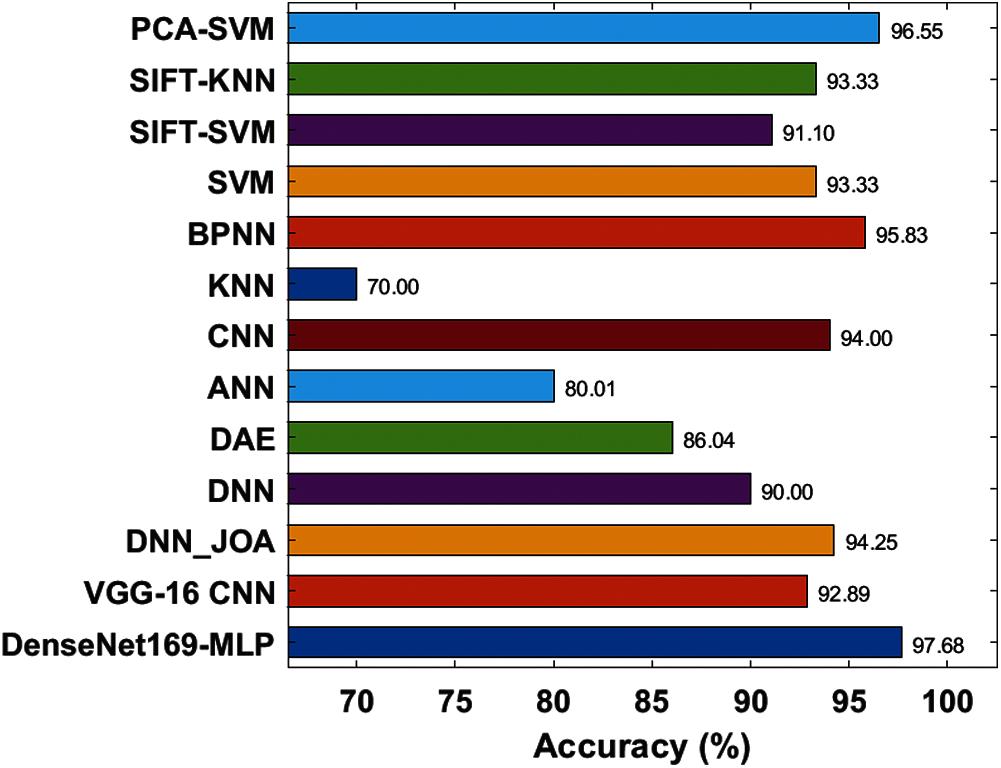
Figure 11: Accuracy analysis of DenseNet169-MLP model
This study has presented an effective DL based DenseNet169-MLP model to classify rice plant diseases. The DenseNet169-MLP model initially had undergone preprocessing to improve image quality. Then, the FCM based segmentation process takes place to detect the infected portions and the DenseNet169 model is applied to extract the features. Finally, MLP is placed at the last layer of the DenseNet169 model to perform final rice plant classification. The experimental validation of the DenseNet169-MLP model takes place on benchmark rice plant dataset. The experimental values verified that the DenseNet169-MLP model has attained maximum sensitivity of 96.40%, specificity of 98.27%, precision of 96.82%, accuracy of 97.68% and F-score of 96.43%. The proposed technique is applied as a proper tool to identify and classify rice plant diseases. In the future, the detection performance can be increased by the use of hyperparameter tuning techniques to fine-tune the DL models.
Funding Statement: The authors received no specific funding for this study.
Conflicts of Interest: The authors declare that they have no conflicts of interest to report regarding the present study.
1. G. Sambasivam and G. D. Opiyo, “A predictive machine learning application in agriculture: Cassava disease detection and classification with imbalanced dataset using convolutional neural networks,” Egyptian Informatics Journal, vol. 22, no. 1, pp. 27–34, 2021. [Google Scholar]
2. M. A. Beck, C. -Y. Liu, C. P. Bidinosti, C. J. Henry, C. M. Godee et al., “An embedded system for the automated generation of labeled plant images to enable machine learning applications in agriculture,” PLOS ONE, vol. 15, no. 12, pp. e0243923, 2020. [Google Scholar]
3. G. E. Hinton, “Reducing the dimensionality of data with neural networks,” Science, vol. 313, no. 5786, pp. 504–507, 2006. [Google Scholar]
4. J. Zhou, J. Li, C. Wang, H. Wu, C. Zhao et al., “A vegetable disease recognition model for complex background based on region proposal and progressive learning,” Computers and Electronics in Agriculture, vol. 184, pp. 106101, 2021. [Google Scholar]
5. M. Francis and C. Deisy, “Mathematical and visual understanding of a deep learning model towards m-agriculture for disease diagnosis,” Archives of Computational Methods in Engineering, vol. 28, no. 3, pp. 1129–1145, 2021. [Google Scholar]
6. S. S. Chouhan, A. Kaul and U. P. Singh, “A deep learning approach for the classification of diseased plant leaf images,” in 2019 Int. Conf. on Communication and Electronics Systems (ICCESCoimbatore, India, pp. 1168–1172, 2019. [Google Scholar]
7. H. B. Prajapati, J. P. Shah and V. K. Dabhi, “Detection and classification of rice plant diseases,” Intelligent Decision Technologies, vol. 11, no. 3, pp. 357–373, 2017. [Google Scholar]
8. S. Ramesh and D. Vydeki, “Recognition and classification of paddy leaf diseases using optimized deep neural network with jaya algorithm,” Information Processing in Agriculture, vol. 7, no. 2, pp. 249–260, 2020. [Google Scholar]
9. S. R. D. Vydeki, “Application of machine learning in detection of blast disease in south Indian rice crops,” Journal of Pathology, vol. 11, pp. 31–37, 1970. [Google Scholar]
10. B. S. Anami, N. N. Malvade and S. Palaiah, “Deep learning approach for recognition and classification of yield affecting paddy crop stresses using field images,” Artificial Intelligence in Agriculture, vol. 4, pp. 12–20, 2020. [Google Scholar]
11. W. Liang, H. Zhang, G. Zhang and H. Cao, “Rice blast disease recognition using a deep convolutional neural network,” Scientific Reports, vol. 9, no. 1, pp. 2869, 2019. [Google Scholar]
12. S. Ghosal, D. Blystone, A. K. Singh, B. Ganapathysubramanian, A. Singh et al., “An explainable deep machine vision framework for plant stress phenotyping,” Proceedings of the National Academy of Sciences, USA, vol. 115, no. 18, pp. 4613–4618, 2018. [Google Scholar]
13. J. Lu, J. Hu, G. Zhao, F. Mei and C. Zhang, “An in-field automatic wheat disease diagnosis system,” Computers and Electronics in Agriculture, vol. 142, pp. 369–379, 2017. [Google Scholar]
14. Y. Lu, S. Yi, N. Zeng, Y. Liu and Y. Zhang, “Identification of rice diseases using deep convolutional neural networks,” Neurocomputing, vol. 267, pp. 378–384, 2017. [Google Scholar]
15. K. P. Ferentinos, “Deep learning models for plant disease detection and diagnosis,” Computers and Electronics in Agriculture, vol. 145, pp. 311–318, 2018. [Google Scholar]
16. G. Dhingra, V. Kumar and H. D. Joshi, “A novel computer vision based neutrosophic approach for leaf disease identification and classification,” Measurement, vol. 135, pp. 782–794, 2019. [Google Scholar]
17. D. Nidhis, C. N. V. Pardhu, K. C. Reddy and K. Deepa, “Cluster based paddy leaf disease detection, classification and diagnosis in crop health monitoring unit,” in Computer Aided Intervention and Diagnostics in Clinical and Medical Images, Cham: Springer, pp. 281–291, 2019. [Google Scholar]
18. T. Islam, M. Sah, S. Baral and R. Roy Choudhury, “A faster technique on rice disease detection using image processing of affected area in agro-field,” in 2018 Second Int. Conf. on Inventive Communication and Computational Technologies, Coimbatore, India, pp. 62–66, 2018. [Google Scholar]
19. T. Gayathri Devi and P. Neelamegam, “Image processing based rice plant leaves diseases in Thanjavur, Tamilnadu,” Cluster Computing, vol. 22, no. S6, pp. 13415–13428, 2019. [Google Scholar]
20. A. Kaya, A. S. Keceli, C. Catal, H. Y. Yalic, H. Temucin et al., “Analysis of transfer learning for deep neural network based plant classification models,” Computers and Electronics in Agriculture, vol. 158, pp. 20–29, 2019. [Google Scholar]
21. A. dos Santos Ferreira, D. M. Freitas, G. G. da Silva, H. Pistori and M. T. Folhes, “Weed detection in soybean crops using convNets,” Computers and Electronics in Agriculture, vol. 143, pp. 314–324, 2017. [Google Scholar]
22. J. Arora and M. Tushir, “An enhanced spatial intuitionistic fuzzy C-means clustering for image segmentation,” Procedia Computer Science, vol. 167, pp. 646–655, 2020. [Google Scholar]
23. G. Huang, Z. Liu, L. Van Der Maaten and K. Q. Weinberger, “Densely connected convolutional networks,” in 2017 IEEE Conf. on Computer Vision and Pattern Recognition, Honolulu, HI, USA, pp. 2261–2269, 2017. [Google Scholar]
24. G. Xu, X. Zhu, D. Fu, J. Dong and X. Xiao, “Automatic land cover classification of geo-tagged field photos by deep learning,” Environmental Modelling & Software, vol. 91, pp. 127–134, 2017. [Google Scholar]
25. H. B. Prajapati, J. P. Shah and V. K. Dabhi, “Detection and classification of rice plant diseases,” Intelligent Decision Technologies, vol. 11, no. 3, pp. 357–73, 2017. [Online]. Available: https://archive.ics.uci.edu/ml/datasets/Rice+Leaf+Diseases. [Google Scholar]
 | This work is licensed under a Creative Commons Attribution 4.0 International License, which permits unrestricted use, distribution, and reproduction in any medium, provided the original work is properly cited. |