DOI:10.32604/iasc.2022.020662
| Intelligent Automation & Soft Computing DOI:10.32604/iasc.2022.020662 | |
| Article |
Breast Cancer Detection Through Feature Clustering and Deep Learning
Department of Computer Sciences, College of Computer and Information Sciences, Princess Nourah bint Abdulrahman University, Riyadh, 11047, KSA
*Corresponding Author: Norah S. Alghamdi. Email: NOSAlghamdi@pnu.edu.sa
Received: 02 June 2021; Accepted: 13 July 2021
Abstract: In this paper we propose a computerized breast cancer detection and breast masses classification system utilizing mammograms. The motivation of the proposed method is to detect breast cancer tumors in early stages with more accuracy and less negative false cases. Our proposed method utilizes clustering of different features by segmenting the breast mammogram and then extracts deep features using the presented Convolution Neural Network (CNN). The extracted features are then combined with subjective features such as shape, texture and density. The combined features are then utilized by the Extreme Learning Machine Clustering (ELMC) algorithm to combine segments together to identify the breast mass Region of Interest (ROI). We present a detection method utilizing the ELMC clustering technique. Building a multi-feature set, the ELMC classifier is utilized to perform classification of normal, benign and cancer breast masses. Feature fusion is performed on the extracted shape, texture and density features forming a fusion feature set. In the automated detection phase, we utilize the fusion feature sets for classification. Extensive experimentation has been carried out to validate the ability of our proposed method. We utilized a dataset of 600 female mammograms. The experiments measure the accuracy of our proposed detection and classification method. The CNN coupled with the Extreme Learning Machine Clustering algorithm achieves the highest accuracy, sensitivity, specificity and ROC measures when combined with a multi-feature set. The model achieves 98.53% cancer detection accuracy, 95.6% benign detection accuracy and 95% for normal cases.
Keywords: Breast cancer; Classification; Deep learning; Detection; Image processing
Breast cancer is a severe risk to female health. The mortality rate of breast cancer is very high and it is classified as the first disease with highest death rate [1–3]. Mammography is usually utilized in breast cancer screening due to its sensitivity to even small tumors [3–6]. Women are required to have a mammogram every year when they are above 40 years old. For mass screening, especially in poor countries automated breast cancer detection can aid in addressing this matter.
Many researchers investigate the utilization of convolutional neural networks and deep learning for auto detection of breast cancer. Although, the vast developments of deep learning techniques continue to aid the medical professionals to apply these methods to enhance the accuracy of cancer detection. Still the computerized breast cancer detection especially in early stages is demolished with a high rate of false positives and negatives. Computerized breast cancer detection has two metrics to help evaluate both false rates the metrics are sensitivity and specificity. They average 86.9% and 88.9%3 respectively. To enhance those metrics, deep learning accompanied with deep feature extraction and clustering are sought. Recent studies prove that deep learning standalone breast cancer prediction systems can be enhanced through aggressive feature extraction [6–10]. Breast cancer tumors usually occupy a small region of the mammogram of the breast. For instance, a full mammogram image is around 4400 × 3200 pixels while an early stage cancer region is only 120 × 120 pixels [9]. Therefore, recent studies employ pre-processing of the mammograms through denoising to increase the contrast between breast masses and normal tissues. Pre-training also can enhance the training accuracy and speed and also can save training time and improve the false positive and negative rates [6–11].
Automated detection for breast cancer should comprise the following steps for better performance:
a) Mammogram preprocessing
b) Locating the Region of Interest which might include a tumor.
c) Feature extraction
d) Classifying benign and cancerous tumors according to the extracted feature.
Deep machine learning using convolutional neural networks (CNN), can perform objective feature extraction without the aid of medical experts [7–10]. Subjective or objective features. Subjective features extracted through medical experts can be coupled with the automated objective features for better machine training process.
In this paper, we are presenting a novel breast cancer detection algorithm that combines a number of deep features. The contributions of our research are as follows.
• We propose a technique that utilizes CNN and an extreme learning machine (ELMC) for feature clustering through mammogram segmentation. Feature extraction, from each segment, is performed by the CNN and then clustering is performed through the (ELMC) to localize the tumor region.
• Feature fusion is done for features extracted through the CNN with shape, texture and density features of the breast tumor.
• In the automated detection phase, we utilize the fusion feature sets for classification by the ELM.
• Extensive experimentation has been carried out to validate the ability of our proposed method. We utilized a dataset of 600 female mammograms.
The rest of the paper is divided as follows: related work is discussed in Section 2. Section 3 discusses the methodology and the utilized dataset. Section 4 describes the experimental results while conclusions are summarized in Section 5.
Previous work on automated breast tumor detection emphasis on automated detection and classification of breast cancer. The authors in [11] suggested a mass detection scheme, utilizing fuzzy C-means segmentation algorithm using mammograms that is followed by a supervised CNN to classify the segmented region. In [12], the authors utilized pixels region in a collective process to partition the tumor in the digital image. Authors in [13] introduced an enhanced watershed algorithm that perform a coarse partitioning of the breast tumor in the mammogram with edge detection by merging regions with the same gray-scale average values. In [14], the authors presented an algorithm to identify breast masses in the mammogram and uses an adaptive threshold segmentation process, both locally and globally. In [15], the authors utilized deep learning AlexNet CNN to detect masses in ultrasound images of the breast respectively.
In the aspect of breast tumors classification, the authors in [16] generated a Bayesian-based network process that utilizes some physical features that are manually done to program a computerized diagnosis of breast cancer. In [17], the authors utilized ELMC classifier for feature classification of breast masses and they performed a comparison with the SVM classifier. The authors in [18] utilized CNN to predict the possibility of breast tumor by utilizing the CNN and train it with a dataset in the temporal dimension. In [19] they applied deep learning to the analysis of breast cancer risk using training data of 420 mammography images. In [20], the authors presented a feature-based CNN for cancer and benign mass classification, accompanied with a decision tree. The research in [21] focused on training of a CNN to extract breast tumor representations and classify them. In [22], the authors presented a computerized mammogram feature analysis using deep learning to assess increasing patient’s risk of breast cancer. In [23], the authors proposed an image analysis procedure using Zernike second moment for feature extraction in a breast CAD automated system. The authors in [24] presented a CAD system utilizing genetic algorithms to extract significant features utilizing forest classification.
Previous work such as the research in [17] used only ELMC classifiers with better accuracy than SVM machines but still with accuracy in the range of 89.5%. The work in [18] employs a temporal dimension with average accuracy of 86.5%. While authors in [24] gained higher accuracy of 92.5% with feature forest classification. On the other hand, our proposed method denotes the use of multi-feature fusion technique, combined with deep-CNN and ELMC classifiers with accuracy reaching 98.5%.
The proposed technique, in this paper, consists of five phases. The first phase is the preprocessing of the mammograms. The second and third phases are mass detection and feature extraction processes respectively. The fourth and fifth phases are the classifier training, and the classification processes. The description of the five phases are described as follows:
1. In the preprocessing phase, denoising and contrast enhancement processes of the mammogram are used to differentiate between breast tumors and the other masses.
2. Mass identification is done to predict the region of interest which is the tumor.
3. Feature extraction includes deep objective features such as morphological, texture and density features.
4. The training of the classifier is performed by using breast mammograms dataset using the corresponding labels.
5. Automated diagnosis is performed using the classifier.
Preprocessing techniques such as the adaptive mean filter technique (AMFT) as presented in [25], is utilized to remove noises in the mammograms. The concept behind the AMFT is to perform an anchor sliding process in the image gradient using the mean, variance, and other spatial correlation functions to decide if this window encloses noise. Pixels with suspected noise value are replaced with the mean value of the sliding window.
In our paper, we propose a contrast augmentation algorithm that enhances the differences between the tumor masses and other breast masses. The procedure is to extract a uniform histogram from the mammogram, followed by image enlargement on the grayscale to enhance the contrast and increase the clarity of the details of the image.
Mammograms usually include noises that affect the tumor area detection and may not lead to a trusted diagnosis. We measure skewness as a representation of the noise in images. Skewness is defined as a function of the mean and standard deviation of a random variable x as shown in Eq. (1).
Zero skewness indicates the absence of noise in the image [26–28]. In our proposed process we will denoise the mammogram until the skewness is near zero. We devised a DCT-IDCT optimization process to minimize the influence of the noise in mammograms without sacrificing the texture. Fig. 1 shows a mammogram with a tumor that undergoes the Denoising technique. The steps of the Denoising technique is depicted in Fig. 2.

Figure 1: The denoising process (a) is the image before denoising, (b) is the image after denoising
Fig. 1a is the mammogram before denoising, while Fig. 1b is the images that underwent the denoising process. As shown in the figure, the difference between the breast and the other parts in the mammogram is enhanced and the boundary is well defined.
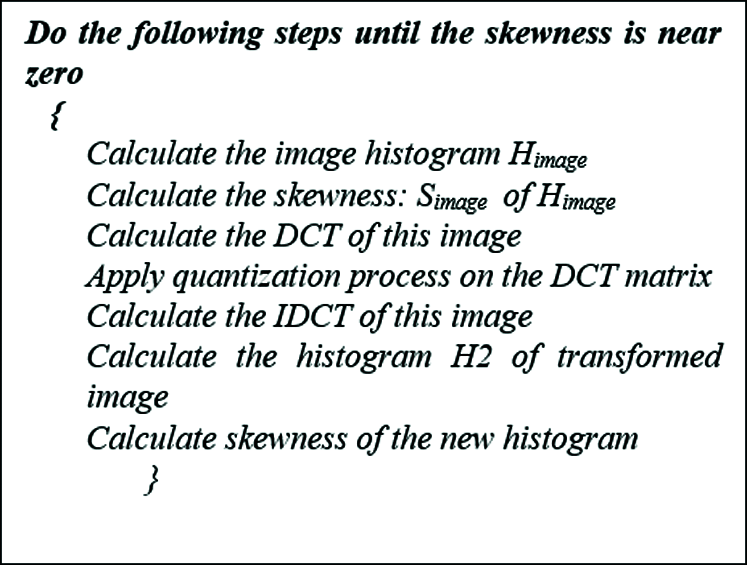
Figure 2: The denoising algorithm
Mass region identification is to differentiate the mass portion from other parts [29–31]. Accurate mass segmentation can lead to more accurate feature extraction. In this research, we are introducing a breast mass detection technique that utilizes domain CNN feature extraction and extreme learning machine clustering technique. The Mass region detection algorithm is summarized into the following steps:
1. Start preprocessing phase of the mammogram to extract the ROI,
2. Partition the RIO into several overlapping sub-regions,
3. Identify the deep features of each part,
4. Perform Clustering of the partitions according to the feature-matching procedure,
5. Determine boundaries of the breast mass area.
The application of the procedure on an image of a mammogram is shown in Fig. 3.
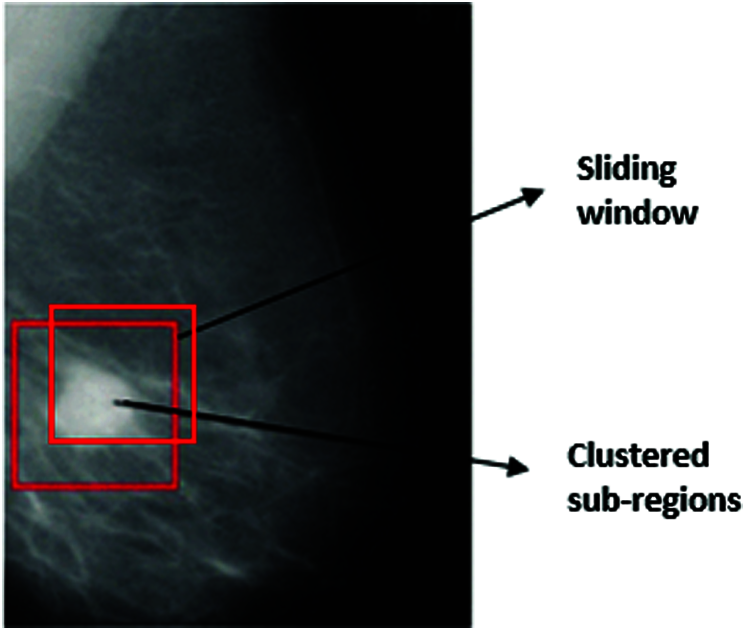
Figure 3: Mass region detection
In our paper, we propose a contrast augmentation algorithm that enhances the differences between the tumor masses and other breast masses. The procedure is to extract a uniform histogram from the mammogram, followed by image enlargement on the grayscale to enhance the contrast and increase the clarity of the details of the image.
We propose a Deep-CNN for deep-feature extraction from the region of interest partitions. The CNN classifier can diagnose breast tumors from the mammogram images via deep learning. As shown in Fig. 4, the Deep-CNN has an input layer followed by several convolution (CL) and pooling layers (PL) followed by a classifier; and an output layer at the end. The CL converts the input ROI image into smaller ones of proportion 4 to 1. The PL layer performs a max pooling approach to shrink the size of image to a one-fourth of its original size. The CNN classifier has two fully connected (FC) layers that leads to the determination of the tumor class.
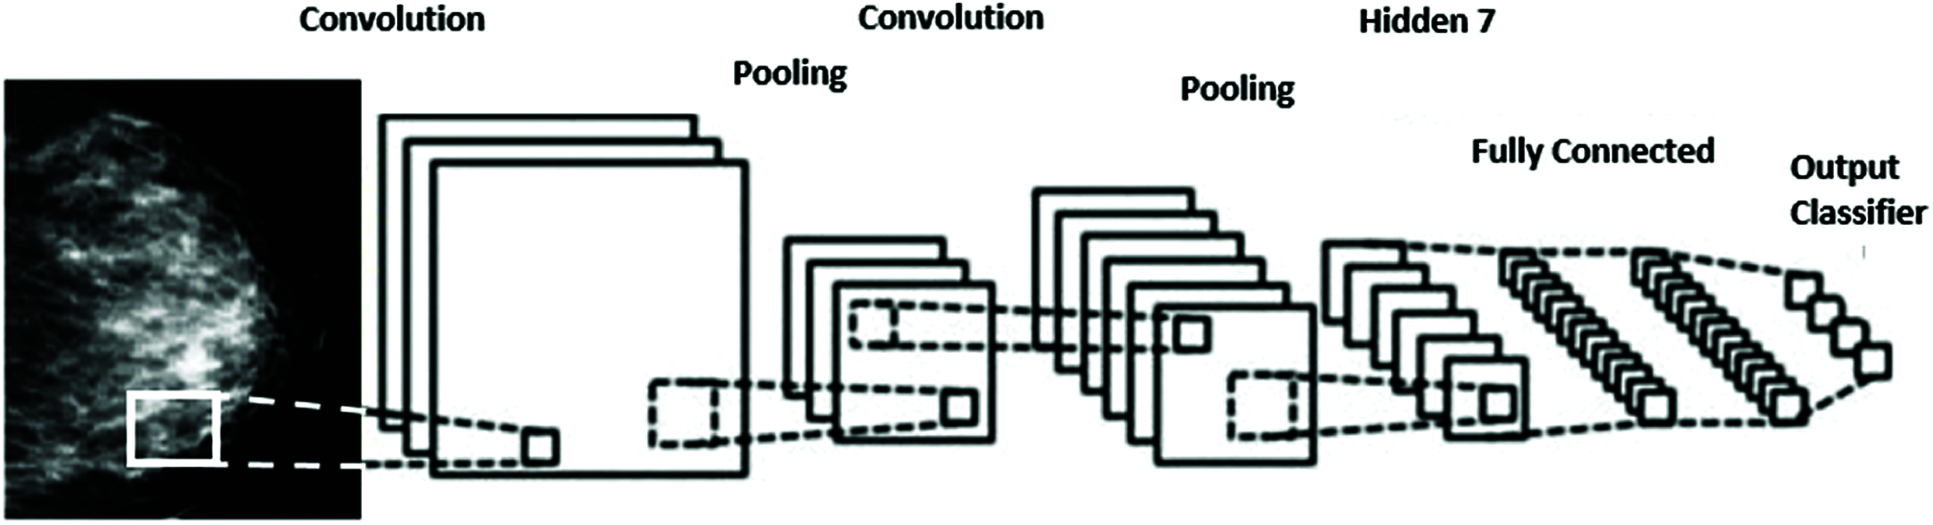
Figure 4: CNN for mass detection
3.4 Extreme Learning Machine Clustering (ELMC)
Our proposed technique clusters CNN-extracted features using the extreme learning machine clustering algorithm (ELMC). We identify three clusters where ROI features are clustered into them. The three clusters are normal mass, benign mass and cancer mass regions.
ELMC technique is used to discover the structural relations that occur between unlabeled dataset [32,33]. The description of the ELMC algorithm is as follows:
1. The feature matrix M ∈ RNxn0 is used as an input to the algorithm,
2. The algorithm produces the clustering results.
3. Laplacian differential operator is computed from M
4. A hidden neuron layer will generate an output matrix Z ∈ RNxnh
5. If nh is less than the input n0, then
Compute the output weights using the following equation
(β is the set of weights between the hidden and the output layer)
Otherwise calculate the output weights.
3.5 Classification of Normal, Benign and Cancer Masses
We propose a classification method using ELMC algorithm fused with the deep features. The method first extracts the deep features from the CNN and then identifies the texture and density features from the mass ROI. The fusion features are then classified into the three categories of normal, benign and cancer diagnosis.
CNN will identify the deep features of the breast masses as the main representation of the masses’ properties. According to medical experts, breast cancer mass in mammograms usually has irregular shape with a rough covering edge with firm nodules. The cancer mass density is non-uniform with respect to the surrounding tissues. On the other hand, the benign breast mass has a regular shape with smooth edges with small nodules. The benign mass density is uniformly distributed with the surrounding tissues. The normal tissues are usually blended with the surrounding with no edges separating them.
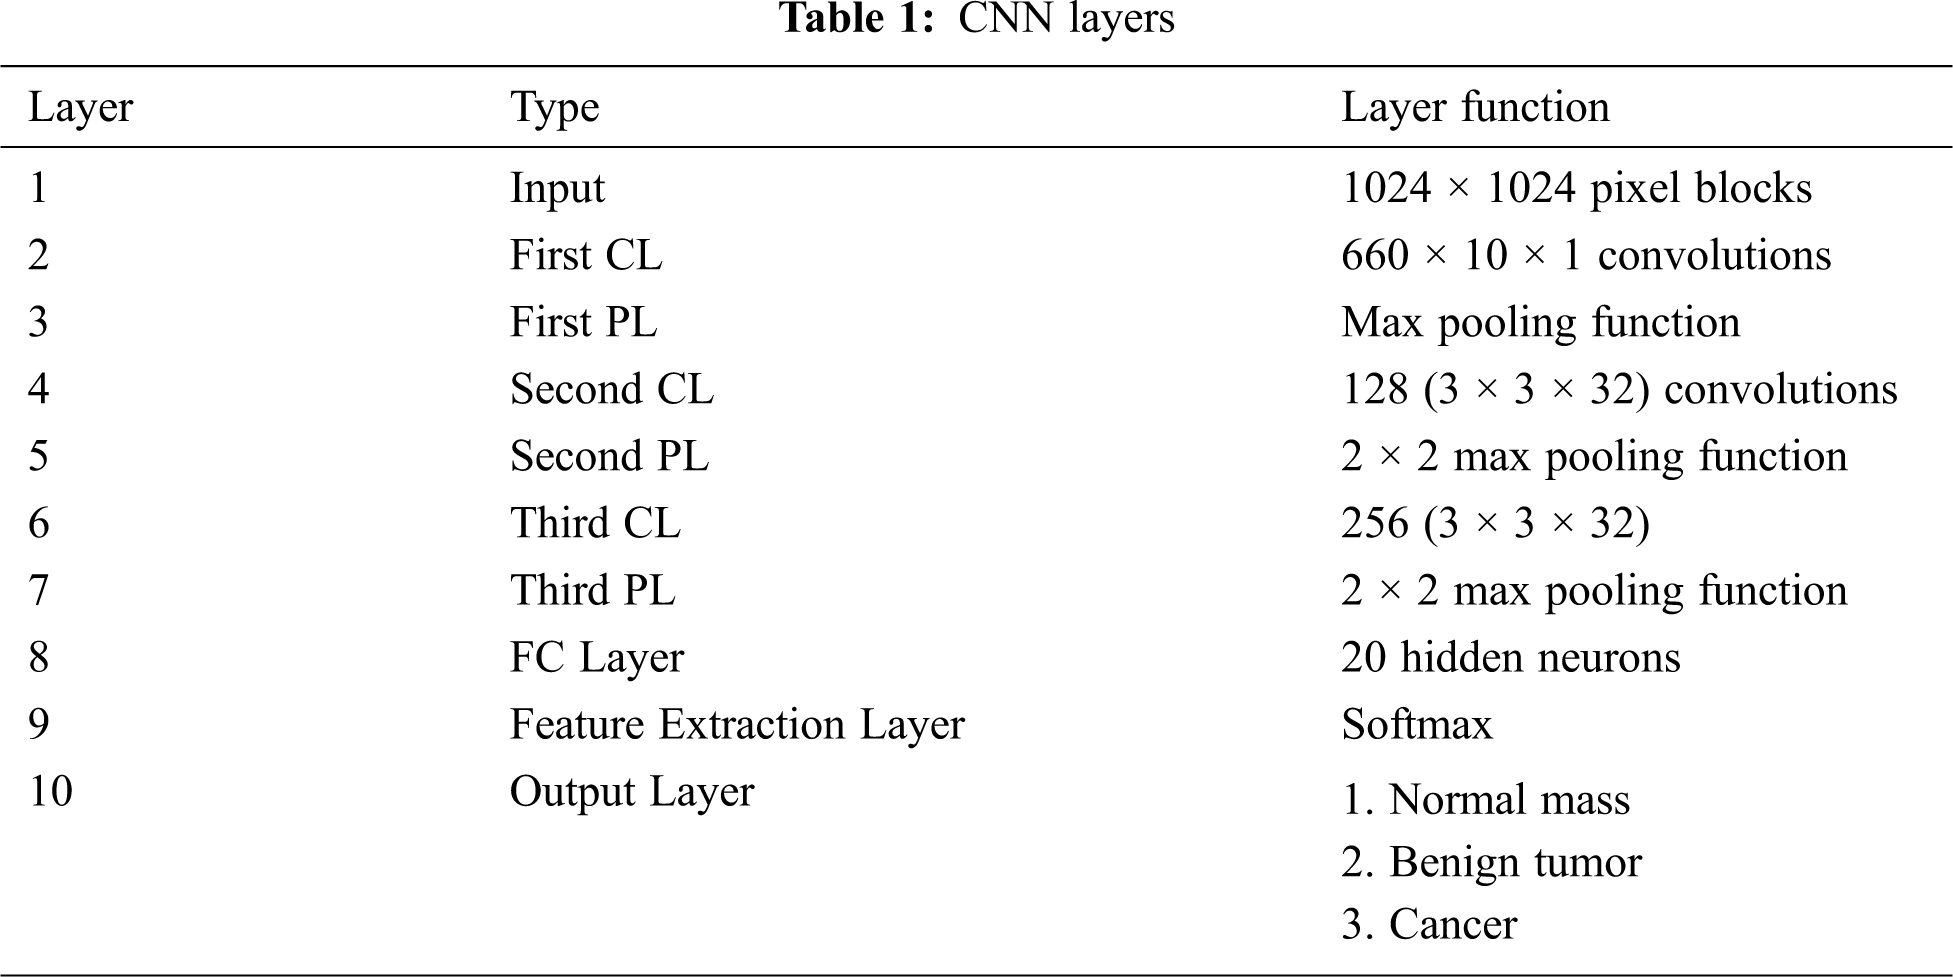
The function of the convolution-pooling layers (CP) of the Deep-CNN is mainly feature extraction. CP layers extract the essential image features without supervision. A Deep-CNN network, with ten layers, is used in the extraction procedure as described in Tab. 1. The input image to the convolution neural network is the breast mass area under diagnosis [34]. The final fully-connected (FC) layer has 20 neurons (2 × 2 × 5) which denotes the mass deep features: DF1= [f1, f2, …, f20].
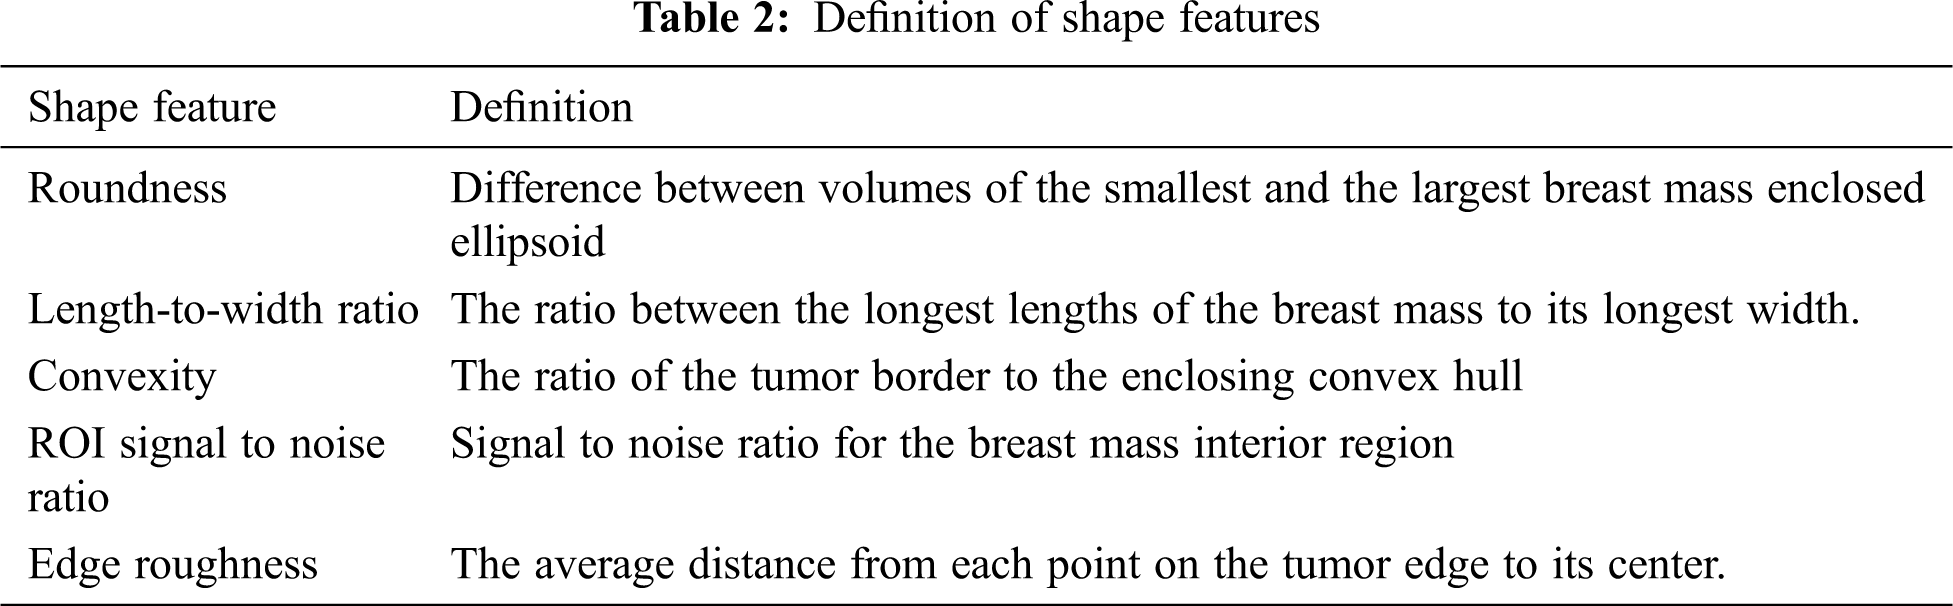
According to medical experts, breast cancer mass has asymmetrical shapes and rough edges with the nearby tissues. Shape properties are the main ones in differentiating between normal and cancer tissues [35]. In our research, we utilized roundness, Length-to-width ratio, Convexity, and edge roughness as the shape features which are represented as: DF2 = [s1,s2,s3,s4,s5]. Tab. 2 illustrates the definitions of the shape features.
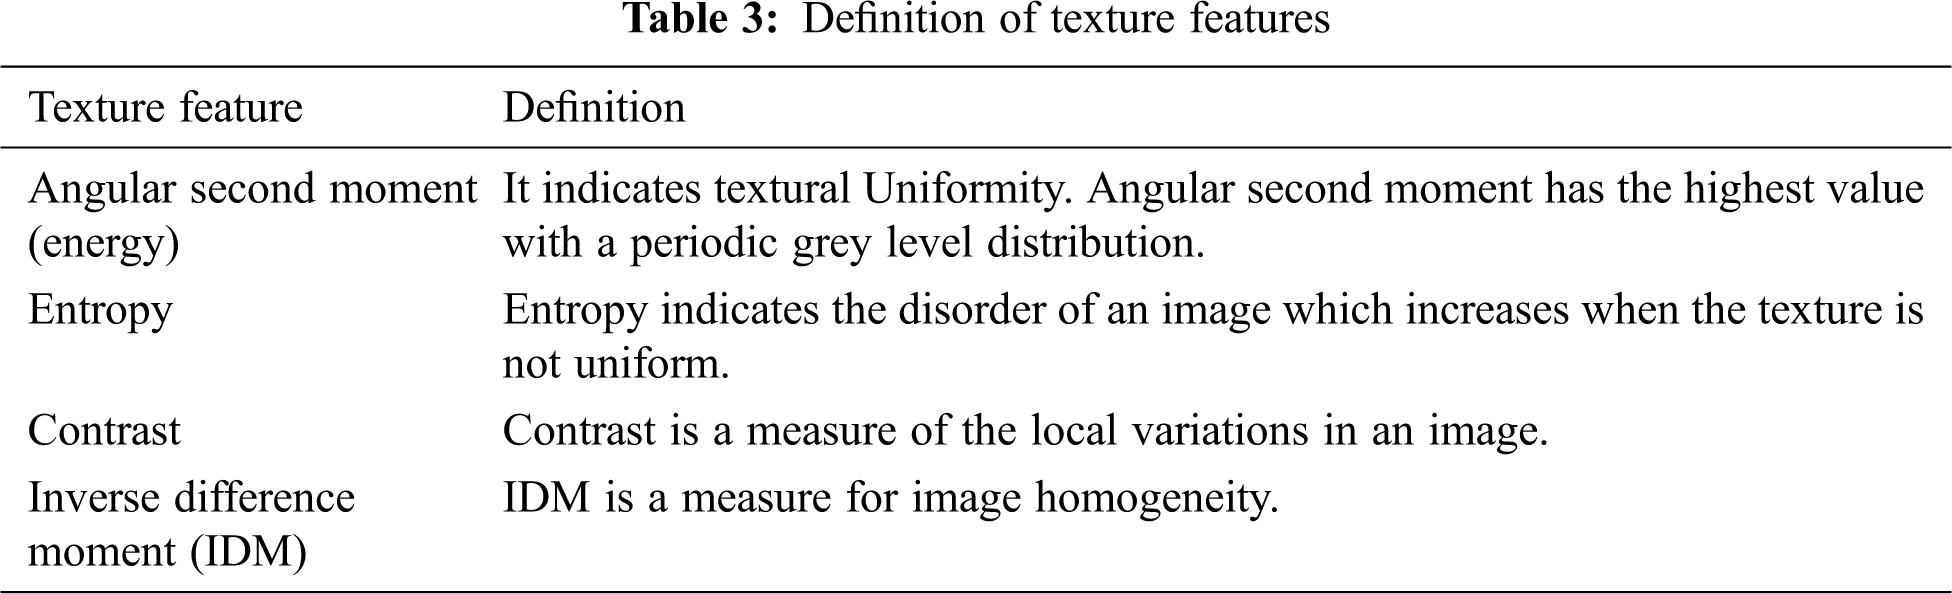
Texture is the main parameter to define the benign and cancer breast mass features and is the main early diagnosis aid for breast cancer. In this paper, we calculate Haralick texture features namely the Angular Second Moment (energy), Entropy, Contrast, Inverse Difference Moment and their average using the gray-level co-occurrence matrix.
The corresponding features are formulated as DF3 = [tx1, tx2, tx3, tx4, tx5]. Tab. 3 illustrates the definitions of the texture feature.
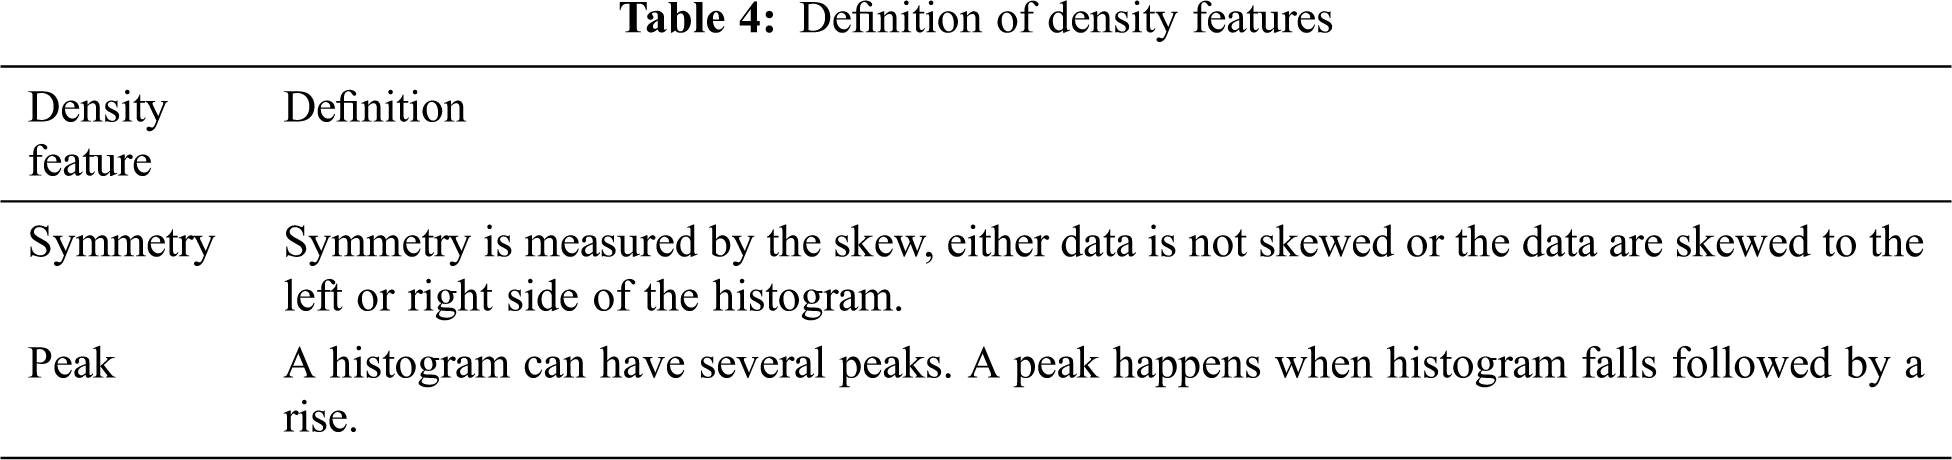
Breast mass density can identify the status of normal, benign or cancer characteristics [36,37]. In this research, many density features have been studied. The study leads to seven common features that are computed from the mammogram region of interest histogram. They are defined as: histogram mean, variance, Symmetry, and peak. The other features are extracted from the histogram gray density and they are variance, skew, and peak of the histogram gray density. These features are represented as expressed as DF4 = [d1, d2, …. d7].
The definitions of the density features are presented in Tab. 4.
Extensive experiments are performed to validate the Deep-CNN mass detection algorithm. The breast cancer detection algorithms fuse deep features with shape, density and texture features. In the next subsection, we are describing the experiment setup and evaluation procedures. We also introduce the experimental results that are done extensively.
The dataset utilized in this paper consists of 600 mammograms, 150 of them are normal tissues, 350 cancerous mass images and 150 benign. These images are included in the dataset DDSM: Digital Database for Screening Mammography [4]. The region of the breast masses of all mammograms are marked by the medical experts accompanied with diagnosis performed by pathologists.
We are presenting the experimental parameters setup and procedures in the following subsections. All experiments are performed on mammograms from the DDSM dataset [4].
The mass identification algorithm utilizes the Deep-CNN and the ELMC algorithm. We present both algorithms and compare them to the Marker-controlled lesion segmentation algorithm (WA) presented in [13] and the adaptive technique (ATT) presented in [14]. The comparison emphasis is the verification of the accuracy of these techniques.
The CNN parameters are described in Fig. 4 and in Tab. 1. The learning rate of the CNN experiments is 0.0025. The hidden neurons number is set to N = 1000.
4.2.2 Breast Cancer Detection Experiment
Breast cancer detection utilizes the shape, density and texture features of the tested masses using feature fusion. We performed experiments on single, double and multi-features. Single feature experiments include the features extracted from the CNN only. Double features experiments include one of the shape, density and texture features. Multi-features experiments include CNN features combined with several other shape, density and texture features. To compare our proposed method, we used the technique presented in Aličković et al. [24] (GARF) as it is considered one of the state of the art. We also combined our methodology with the SVM classifier to compare it to the ELMC classifier.
The detection metrics namely area under the curve, accuracy, sensitivity and specificity are utilized in our experiments. They are defined as follows:
where TP and TN are the numbers of correctly predicted positive and negative cases respectively. FP and FN are the numbers of incorrectly predicted positive and negative cases respectively.
The higher the value of accuracy (Eq. (2)), sensitivity (Eq. (3)) and specificity (Eq. (4)), the better the cancer detection is. We utilized the k-fold validation technique presented in [38].
In Tab. 5, the results of the experiments are illustrated. We listed the accuracy, sensitivity and specificity. We also listed the normal, benign and cancer breast mass classification accuracy. We illustrated the experiments due to different models, namely CNN alone with single, double and multiple fusion. As well as experiments with the model of CNN combined with ELMC clustering technique. Again we tested this combined model with single, double and multi feature fusion.
Performance of the classifier is measured by the AUC - ROC Curve, especially in multi-class classification, AUC presents the Area under the Curve and ROC presents the Receiver Operating Characteristics [25]. Classification model with an AUC near 1 indicates a good metric of separability. The higher the AUC the better is the classifier performance. AUC is a curve that plots the true positive rate against false positive rate. Fig. 5 illustrates the AUC for the first two models in Tab. 5 (CNN + single feature, and CNN combined with ELMC + single feature). Fig. 6 illustrates the AUC for the third and fourth models in Tab. 5 (CNN + double features, and CNN combined with ELMC + double features). Fig. 7 illustrates the AUC for the last model in Tab. 5 (CNN combined with ELMC + multi-feature for several combinations of shape, texture and density features). From The ROC curves it is established that models which combine the CNN with the ELMC clustering algorithm perform much better than models that adopt the CNN alone. Also, it is established that multi-feature fusion has higher ROC and hence better classification capabilities.
When the CNN is combined with the extreme learning machine clustering (ELMC) classifier, the performance of the CNN feature model is higher than The CNN alone model. Also, the CNN combined with the extreme learning machine clustering algorithm partnered with the feature fusion has the best accuracy in cancer detection, and it increases with increasing the number of the features used.
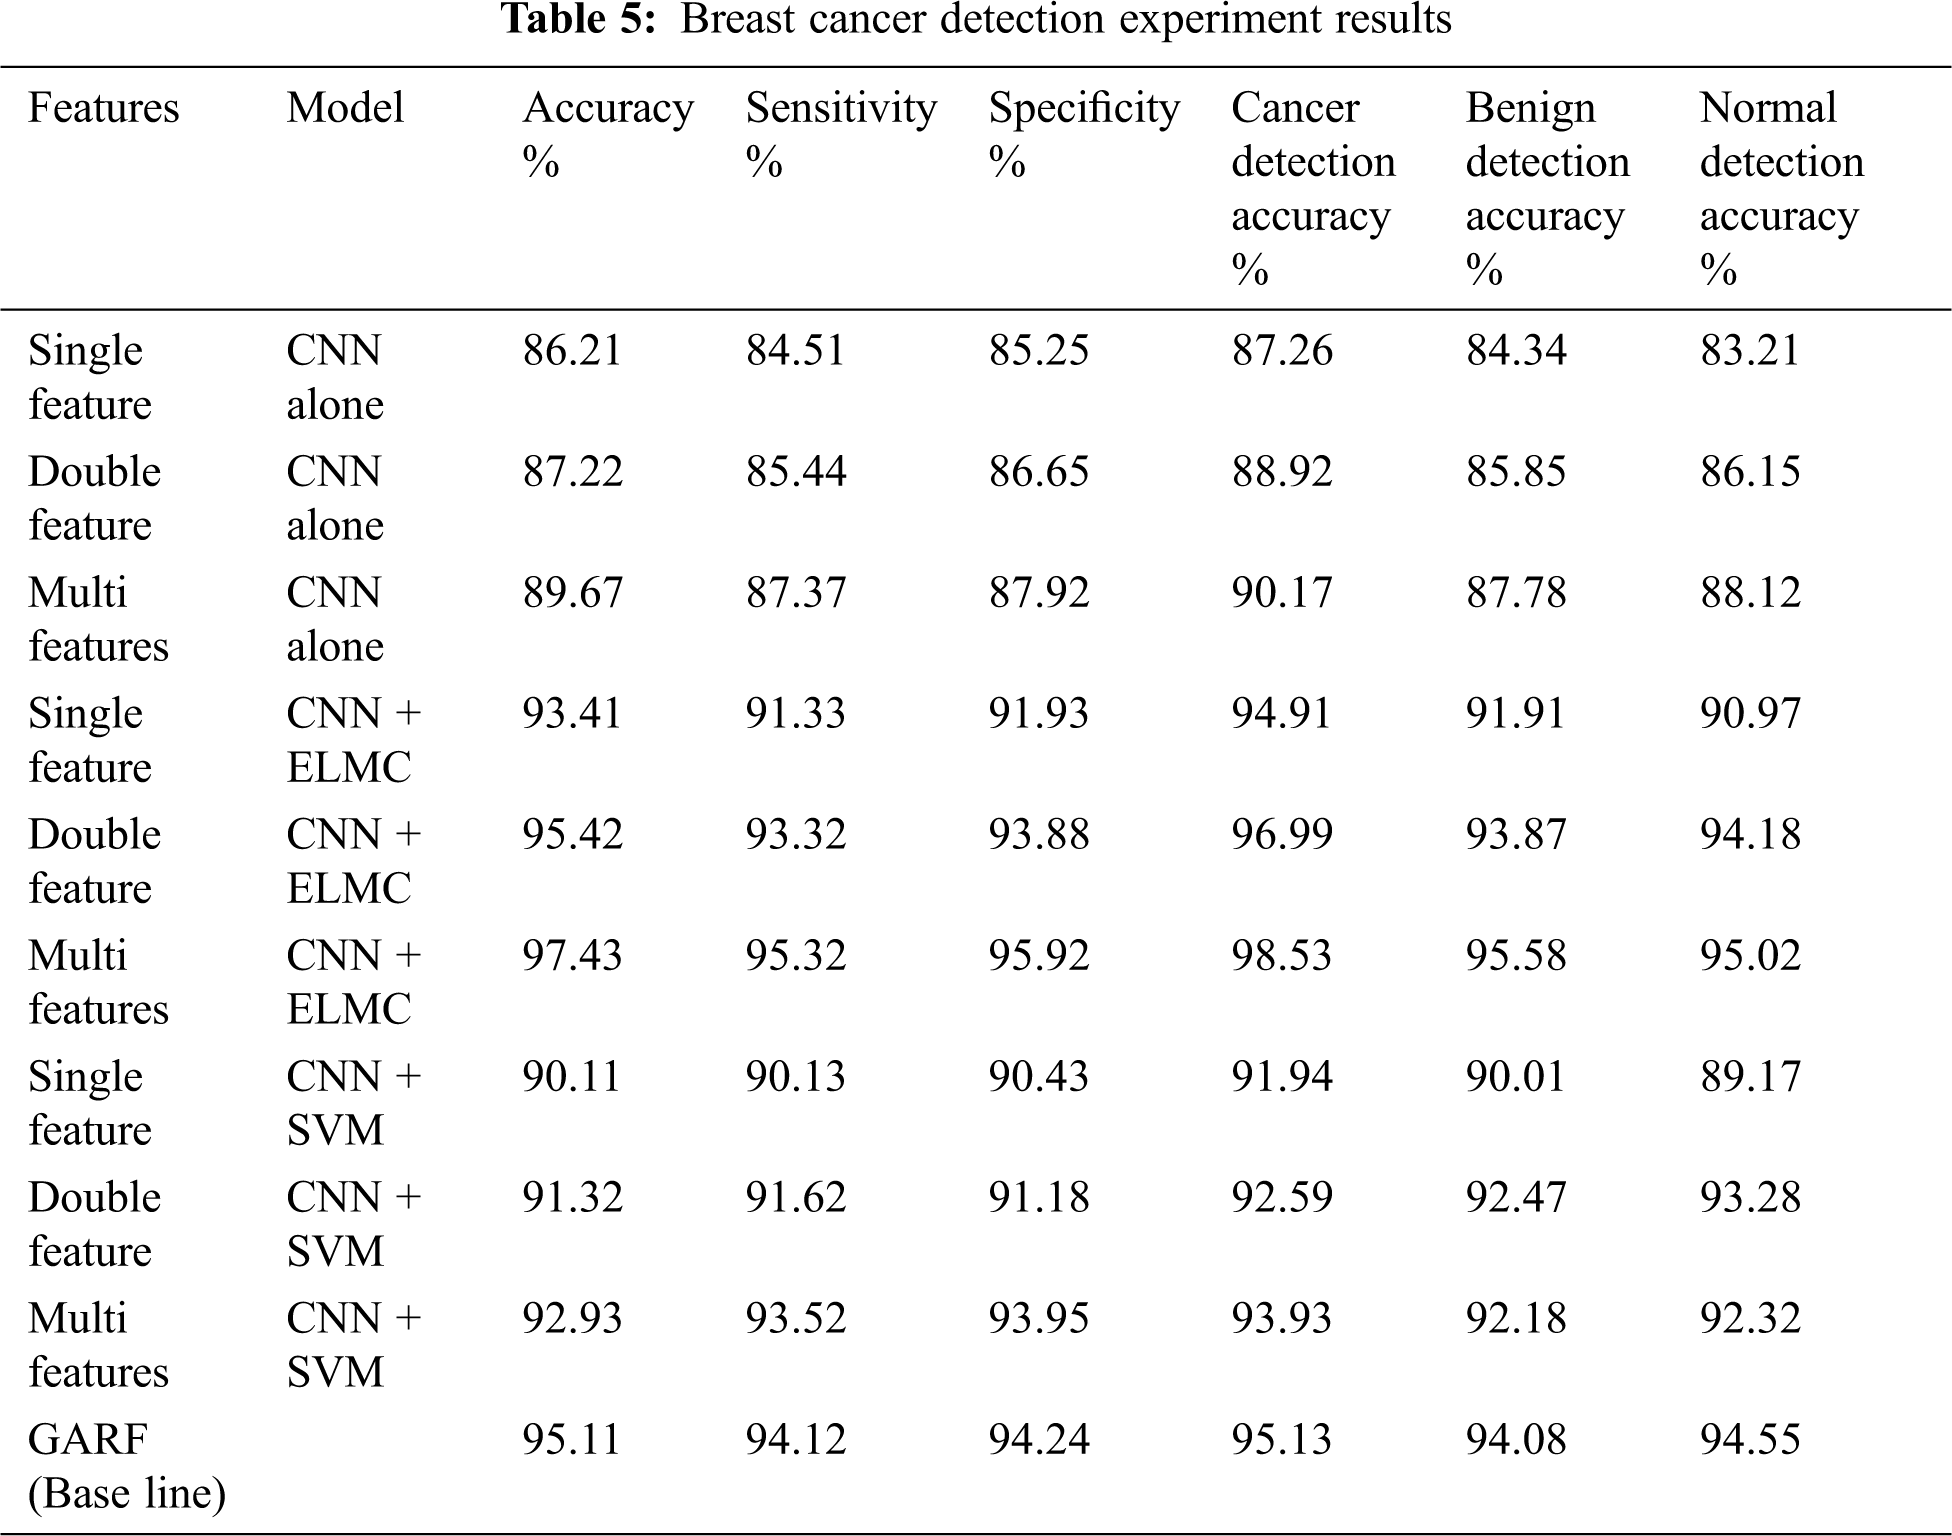

Figure 5: ROC curves of CNN with and without ELMC classifier for single feature

Figure 6: ROC curves of CNN with and without ELMC classifier for double features

Figure 7: ROC curves of CNN with ELMC classifier for multi-feature
This research presents a breast cancer detection model based on multi features fusion technique. Several features that are extracted from the CNN from the tested breast mass are combined with other features from the ELMC clustering algorithm for better classification. For mass detection and classification, the ELMC classifier is utilized following the CNN to identify the normal from the cancer masses. Several features are fused with the deep features extracted by the CNN architecture. The multi-feature set includes shape, texture, and density features. The choice of features and their number are the main contributors in enhancing the cancer detection accuracy. We coupled subjective features (shape, density and texture) with objective features extracted by CNN. The Sofomax is utilized to differentiate between normal and cancer masses. We utilized the ELMC clustering algorithm for better effect combined with a multi-feature set. Experiments on 600 cases of mammograms were carried and it demonstrated that the proposed method has higher performance than other existing methods. The CNN coupled with the Extreme Learning Machine Clustering algorithm achieves better accuracy than other state of the art methods. The false negative rate is also highly reduced when the ELMC algorithm is coupled with a multi-feature set. The model achieves 98.53% cancer detection accuracy, 95.6% benign detection accuracy and 95% for normal cases.
Funding Statement: This research was funded by the Deanship of Scientific Research at Princess Nourah bint Abdulrahman University through the Fast-track Research Funding Program.
Conflicts of Interest: The authors declare that they have no conflicts of interest to report regarding the present study.
1. R. Siegel, C. Desantis and A. Jemal, “Colorectal cancer statistics,” Cancer Journal of Clinicians, vol. 64, no. 2, pp. 104–117, 2014. [Google Scholar]
2. J. Harford, “Breast-cancer early detection in low-income and middle-income countries: Do what you can versus one size fits all,” Lancet Oncology, vol. 12, no. 3, pp. 306–312, 2011. [Google Scholar]
3. C. Lerman, M. Daly, C. Sands, A. Balshem, E. Lustbader et al., “Mammography adherence and psychological distress among women at risk for breast cancer,” JNCl Journal of National Cancer Institution, vol. 85, no. 13, pp. 1074–1080, 1993. [Google Scholar]
4. DDSM: Digital database for screening mammography,http://www.mammoimage.org/databases/. [Google Scholar]
5. M. Ertosun and D. Rubin, “Probabilistic visual search for masses within mammography images using deep learning,” in Proc. IEEE Int. Conf. of BioInformatics and Biomedics (BIBMParis, France, pp. 1310–1315, 2019. [Google Scholar]
6. S. Tzikopoulos, M. Mavroforakis and S. Theodoridis, “A fully automated scheme for mammographic segmentation and classification based on breast density and asymmetry,” Computing Methods Programs Biomedical, vol. 6, no. 1, pp. 47–63, 2020. [Google Scholar]
7. D. Pereira, R. Ramos and M. Nascimento, “Segmentation and detection of breast cancer in mammograms combining wavelet analysis and genetic algorithm,” Computing Methods Programs Biomedical, vol. 4, no. 1, pp. 88–101, 2019. [Google Scholar]
8. S. Taghanaki, J. Kawahara, B. Miles and G. Hamarneh, “Pareto-optimal multi-objective dimensionality reduction deep auto-encoder for mammography classification,” Computer Methods and Programs in Biomedicine, vol. 145, no. 4, pp. 85–93, 2017. [Google Scholar]
9. X. Chen and X. Lin, “Big data deep learning: Challenges and perspectives,” IEEE Access, vol. 2, pp. 514–525, 2014. [Google Scholar]
10. K. Ganesan, U. Acharya, C. Chua and K. Ng, “Computer-aided breast cancer detection using mammograms: A review,” IEEE Reviews in Biomedical Engineering, vol. 6, no. 1, pp. 77–98, 2013. [Google Scholar]
11. X. Sun, W. Qian and D. Song, “Ipsilateral-mammogram computer-aided detection of breast cancer,” Computerized Medical Imaging and Graphics, vol. 28, no. 3, pp. 151–158, 2004. [Google Scholar]
12. N. Saidin, U. Ngah, H. Sakim, N. Ding and L. Shuaib, “Density based breast segmentation for mammograms using graph cut and seed based region growing techniques,” in Proc. 22nd Int. Conf. of Computation Reasoning Development, London, England, 2019. [Google Scholar]
13. S. Xu, H. Liu and E. Song, “Marker-controlled watershed for lesion segmentation in mammograms,” Journal of Digital Imaging, vol. 24, no. 5, pp. 754–763, 2011. [Google Scholar]
14. K. Hu, X. Gao and F. Li, “Detection of suspicious lesions by adaptive thresholding based on multiresolution analysis in mammograms,” IEEE Transactions on Instrumentation and Measurements, vol. 60, no. 2, pp. 462–472, 2011. [Google Scholar]
15. M. Yap, G. Pons, J. Martí, S. Ganau, M. Sentís et al., “Automated breast ultrasound lesions detection using convolutional neural networks,” IEEE Journal of Biomedical and Health Informatics, vol. 22, no. 4, pp. 1218–1226, 2018. [Google Scholar]
16. K. Khan, L. Roberts, K. Shaffer and P. Haddawy, “Construction of a Bayesian network for mammographic diagnosis of breast cancer,” Computers in Biology and Medicine, vol. 27, no. 1, pp. 19–29, 1997. [Google Scholar]
17. Z. Wang, G. Yu, Y. Kang and Q. Qu, “Breast tumor detection in digital mammography based on extreme learning machine,” Neurocomputing, vol. 128, no. 3, pp. 175–184, 2014. [Google Scholar]
18. Y. Qiu, Y. Wang, S. Yan and M. Tan, “An initial investigation on developing a new method to predict short-term breast cancer risk based on deep learning technology,” in Proc. SPIE of Deep Learning In Medical field, Ostrava, CZ, pp. 97–105, 2016. [Google Scholar]
19. W. Sun, T. Tseng, B. Zheng and W. Qian, “A preliminary study on breast cancer risk analysis using deep neural networks,” in Proc. International Workshop on Breast Imaging, Cairo, Egypt, pp. 385–391, 2016. [Google Scholar]
20. Z. Jiao, X. Gao, Y. Wang and J. Li, “A deep feature-based framework for breast masses classification,” Neurocomputing, vol. 197, no. 2, pp. 221–231, 2016. [Google Scholar]
21. J. Arevalo, F. González, R. Pollán and M. Lopez, “Representation learning for mammography mass lesion classification with convolutional neural networks,” Computer Methods and Programs in Biomedicine, vol. 127, no. 3, pp. 248–257, 2016. [Google Scholar]
22. G. Carneiro, J. Nascimento and A. Bradley, “Automated analysis of unregistered multi-view mammograms with deep learning,” IEEE Transactions on Medical Imaging, vol. 36, no. 11, pp. 2355–2365, 2017. [Google Scholar]
23. Y. Kumar, A. Aggarwal, S. Tiwari and K. Singh, “An efficient and robust approach for biomedical image retrieval using Zernike moments,” Biomedical Signal Processing and Control, vol. 39, no. 2, pp. 459–473, 2018. [Google Scholar]
24. E. Aličković and A. Subasi, “Breast cancer diagnosis using GA feature selection and rotation forest,” Neural Computing and Applications, vol. 28, no. 4, pp. 753–763, 2017. [Google Scholar]
25. H. Cheng, J. Shan, W. Ju and L. Zhang, “Automated breast cancer detection and classification using ultrasound images: A survey,” Pattern Recognition, vol. 43, no. 1, pp. 299–317, 2010. [Google Scholar]
26. Y. Pathak, K. Arya and S. Tiwari, “Low-dose CT image reconstruction using gain intervention-based dictionary learning,” Modern Physics Letters B, vol. 32, no. 14, pp. 1850148, 2018. [Google Scholar]
27. S. Tiwari, “A variational framework for low-dose sinogram restoration,” International Journal of Biomedical Engineering, vol. 24, no. 4, pp. 356–367, 2017. [Google Scholar]
28. Z. Gao, Y. Li, Y. Sun, J. Yang, H. Xiong et al., “Motion tracking of the carotid artery wall from ultrasound image sequences: A nonlinear state-space approach,” IEEE Transactions on Medical Imaging, vol. 37, no. 1, pp. 273–283, 2018. [Google Scholar]
29. Z. Gao, H. Xiong, X. Lui, H. Zhang, D. Ghista et al., “Robust estimation of carotid artery wall motion using the elasticity-based state-space approach,” Medical Image Analysis, vol. 37, no. 6, pp. 1–21, 2017. [Google Scholar]
30. H. Ibrahim and N. Kong, “Brightness preserving dynamic histogram equalization for image contrast enhancement,” IEEE Transactions on Consumer Electronics, vol. 53, no. 4, pp. 1752–1758, 2007. [Google Scholar]
31. Q. Miao, R. Liu and E. Sun, “A semi-supervised image classification model based on improved ensemble projection algorithm,” IEEE Access, vol. 6, pp. 1372–1379, 2018. [Google Scholar]
32. H. Gan, Z. Li, Y. Fan and Z. Luo, “Dual learning-based safe semi-supervised learning,” IEEE Access, vol. 6, pp. 2615–2621, 2018. [Google Scholar]
33. G. Huang, S. Song, J. Gupta and C. Wu, “Semi-supervised and unsupervised extreme learning machines,” IEEE Transactions on Cybernetics, vol. 44, no. 12, pp. 2405–2417, 2014. [Google Scholar]
34. R. Samala, H. Chan, L. Hadjiiski and K. Cha, “Mass detection in digital breast tomosynthesis: Deep convolutional neural network with transfer learning from mammography,” Medical Physics, vol. 43, no. 12, pp. 6654–6666, 2016. [Google Scholar]
35. J. Tang, R. Rangayyan, J. Xu and Y. Yang, “Computer-aided detection and diagnosis of breast cancer with mammography: Recent advances,” IEEE Transactions on Information Technology in Biomedicine, vol. 13, no. 2, pp. 236–251, 2009. [Google Scholar]
36. G. Tourassi, B. Harrawood, S. Singh, J. Lo and C. Floyd, “Evaluation of information-theoretic similarity measures for content-based retrieval and detection of masses in mammograms,” Medical Physics, vol. 34, no. 1, pp. 140–150, 2007. [Google Scholar]
37. L. Liu, J. Wang and K. He, “Breast density classification using histogram moments of multiple resolution mammograms,” in Proc. Int. Conf. of Biomedical Engineering Informatics, New Delhi, India, pp. 146–149, 2020. [Google Scholar]
38. Q. Dai, “A competitive ensemble pruning approach based on cross-validation technique,” Knowledge-Based Systems, vol. 37, no. 2, pp. 394–414, 2013. [Google Scholar]
 | This work is licensed under a Creative Commons Attribution 4.0 International License, which permits unrestricted use, distribution, and reproduction in any medium, provided the original work is properly cited. |