DOI:10.32604/iasc.2022.020203
| Intelligent Automation & Soft Computing DOI:10.32604/iasc.2022.020203 | |
| Article |
Big Data Analytics with OENN Based Clinical Decision Support System
1Department of CSE, Acharya Nagarjuna University, Guntur, Andhra Pradesh, 522510, India
2MIT Art Design and Technology University, Pune, 412201, India
3Department of CSE, Gokaraju Rangaraju Institute of Engineering & Technology, Hyderabad, 500090, India
4Department of ECE, KITS, Warangal, 506015, India
5Department of CSE, South Point Group of Institutions, Sonepat, 131001, India
6School of Computer Science and Engineering, Lovely Professional University, Punjab, 144411, India
7Department of Computer Application, Shri Ramdeobaba College of Engineering and Management, Nagpur, India
*Corresponding Author: Kranthi Kumar Singamaneni. Email: dr.kksingamaneni@gmail.com
Received: 14 May 2021; Accepted: 08 July 2021
Abstract: In recent times, big data analytics using Machine Learning (ML) possesses several merits for assimilation and validation of massive quantity of complicated healthcare data. ML models are found to be scalable and flexible over conventional statistical tools, which makes them suitable for risk stratification, diagnosis, classification and survival prediction. In spite of these benefits, the utilization of ML in healthcare sector faces challenges which necessitate massive training data, data preprocessing, model training and parameter optimization based on the clinical problem. To resolve these issues, this paper presents new Big Data Analytics with Optimal Elman Neural network (BDA-OENN) for clinical decision support system. The focus of the BDA-OENN model is to design a diagnostic tool for Autism Spectral Disorder (ASD), which is a neurological illness related to communication, social skills and repetitive behaviors. The presented BDA-OENN model involves different stages of operations such as data preprocessing, synthetic data generation, classification and parameter optimization. For the generation of synthetic data, Synthetic Minority Over-sampling Technique (SMOTE) is used. Hadoop Ecosystem tool is employed to manage big data. Besides, the OENN model is used for classification process in which the optimal parameter setting of the ENN model by using Binary Grey Wolf Optimization (BGWO) algorithm. A detailed set of simulations were performed to highlight the improved performance of the BDA-OENN model. The resultant experimental values report the betterment of the BDA-OENN model over the other methods in terms of distinct performance measures. Ligent healthcare systems assists to make better decision, which further enables the patient to provide improved medical services. At the same time, skin lesion is a deadly disease that affects people of all age groups. Early, skin lesion segmentation and classification play a vital role in the precise diagnosis of skin cancer by intelligent system. But the automated diagnosis of skin lesions in dermoscopic images is a challenging process because of the problems such as artifacts (hair, gel bubble, ruler marker), blurry boundary, poor contrast and variable sizes and shapes of the lesion images. To address these problems, this study develops Intelligent Multi-Level Thresholding with Deep Learning (IMLT-DL) based skin lesion segmentation and classification model using dermoscopic images. Primarily, the presented IMLT-DL model incorporates the Top hat filtering and inpainting technique for the preprocessing of the dermoscopic images. In addition, the Mayfly Optimization (MFO) with multilevel Kapur's thresholding-based segmentation process is used to determine the affected region. Besides, Inception v3 based feature extractor is applied to derive the useful set of feature vectors. Finally, the classification process is carried out using a Gradient Boosting Tree (GBT) model. The performance of the presented model takes place against International Skin Imaging Collaboration (ISIC) dataset and the experimental outcome is inspected in distinct evaluation measures. The resultant experimental values ensure that the proposed IMLT-DL model outperforms the existing methods by achieving a higher accuracy of 99.2%.
Keywords: Intelligent models; computer aided diagnosis; skin lesion; artificial intelligence; deep learning
In recent times, big data in healthcare field have been developed significantly with useful datasets that are highly complex and massive. In medical field, the size of the information qualifies the big data. Several limitations are existing like heterogeneity, speed and variation of information in healthcare [1,2]. With the features of versatility, connectivity and diversity of data gathering devices, the information which creates high data rate and decision must be in real world for sustaining with the standard growth of techniques. The data source in healthcare could be either qualitative (for example demographics, free text) or quantitative (for example lab reports, gene arrays, images and sensor data). The main aim of the data problem is to give a basis for monitoring proof to respond to medical queries. The standard concept of the main features of big data consists of three V’s namely Volume, Velocity and Variety. In few conditions, several features are also involved such as Value, Variability and Veracity. The approach of big data and extensive utilization of electronic health records of people allows continuous results for population health problems before it becomes difficult [3,4]. Rather than generalizing the data attained from a smaller amount of instances to create inferences regarding population, it could utilize medical information at the population level to give a real-time image. Examining the original information among larger group of persons is an essential modification from traditional bio-statistics that concentrates on reducing the impact of entire type. Though randomly controllable trial remains the benchmark to establish and monitor the efficiency of the drugs at the population level, might involve real time aspects like drug compliance, gives an improved method of actual efficiency of the drug. ML is a kind of Artificial Intelligence (AI) that contains algorithmic approaches which allow machinery to resolve difficulties without particular computer programming [5]. The AI method is utilized broadly in the research and conventional network to define a wide variety of significant applications, like digital personal assistants, personalization of customer products and self-driving vehicles. Although AI method has gained more interest in healthcare and other areas, the significance of self-learning and continuous evolving ML technique has to be moderated towards the problems in executing these tools in medical practice. Mostly, the medical ML tools depend upon supervised learning approaches, where information is categorized into predefined classifications. The bar for accuracy and efficiency of medical ML tools are structured by medicinal devices. In contrast, a medicinal device is an exclusive feature of AI method has the capacity to enhance novel information. This procedure is named incremental learning, where the resultant information from a trained AI method is combined with closed data feedback loop and utilized to improve the prediction accuracy by Retraining Iteration method [6]. This feature identifies the trained Neural Networks (NN) from standardized software/immutable scoring methods. This paper presents a new Big Data Analytics with Optimal Elman Neural network (BDA-OENN) for clinical decision support systems. The proposed BDA-OENN model intends to diagnose the neurological disorder called ASD. Primarily, data preprocessing is applied for enhancing the data quality to certain extent. For the generation of synthetic data, Synthetic Minority Over-sampling Technique (SMOTE) is used. Inorder to handle big healthcare data, Hadoop Ecosystem tool is used. In addition, the OENN model is employed for classification of process in which the optimal parameter setting of the ENN model takes place using Binary Grey Wolf Optimization (BGWO) algorithm. Extensive experimental analysis is carried out to ensure that the classification performance of the BDA-OENN model on the applied ASD dataset.
2 Background Information and Related Works
Autism Spectrum Disorder (ASD) is a neuro developing disease categorized by pervasive defects in diverse interests, functions, repeated behavior and social communication. The conventional ideas are related to distinct ailments such as genetic disintegrative disorder, Asperger’s ailments and autistic infection [7]. In recent times, ASD is considered as an separate disorder with severity level that fails to remain in last version of Diagnostic and Statistical Manual of Mental Disorder (DSM-5). The changes over the dimensional approach will lead expert doctors using standardized diagnostic tools distinguishing the symptoms of DSM-IV disorders [8]. Furthermore, DSM-5 consists of reports from starting stage and co-occurring conditions. It is altered to ASD diagnostic conditions that facilitates the classification of the sub types of ASD [9]. As presented by latest diagnostic application, ASD is the most heterogeneous infection. The symptoms of ASD are language disability, alternative skills and developing applications (like executive performance and adaptive skills) [10] that vary in higher values among the tested people. Subsequently, initial stage of symptoms differs from each other, which demonstrates latency or plateaus in deployment and regression of traditionally acquired accomplishments. In recent times, the researchers focuses on distinct statistical and heuristics methods to examine and comprehend the methods for diagnosing and retrieving the data from ASD. In this method, Machine Learning (ML) is the most effective method utilized to examine the difficult concept [11]. Therefore, ML technique is employed to implement binomial classification process to detect the feature that predicts the infection. Only few mechanisms focuses on Autism Detection Analysis.
2.2 Prior Works on Big Data Analytics in Healthcare
Wall et al. [12] employed computational intelligence for diagnosing heart disease using ML, optimization and fuzzy-logic techniques. Besides, the BDA tool is used along with the IoMT environment. Amos et al. [13] developed a Disease Diagnosis and Treatment Recommendation System (DDTRS) for increasing the exploitation of the recent medical technologies and aid professionals. The Density Peaked Clustering Analysis (DPCA) is employed to detect the symptoms of the disease properly and Apriori algorithm is also applied. Jianguo et al. [14] examines Coronary Heart Disease (CHD) in the big data environment and mathematically modeled the clinical symptoms with the CHD kinds for predictive analysis. Besides, Hadoop tool is applied for the construction of big data environment for data analysis. Along with this, Back Propagation Neural Network (BPNN) and Naive Bayesian technique are applied for CHD diagnosis. Letian et al. [15] designed a heart disease diagnosis model for the prediction process using the Firefly—Binary Cuckoo Search (FFBCS) technique. Munir et al. [16] emphasis on the patient detection process by the use of big data and Fuzzy Logic, that is obtained by using fuzzy process. Prableen et al. [17] projected an effective smart and secure healthcare information system by the use of ML and latest security framework for handling big healthcare data. Karthikeyan et al. [18] developed a new Optimal Artificial Neural Network (OANN) to diagnose heart diseases in big data environment. It includes an outlier detection technique with Teaching and Learning Based Optimization (TLBO)-ANN model.
The workflow of BDA-OENN model is illustrated in Fig. 1. The figure demonstrates that the medical data is initially preprocessed in three different ways such as data transformation, class labeling and min-max based data normalization. Then, the preprocessed data is fed into the SMOTE technique for the generation of big healthcare data. Followed by, the big data is analyzed in the Hadoop Ecosystem environment, where the actual classification process is executed. It is simple for the Elman Neural Network weights to fall into a minimum since they are updated using the gradient descent approach, same as the BP neural network is utilized. Elman neural network is a feedback neural network in which an additional connecting layer is added to the hidden layer of the feedforward network in order to memorize and to produce more global stability. Finally, the OENN based classification model is applied to determine the class labels and the parameter tuning of OENN model takes place using the BGWO algorithm.

Figure 1: Overall working process of BDA-OENN model
To manage the Big Data, Hadoop Eco-system and its components are extremely utilized. In a shared platform, Hadoop is a type of open source framework, which allows the stakeholders to process and save the Big-Data on computer cluster by using simpler programming methods. Over 1000 nodes from an individual server is demonstrated to include fault tolerance and enhanced scalability. The three major components of Hadoop are (i) Hadoop YARN (ii) MapReduce and (iii) Hadoop Distributed File System (HDFS).
3.1.1 Hadoop Distributed File System (HDFS)
According to Google File System (GFS), the HDFS is exhibited. It is demonstrated as slave or master architecture where the master has more than 1 data node that is known as actual data and a different name node that is known as metadata.
To provide massive adaptability on 1000 Hadoop clusters, Hadoop Map Reduce is utilized and it is the programming architecture at Apache Hadoop heart. For processing huge data on massive clusters, MapReduce is utilized. MapReduce in task processing is comprised of two significant phases such as Map and Reduce stage. Both the phases comprises of pair such as input and output which is the keyvalue especially, in file system where both input and output of the task are stored. The framework handles failed controlling, task re-execution and task scheduling. The framework of MapReduce comprises of single slave node manager and one master resource manager for entire cluster nodes.
Hadoop YARN method is utilized to manage cluster. From the knowledge gained at initial Hadoop generation, it is demonstrated as a secondary Hadoop generation that performs as the major feature. On Hadoop cluster for providing data governance tools, safety and consistent process, YARN performs as a central architecture and resource manager. In dealing with Big Data, the other framework components and tools may be installed on the Hadoop framework.
3.2 SMOTE Based Data Generation
The SMOTE technique is used to synthesize the input medical data into massive amount of big data. SMOTE is an oversampling method presented by Chawla et al. [19] and functions in feature space instead of data space. The goal of SMOTE is to create synthetic data as we track the nearest neighbours of the minority class “k”. The term minority class refers to each of the minority class's nearest neighbours “k” where “k” is determined (by default) and then synthetic data is created by starting with each pair of points generated by the sample and its nearest neighbours and iterating. From this method, the instance counts for the minority class in the actual dataset is raised by generating novel synthetic samples, that leads to broader decision areas of the minority class, when naive oversampling by replacing cause the decision area of the minority class that should be accurate. The novel synthetic instance is determined by two variables such as oversampling rate (%) and the amount of nearest neighbor (k).
where

Figure 2: Flowchart of SMOTE algorithm
Fig. 2 illustrates the flowchart of SMOTE algorithm. The three steps mentioned above are repeated for nine times. As every time a novel synthetic sample is generated, most of the 5 nearest neighbors of
3.3 ENN Based Medical Data Classification
Once the synthesized data has been generated, the ENN model is applied for classification of medical data. The ENN presented by Xiaobo et al. [21] is a dynamic recurrent network. On comparing with the classical BPNN, the ENN has the special layer known as context layer that creates the network having the capability to learn time-varying patterns. Therefore, the ENN is most appropriate for classification problems. An architecture of ENN is demonstrated in Fig. 3 [22]. Neglecting the context layer, the remaining part is assumed as the standard multilayer network. The context layer comes from the outcome of hidden layer. Further, the result of context layer is given as input back to hidden layer along with next group of external input layer data. The data of prior time is saved and reprocessed by this feature.

Figure 3: Structure of ENN
The ENN has
with
The input of hidden layer is comprised of 2 parts that are external and context input, given by
The aim of this network in minimizing the error can be given by:
To reduce
At this point,
3.4 BGWO Based Parameter Optimization
In order to tune the performance of the ENN model, the parameter optimization is carried out using the BGWO algorithm. GWO is the recently developed metaheuristic algorithm derived from hunting nature of grey wolves. Generally, the wolves live in a group of 5–12 members. It is inspired by hunting and searching prey characteristics of grey wolves. The wolves in GWO is separated as
where
where
where
where
where
where
where
where
where
where
where
where
where
where
where
where
where
where
This section validates the ASD diagnostic performance of the BDA-OENN model on three benchmark datasets namely ASD-Children Dataset, ASD-Adolescent Dataset and ASD-Adult Dataset. The details related to the dataset are provided in Tab. 1 and the attribute details are given in Tab. 2.


Tab. 3 and Figs. 5a–5e illustrates the classification result analysis of the BDA-OENN model with OENN model (without SMOTE based synthetic data generation). From the result obtained, it is clear that the BDA-OENN method has attained better ASD diagnostic outcome. The ASD-Children dataset in the OENN model has obtained a sensitivity of 98.13%, specificity of 98.65%, accuracy of 98.17%, F-score of 98.25% and kappa of 98.02%. Followed by, the ASD-Adolescent dataset in the OENN method has achieved a sensitivity, specificity, accuracy, F-score and kappa of 96.47%, 98.94%, 97.86%, 96.90% and 97.36% respectively.

The ASD-Adult dataset in the OENN approach has reached a sensitivity, specificity, accuracy, F-score and kappa of 97.43%, 98.21%, 97.94%, 97.80% and 97.21% respectively while the ASD-Children dataset in the BDA-OENN model has obtained sensitivity, specificity, accuracy, F-score and kappa of 98.83%, 98.90%, 98.89%, 98.65% and 98.42% respectively. Meanwhile, the ASD-Adolescent dataset in the BDA-OENN model has obtained sensitivity, specificity, accuracy, F-score and kappa of 97.21%, 99.10%, 98.43%, 98.12% and 98.23% respectively. In the same way, the ASD-Adult dataset in the BDA-OENN technique has attained a sensitivity, specificity, accuracy, F-score and kappa of 98.89%, 99.34%, 98.95%, 98.86% and 98.67% respectively.
A detailed comparative result analysis of the proposed BDA-OENN model takes place with other existing techniques in Tab. 4 [26–29].
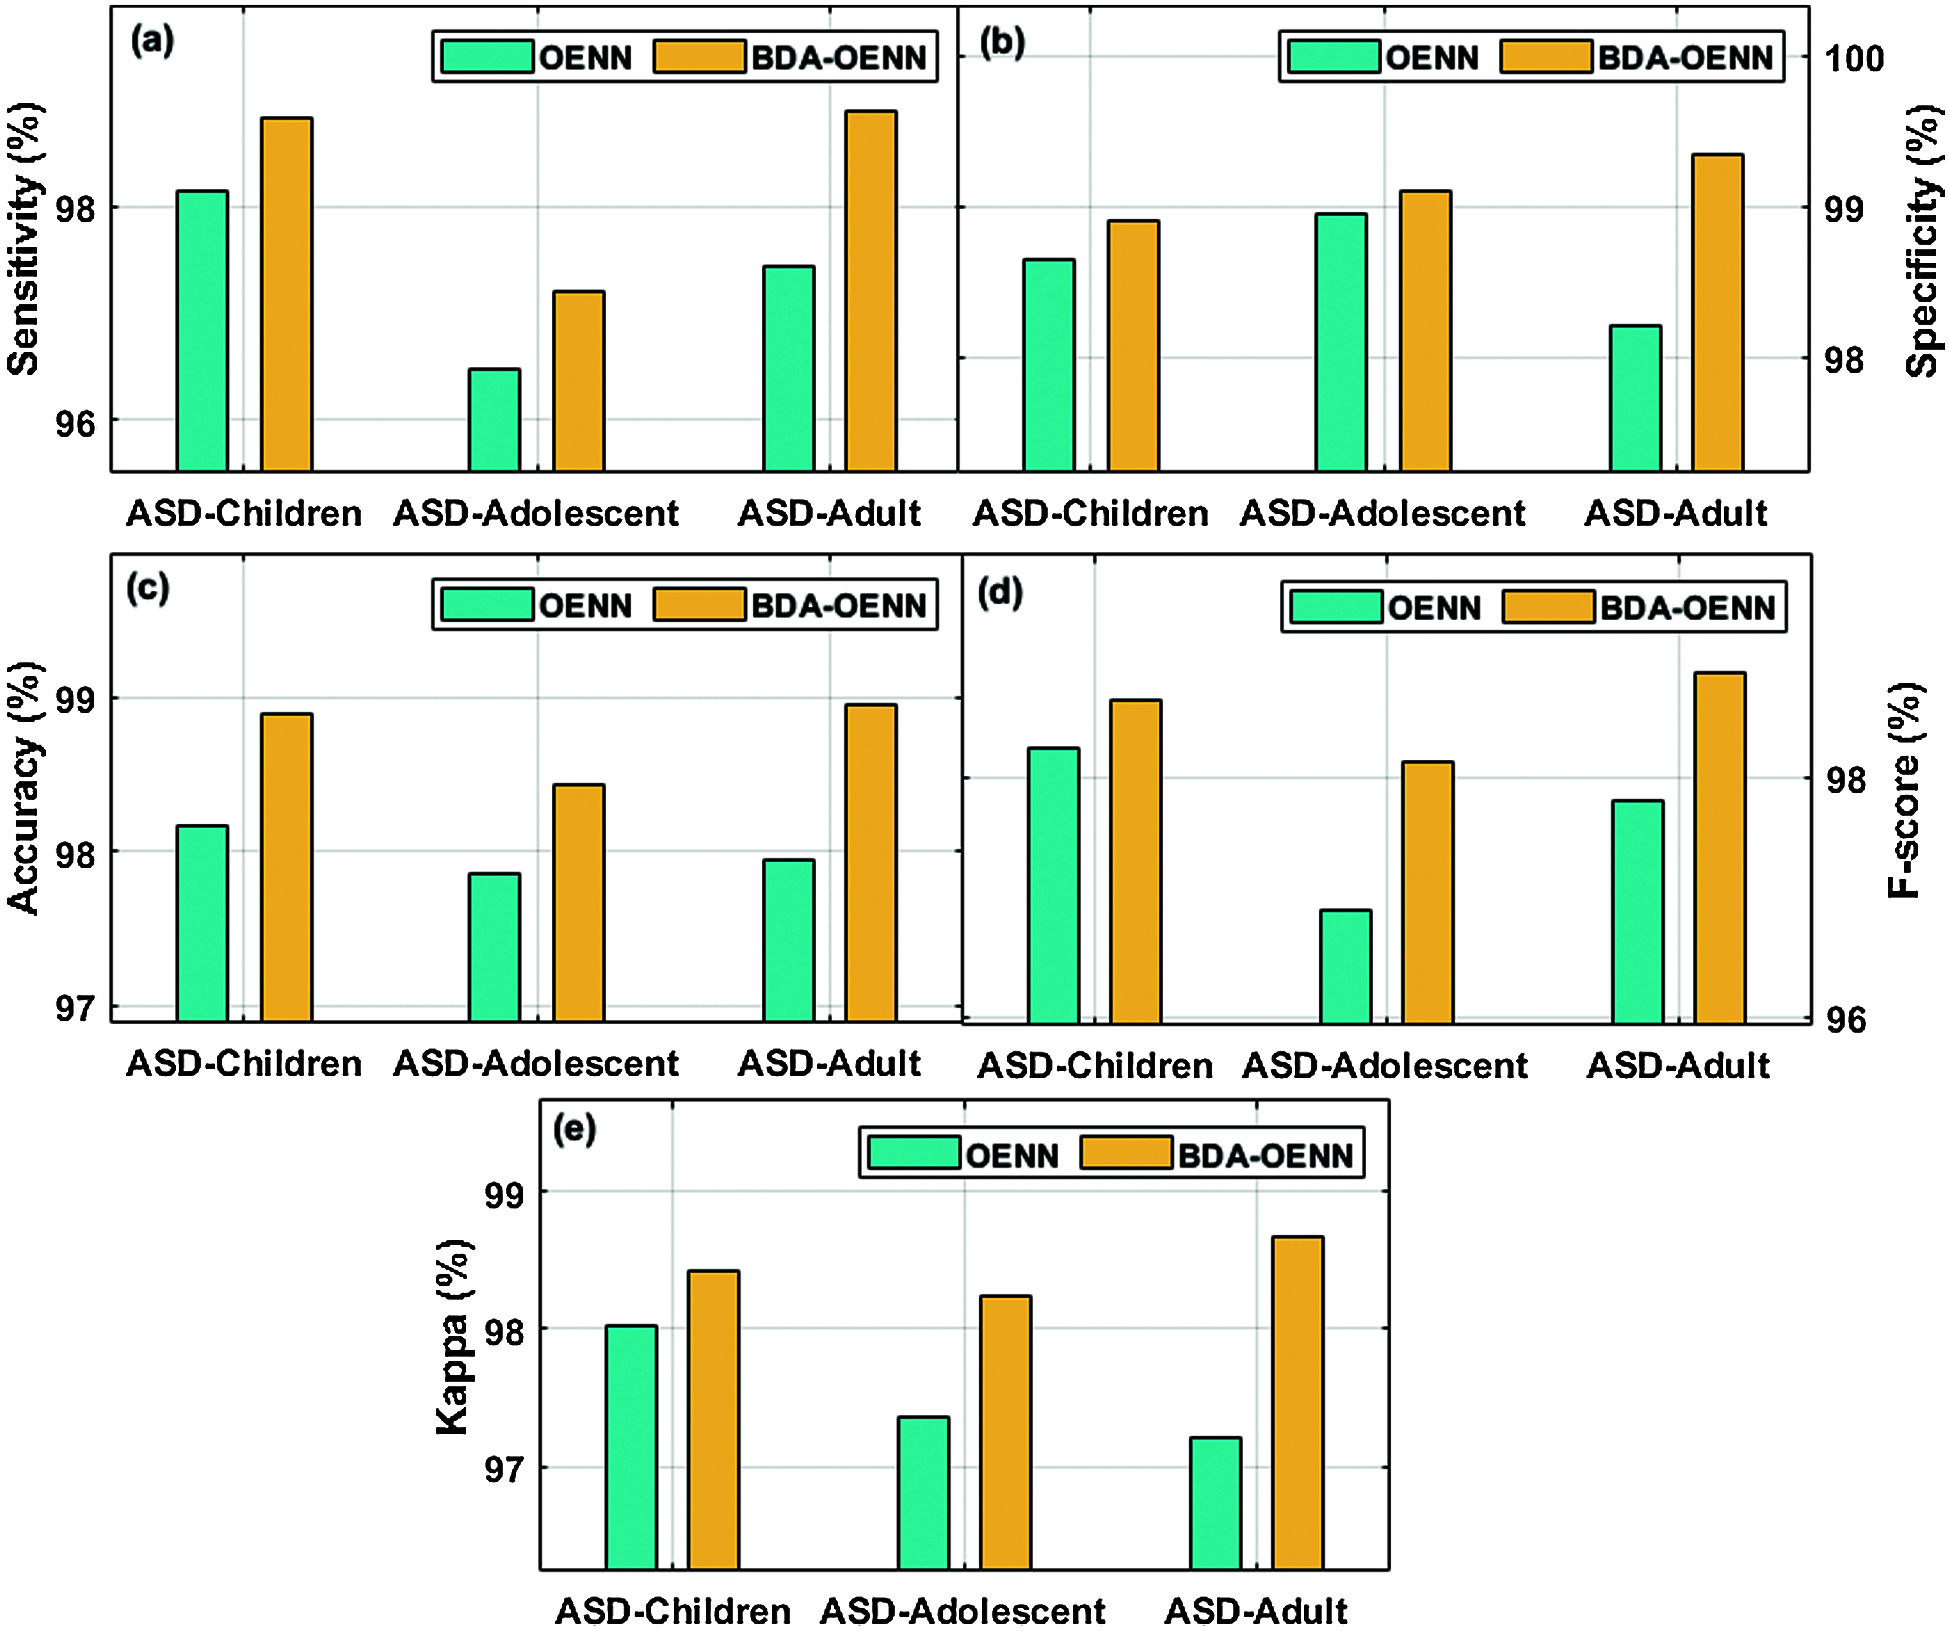
Figure 4: Result analysis of BDA-OENN model

Fig. 5 investigates the accuracy analysis of the BDA-OENN model with existing methods on the applied ASD dataset. The figure shows that the DT model has produced poor result with an accuracy of 54.7% whereas the LR model displays slightly higher accuracy of 59.1%. The SVM (liner model) shows increased accuracy of 61.8%. Followed by, the K-Nearest Neighbor, NN, Opto. RF, Opto. LR and Opt. KNN model has accomplished moderate accuracy values. Eventually, a manageable accuracy of 80.71% has been attained by the RF-CART technique. The QODF-DSAN model results with a significant accuracy of 97.6%. But the proposed OENN and BDA-OENN models have outperformed the existing methods by attaining maximum accuracy values. In particular, the BDA-OENN model has resulted in a maximum accuracy of 98.95% on the applied ASD-Adult dataset.
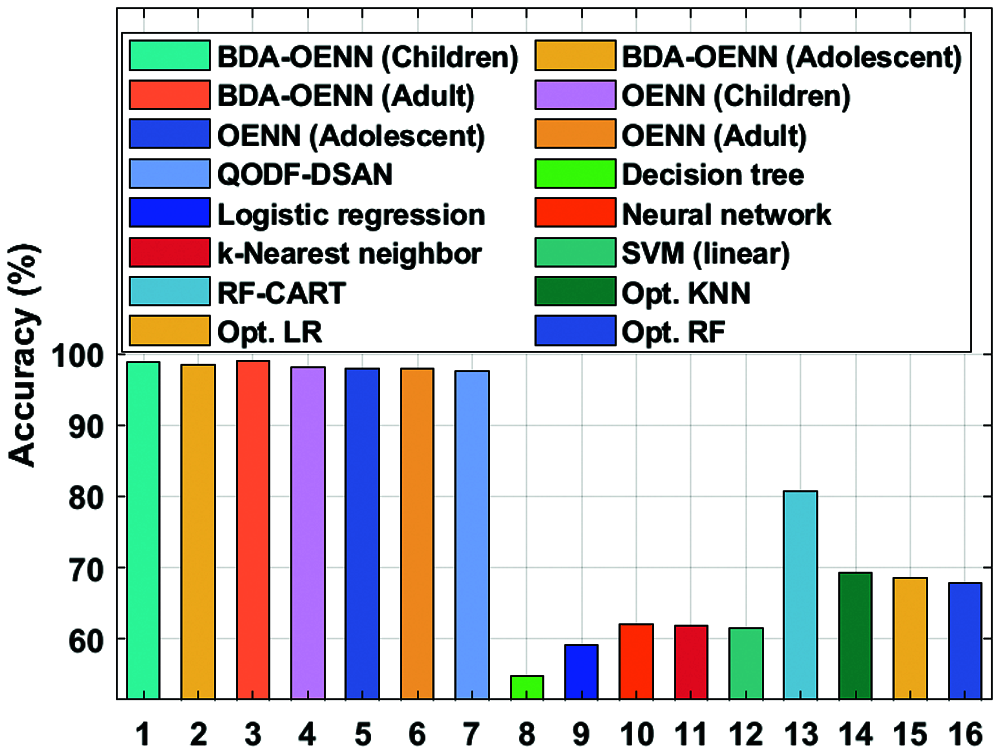
Figure 5: Accuracy analysis of BDA-OENN model
Fig. 6 examines the sensitivity and specificity analysis of the BDA-OENN technique with existing models on the applied ASD dataset. The figure shows that the k-Nearest neighbor model has produced poor results with the sensitivity of 46.6% and specificity of 72.1% whereas the DT model displays slightly higher sensitivity of 53.3% and specificity of 54.9%.The NN model has exhibited increased sensitivity of 53.3% and specificity of 71.2%. Followed by, the LR and SVM (linear) approaches have accomplished moderate sensitivity and specificity values. Eventually, a manageable sensitivity of 82.06% and specificity of 77.02% are attained by the RF-CART technique. The QODF-DSAN method has attained a significant sensitivity of 97.86% and specificity of 97.37%. But the proposed OENN and BDA-OENN models have outperformed the existing methods by attaining higher sensitivity and specificity values. Particularly, the BDA-OENN model has resulted in a maximal sensitivity of 98.89% and specificity of 99.34% on the applied ASD-Adult dataset.
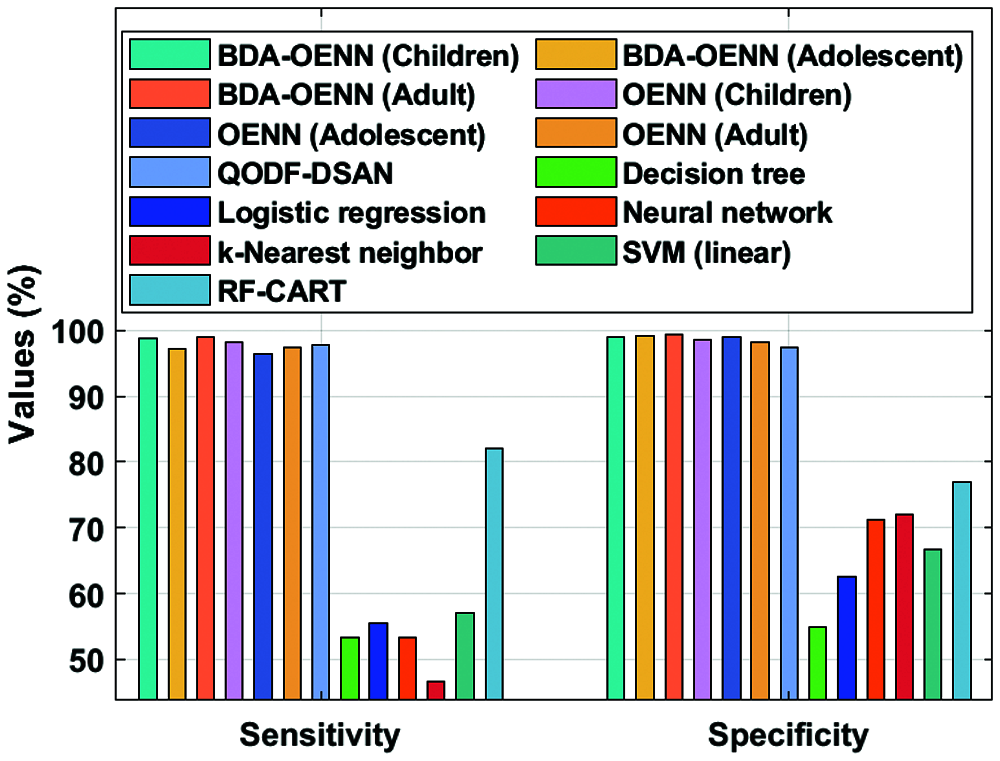
Figure 6: Sensitivity and specificity analysis of BDA-OENN model
Fig. 7 determines the F-score and kappa analysis of the BDA-OENN model with existing methods on the applied ASD dataset. The figure shows that the QODF-DSAN model has illustrated poor outcome with the F-score of 97.51% and kappa of 95.19% whereas the OENN (Adolescent) model has outperformed even increased F-score of 97.8% and kappa of 97.21%. Followed by, the OENN (Children) model has accomplished moderate F-score of 98.25% and kappa of 98.02%. Eventually, a manageable F-score of 98.12% and kappa of 98.23% has been offered by the BDA-OENN (Adolescent) technique. Followed by, the BDA-OENN (Children) technique has attained a significant F-score of 98.65% and kappa of 98.42%. The BDA-OENN technique has resulted in a higher F-score of 98.86% and kappa of 98.67% on the applied ASD-Adult dataset.
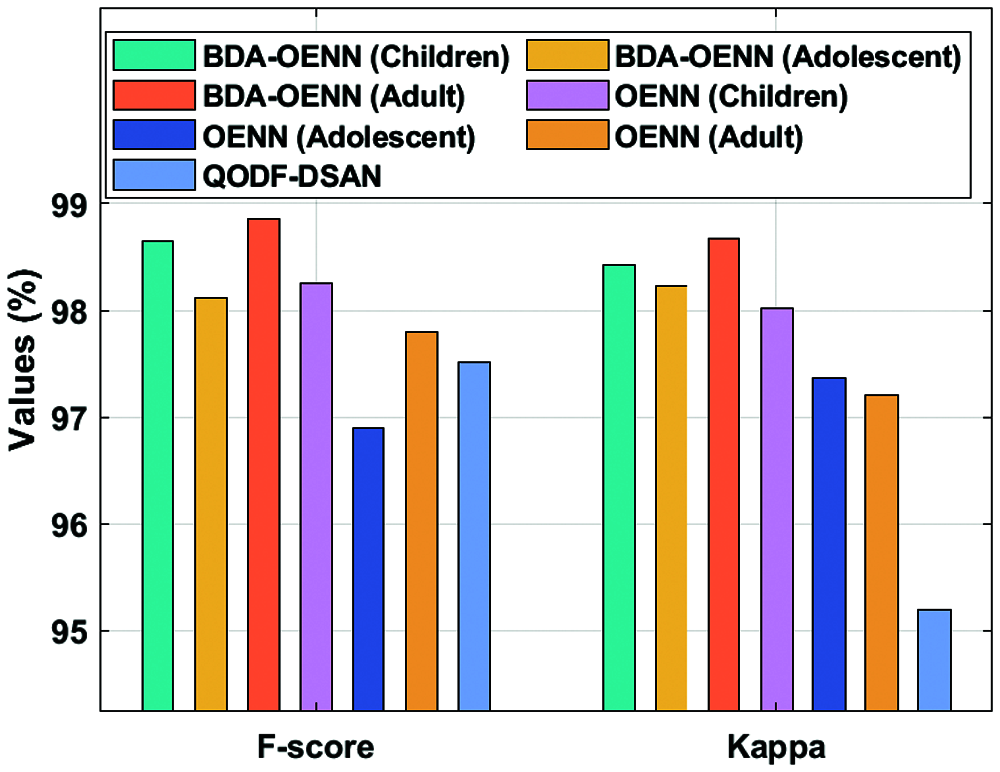
Figure 7: F-score and Kappa analysis of BDA-OENN model
This paper develops an effective BDA-OENN model for clinical decision support systems to diagnose ASD accurately. The presented BDA-OENN model involves different stages of operations such as data preprocessing, synthetic data generation, classification and parameter optimization. The medical data is firstly preprocessed in three diverse ways such as data transformation, class labeling and min-max based data normalization. Next, the preprocessed data is fed into the SMOTE technique to create big healthcare data. Followed by, the big data is analyzed in the Hadoop Ecosystem environment, where the actual classification process gets executed. Lastly, the OENN based classification model is applied to determine the class labels and the parameter tuning of OENN model takes place using the BGWO algorithm. Extensive experimental analysis is carried out to ensure the classification performance of the BDA-OENN model on the applied ASD dataset. The experimental values obtained results in the betterment of the BDA-OENN model over the other methods in terms of distinct performance measures. The BDA-OENN model has resulted in a maximal sensitivity of 98.89% and specificity of 99.34% on the applied ASD-Adult dataset. BDA-OENN (Children) technique results in a significant F-score of 98.65% and kappa of 98.42%. But, the BDA-OENN technique results in a higher F-score of 98.86% and kappa of 98.67% on the applied ASD-Adult dataset. In future, the performance of the proposed BDA-OENN method is extended further for social media information by dimensionality reduction and clustering techniques. Applying different machine learning algorithm to reduce time complexity to improve the performance of BDA-OENN.
Funding Statement: The authors received no specific funding for this study.
Conflicts of Interest: The authors declare that they have no conflicts of interest regarding the present study.
1. K. Y. Ngiam and I. W. Khor, “Big data and machine learning algorithms for health-care delivery,” The Lancet Oncology, vol. 20, no. 5, pp. 262–273, 2019. [Google Scholar]
2. S. Neelakandan, S. Divyabharathi, S. Rahini and G. Vijayalakshmi, “Large scale optimization to minimize network traffic using MapReduce in big data applications,” in IEEE Int. Conf. on Computation of Power, Energy Information and Communication (ICCPEICChennai, India, pp. 193–199, 2016. [Google Scholar]
3. C. Saravana Kumar, “An authentication technique for accessing de-duplicated data from private cloud using one time password,” International Journal of Information Security and Privacy, vol. 11, no. 2, pp. 1–10, 2017. [Google Scholar]
4. B. Karthikeyan and T. Sasikala, “Key exchange techniques based on secured energy efficiency in mobile cloud computing,” Applied Mathematics & Information Sciences, vol. 13, no. 6, pp. 1039–1045, 2019. [Google Scholar]
5. D. Paulraj, “A gradient boosted decision tree-based sentiment classification of twitter data,” International Journal of Wavelets, Multiresolution and Information Processing, World Scientific, vol. 18, no. 4, pp. 2050271-21, 2020. [Google Scholar]
6. C. Ramalingam, “Addressing semantics standards for cloud portability and interoperability in multi cloud environment,” Symmetry, vol. 13, no. 2, pp. 317, 2021. [Google Scholar]
7. A. Gepperth and B. Hammer, “Incremental learning algorithms and applications,” in European Sym. on Artificial Neural Networks (ESANNBruges, Belgium. ffhal-01418129, 2016. [Google Scholar]
8. American Psychiatric Association, “Diagnostic and statistical man,” American Journal of Psychiatry, vol. 167, pp. 312–320, 2000. [Google Scholar]
9. C. Lord, E. Petkova, V. Hus, W. Gan, F. Lu et al., “A multisite study of the clinical diagnosis of different autism spectrum disorders,” Archives of General Psychiatry, vol. 69, no. 3, pp. 306–313, 2012. [Google Scholar]
10. R. Grzadzinski, M. Huerta and C. Lord, “DSM-5 and autism spectrum disorders (ASDsAn opportunity for identifying ASD subtypes,” Molecular Autism, vol. 4, no. 1, pp. 1–6, 2013. [Google Scholar]
11. S. M. Kanne, A. J. Gerber, L. M. Quirmbach, S. S. Sparrow, D. V. Cicchetti et al., “The role of adaptive behavior in autism spectrum disorders: Implications for functional outcome,” Journal of Autism and Developmental Disorders, vol. 41, no. 8, pp. 1007–1018, 2011. [Google Scholar]
12. D. P. Wall, J. Kosmicki, T. F. Deluca, E. Harstad and V. A. Fusaro, “Use of machine learning to shorten observation-based screening and diagnosis of autism,” Translational Psychiatry, vol. 2, no. 4, pp. 100, 2012. [Google Scholar]
13. O. B. Amos, C. A. Oluwakemi, A. M. Hammed, A. S. Shakirat, D. O. Idow et al., “Application of computational intelligence models in IOMT big data for heart disease diagnosis in personalized health care,” in Cognitive Data Science in Sustainable Computing, Intelligent IoT Systems in Personalized Health Care. Academic Press, vol. 3, no. 2, pp. 177–206, 2021. [Google Scholar]
14. C. Jianguo, L. Kenli, R. Huigui, B. Kashif, Y. Nan et al., “A disease diagnosis and treatment recommendation system based on big data mining and cloud computing,” Information Sciences, vol. 435, no. 1, pp. 124–149, 2018. [Google Scholar]
15. W. Letian, L. Han, L. Zhang and S. Guo, “GW27-e0397 An analysis and diagnosis system of coronary heart disease based on big data platform,” Journal of the American College of Cardiology, vol. 68, no. 16S, pp. C82, 2016. [Google Scholar]
16. K. Munir, A. de Ramón-Fernández, S. Iqbal and N. Javaid, “Neuroscience patient identification using big data and fuzzy logic—An Alzheimer’s disease case study,” Expert Systems with Applications, vol. 136, no. 4, pp. 410–425, 2019. [Google Scholar]
17. K. Prableen, S. Manik and M. Mamta, “Big data and machine learning based secure healthcare framework,” Procedia Computer Science, vol. 132, no. 3, pp. 1049–1059, 2018. [Google Scholar]
18. B. Karthikeyan, T. Sasikala and S. B. Priya, “Key exchange techniques based on secured energy efficiency in mobile cloud computing,” Applied Mathematics & Information Sciences, vol. 13, no. 6, pp. 1039–1045, 2019. [Google Scholar]
19. N. V. Chawla, K. W. Bowyer, L. O. Hall and W. P. Kegelmeyer, “SMOTE: Synthetic minority over-sampling technique,” Journal of Artificial Intelligence Research, vol. 16, pp. 321–357, 2002. [Google Scholar]
20. S. Satpathy, S. Debbarma, S. C. Sengupta Aditya and K. D. Bhattacaryya Bidyut, “Design a FPGA, fuzzy based, insolent method for prediction of multi-diseases in rural area,” Journal of Intelligent & Fuzzy Systems, vol. 37, no. 5, pp. 7039–7046, 2019. [Google Scholar]
21. Z. Xiaobo, X. Dongji, Z. Kaiye and L. Zhenzhe, “Elman neural network using ant colony optimization algorithm for estimating of state of charge of lithium-ion battery,” Journal of Energy Storage, vol. 32, no. 3, 2020. [Google Scholar]
22. K. Xie, H. Yi, G. Hu, L. Li, Z. Fan et al., “Fan short-term power load forecasting based on Elman neural network with particle swarm optimization,” Neurocomputing, vol. 416, no. 2, pp. 136–142, 2020. [Google Scholar]
23. J. Too, A. R. Abdullah, N. Mohd Saad, N. Mohd Ali and W. Tee, “A new competitive binary grey wolf optimizer to solve the feature selection problem in EMG signals classification,” Computers, vol. 7, no. 4, pp. 58, 2018. [Google Scholar]
24. J. S. Pan, P. Hu and S. C. Chu, “Novel parallel heterogeneous meta-heuristic and its communication strategies for the prediction of wind power,” Processes, vol. 7, no. 11, pp. 1–24, 2019. [Google Scholar]
25. L. Wang, H. Lina, L. Zhang and G. Shuli, “An analysis and diagnosis system of coronary heart disease based on big data platform,” Journal of the American College of Cardiology, vol. 68, no. 16S, pp. c82, 2016. [Google Scholar]
26. K. Umamaheswari and P. Latha, “An optimal metaheuristic based feature selection with deep learning model for autism spectrum disorder diagnosis and classification,” IIOABJ, vol. 12, no. 1, pp. 19–25, 2018. [Google Scholar]
27. M. N. Parikh, H. Li and L. He, “Enhancing diagnosis of autism with optimized machine learning models and personal characteristic data,” Frontiers in Computational Neuroscience, vol. 13, pp. 9, 2018. [Google Scholar]
28. K. S. Omar, P. Mondal, N. S. Khan, M. R. K. Rizvi and M. N. Islam, “A machine learning approach to predict autism spectrum disorder,” in IEEE, 2019 Int. Conf. on Electrical, Computer and Communication Engineering (ECCECox’s Bazar, Bangladesh, pp. 1–6, 2019. [Google Scholar]
29. G. Devika Varshini and R. Chinnaiyan, “Optimized machine learning classification approaches for prediction of autism spectrum disorder,” Annals of Autism & Developmental Disorders, vol. 1, no. 1, pp. 1001, 2020. [Google Scholar]
 | This work is licensed under a Creative Commons Attribution 4.0 International License, which permits unrestricted use, distribution, and reproduction in any medium, provided the original work is properly cited. |