DOI:10.32604/iasc.2022.020174
| Intelligent Automation & Soft Computing DOI:10.32604/iasc.2022.020174 | |
| Article |
A Deep Learning-Based Novel Approach for Weed Growth Estimation
1Chitkara University Institute of Engineering and Technology, Chitkara University, Punjab, India
2Department of Management Information Systems King Khalid University, Guraiger, Abha, 62529, Saudi Arabia
3Department of Civil Engineering, College of Engineering, Taif University, Taif, 21944, Saudi Arabia
4Computer Science and Engineering, Lovely Professional University, Punjab, 144411, India
*Corresponding Author: Aman Singh. Email: amansingh.x@gmail.com
Received: 12 May 2021; Accepted: 07 July 2021
Abstract: Automation of agricultural food production is growing in popularity in scientific communities and industry. The main goal of automation is to identify and detect weeds in the crop. Weed intervention for the duration of crop establishment is a serious difficulty for wheat in North India. The soil nutrient is important for crop production. Weeds usually compete for light, water and air of nutrients and space from the target crop. This research paper assesses the growth rate of weeds due to macronutrients (nitrogen, phosphorus and potassium) absorbed from various soils (fertile, clay and loamy) in the rabi crop field. The weed image data have been collected from three different places in Madhya Pradesh, India with 10 different rabi crops (Maize, Lucerne, Cumin, Coriander, Wheat, Fenugreek, Gram, Onion, Mustard and Tomato) and 10 different weeds (Corchorus Capsularis, Cynodondactylon, Chloris barbata, Amaranthaceae, Argemone mexicana, Carthamus oxyacantha, Capsella bursa Pastoris, Chenopodium Album, Dactyloctenium aegyptium and Convolvulus Ravens). Intel Real Sense LiDAR digital camera L515 and Canon digital SLR DIGICAM EOS 850 D 18-55IS STM cameras were mounted over the wheat crop in 10 × 10 square feet area of land and 3670 different weed images have been collected. The 2936 weed images were used for training and 734 images for testing and validation. The Efficient Net-B7 and Inception V4 architectures have been used to train the model that has provided accuracy of 97% and 94% respectively. The Image classification using Inspection V4 was unsuccessful with less accurate results as compared to EfficientNet-B7.
Keywords: Deep learning; rabi crop; weeds; weed identification; efficient Net-B7; soil nutrients; inception V4
Crop production is an important component of the agriculture system and responsible for global food management. Therefore, it is important to invent new trends and scientific methods to properly plan and manage them. The Deep Learning Techniques and methods are best suited to properly plan and manage crop production and also increase the income of farmers along with the productivity of crops. The growth of weeds within the crop will affect the basic resources such as water, soil, minerals, fresh air, sunlight, etc. In recent studies, it has been observed that 35% of crops are destroyed due to the growth of different types of weeds in the agriculture field [1]. Weeds grow faster and affect the target crop growth by absorbing the nutrients present in the soil. This research paper has taken three types of soil samples (fertile, clay and loamy) in 10 × 10 square feet areas in the wheat crop field. The process of plant growth is quite a continuous process, usually; soil nutrients are the basic source of plant growth. Targets inhibit weed plant growth along with plant growth, hence the prediction of the morphological feature of weed plant growth predicted by time-series data [2]. The impact of nutrient deficiencies on crop production is identified in the leaves of the crop and weed plant, the symptoms like texture, the morphological, spectral properties changes [3]. This section uses threshold algorithms for leaf coverage of soybean plant growth using Amazon Mechanical Turk for image segmentation. The author has developed the labeled training data set of 285 images of an early growth soybean plant. The training evaluation has been done using three segmentation techniques as deep Convolutional Neural Network (CNN), threshold and random forest classifiers. The final average crop growth accuracy is usually estimated as 87.52% [4]. Generally, the weeds are identified manually and the herbicides are applied globally for weed removal to increase the crop yield. The usage of herbicides also affect the soil nutrients level. Few common weeds are listed below in Tab. 1.

This work is based on a transfer learning/domain adaptation image processing technique that produces better results with machine learning algorithms. Six popular machine learning methods have already been compared based on images taken from two different heights and 97.07% accuracy has been achieved using the transfer learning technique [5]. The deep CNN predicts the plants expected growth, by generating segmentation masks of root and shoot systems. Such an approach is highly adaptable, trainable (transfer learning/domain adaptation) on different plant species and mutations [6]. Various authors have also worked with deep learning techniques for improving weed density and absolute corners for weed detection in crop row [7]. Usually, weed detection is done using ground-based machine vision and image processing techniques. The four different processes such as pre-processing, segmentation, feature extraction and classification are presented in detail for weed detection in followed sections. It’s always difficult to detect weeds and discriminating between crops and weeds, which often have similar properties. There are various challenges and solutions for weed detection in fields, including the inclusion and overlapping of leaves, different light conditions, with different developmental stages [8].
Transgenic and Genetically Changed Organisms (GMOs) of rosette leaves have raised massive clinical and public concern nowadays. Hence the need for opportunity processes using transgenic in preference to direct trouble of counting rosette leaves from the RGB picture is a vital issue in plant phenotyping. The weed growth rate estimation based on early growth, using the leaf counting challenge dataset is available in the CVPPP-2017 dataset [9]. Weed image estimation is a specific task, so it’s necessary to remove the background and foreground partitions or segmentation of weed images to implement the classification steps. This work also uses canola field video images using VGG16 and ResNet-50 architectures with 82.88% and 98.68% accuracies respectively [10]. The accuracy of 76.1% and 89.7% for weed images dataset have also been achieved using Deep Convolutional Neural Network (DCNN) using You Only Look Once V3 (YOLO V3) and tiny YOLO architecture [11]. Few nutrients deficiency symptoms in target crop because of weed plants are listed below in Tab. 2.

The implementation of CNN-based unsupervised segmentation on weed density distribution is performed using two datasets, the first is weed field image dataset (CWFID) and the second is sugar beet dataset. This work also uses a site-specific weed management system for weed density distribution with penetrates area of your weed leaf where recall value is 99% and accuracy is 82.13% [12]. This work has covered two effective powerful CNN architectures that are Inception V4 and Efficient Net B7 for plant growth estimation across different weed plants in rabi crop. The need of efficient models with fewer parameters that trained faster and without compromise on performance is inevitable. This study proposes EfficientNet deep learning architecture for the classification of weed plant. The performance of the proposed model is compared with state-of-the-art CNN architectures such as and Inception V4 and EfficientNet B7. Among these Efficient Net B7 architecture has yielded better recognition rates over various datasets because of a large number of estimation parameters than Inception V4 [13]. The proposed method Nutrient-Based Weed Growth Estimation (NWGE) is also based on detecting the plant’s type through their leaf’s characteristics and also neural network has been used to identifying weed species. The major contributions in this work are:
• The results are compared based on of two different CNN architectures such as Inception V4 and Efficient Net B7 based on of morphological properties, visual texture and spectral properties of leaves.
• An efficient framework is proposed for weed identification, detection and growth estimation in rabi crops. The proposed framework works efficiently and achieves the best accuracy as compared to Inception V4 architecture.
• This work can be helpful for further research in the field of weed identification and detection for different Annual and Perennial crops.
The change in weed growth stages is a continuous process, that changes the morphological, visual texture and spectral properties of leaves. This section has discussed various optimization approaches proposed by various researchers in terms of the performance and operating costs of weed growth. Six [14] have proposed plant growth with 17 essential micro and macronutrient elements. The main task for improving nutrient efficiency in soil for crop development is by using supervised machine learning techniques. Olsen et al. [15] have discussed Robotic weed management for automatic weed identification and detection using Raspberry Pi microcontroller. According to them, effective data implementation can be done with ResNet-50 with an accuracy of 89.94%. Mochida et al. [16] have suggested that frame filter uses naive bays as RMO with a manually mounted 3D digital camera. They have used this for experimental determination and selective weed removal techniques to identify the weed growth stage. According to them the intersection of the unit value is 90.44% but initially, it may be 81.28%. Potena et al. [17] have covered some techniques for the identification and detection of the seed location in the field using image processing. CNN technology can be used to get accurate weed images efficiently using semantic segmentation feature extraction and recognition. Xu et al. [18] have suggested a modern deep learning approach using RootNav 2.0 that can remove the manual and semi-automatic feature extraction. Using this technique they have found the location of seed with optimal path throughput image and extract the accuracy of architecture. Atkinson et al. [19] have discussed the weed detection on dicot broadleaf weed with different varieties of crops using multistage scattering transformation, also they have implemented the SVM classifier and achieved maximum accuracy of 96.88%. Kuo et al. [20] have identified and collected Amaranths Viridis, Bohrwia diffuse, Anagallis, Argomon Mexicana weed images in different crops using the PU (Positive Unable) classic learning technique with leaf cloning. They have also implemented the VGG-16 architecture for broadleaf detection and with a maximum accuracy of 95.5%.
Mishra et al. [21] have proposed the morphological feature of monocot and dicot weed leaf using the Robo Mind Hurricane EV3 method. They have used weed image data that can directly be accessed by computer vision for weed and crop identification. Son et al. [22] have proposed a class of the age and gender of a human from face snapshots. The authors have taken Deep Neural Network (DNN) and Convolutional Neural network (CNN) into consideration as one of the ultra-modern function extractors and classifiers to represent an efficient way of reading the complex function areas with an accuracy of 97.98% for face recognition using Efficient Net B7. Song et al. [23] have proposed the uses of remedial saline soils for salinity-tolerant crops for saltwater production. They have used the hyperspectral imaging (HSI) technique applied to 13 okra plant productions with 7 days of treatment with saline soil using computer vision technology. The authors have used RGB Kapler’s image on the HSV (Hue Saturation Value) and have achieved a segmentation score with 94% accuracy.
Mishra et al. [24] have suggested weed detection and identification technology using artificial intelligence technology with different morphological features in different crops. This work also focused on different classes of weeds that are grown on different crops. Rahaman et al. [25] have discussed deep learning techniques for weed detection and identification with dataset prepared from different location in the crop field. The authors have also covered supervised machine learning matrices that have been used to implement the texture feature and morphological analysis of the sugar beet plant. Lopez Granados [26] have proposed site-specific weed management (SSWM) technologies for scientific research. Their work also contains weed mapping, treatment technique, application in treatment that is required to implement weed identification, detection and removal in the field. Teimouri et al. [27] have discussed weed identification, phenotyping and accurate weed mapping using IoT with different sensors. This work has also summarized the effective weed identification and detection with a different spraying application on carrot plant weed using DCNN Inception V4 architecture with an accuracy of 96.05%. Osorio et al. [28] have proposed the work on lettuce crop, the implementation of weed estimation and identification using deep learning with three different techniques with NDVI index for crop detection such as support vector machines (SVM) using histograms, YOLO V3 base method and third is R-CNN, resulting in F1-score of 88%, 94% and 94% for each technique respectively. Khan et al. [29] have discussed that use of chemicals/pesticides is essential for smart farming and good crop production. They have proposed a cost-effective semi-supervised learning approach to provide training and labelling with RGB images captured from different croplands for identification of crops and weeds with an accuracy of 90%.
Many studies have already worked with various CNN architectures but still more work is required to improve the accuracy in weed detection and one of the better options for this can Efficient Net B7 architecture. The motivation behind this work is to improve the accuracy of weed identification using Efficient Net B7 under variable lighting conditions in different color space models and also to measure the impact of weed on crops due to soil nutrients deficiency because of weed plants. Efficient Net B7 and Inception V4 are used in comparison to other architectures like ResNet 152 V2, inception V3,VGG 19 etc. because of its efficiency and accuracy. This work has proposed the Nutrient-Based Weed Growth Estimation (NWGE) algorithm for the approximate optimal solution for weed identification and detection. The followed section describes the on-field camera settings and the data collection strategies used for the proposed work.
3 Camera Settings and Data Collection
The weed image dataset provides information about different crops and weeds. The authentic multiclass weed and crop datasets are not easily approachable. Thus, this work has been initiated to collect comprehensive data for different crops and weeds. Before collecting the weed and crop image data, a detailed survey has been done on the farm of a village in Rewa District (Madhya Pradesh). The data relating to 10 different rabi crops (such as Maize, Lucerne, Cumin, Coriander, Wheat, Fenugreek, Gram, Onion, Mustard and Tomato) and of 10 different weed families have been collected. The Intel Real Sense canon digital SLR DIGICAM EOS 850 D 18-55IS STM camera was mounted on the wheat crop at a ground sampling distance of 0.06 cm of image acquisition. Images have been acquired between 9:00 am and 5:00 pm in the presence of daylight and different sunny situations, which include clear, partly cloudy, or cloudy. Transplantation of wheat plants at two commercial farms was completed on November 25, 2020, in clay soil and on November 26, 2020, in infertile and in loamy soil. The first weed image verification has been conducted on December 06 and 08, 2020 with a collection of 250, 320 and 280 images respectively. There were 438, 407 and 445 weed images were taken for second observation from the wheat fields on December 24, 2020. Again the third and final weed growth estimation had been conducted on January 12 and 14, 2021 collecting 510, 508 and 512 weed images were collected respectively from crop fields. Complete observation has been done within 60 days. A total of 3670 different weed images in a 10 × 10 square feet area of land were collected. Out of them, 2936 weed images have been used for training and 734 image data have been used for testing and validation. The images were converted to 1280 × 720 pixels (720p) dimensions for data equalization and abstraction. Detail regarding the number of weeds images of the different families used for the survey is shown in Fig. 1.
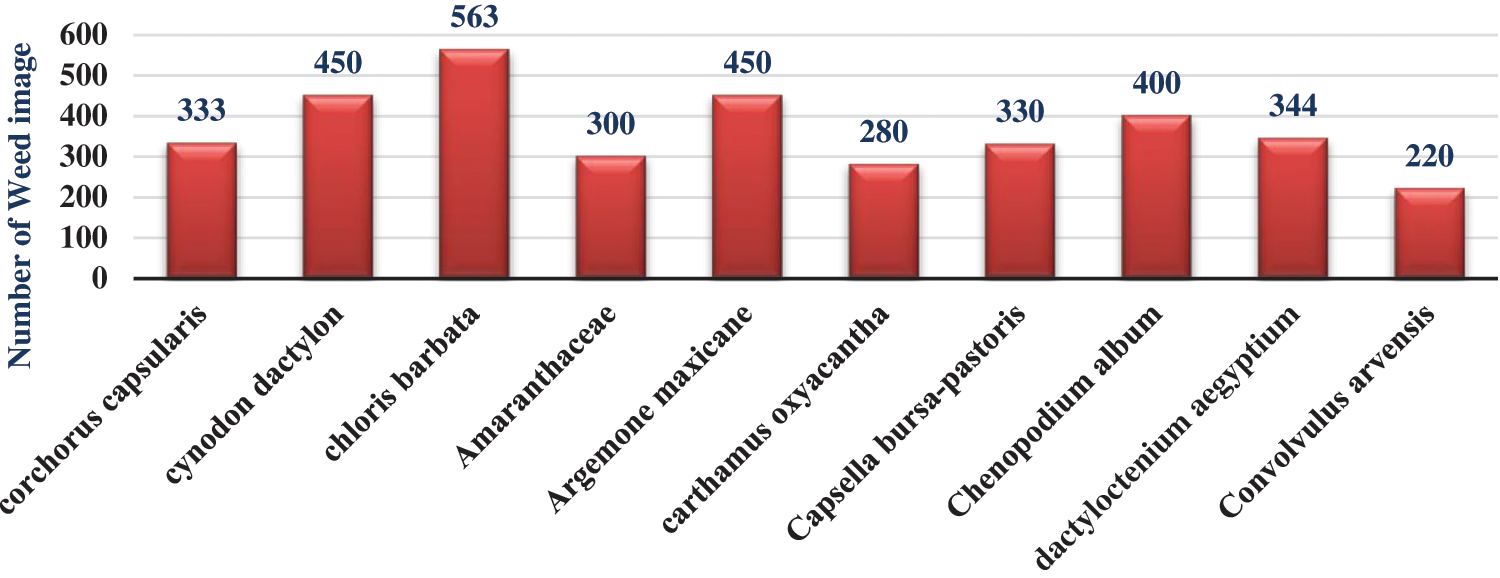
Figure 1: Number of weed images dataset on rabi crop
Training and testing weed images have been collected more than one time between November 2020 and December 2020. Two different convolutional architectures Inception V4 and Efficient Net B7 have been applied for the training and testing of weed images. Usually, different weed species generate bounding containers on different weed species developed amongst three different soils in the wheat crops. This dataset had been generated via drawing bounding packing containers on tremendous images collected from the fields.
This work is related to weed identification, weed growth estimation, detection and finally to estimate the weed impact on the rabi crop. This work includes two different convolutional architectures that are Inception V4 and Efficient Net B7, these architectures can provide better performance for weed discrimination [30]. Further, the data preprocessing and system structure along with weed data classification strategies have been discussed in followed sections.
4.1 Data Preprocessing and System Structure
The proposed work has used two CNNs architectures in comparison with digital images to discriminate weed species. Weed/Crop image Acquisition (10 × 10 square feet area of land) is done in experiment field with mounted camera in three different soil first is clay soil weeds image data (N = 50 Parts Per Million (ppm), P = 5 ppm, K = 180 ppm), second is loamy soil weed image data (N = 45 ppm, P = 7 ppm K = 170 ppm) in rabi crop and third is fertile soil weed image data (N = 60, P = 8 ppm, K = 190 ppm). The CNN may be labeled as perception on primarily data image and can classify the different weed classes using Inception V4 and Efficient Net B7 architecture. Weed growth estimation due to the nutrients data model using CNN is depicted in Fig. 2. Image segmentation is implemented on a total of 3670 weed data images from 10 weed data families. Its input is an RGB image (for example, 1024 × 768 × 3) and output is a tensor with similar dimensions except that the last dimension is the number of stuff categories (1024 × 768 × 4) for a 4-stuff category. In general, image segmentation consists of two stages. The first segmentation stage consists of a labeled image and the second segmentation level is for object identification in every frame (an object defined as non-stop pixels in a frame) with regards to the elimination of the background.
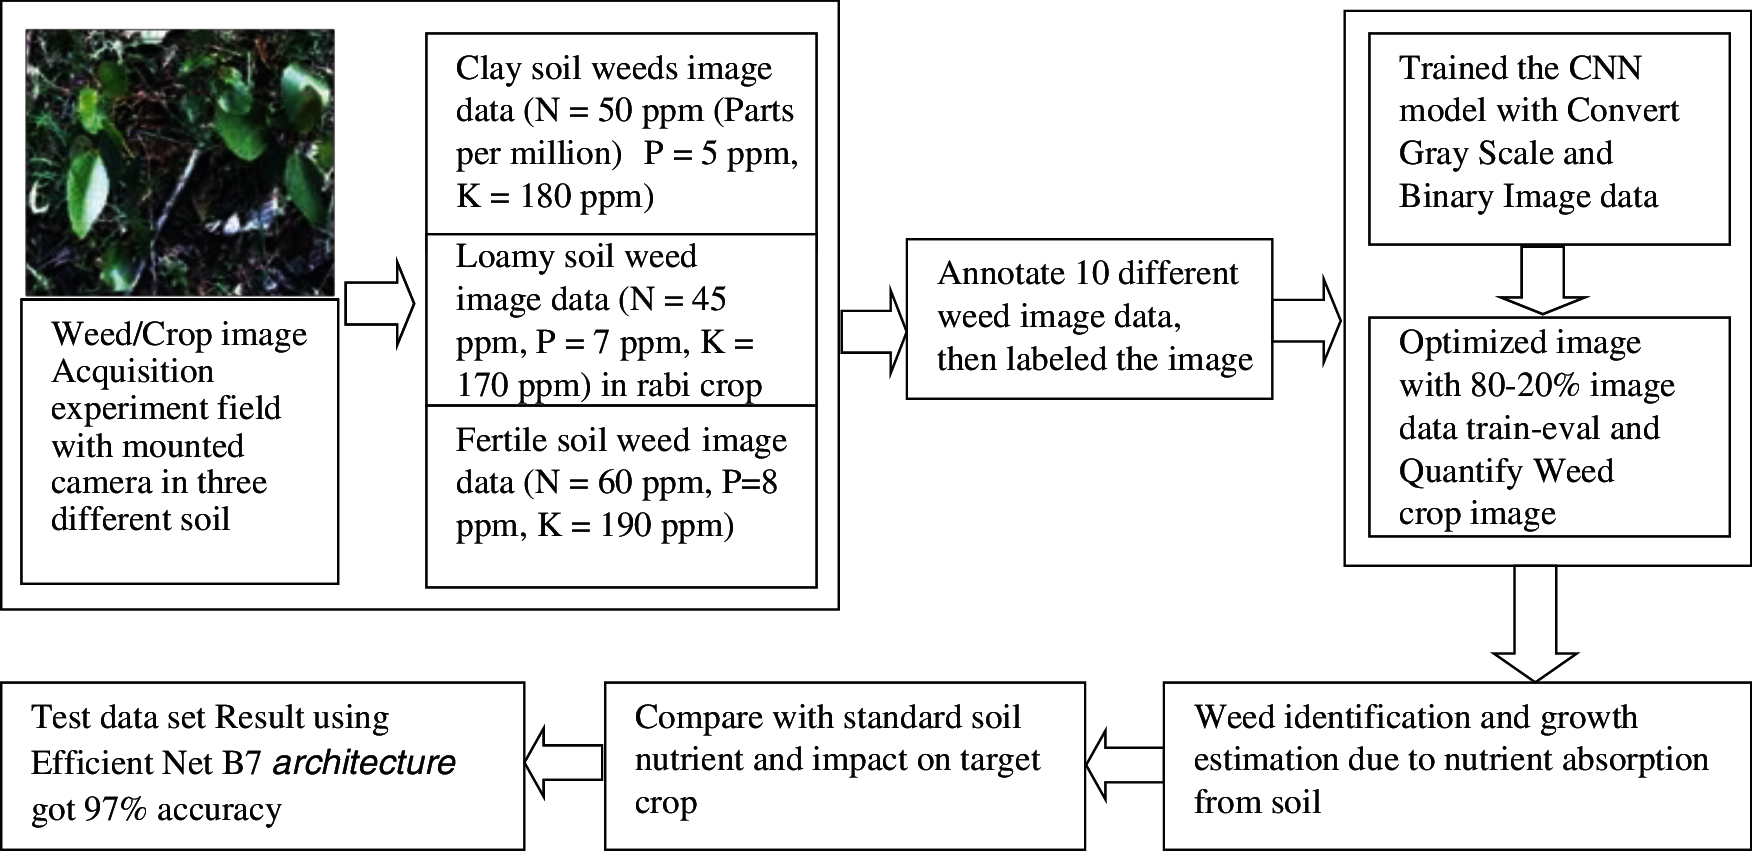
Figure 2: Weed growth estimation due to nutrients using CNN data model
4.2 Weed Data Classification and Flow Chart
Inception V4 and Efficient Net B7 have been used for weed growth estimation due to nutrient absorption from the soil with collected 3670 field images and comparative analysis among both has been conducted for the accuracy of results. The 2936 weed images have been used for training and 734 images have been used for testing and validation on 15th January 2021. The architecture of Efficient Net B7 in perceptive of weed image implementation is described in Fig. 3. Images are filtered 256, 120, 192 and 384 times to achieve accuracy and then filtered images are concatenated for further analysis of segmented data as shown in Fig. 4. Every input weed image is of dimensions 224 × 224 × 3, which consists of 224 × 224 input matrices and each pixel in the matrix is a combination of Red, Green, Blue (RGB) colors and the value of each color can range from 0 to 255. It is necessary to enhance the quality of the data. Constructing a well-performing model requires close analysis of both the network architectures, the input data format and also the division of images into different regions with a clear association with objects of interest that have come under the segmentation part.
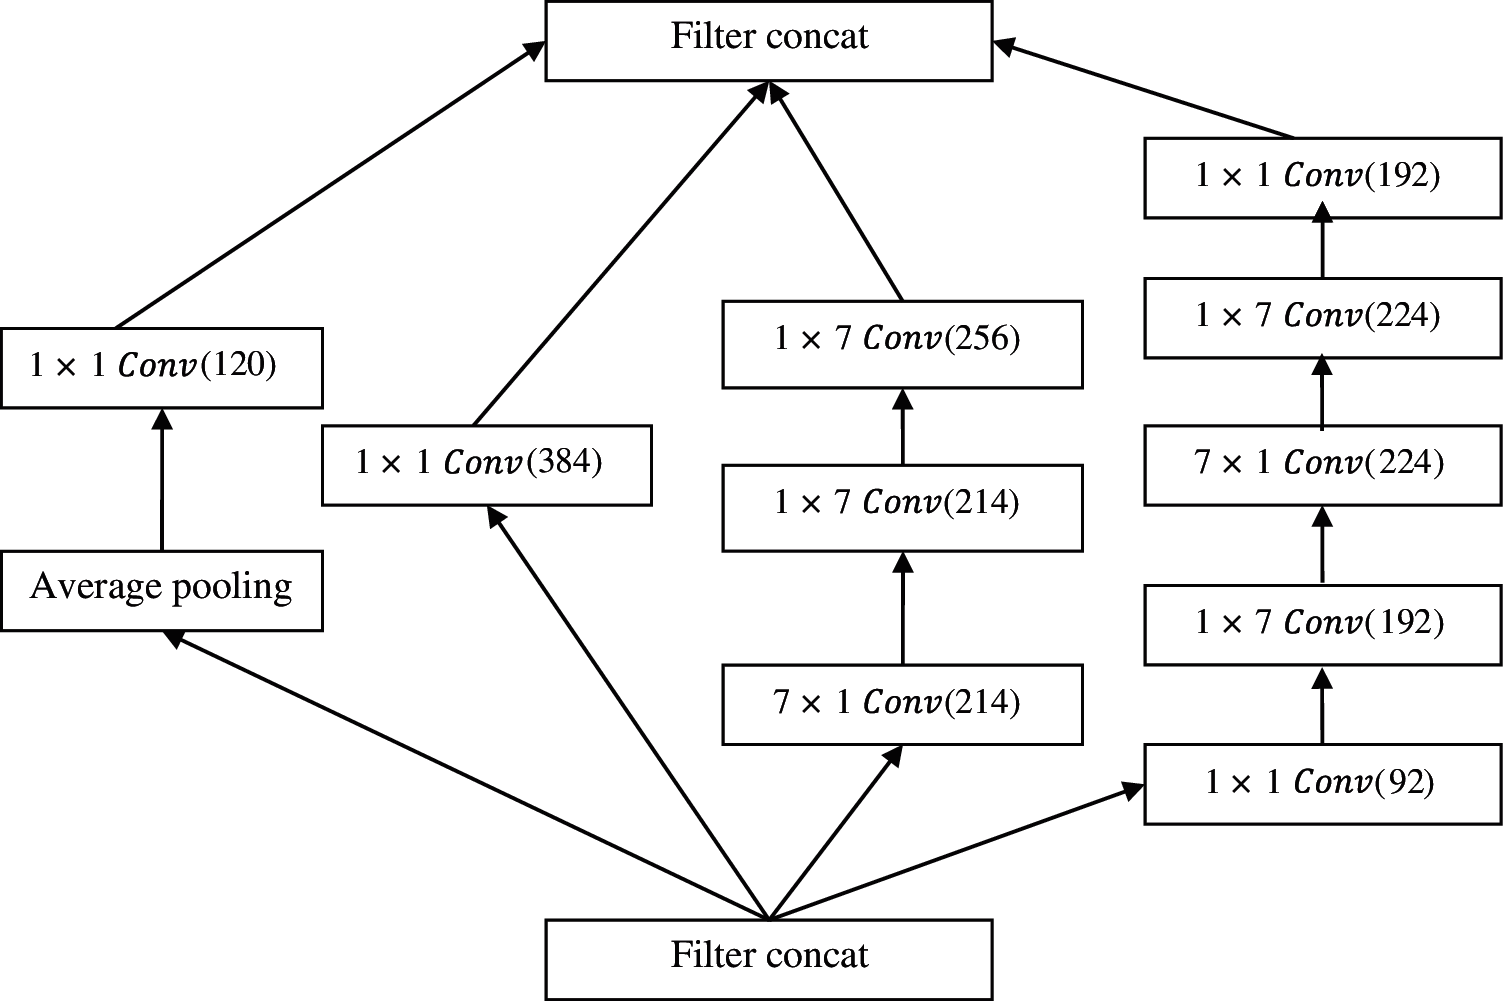
Figure 3: The Architecture of efficient net B7 in perceptive of weed images
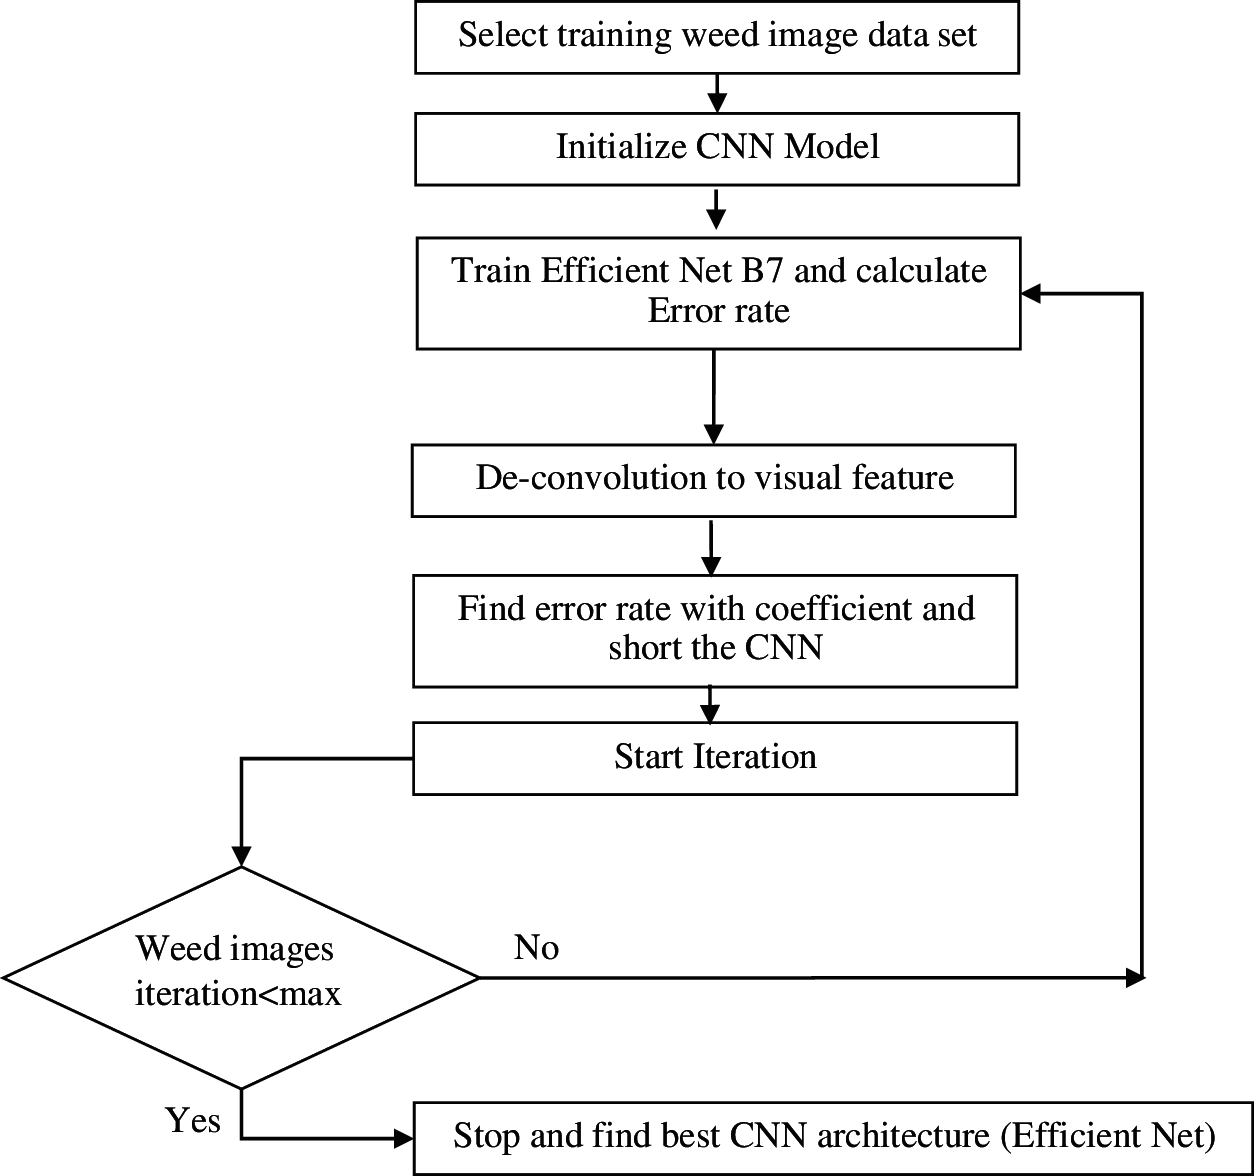
Figure 4: Weed image data flow using CNN
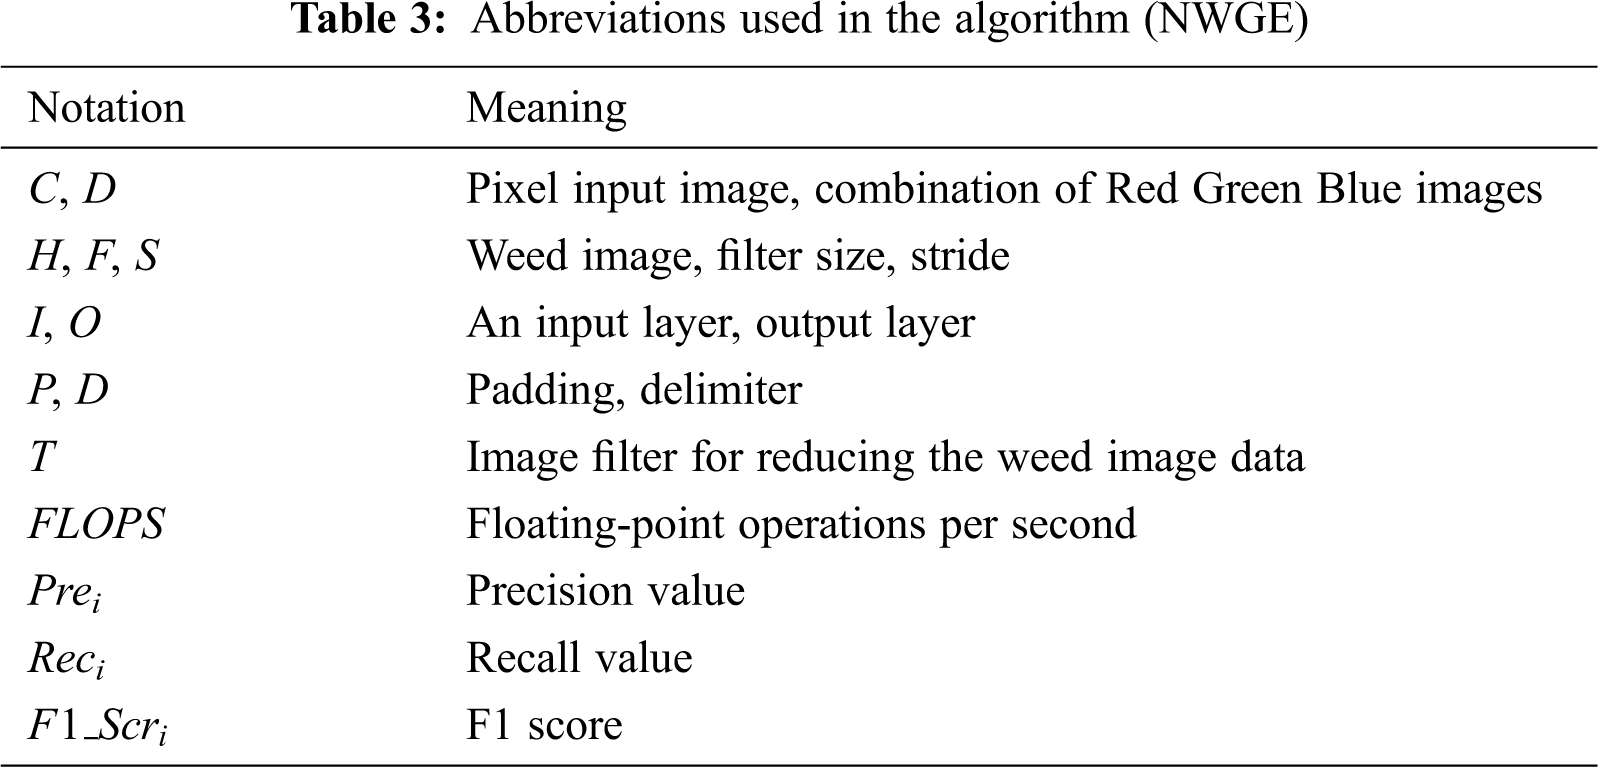
Finally, weed image data classification has carried out using different classifiers of deep learning techniques. A few abbreviations are given in Tab. 3, which have been used for image Pre-processing, Segmentation, Feature Extraction and Classification techniques.
The identification and detection of weeds based upon morphological property have been performed using Efficient Net B7 architecture. Steps involved in the identification and detection of weeds are explained in Tab. 4 and are also explained in the form NWGE algorithm
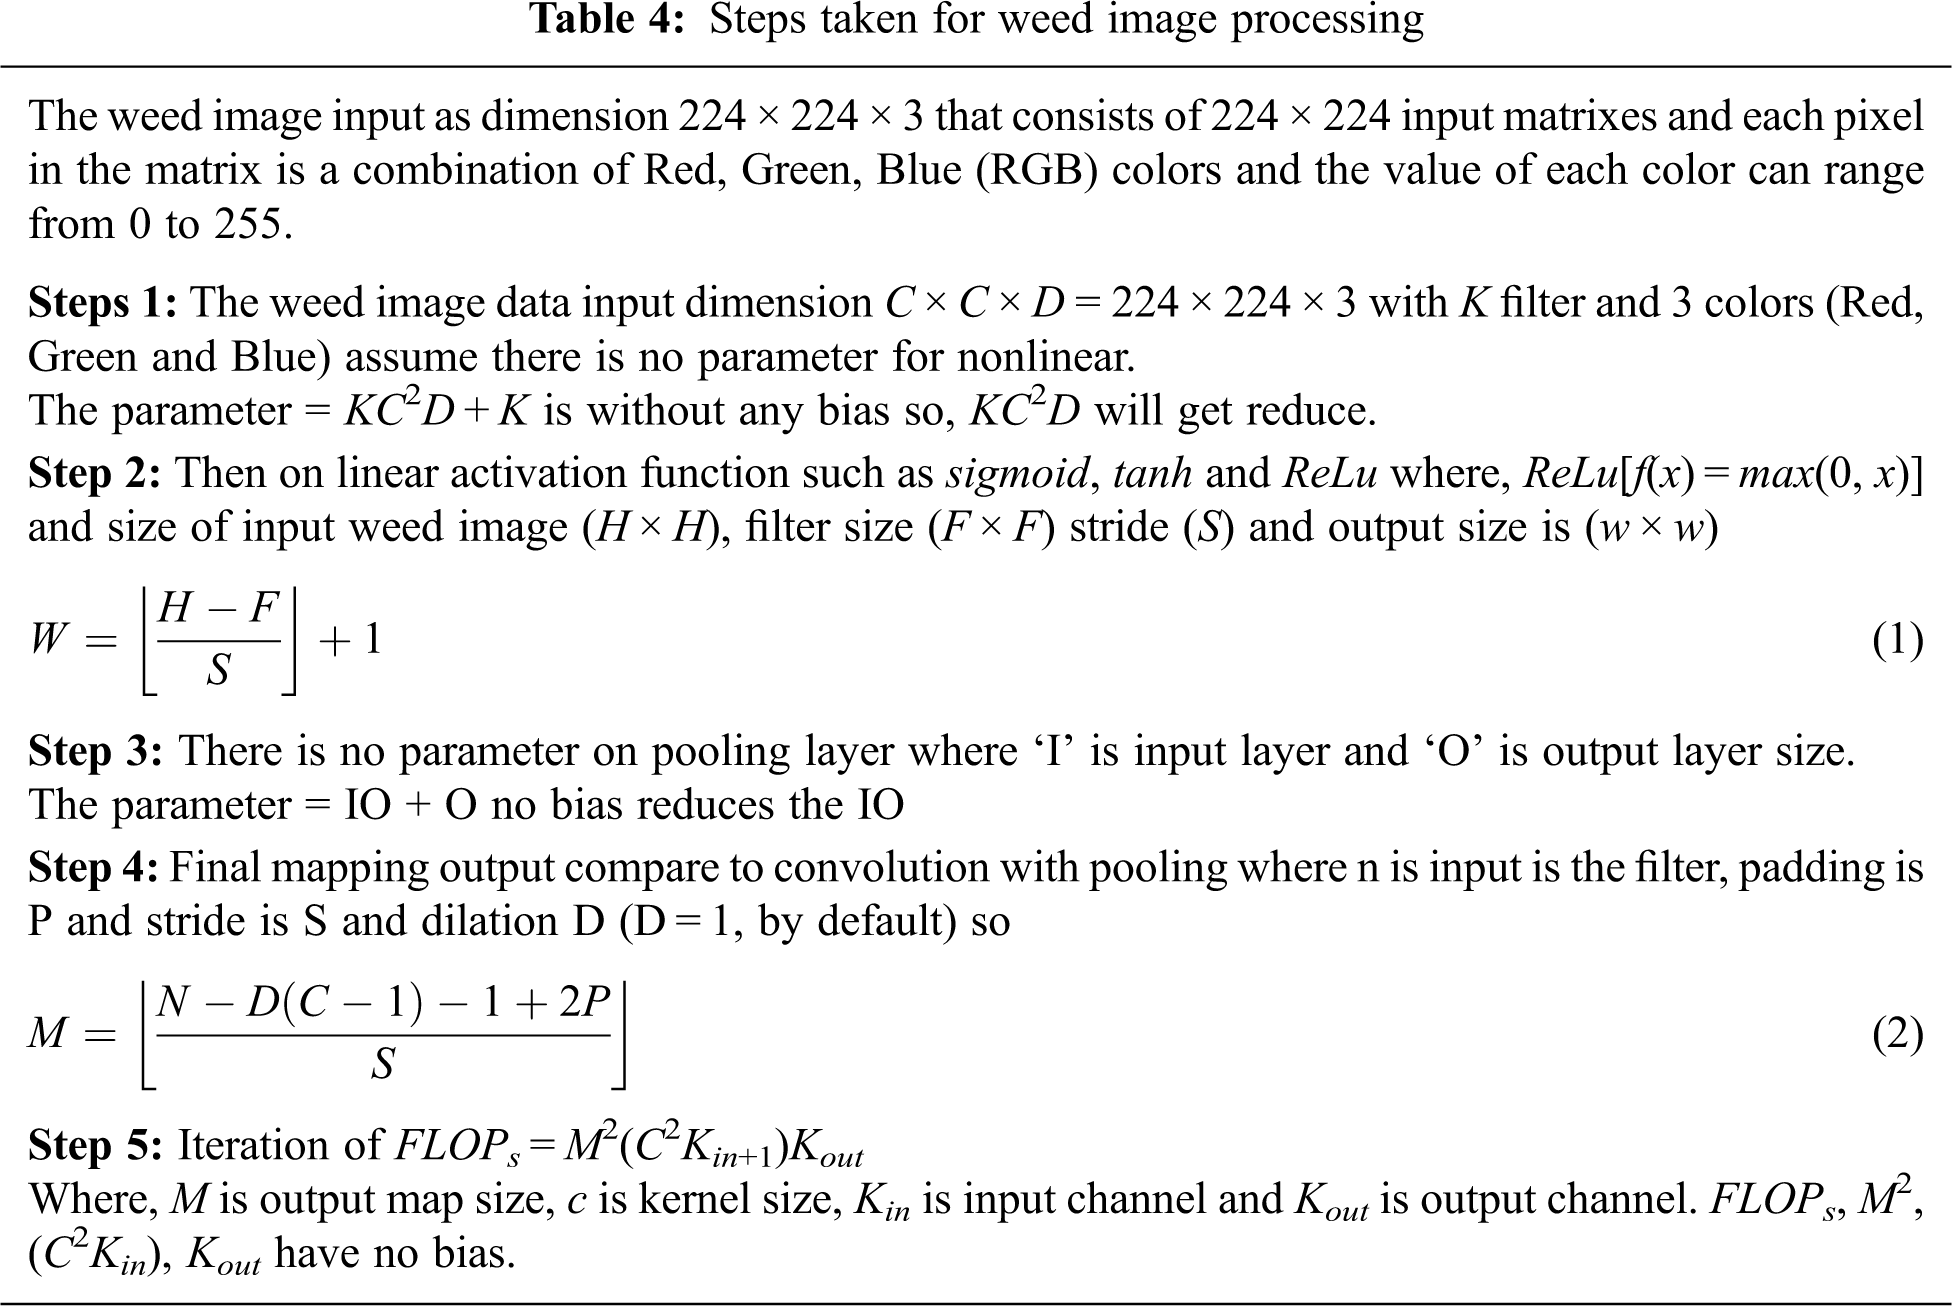
Efficient Net models achieve both higher accuracy and better efficiency over existing CNNs, reducing parameter size and flops by an order of magnitude. The input will be weed images with 224 × 224 × 3 dimensions, K number of filters and 3 colors space (Red, Green and Blue). In the context of weed image data, ‘I’ is used as input layer size and ‘O’ as output layer size. The proposed framework performs mapping of weed image output as compared to convolutional layer and pooling layer where n is an input of the filter, P is padding and D is dilation (D = 1, by default), Efficient Net B7 use iteration using FLOPs = M2(C2Kin+1)Kout. The third is the Fully Connected Layer that consists of weights and biases which is used to connect neurons between two different layers [31]. Fourth is Dropout, in the case of fitting few neurons are dropped from the neural network during the training dataset. Last is an Activation function that is the most important layer for forwarding the functionality to the next layer. The standard parameters of linear activation function such as sigmoid, tanh,
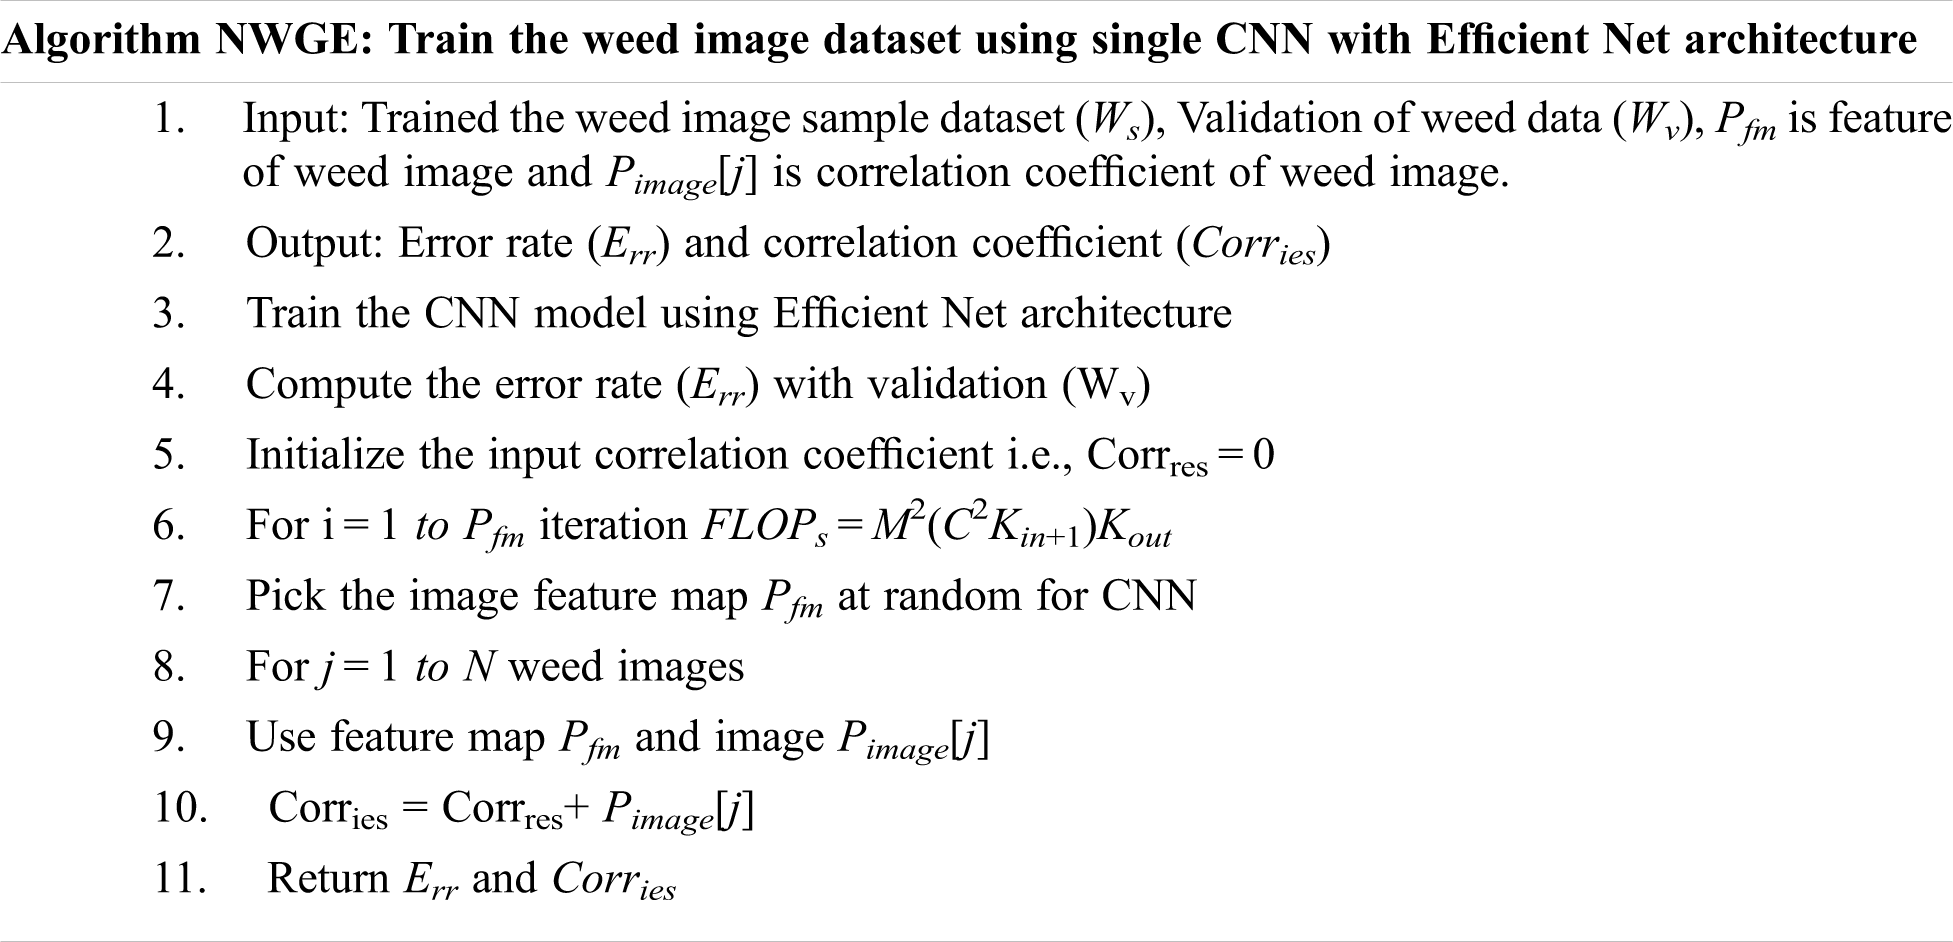
The iteration of weed image data based upon Floating-Point Operations per Second (FLOPS) measures the weed image data accuracy. The genetic algorithm for the Efficient Net B7 description is given below in the form of the proposed NWGE algorithm. NWGE algorithm describes the error rate (Err) and correlation measurement (Corries), of N numbers of training weed images data. The training weed image contains collected sample dataset (Ws), Validation of data (Wv), a morphological feature of an image as Pfm and Pimage[j] as the correlation coefficient of weed image. The input of correlation coefficients initialized with zero such as Corrres = 0, depth, width and resolution of images calculated using FLOPs = M2(C2Kin+1) Kout which is turned up to N times. The parametric description of both Efficient Net B7 and Inception V4 architectures is given in Tab. 5.
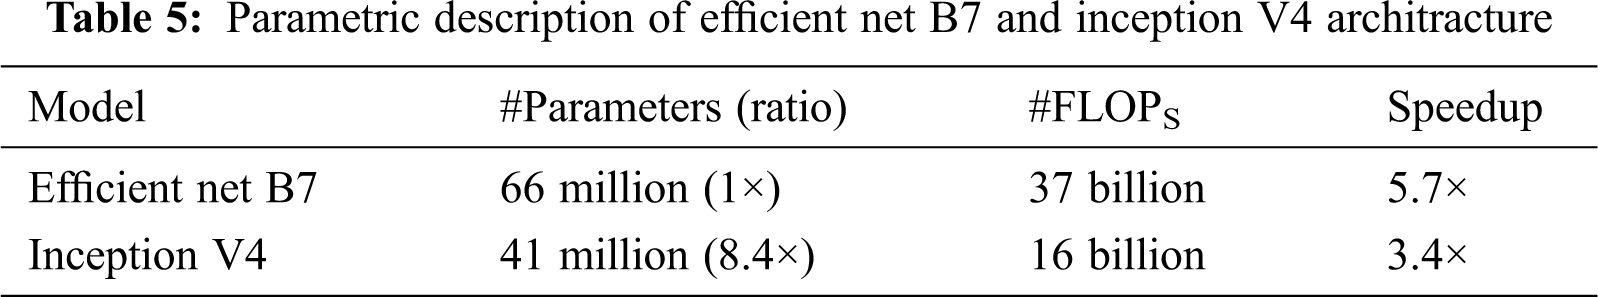
The scaling method (depth, width and resolution) of Efficient Net B7 improves the accuracy and efficiency with the help of FLOPs. Finally, the weed error rate (Err) calculated as 4.167% based upon Efficient Net B7 architecture. The accuracy of average weed growth at three different locations for these species increased to 97% using Efficient Net B7 as shown in Fig. 7. than past CNN models such as inception V4 with 94% accuracy as shown in Fig. 6. The multiclass object-detection training uses the Intersection over Union (IoU) method where four conditions have been organized as True positive (TP), True Negative (TN), False Positive (FP) and False Negative (FN). These four conditions are applied to build a binary-class confusion matrix [32]. The scale of effectiveness is considered as two-parameter such as leaf and the entire plant. The technique is being developed for the precision value that calculates the plant-degree scale. The proposed algorithm NWGE ensures to target weed plants inside the wheat plants using measures and effectiveness of neural network with precision, recall and F1-score. The steps of identical optimization of the genetic algorithm based on Nutrient-Based Weed Growth Estimation (NWGE) algorithm are given below:
This section briefly summarizes the experimental results for the performance evaluation and provides the simulations.
Weeds plants usually compet for light, water, air, nutrients and space from the target crop. This work assesses the growth rate of weeds due to macronutrients (nitrogen, phosphorus and potassium) absorbed from the soil (fertile, clay and loamy) in the rabi crop. A detailed description of the training dataset is shown in Fig. 5.
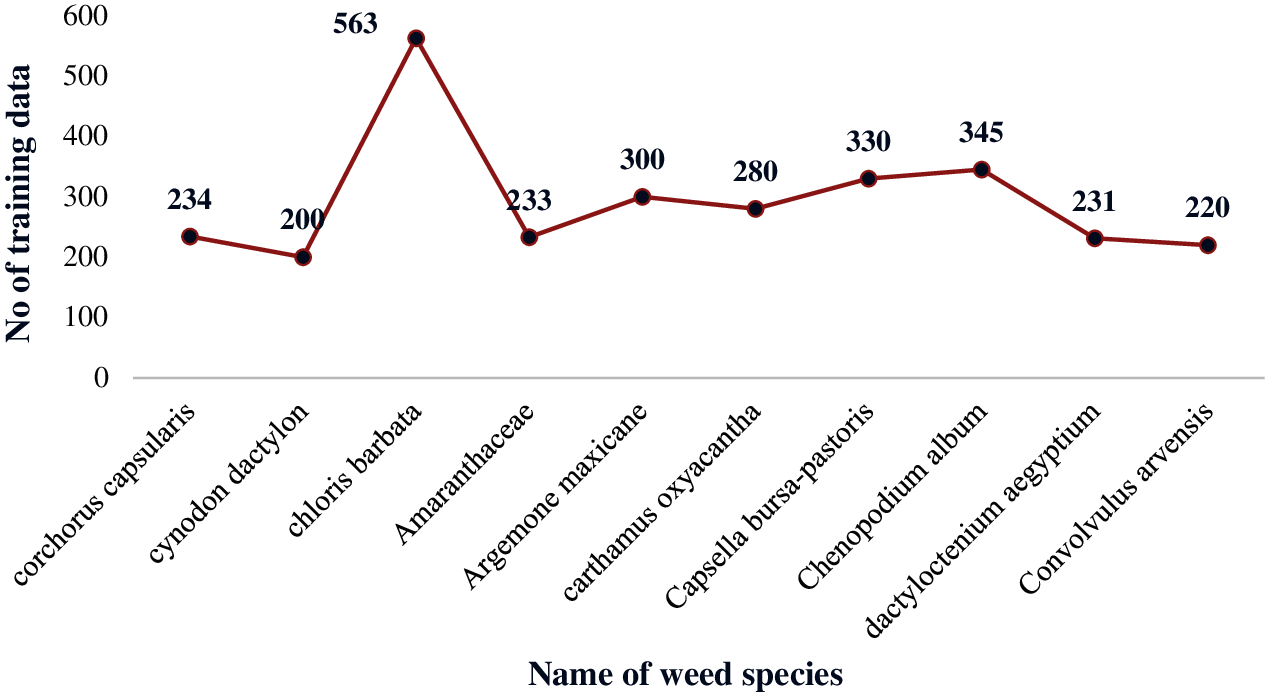
Figure 5: Training weed image dataset
This work identifies 10 different weed species from collected images of rabi crop for training and testing to achieve higher accuracy of CNN. The images have been classifying using Inception V4 and Efficient Net B7 architecture. Here, the CNN is skilled for the multi-class training dataset containing 2936 images and 734 images have been used for testing and validation. Here, Inception V4 is skilled to estimate the growth and detecting different weed classes. This method has achieved maximum accuracy of 94% by using 50 epochs. A detailed description of weed growth accuracy with Inception V4 is given in Fig. 6.
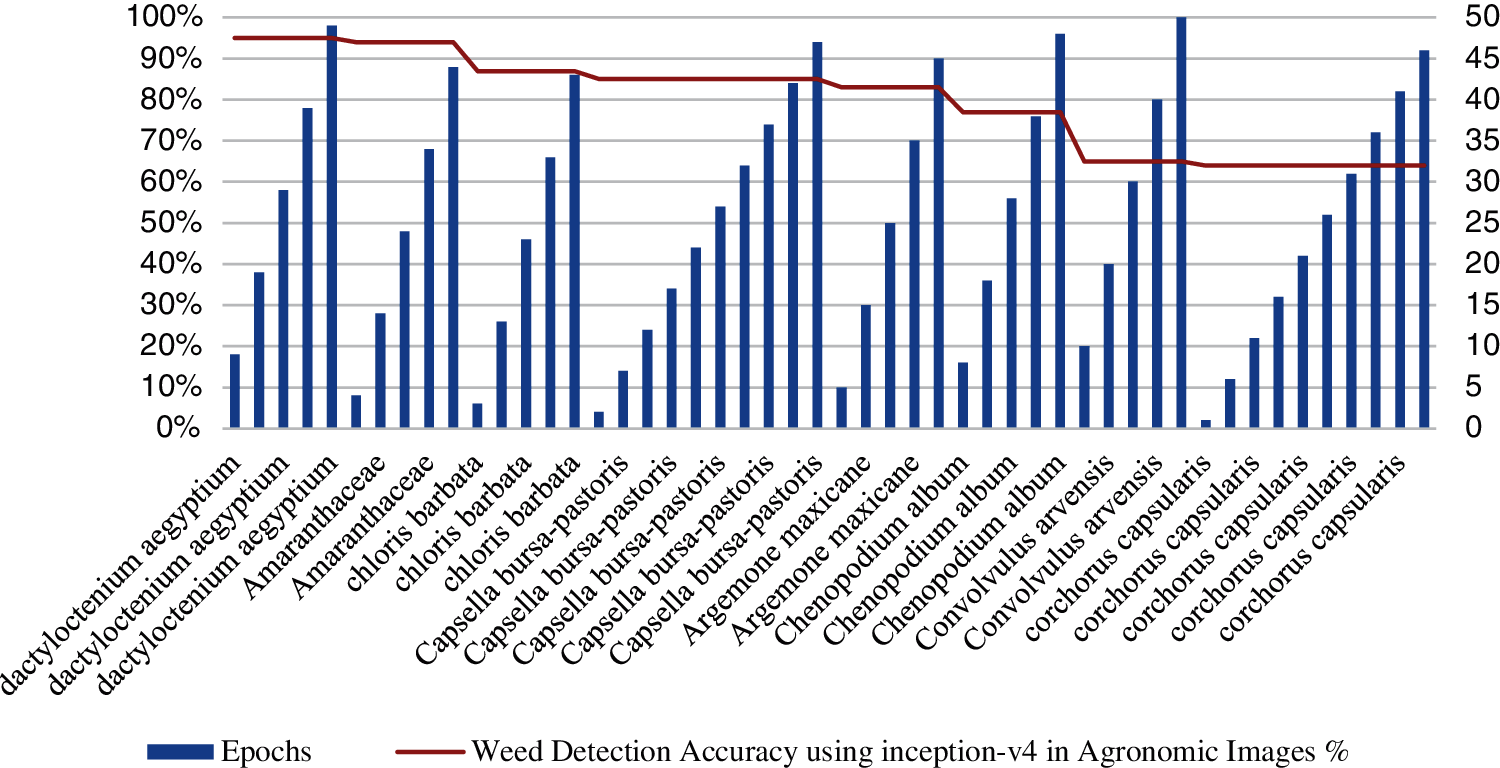
Figure 6: Weed detection using inception-v4 in agronomic images accuracy
In this context, TP represents the images that are successfully identified weed images; TN refers to the alternatives that include weeds without efficiently determining target weeds; the FP represents the target images without weeds that may be incorrectly recognized as targeted weeds and the FN represents the target weeds those aren’t incorrectly determined as weeds. The precision value (Eq. (3)), F1-Score (Eq. (4)) are evaluated for the performance score [33]. The training stopped after epoch 37 to reap the highest comprehensive accuracy without fitting, epoch 38 to 47 achieves the best accuracy using Efficient Net B7 without fitting from 1 to 35 approximately. Eventually, the common accuracy of the 10 different weed classes using Inception V4 turned into 94% and with Efficient Net B7 models turned into 97%.
The distribution of predictions proves that the accuracy of plants having >8 leaves, achieved the best accuracy. Images of few plants having 3, 5, or 7 leaves are the most misclassified images in the training dataset, where the final accuracy is 74%, 55% and 25%. As a result, the number of samples for training classes still has a higher accuracy inside the verification section with Efficient Net B7 architecture as shown in Fig. 7.
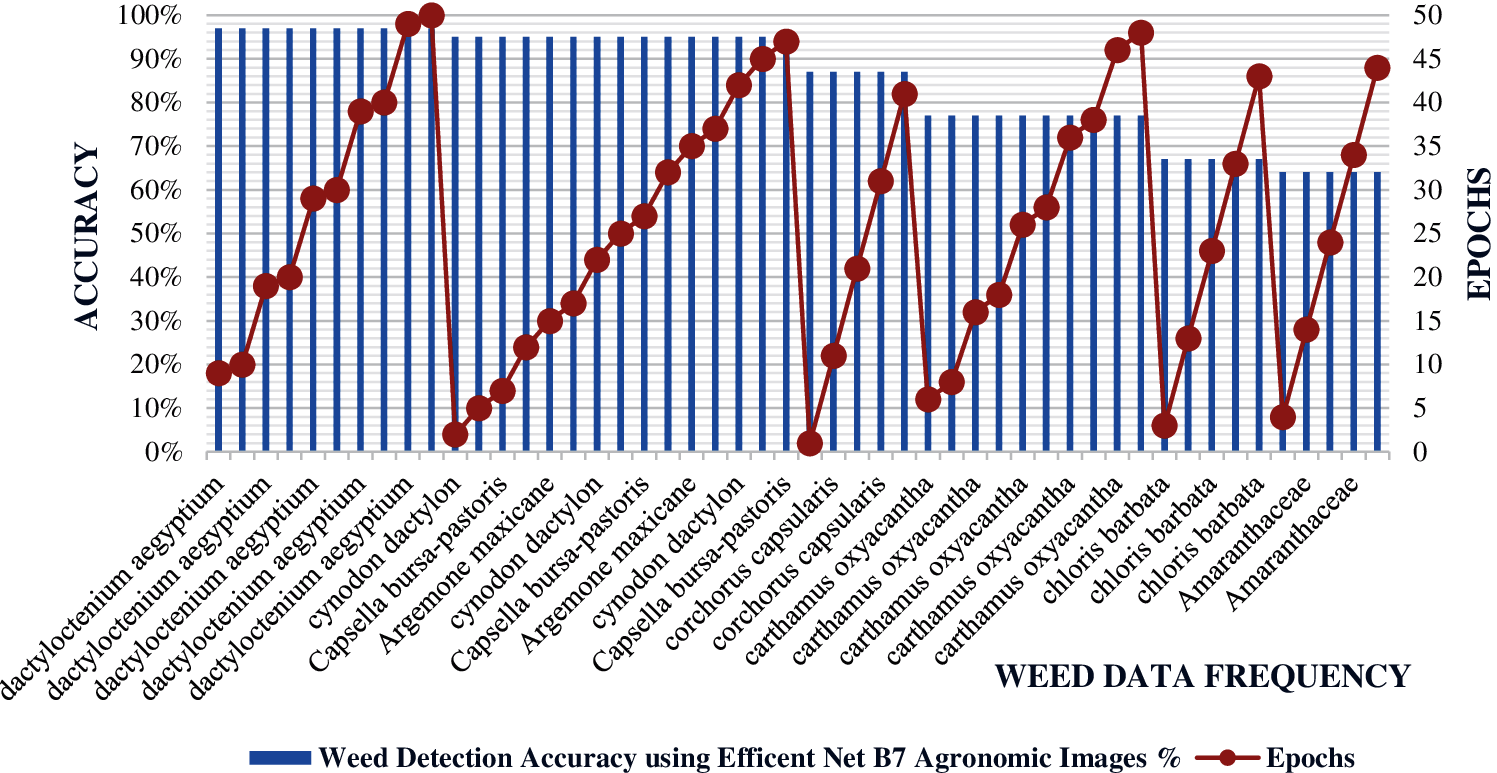
Figure 7: Weed detection using efficient net B7 agronomic images accuracy in 50 epochs
In a study, the results of all approaches were performed in a highly entangled matrix with appropriate parameters, that measures of different neural network architecture virtue were used: Accuracy, Recall and F1 scores [34]. Accuracy is a degree of the way correct the neural community changed into positive detection and it becomes calculated as:
It is a degree of the way effectively a neural network identifies a goal is calculated as:
The harmonic mean of F1-Score calculated by the way of:
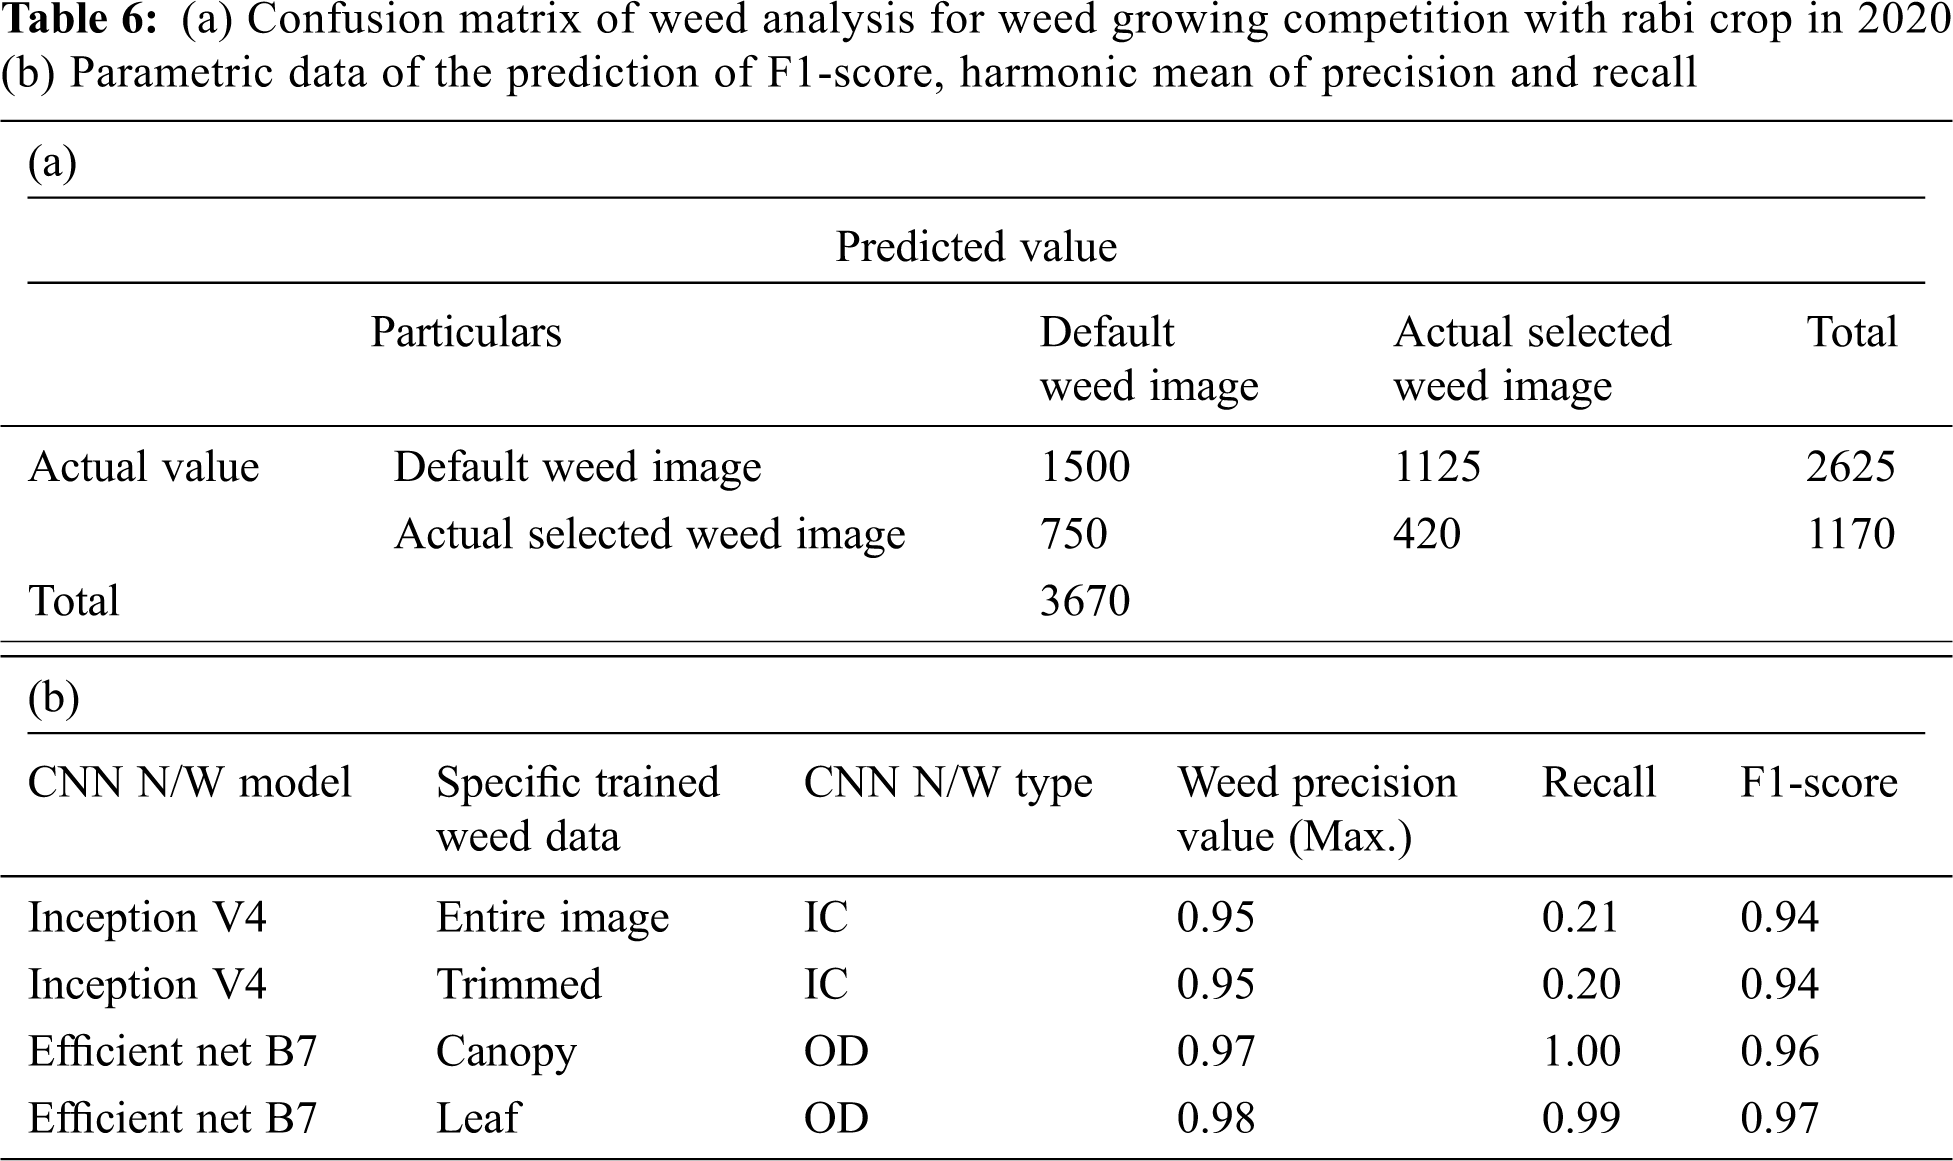
In the confusion matrix, True Positive represents well-grown weeds, True Negative represents those weeds that are efficaciously recognized as plants; False Positive represents plant leaves which can be shown false weed image identification; weeds are incorrectly classified as plants in a False Negative. To assess the fulfillment of the most extensively used measures had been calculated as Accuracy and F1-score. Accuracy is the ratio of True prediction (both True Positives and True Negatives) to the total number of weed images is investigated. F1 score evaluates the binary classification systems, which classify based upon ‘positive’ or ‘negative’. The two different CNN networks first image classification (IC) and the second is object detection (OD) and the confusion matrix is given in Fig. 8. Confusion matrix of weed analysis for weed growing competition with Rabi crop and parametric data of the prediction of F1-Score, harmonic mean of precision and recall is presented in Tab. 6. Based upon effective results, it could be concluded that the improved version can be applied for weed identification and detection, with 97% accuracy using Efficient Net; Due to the fact in these structures, detection produced the largest F1 Score for any CNN with absolute accuracy. The authors no longer isolated any unique weed species using the CNN model but analyze the growth of the weed. Since the 20 epoch had been not identical, the distribution of estimation within the confusion matrix is shown in Figs. 8a and 8b, where the confusion matrix shows that there are exclusive locations of weed growth for accuracy.

Figure 8: (a) Distribution of predicted weed growth (b) Normalized confusion matrix stages
This observation presents a neural network-based technique for improving the evaluation of weed growth due to nutrient observation from the soil. Images with specific soil types (fertile, clay and loamy) are taken with various digital instrument cameras and light conditions are collected inside the fields. The images are presented under field conditions where weeds leaf rotten each other, a neural network that would normally be able to distinguish between them. The illustrations include the common rabi session weed species, which include both monocots and dicot weeds within the rabi season crop. The Efficient Net B7 and InceptionV4 architecture of CNN are used as decision machines. The digital camera-based weed image appears to be a feasible alternative for weed control inside the rabi vegetation in Madhya Pradesh (India). Inception V4 and Efficient Net B7 have achieved an accuracy of 94% and 97% respectively for weed growth identification in Rabi crop for 10 different species. The accuracy of average weed growth at three different locations for these species increased to 97% using Efficient Net B7, which is higher than the Inception V4 architecture of the CNN model. The more density of weed and overlapped weed leaves is an important factor that is affecting crop production. Future studies can discover a more accurate approach with a combined detection technique based on time series data.
Acknowledgement: This study was funded by Taif University Researchers Support Project Number (TURSP-2020/196) Taif University, Taif, Saudi Arabia.
Funding Statement: The authors would like to express their gratitude to King Khalid University, Saudi Arabia for providing administrative and technical support. This work was supported by the Deanship of Scientific Research, King Khalid University, under Grant GRP/358/42 and would also like to thank Taif University Researchers Support Project Number (TURSP-2020/196) Taif University, Taif, Saudi Arabia.
Conflicts of Interest: The authors declare that they have no conflicts of interest to report regarding the resent study.
1. R. Kamath, M. Balachandra and S. Prabhu, “Paddy crop and weed discrimination: A multiple classifier system approach,” International Journal of Agronomy, vol. 2020, pp. 1–14, 2020. [Google Scholar]
2. R. Yasrab, J. Zhang, P. Smyth and M. P. Pound, “Predicting plant growth from time-series data using deep learning,” Remote Sensing, vol. 13, no. 3, pp. 1–17, 2021. [Google Scholar]
3. X. Li, R. Zeng and H. Liao, “Improving crop nutrient efficiency through root architecture modifications,” Journal of Integrative Plant Biology, vol. 58, no. 3, pp. 193–202, 2016. [Google Scholar]
4. K. Keller, N. Kirchgessner, R. Khanna, R. Siegwart, A. Walter et al., “Soybean leaf coverage estimation with machine learning and thresholding algorithms for field phenotyping,” in Proc. British Machine Vision Conf erence, Newcastle, U.K., pp. 3–6, 2018. [Google Scholar]
5. R. Yasrab, J. A. Atkinson, D. M. Wells, A. P. French, T. P. Pridmore et al., “Rootnav 2.0: Deep learning for automatic navigation of complex plant root architectures,” Gigascience, vol. 8, no. 11, pp. 1–16, 2019. [Google Scholar]
6. J. A. Atkinson, M. P. Pound, M. J. Bennett and D. M. Wells, “Uncovering the hidden half of plants using new advances in root phenotyping,” Current Opinion in Biotechnology, vol. 55, pp. 1–8, 2019. [Google Scholar]
7. H. Peng and Q. Li, “Research on the automatic extraction method of web data objects based on deep learning,” Intelligent Automation & Soft Computing, vol. 26, no. 3, pp. 609–616, 2020. [Google Scholar]
8. E. M. Abdelkader, O. Moselhi, M. Marzouk and T. Zayed, “A multi-objective invasive weed optimization method for segmentation of distress images,” Intelligent Automation & Soft Computing, vol. 26, no. 4, pp. 643–661, 2020. [Google Scholar]
9. M. Francis and C. Deisy, “Disease detection and classification in agricultural plants using convolutional neural networks—a visual understanding,” in Proc. 6th International Conference on Signal Processing and Integrated Networks, IEEE, pp. 1063–1068, 2019. [Google Scholar]
10. X. Feng, Y. Zhan, Q. Wang, X. Yang and C. Yu, “Hyperspectral imaging combined with machine learning as a tool to obtain high throughput plant salt stress phenotyping,” The Plant Journal, vol. 101, no. 6, pp. 1448–1461, 2020. [Google Scholar]
11. J. Gao, A. P. French, M. P. Pound, Y. He, T. P. Pridmore et al., “Deep convolutional neural networks for image-based convolvulus sepium detection in sugar beet fields,” Plant Methods, vol. 16, no. 1, pp. 1–12, 2020. [Google Scholar]
12. S. Shorewala, A. Ashfaque, R. Sidharth and U. Verma, “Weed density and distribution estimation for precision agriculture using semi-supervised learning,” IEEE Access, vol. 9, pp. 27971–27986, 2021. [Google Scholar]
13. K. Qaddoum, E. L. Hines and D. D. Iliescu, “Yield prediction for tomato greenhouse using EFuNN,” ISRN Artificial Intelligenc, vol. 2013, pp. 1–9, 2013. [Google Scholar]
14. J. Six, “Plant nutrition for sustainable development and global health article in plant and soil,” Plant and Soil, vol. 339, no. 1, pp. 1–2, 2011. [Google Scholar]
15. A. Olsen, D. A. Konovalov, B. Philippa, P. Ridd, J. C. Wood et al., “Deep weeds: A multiclass weed species image dataset for deep learning,” Scientific Reports, vol. 9, no. 1, pp. 1–12, 2019. [Google Scholar]
16. K. Mochida, S. Koda, K. Inoue, T. Hirayama, S. Tanaka et al., “Computer vision-based phenotyping for improvement of plant productivity: A machine learning perspective,” Gigascience, vol. 8, no. 1, pp. giy153, 2019. [Google Scholar]
17. C. Potena, D. Nardi and A. Pretto, “Fast and accurate crop and weed identification with summarized train sets for precision agriculture,” Advances in Intelligent Systems & Computing, vol. 531, pp. 105–121, 2017. [Google Scholar]
18. Y. Xu, Y. Zhai, B. Zhao, Y. Jiao, S. Kong et al., “Weed recognition for depth wise separable network based on transfer learning,” Intelligent Automation & Soft Computing, vol. 27, no. 3, pp. 669–682, 2021. [Google Scholar]
19. J. A. Atkinson, M. P. Pound, M. J. Bennett and D. M. Wells, “Uncovering the hidden half of plants using new advances in root phenotyping,” Current Opinion in Biotechnology, vol. 55, pp. 1–8, 2021. [Google Scholar]
20. J. Y. Kuo, C. H. Liu and H. C. Lin, “Building graduate salary grading prediction model based on deep learning,” Intelligent Automation & Soft Computing, vol. 27, no. 1, pp. 53–68, 2021. [Google Scholar]
21. A. Mishra and V. Gautam, S. S. Technology, “Monocots and dicot weeds growth phases using deep convolutional neural network,” Solid State Technology, vol. 63, no. 9, pp. 6950–6962, 2021. [Google Scholar]
22. N. T. Son, C. F. Chen, C. R. Chen, P. Toscano and C. H. Syu, “A phenological object-based approach for rice crop classification using time-series sentinel-1 synthetic aperture radar (SAR) data in Taiwan,” International Journal of Remote Sensing, vol. 42, no. 7, pp. 2722–2739, 2021. [Google Scholar]
23. Y. Song, H. Sun, M. Li and Q. Zhang, “Technology application of smart spray in agriculture: A review,” Intelligent Automation & Soft Computing, vol. 21, no. 3, pp. 319–333, 2015. [Google Scholar]
24. A. M. Mishra and V. Gautam, “Weed species identification in different crops using precision weed management: A review,” in Proc. of CEUR Workshop, Delhi, India, vol. 2786, pp. 180–194, 2021. [Google Scholar]
25. M. Rahaman, D. Chen, Z. Gillani, C. Klukas and M. Chen, “Advanced phenotyping and phenotype data analysis for the study of plant growth and development,” Frontiers in Plant Science, vol. 6, pp. 619, 2015. [Google Scholar]
26. F. Lopez Granados, “Weed detection for site specific weed management: Mapping and real time approaches,” Weed Research, vol. 51, no. 1, pp. 1–11, 2011. [Google Scholar]
27. N. Teimouri, M. Dyrmann, P. R. Nielsen, S. K. Mathiassen, G. J. Somerville et al., “Weed growth stage estimator using deep convolutional neural networks,” Sensors (Switzerland), vol. 18, no. 5, pp. 1–13, 2018. [Google Scholar]
28. K. Osorio, A. Puerto, C. Pedraza, D. Jamaica and L. Rodríguez, “A deep learning approach for weed detection in lettuce crops using multispectral images,” AgriEngineering, vol. 2, no. 3, pp. 471–488, 2020. [Google Scholar]
29. S. Khan, M. Tufail, M. T. Khan and Z. Khan, “A novel semi-supervised framework for UAV based crop/Weed classification,” PLoS ONE, vol. 16, no. 5, pp. e0251008, 2021. [Google Scholar]
30. S. K. Marwat, K. Usman, N. Khan and M. U. Khan, “Weeds of wheat crop and their control strategies in dera ismail khan district, khyber pakhtun khwa, Pakistan,” American Journal of Plant Sciences (AJPS), vol. 4, no. 1, pp. 66–76, 2013. [Google Scholar]
31. Y. Xu, R. He, Z. Gao, C. Li, Y. Zhai et al., “Weed density detection method based on absolute feature corner points in field,” Agronomy, vol. 10, no. 1, pp. 113, 2020. [Google Scholar]
32. M. Dadashzadeh, A. Abbaspour-Gilandeh, Y. Mesri-Gundoshmian, T. Sabzi, S. Hernández-Hernández et al., “Weed classification for site-specific weed management using an automated stereo computer-vision machine-learning system in rice fields,” Plants, vol. 9, no. 5, pp. 559, 2020. [Google Scholar]
33. F. Emmertstreib, S. Moutari and M. Dehmer, “A comprehensive survey of error measures for evaluating binary decision making in data science,” Wiley Interdisciplinary Reviews: Data Mining and Knowledge Discovery, vol. 9, no. 5, pp. e1303, 2019. [Google Scholar]
34. S. Ali, M. Hassan, M. Saleem and S. F. Tahir, “Deep transfer learning based hepatitis B virus diagnosis using spectroscopic images,” International Journal of Imaging Systems and Technology, vol. 31, no. 1, pp. 94–105, 2021. [Google Scholar]
 | This work is licensed under a Creative Commons Attribution 4.0 International License, which permits unrestricted use, distribution, and reproduction in any medium, provided the original work is properly cited. |