DOI:10.32604/iasc.2022.020163
| Intelligent Automation & Soft Computing DOI:10.32604/iasc.2022.020163 | |
| Article |
Severity Grade Recognition for Nasal Cavity Tumours Using Décor CNN
Department of Computer Science and Engineering, School of Computing, SRM Institute of Science and Technology, Chengalpattu, Tamil Nadu, 603203, India
*Corresponding Author: Prabhakaran Mathialagan. Email: prabhakaran_mathialagan@srmuniv.edu.in
Received: 12 May 2021; Accepted: 18 June 2021
Abstract: Nasal cavity and paranasal sinus tumours that occur in the respiratory tract are the most life-threatening disease in the world. The human respiratory tract has many sites which has different mucosal lining like frontal, parred, sphenoid and ethmoid sinuses. Nasal cavity tumours can occur at any different mucosal linings and chances of prognosis possibility from one nasal cavity site to another site is very high. The paranasal sinus tumours can metastases to oral cavity and digestive tracts may lead to excessive survival complications. Grading the respiratory tract tumours with dysplasia cases are more challenging using manual pathological procedures. Manual microscopic biopsy tissue analysis is time consuming and chances of occurring interobserver variability problems are very high. To avoid nasal cavity tumour grade misclassification a State-Of-The-Art Automated Décor CNN model is proposed. The automated nasal cavity tumour grading classification model is designed to troubleshoot the stain artifact present in the biopsy tissue samples. Major nasal cavity sites are analysed to find the abnormal epithelium. The automated morphological characteristic findings with décor CNN model in biopsy images are promising. The model achieves the classification accuracy of 98% with less training, testing and validation errors compared to other transfer learning convolution neural network models.
Keywords: Nasal cavity; dysplasia; tumour; deep learning; classification; pathology
Upper Aero Digestive Tract is the combination of oral cavity and nasal cavity. oral cavity sites are connected from tongue, oropharynx, gastro oesophageal junction, oesophagus, retromolar, lips, buccal mucosa and hard palate. Nasal cavity sites are combined with larynx, supraglottic, post acoid growth and nasopharynx. The common type of nasal cavity tumour mostly occurs in the inner lining of the respiratory Para Nasal Sinus (PNS) squamous epithelial cells [1]. The changes that occur in the morphology or characteristics of normal cells turns in to epithelial squamous cell carcinoma. The American cancer society discussed the complexity of manual microscopic morphological characteristic analysis in finding the tumours at the early stage in undifferentiated type of tumours [2]. The major functionality of respiratory tract is to control and maintain the good air quality while inhaling. The inner linings of the nasal cavity epithelium are very sensitive and inhaling the air that contains carcinogens will prone to DNA damage and causes cancer. Basically, Upper Aero UADT tumours are formed by the abnormal growth of cell and nuclei and the different stages of tumours are diagnosed based on the morphological characteristics of cell and nuclei. Using manual pathological procedures differentiating the benign and malignant tumours are possible with moderate time consumption. Grading the benign and malignant tumour states is still challenging among the pathologists. When every pathologist uses the manual microscopic analysis, it leads to inter observer variability problem which is very much essential to be addressed. In recent years the contribution of Artificial Intelligence and machine learning is very high in supporting the physicians to handle the critical issues in human body and to predict the diagnostic results very quickly with good precision. Mostly deep learning models are developed to assist the physicians in solving the inter observer variability problems appears during tumour staging analysis. To overcome the pathological, inter observer variability problems, it is proposed to develop a new deep CNN model for UADT nasal cavity tumour grading classification. The proposed automated CNN model is capable to classify the stages of benign and malignant nasal cavity tumour gradings with less time consumption. The rest of the paper is organised as follows; literature reviews of nasal cavity tumour analysis are summarized in Section 2. Materials and methods are discussed in Section 3. Proposed methodology is discussed in Section 4. In Section 5 results obtained are discussed and compared with other existing CNN models.
Recently computer aided models and CAD systems are developed to extend its support for medical domain. Every year with the growth of technology in AI field automated system contribution is improved to provide quality health care prediction. Lately machine learning and deep learning models are developed to automate the tumour diagnostic process with less time consumption and mainly to reduce the man power. Manual tumour detection and classification involves long term process for final result and in some cases, pathologists are facing observer variability problems while grading the dysplasia type of tumours. To avoid such complications recent research shows the tremendous growth in Computer Aided System using different imaging types like CT, MRI and Biopsy image dataset for automated detection and classification. The literature study focuses on the importance, growth and contribution of artificial intelligence in health care and proper disease prediction. Different machine learning and computer vision techniques used for detection and classification is included in this literature analysis. In [3] Aparna et al., discussed the statistical analysis of nasal cavity tumours occurring in different age groups for the period of two years from 2016 to 2018. Out of the study it was observed that nasal cavity benign tumour occurs more in men than women. Different benign tumours are diagnosed and graded like sinonasal polyps, fungal sinusitis, cyst and inflammation in many patients from the age 31 to 40. It was observed that for different age groups there is a variation in tumour gradings. In [4] Dean et al., conferred the nature of Sinonasal cavity tumours as well differentiated and poorly differentiated gradings. Using CT images author discussed the new type of benign tumour called seromucous hamartoma which has the morphology of having higher seromucous glands filled in the bilateral olfactory site. It was observed that the respiratory epithelial adenomatoid hamartoma and seromucous hamartoma can be differentiated with soft-tissue CT images and bone frank erosion level must be considered. In [5] Aftab Ahmed et al., identified a unique type of benign tumour Sinonasal hemangiopericytomas (SH), that frequently occurs in the nasal cavity. Fifty-five-year-old men patient with (SH) was monitored using CT of nasal cavity soft tissue along with its histopathology morphological characteristics and it was found and confirmed that the SH tumour is non-neoplastic tumour. Author stated that though the case is non critical and it was surgically removed, the patient must undergo a lifelong follow up for either radiotherapy or chemotherapy. In [6] Michela et al., studied-on imaging biomarkers for gastro intestinal cancer to understand the morphology of Upper Aero Digestive Tract (UADT) tumours. Author discussed different characteristics and evaluation of benign and malignant UADT tumours using biomarkers. And also stated the disadvantages of CT and MRI images are less supported in grading oropharyngeal tumours. In paper [7] Sugoto Mukherjee et al., discussed the complexity of MRI/CT images for tumour detection and grading the tumour stages. The contrast variance in MRI images and number of slices recorded while capturing is not sufficient and it is quite hard to recognize the patterns in dysplasia tumour grades. In [8] Bayu et al., reviewed the importance and contributions of machine learning in medial field and mainly in tumour recognition and classification. Around 460 articles were reviewed and discussed elaborately about the machine learning and deep learning influence on medical imaging for detection and classification. Also, author has discussed the importance of Artificial Intelligence in medical domain for developing the automated system in disease diagnosis. In [9] author proposed an automated deep learning model to detect and classify nasopharyngeal carcinoma using MRI images. The research focused on detecting the benign hyperplasia type tumours in nasal cavity using 3D DenseNet. The dataset includes 3142 carcinoma images and 958 benign images for training and validation. The proposed DenseNet model used to train and validate was observed with data loss during training as well as validation and the model developed misclassifies the adenoid hyperplasia tumour as benign hyperplasia tumour. The overall performance of the DenseNet model was noted with the average sensitivity of 95%. In [10] Melek akcay et al., proposed an automated machine learning model to evaluate the prognosis of nasopharyngeal cancer. The study was conducted with 72 patients who are diagnosed with nasopharynx cancer and undergone chemotherapy with proper follow ups. To prepare the survival prediction model for the cancer patients, authors used the dataset that includes patient details, tumour type and treatments followed by the individual patient. The automated prediction model was developed using different machine learning techniques like Logistic Regression, Artificial Neural Network, XGBoost, Support-Vector Clustering, Random Forest, and Gaussian Naive Bayes. The prognosis prediction results with 88% accuracy using Gaussian Naïve Bayes algorithm. In [11] Martin Halicek et al., proposed a deep learning model to develop an automated cancer screening model using hyperspectral tissue images. Different imaging modalities were used to detect the squamous cell carcinoma present in the biopsy tissue samples extracted from the cancer suspected patients. Out of four different imaging models the autofluorescence images can detect the SCC with HPV disease and 98% classification accuracy. In [12] author developed a deep learning model to detect and classify the nasopharyngeal benign and malignant tumours. The model proposed utilized 726 nasopharynx biopsy images to classify the tumours with squamous cell carcinoma from benign tumours. In addition to that a patch-wise classification algorithm was proposed to classify the carcinoma tumours and achieved 0.99 AUC. Using GRAD-CAM algorithm malignant tumour cells were detected from individual nasopharynx biopsy image patches. The proposed patch wise deep learning model reacts inferior to detect and classify dysplastic tumours. In [13] Sapra et al., proposed an ensemble machine learning method to predict the invasive and non-invasive coronary artery disease. Authors used five different machine learning technique and a deep learning model to develop and identify the best automated disease prediction system. Z-Alizadeh coronary artery disease dataset is used to measure the performance of ensemble machine learning techniques. It was observed that gradient boosted tree algorithm achieved with 84 percent accuracy. Comparative analysis is done with Cleveland heart disease dataset out of which gradient boosted tree technique achieved the better performance with 84 percent accuracy and 16 percent error rate.
Nasal cavity tumours occur at the upper part of the respiratory system and it typically arises at the inner lining of the epithelium. Tumour stages will be predicted by using both clinical and pathological staging methods. Clinical staging is important to analyse the tumours in pathological way which can expose the entire morphological characteristics of the tumour [14].
To improve the quality of tumour diagnosing process an automated system is invoked to analyse the nasal cavity tumour tissues and classify the tumour grades based on the morphological features. The décor CNN automated system architecture is proposed to achieve the best classification result as shown in Fig. 1.
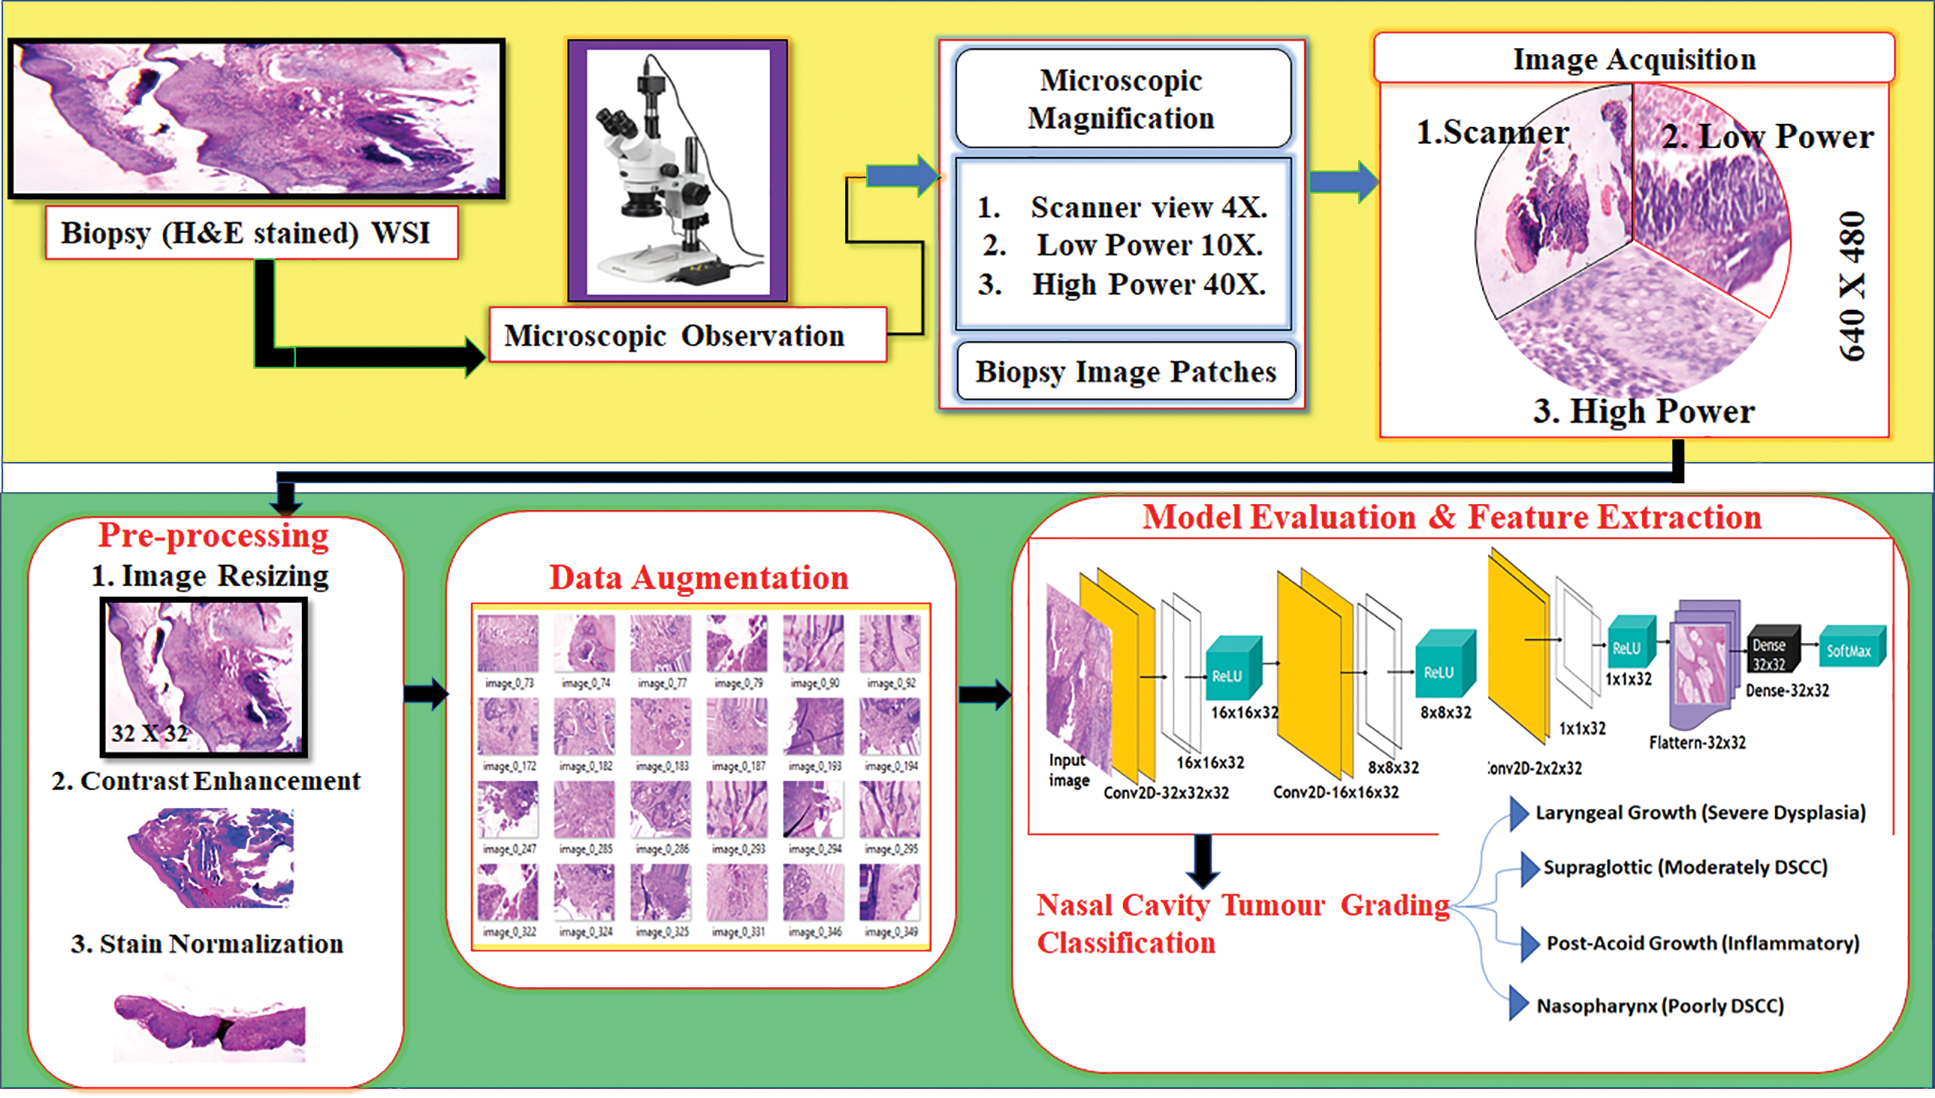
Figure 1: Nasal cavity tumour grading system architecture
The Upper Aero-Digestive Tract nasal cavity biopsy tissue samples of four different nasal cavity sites like Laryngeal growth, Supraglottic, Post-Acoid growth and Nasopharynx was collected under pathologist supervision from Vellore Medical College Hospital, department of pathology (Ref. No.1258/H&FW (MCA3)/dept. Dt: 18-05-2018). Totally 1425 whole slide images were captured from different oral cavity sites with different oral cavity gradings like Well differentiated, poorly differentiated, moderately differentiated, In-situ, No evidence of malignancy, Severe dysplasia, Mild dysplasia and inflammatory pathology. Sample biopsy tissue images with 4X, 10X and 40X microscopic magnifications and its distribution are shown in Fig. 2.
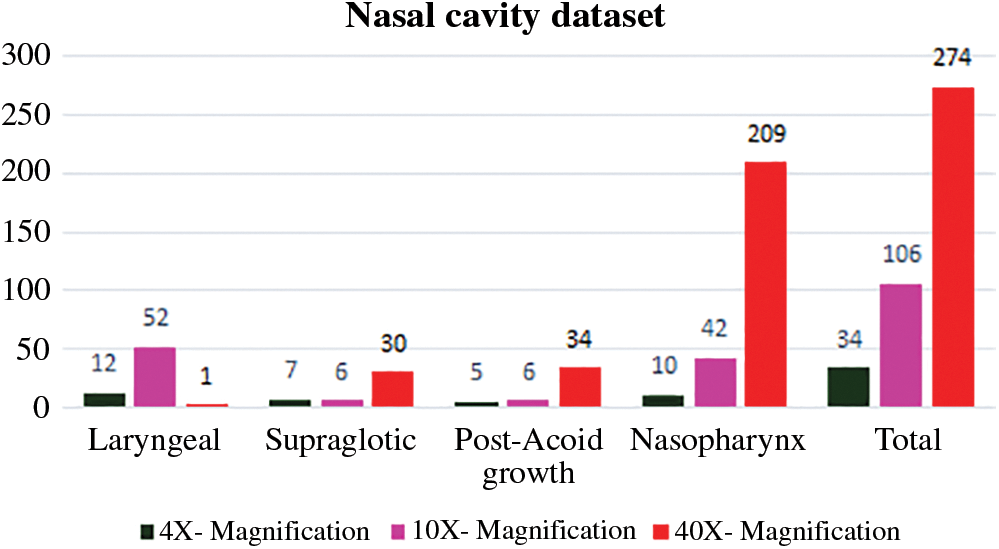
Figure 2: Nasal cavity biopsy digital image dataset
The biopsy glass slide preparation involves different stages like glass slide waxing, staining and finally fixing which is done to analyse the morphology of the tissue through microscope. During the slide preparation different artifacts like excess stains, water blobs and torn tissues may occur that spoils the morphological behaviour of the tumour tissue samples. During digitizing, process like improper microscopic magnification settings and the image captured using digital camera may provide noisy data. To provide the proper automation system for tumour grading process the training data must be in good quality and for this the system involves different pre-processing technique 1. Detecting and normalizing the stain artifacts and 2. Background separation.
3.2.1 Stain Normalization and Background Deduction
To prepare the quality biopsy image dataset the pre-processing step involves a multiple personality behavioural image processing technique called decorrelation stretching and also known as decorrelation contrast stretching (decor). A decorrelation stretching technique is incorporated with PCA in order to preserve the edges of the spectral images and to retain the geometrical features of the images [15,16]. Here the decor technique properties are utilized in RGB image to enhance the intensity of the image pixels and helps to normalize the stain artifacts present in the tissue samples with background deduction.
3.2.2 Decorrelation Contrast Stretching (Décor)
The step-by-step process of decorrelation stretching technique is explained in this section.
• Step.1: Consider the image f (x, y) as ‘I’; Biopsy colour image with three channels Red, Green and Blue (RGB) as ‘C’; the number of pixels in an image as ‘n’; where Vj,i is the value of j th pixel in each colour channel C.
• Step:2. Calculate the sum of pixels of each channel.
• Step:3. Calculate the covariance matrix of the colour image channels R, G and B.
Covariance for single channel matrix is calculated using Eq. (2).
Here, x’ and y’ are the mean value of the biopsy image; ‘N’ is the number of images; ai, bi is the individual pixel of an image.
The covariance of all the three channels (R, G, B) is calculated using Eq. (3).
• Step:4. Calculate the correlation matrix for R, G and B channels using Eq. (4).
• Step:5. Calculate the Rotation matrix (“RM”).
The rotational matrix is calculated using the ‘Eigenvectors’ which is calculated from the correlation matrix.
• Step:6. Calculate the Stretching Vector ‘S’.
The stretching vector ‘S’ is calculated by the reciprocal of each ‘Eigenvalue’ multiplied with standard deviation ‘σ’).
• Step:6. Calculate the Transformation matrix ‘Z’.
Rotation matrix and Stretching matrix is composed to obtain the Transformation matrix ‘Z’. The matrix multiplication is done to obtain the transformed matrix ‘Z’ using Eq. (5).
Fig. 3 shows the contrast stretching technique applied on 4X magnified Whole Slide Image (WSI). Fig. 3a shows the original image before décor technique applied on the image. Fig. 3b shows the image with removed background details and contrast enhanced image with highlighted stain artifacts. The PSNR value is calculated before and after décor stretching and it was noted with 32.9 db. and 32.27 db. The technique achieved the expected result with background separation and contrast enhancement of epithelial and connective tissue. The obtained PSNR results shows that the image quality is degraded with the maximum of 0.63 dB due to the noise compared to original image. To avoid this, median smoothing filter is applied and is shown in Fig. 3b which reduces the noise present in the image and PSNR is noted with 46.92 dB as shown in Fig. 3c.

Figure 3: Decorrelation contrast stretching; (a) Before decorrelation contrast stretching; (b) Background separated image; (c) Noise reduced image after decorrelation stretching
Fig. 4a shows the stain normalized biopsy whole slide image; RGB colour contrast enhanced image 4b; colour inversion and sobel edge detection applied to extract the region of epithelial, connective tissue and stain artifacts present in the image and it is noted with by setting maximum threshold value of 247 in Figs. 4c and 4d; applied thresholding on the sobel edge detected image with ‘254’ threshold value to extract and normalize the stain artifacts present in the biopsy image as shown in Fig. 4e.

Figure 4: Stain artifact recognition and normalization; (a) Original biopsy WSI; (b) Decor stretched image; (c) Applied color inversion on figure 4(b); (d) Applied sobel edge detection on figure 4(c); (e) Applied thresholding on figure 4(d) to find stain artifacts
3.2.3 Epithelial Tissue Extraction
Upper aero digestive tract tumours occur at the inner lining of the epithelium. However, the nasal cavity and Para Nasal Sinuses (PNS) benign and malignant tumour occurs in both epithelial and mesenchymal origin. Ninety percent of the Squamous Cell Carcinoma (SCC) occurs at the epithelial tissue and metastasis get activated from one place to another place in the human body. Detecting the spread of epithelium is important to find the spread of tumours and metastasis level. Different WS microscopic biopsy images were used to detect and analyse the spread of epithelium. Laryngeal growth (Severe Dysplasia), supraglottic growth (MDSCC) and nasopharynx (Inflammatory Pathology) 4X magnified biopsy digital images are taken to find the location of distributed epithelium tissue with four step by step image processing steps.
Step 1: Biopsy 4X magnified images.
Step 2: Heat map is generated on the RGB image to highlight the difference between the epithelium, connective tissue and background of the slide image.
Step 3: Conversion of heap map generated image to Grayscale image to differentiate the Hematoxylin and Eosin stains in the biopsy tissues.
Step 4: Applied thresholding operation with threshold value ‘T’ as 110.
In Fig. 5 three different 4X magnified Whole Slide biopsy images were taken to analyse the spread of epithelium. Using four different image processing steps the epithelial tissues are extracted from the slide images. Biopsy WSI is shown in Fig. 5a; heatmap generated image is shown in Fig. 5b; Fig. 5c shows the grayscale converted image; Fig. 5d shows the extracted epithelium by applying thresholding operation.

Figure 5: Epithelial tissue extraction; (a) Biopsy WSI; (b) Heat map generated on WSI; (c) Greyscale conversion is applied on figure 5(b); (d) Binary threshold is applied to extract the epithelial region from figure 5(c)
Computer aided automated systems are developed using artificial intelligence for automatic prediction and classification to solve the real time problems faced in the health care domain. The real time healthcare hypothesis like dysplasia tumour detection, tumour grade classification and patient's survival prediction are facing problems now a days. To solve the problem different machine learning model must be trained with good quality and equally distributed data samples in each class.
Fig. 6 shows the biopsy sample distribution after augmentation for four different nasal cavity tumour grades. After augmentation technique each class images are almost equally distributed to train the CNN model without overfitting and tries to achieve good classification accuracy. To maintain the balanced samples in each class the data augmentation technique is used to increase the training samples and solve the overfitting problem that arises in any machine learning model. To avoid the CNN training complications the proposed work is intended to generate the samples using different transformation operations like, rotation (vertical and horizontal rotation), width shifting, shearing, zooming and horizontal and vertical flipping were applied to extend the samples equally in all the classes taken for classification as shown in Fig. 6.
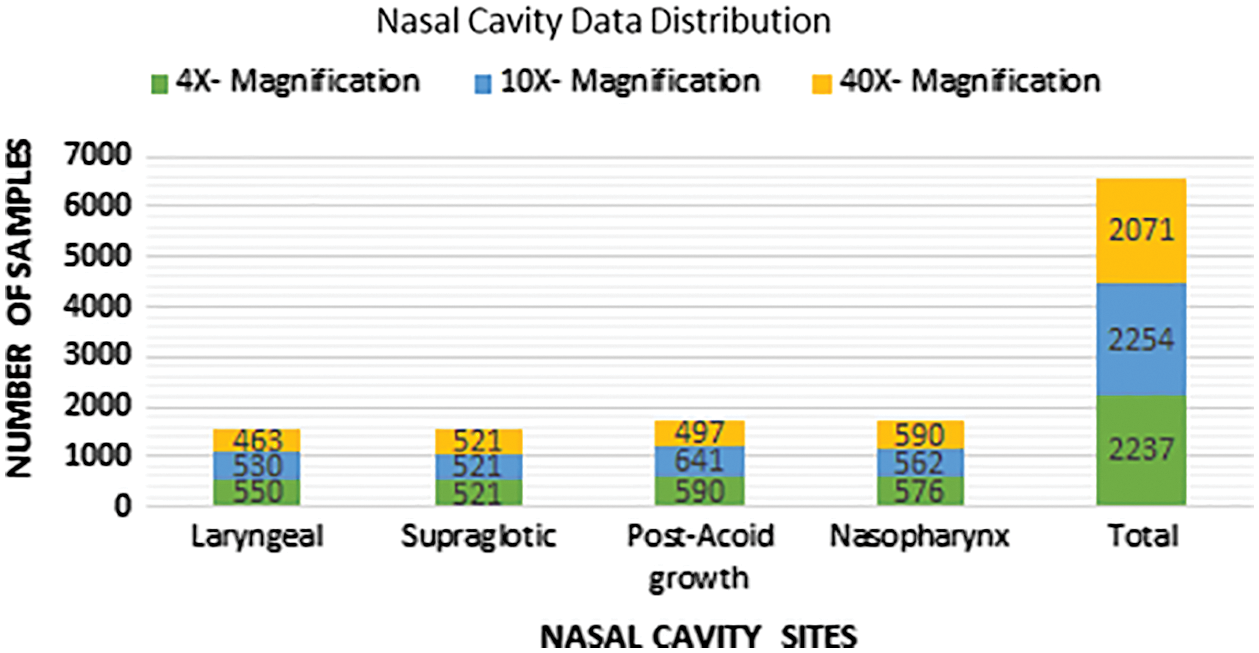
Figure 6: Data distribution after augmentation
3.4 Nasal Cavity Tumour Grade Classification Using Décor CNN
Computer Aided Automated Systems are developed to reduce the human intervention and to improve the accuracy with less time consumption. Computer Aided Systems implemented using Deep Convolutional Neural Networks increases their impacts in health-related problems [17]. To solve the healthcare related problems an artificial intelligence and machine vision participation is very much essential to achieve with good accuracy. To develop such automated system for our UADT nasal cavity tumor grading classification, we developed a Décor CNN model. The model is proposed to solve the interobserver variable problems that arises among the pathologists who follows the microscopic tissue analysis process. Convolution Neural Networks are developed to extract the features automatically from the data samples used for training. Different CNN layers were built together to make the remarkable tumor grading classification model. Each CNN layers have its own property to extract features and solve the linearly inseparable data samples in each class. The proposed work is implemented to provide the automated tumor grade classification model for UADT nasal cavity tumors. The dataset consists of 4 different classes like Laryngeal growth (Severe Dysplasia), Supraglottic growth (Moderately Differentiated Squamous Cell Carcinoma), Post acoid growth (Inflammatory growth) and Nasopharynx (Poorly Differentiated Squamous Cell Carcinoma). The dataset consists benign, dysplasia and malignant type tumor biopsy slide images with 6759 images after augmentation.
The proposed Décor CNN model consists of eighteen layers that includes input layer convolution layer, pooling layer, fully connected dense layer and output layer. Fig. 7 shows the step-by-step process of feature extraction and nasal cavity tumor grade classification using décor CNN classifier. The convolution neural network is basically a sequence of convolution and pooling layers to extract the feature map using input image and feature detectors. Consider the equation
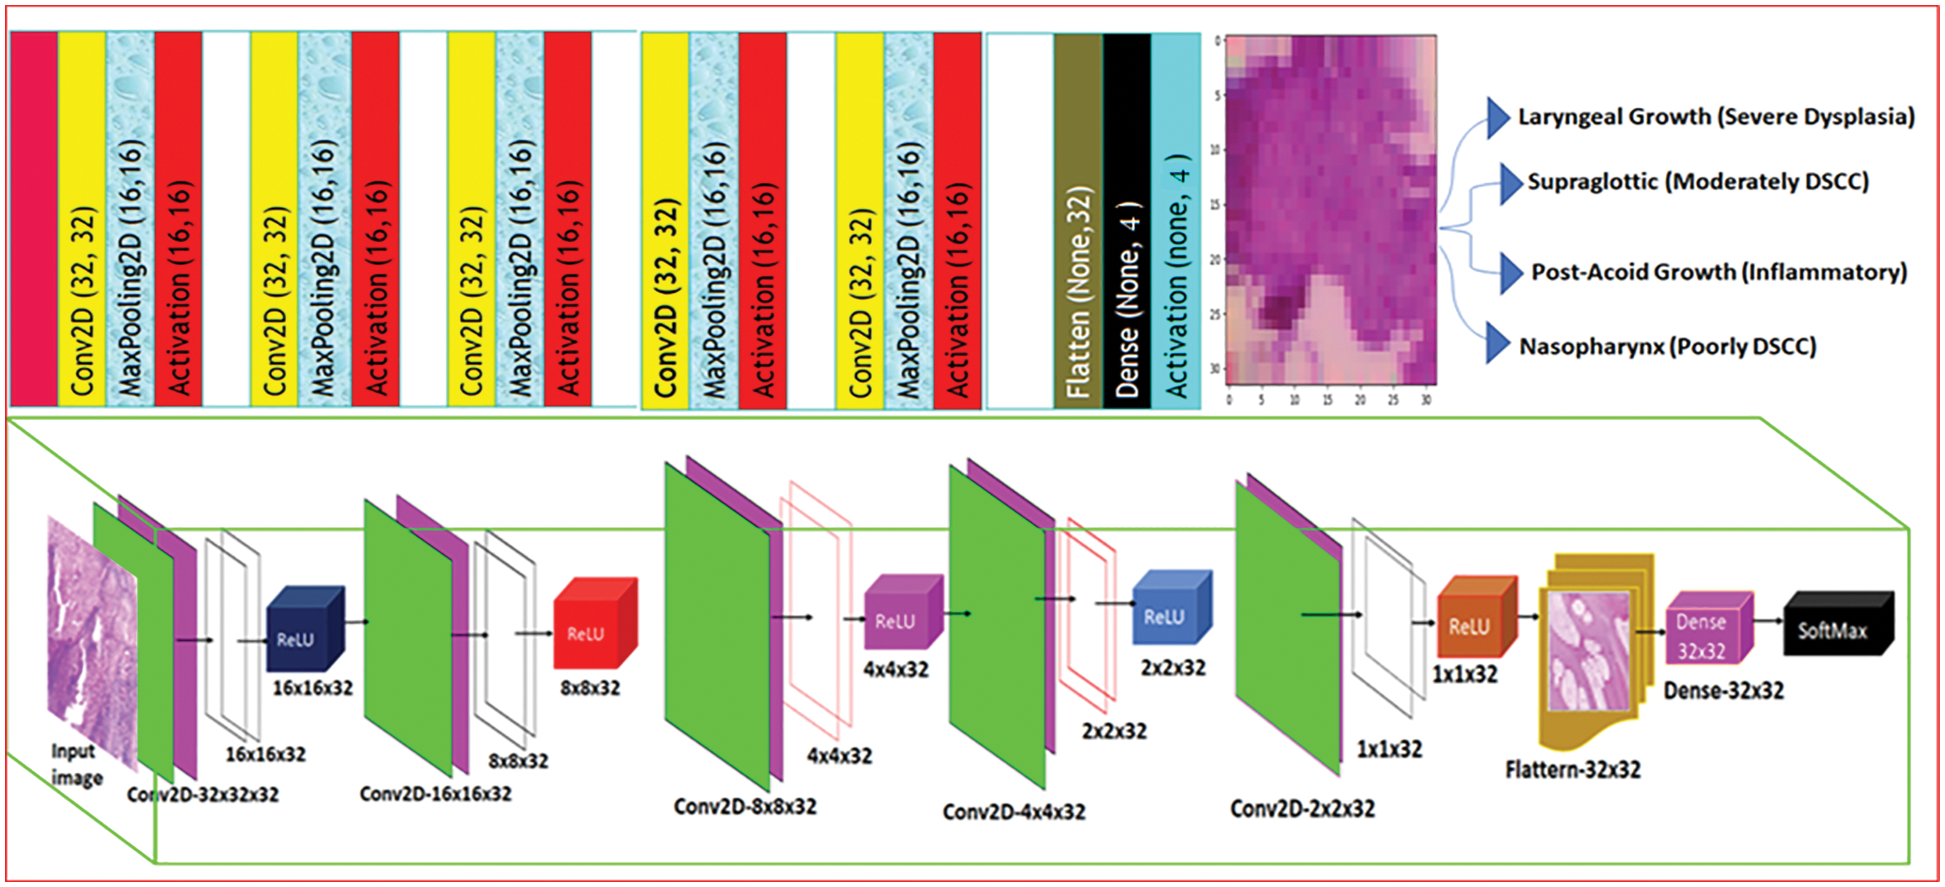
Figure 7: Décor CNN tumour grade classification model
3.4.1 Décor CNN Model for Nasal Cavity Tumour Grade Classification
In every convolution layer each convolution operation is applied on the patches of the image based on the size of the feature detector or kernel or weights.
where it (x, y) denotes an element of the image patch tensor IT multiplied using the convolution kernel
A pooling layer is the second layer used in all the convolutional neural network. After every convolution operation the feature map extracted using the feature detector. Once the biopsy morphological first level ROI features gets extracted it was observed that the exact location of each ROI got misplaced. We applied pooling operation to preserve the position of different epithelial tissue and to down sample the background and connective tissues from WSI.
Eq. (8) shows the max pooling operation MP on the feature map extracted from the convolution operation. Where
To normalize the output generated after pooling operation ReLU activation function as shown in Eq. (9) is used to quicken the learning process. The proposed CNN model uses ReLU as the initial activation function because the function has the range from (0 to ∞) and the function will not approximate the identity near the origin. The CNN model used for classification will not avail the backpropagation errors while training the network. The derivative of the ReLU activation function is given in Eq. (10).
Eq. (10) is denoted as VR to get the output from every after max pooling layer.
Eq. (11) shows the ReLU activation operation on the feature map extracted from the max pooling operation. Where
Fully connected layer always used at the final layer of all CNN and it is used to classify the features extracted and predict the classes based on the expected output. The proposed CNN model uses sigmoid activation function in the dense layer. UADT nasal cavity class label is predicted using SoftMax function because of its non-linear and differentiable property. The SoftMax function is shown in Eq. (12). The derivative of SoftMax function is shown in Eq. (13).
Eq. (14) shows the ReLU activation operation on the feature map extracted using max pooling operation. Where
In this section we discuss the results obtained from proposed décor CNN classification model for four nasal cavity tumour grade classes with 6759 images in total. The Décor CNN model is developed using TensorFlow, Nvidia Titan XP GPU with 12.0 GB frame buffer, core Clock: 0.954 GHz, core Count:2, Memory Size: 2.00GiB and Memory Bandwidth: 13.41GiB/s. The UADT nasal cavity dataset is split as 7:2:1 distribution like (70% for training, 20% for testing and 10% of data were randomly chosen for validation). With the above distribution the model achieved 0.99% training accuracy, 0.98% validation accuracy and classification losses are noted with 0.1% in training and 0.8% in validation, as shown in Fig. 8.

Figure 8: Nasal cavity tumour grade classification report
In Fig. 9 Confusion matrix is calculated for four class nasal cavity tumour grade classification and it was noted that the proposed décor CNN model achieved 0.98% validation accuracy, 0.98 average F1-score, 0.98 true positive rate and 0.98 average sensitivity rate for four nasal cavity tumour gradings.
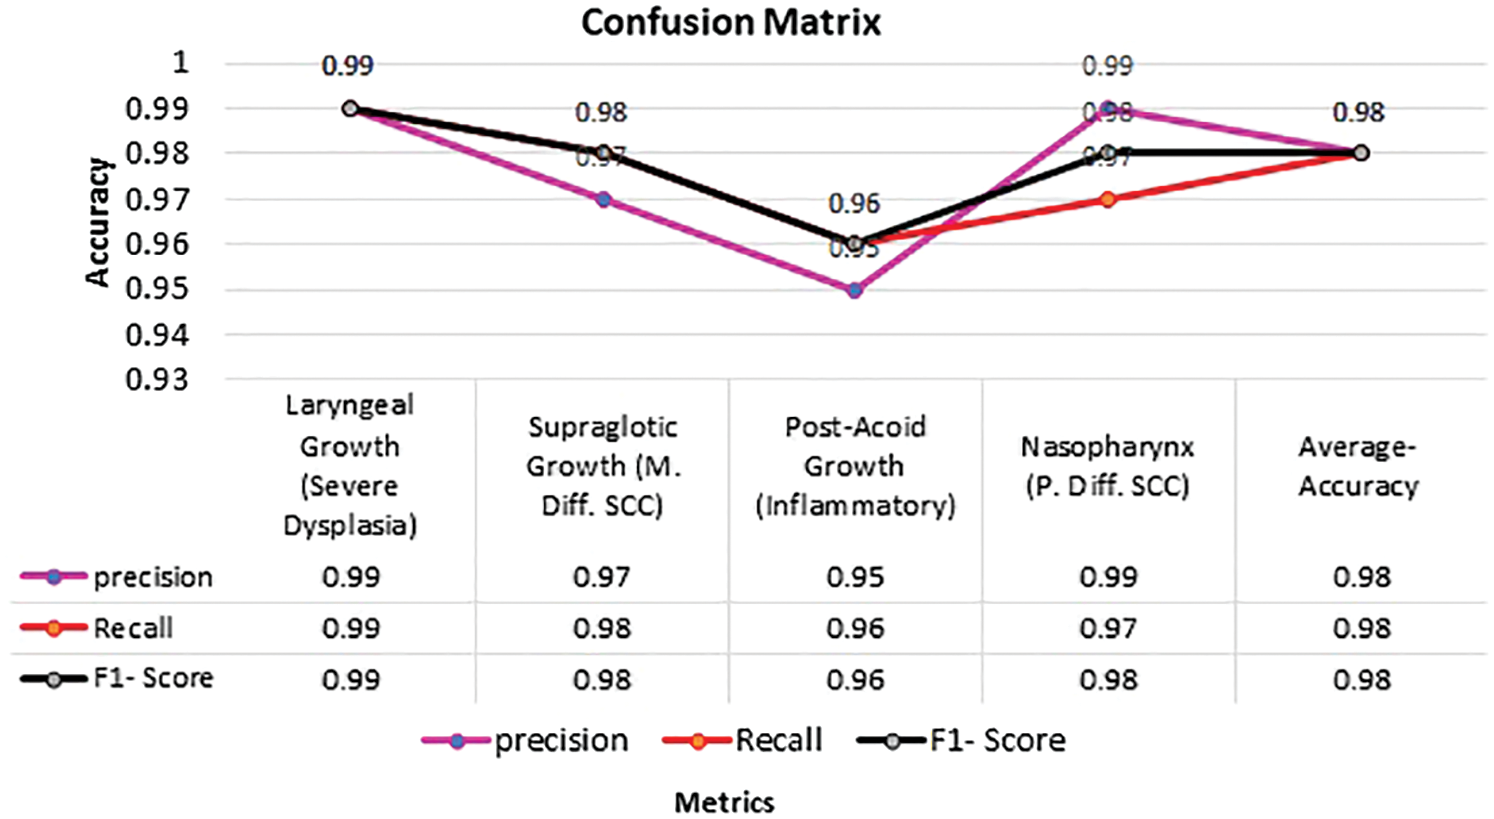
Figure 9: Confusion matrix for nasal cavity tumour grade classification
4.1 Comparative Analysis of Existing Pre-Trained Model with Proposed Décor Net
To provide the novelty of proposed décor Net classification model the UADT nasal cavity dataset is trained and tested with six different pre-trained state of the art classification models like VGG16, VGG19, Xception, InceptionV3, MobileNet V2 and ResNet 50. The pre-trained models use ImageNet dataset weights to predict the nasal cavity classes based on the class labels provided. Currently pretrained models are implemented lately for dimensionality reduction using linear convolution and also for conversion of low-level features in to high level features [18]. Xception model is implemented with maximum of 36 layers for classification [19]. VGG networks are designed and implemented with structured layers to provide the best classification and it was proved with outstanding performance in ImageNet visual recognition challenge held on 2014 [20,21]. ResNet50 is implemented with 152 layers with residual block property to avoid the feature loss and the model proved its efficiency in the ImageNet Large Scale Visual Recognition Challenge-2015 and achieved 97% classification accuracy [22].
Fig. 10 Shows the comparative analysis of existing pre-trained model with proposed décor CNN model training and validation accuracy & loss calculated for four class nasal cavity datasets. The décor CNN model performance is noted in vertical column 7.

Figure 10: Comparative analysis of existing and proposed décor CNN model
In Fig. 11 It is observed that the proposed décor CNN model outperforms the nasal cavity dataset and achieved 99% training accuracy and 98% validation accuracy and also, the training and validation loss is noted with 0.1 and 0.8. Compared to other CNN models the proposed model works well for four class with 6759 images in total.

Figure 11: Comparative analysis of existing pre-trained CNN model
4.2 Performance Analysis of Proposed Décor Net
The proposed décor CNN classification model exploits the golden characteristics of top pre-trained CNN models like MobileNet-V2, VGG-16, VGG-19, Inception-V3, Xception and ResNet-50. Different state of the art techniques exists in pre-trained model like 3 x 3 and 1 x 1 convolution filter to extract all the edges in the biopsy images, SoftMax activation function is used in the fully connected dense layer and its detail is given in Section 3.4.3. The proposed model is initialized with 32 x 32 image size to develop décor CNN model. Our proposed dataset consists less data which is not sufficient to get good training and validation accuracy when evaluated with existing State of the art models. Except ResNet-50 and VGG-19 other pre-trained model’s classification performance is noted with less accuracy and higher classification error as shown in Fig. 10. Along with that it was noted that Xception and Inception-V3 model struggles with underfitting and the performance was noted with 20% & 60% accuracy. From 30th epoch the model falls under global minima and the performance of the two models were static till the completion of training and validation process. The proposed model outperforms well and avoids the overfitting problem exist in pre-trained CNN model evaluations. The comparative analysis of existing literature CNN models used for classification is compared with proposed décor CNN model and is shown in Tab. 1.
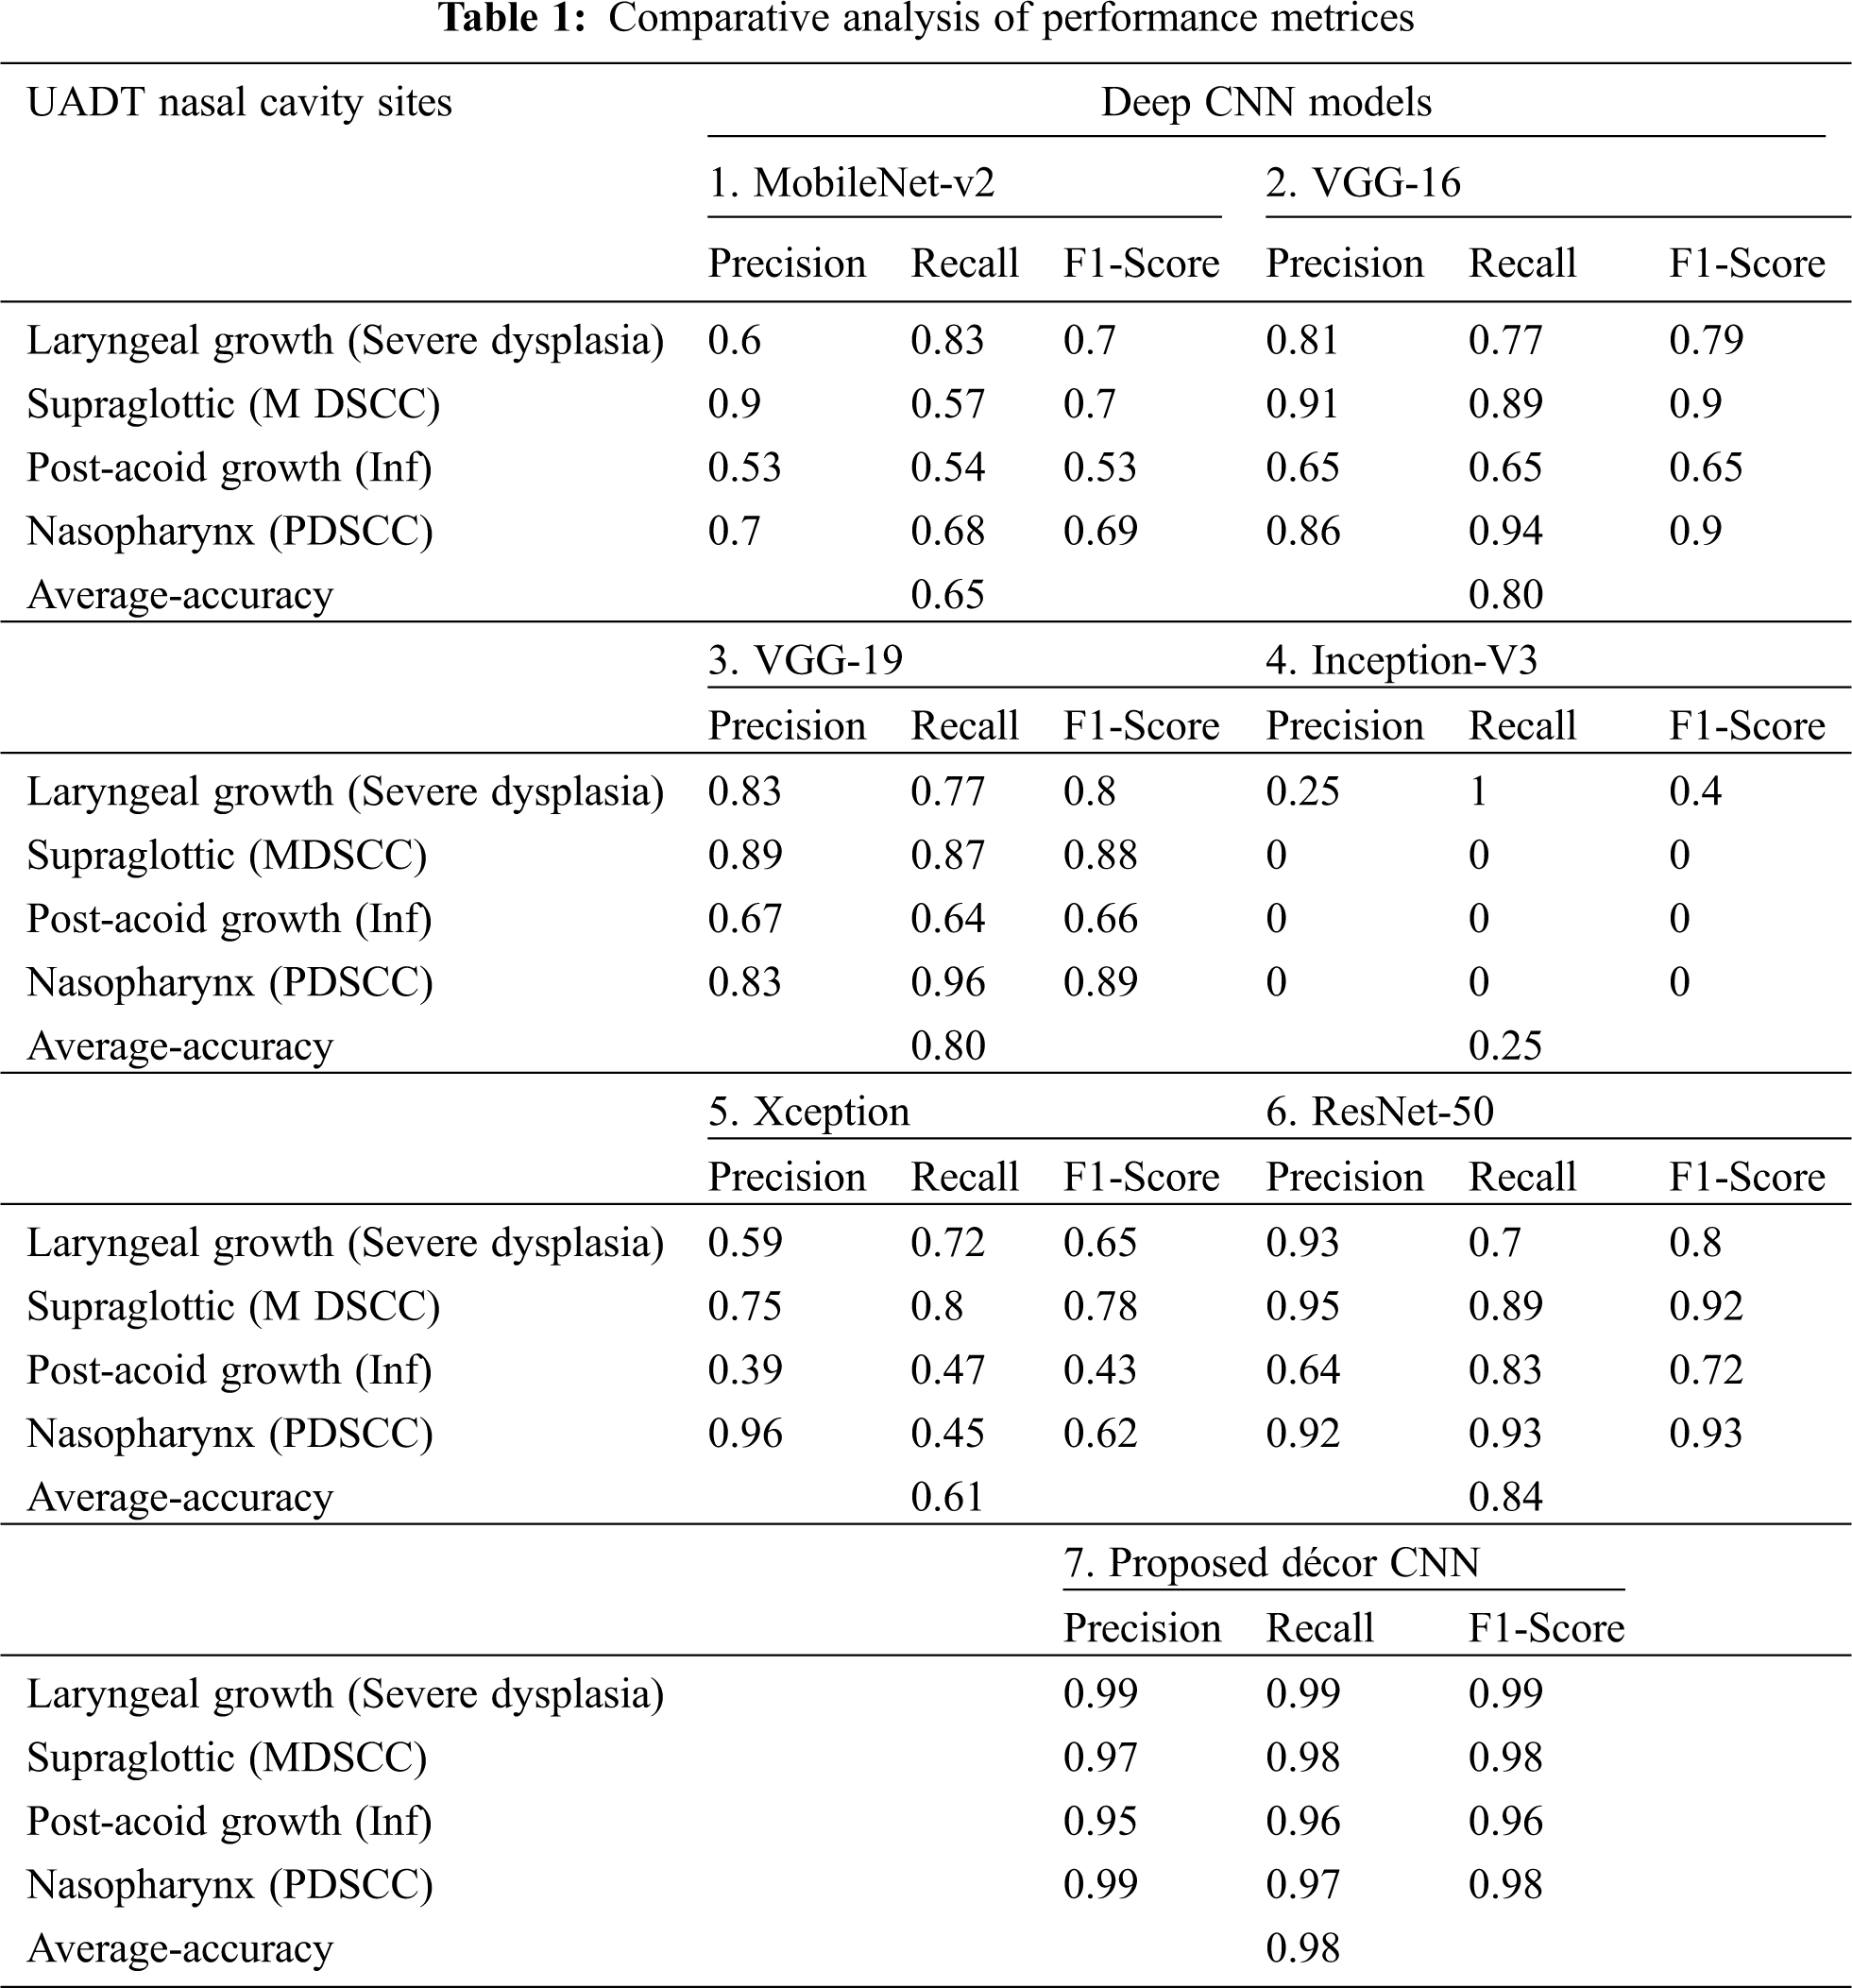
In Tab. 1 five different existing pre-trained model’s confusion matrices are calculated using nasal cavity dataset and it is compared with the proposed décor CNN model. The performance evaluation is noted with higher classification accuracy of 98% from proposed décor CNN classification model compared to other CNN model performances.
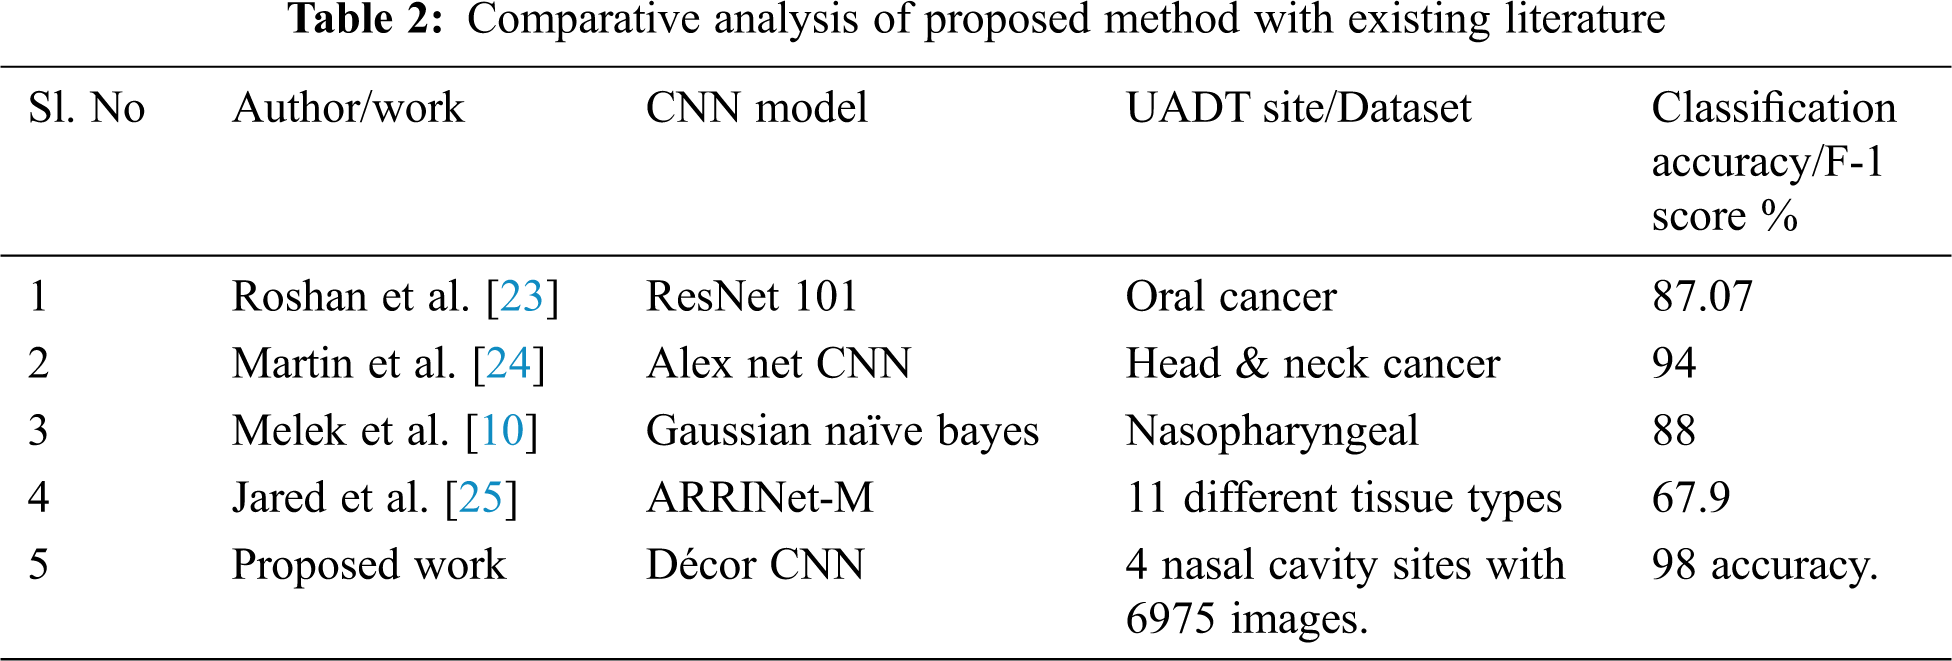
Tab. 2 shows the comparative analysis of existing literature tumour classification performance with the proposed CNN model performance with different image dataset. the performance of proposed Décor CNN model is noted with 98% classification accuracy for four class classification with 6759 biopsy images that includes 4x, 10x and 40x magnifications.
In this research work we proposed the state-of-the-art automated deep décor CNN model for UADT nasal cavity tumour grade classification with artifacts present in the biopsy image dataset. The proposed décor CNN model is designed and developed using some existing CNN model which utilizes the properties like image size initialization, different activation functions and pooling operations. The newly proposed décor CNN model is capable to classify the nasal cavity tumours from biopsy slide images. The UADT nasal cavity dataset is pre-processed and fine-tuned using decorrelation contrast stretching technique. The technique is proficient to reduce the stain artifact contrast, increase epithelial tissues contrast and background separation. The pre-processed dataset is trained and tested with six different existing pre-trained models and the comparative analysis shows that the proposed model outperforms all other existing models. The décor CNN model performance gives 99% training accuracy, 98% validation accuracy with 0.1 testing error and 0.83 validation error. Interobserver variability problems are the bottle neck problems which pathologists faces every day while grading dysplasia type tumours. Our proposed model is capable to predict benign, malignant and dysplasia type tumours and its gradings automatically. The appearance of dysplastic tumours in one site has the highest chance of metastasis to another site. The future work can be focused to analyse and automate the CNN model for both oral cavity and nasal cavity tumour gradings to predict the metastasis of tumours and survival rate of the head and neck SCC patients.
Acknowledgement: The authors would like to acknowledge Ministry of Electronics and Information Technology (MeitY's), Government of India for funding the research work under Visvesvaraya PhD scheme. They also acknowledge for the support received from “Government Vellore Medical College & Hospital, Department of Pathology, Tamil Nadu, India.
Funding Statement: The authors received the financial support for the research by, “The Ministry of Electronics and Information Technology (MeitY's), Government of India.
Conflicts of Interest: The authors declare that they have no conflicts of interest to report regarding the present study.
1. American cancer society, “What are nasal cavity and paranasal sinus cancers” https://www.cancer.org/cancer/nasal-cavity-and-paranasal-sinus-cancer/about/what-is-nasal-paranasal.html, 2021. [Google Scholar]
2. M. A. Kulkarni, V. G. Mudholkar, A. S. Acharya and R. V. Ramteke, “Histopathological study of lesions of nose and paranasal sinuses,” Indian Journal of Otolaryngology Head Neck Surg, vol. 64, no. 3, pp. 275–279, 2012. [Google Scholar]
3. K. Arpana, S. Abhinav and P. Pooja, “Histopathological study of lesions of nasal cavity and paranasal sinuses,” Indian Journal of Pathology and Oncology, vol. 7, no. 1, pp. 88–93, 2020. [Google Scholar]
4. K. E. Dean, D. Shatzkes and C. D. Phillips, “Imaging review of new and emerging sinonasal tumors and tumor-like entities from the fourth edition of the world health organization classification of head and neck tumors,” AJNR Am. J. Neuroradiol, vol. 40, no. 4, pp. 584–590, 2019. [Google Scholar]
5. A. Ahmed, M. Talha, S. Warsi and K. Akhtar, “Sinonasal hemangiopericytoma-an unusual swelling in the nasal cavity,” Journal of Otorhinolaryngology Allied Science, vol. 3, no. 2, pp. 67–71, 2020. [Google Scholar]
6. G. Michela, F. Lorenzo and N. Emanuele, “Imaging biomarkers in upper gastrointestinal cancers,” BJR Open, vol. 1, no. 1, pp. 1–17, 2019. [Google Scholar]
7. S. Mukherjee, C. Shonka, M. Wintermark and P. Raghavan, “Nasopharynx in Manual of Head and Neck Imaging,” Berlin Heidelberg: Springer, vol. 1, pp. 53–71, 2014. [Google Scholar]
8. B. A. Tama, D. H. Kim, G. Kim, S. W. Kim and S. Lee, “Recent advances in the application of artificial intelligence in otorhinolaryngology-head and neck surgery,” Clin. Exp. Otorhinolaryngology, vol. 13, no. 4, pp. 326–339, 2020. [Google Scholar]
9. L. Ke, Y. Deng, W. Xia, M. Qiang, X. Chen et al., “Development of a self-constrained 3d denseNet model in automatic detection and segmentation of nasopharyngeal carcinoma using magnetic resonance images.” Oral Oncology, vol. 110, pp. 1–8, 2020. [Google Scholar]
10. M. Akcay, D. Etiz, O. Celik and A. Ozen, “Evaluation of prognosis in nasopharyngeal cancer using machine learning,” Technology in Cancer Research & Treatment, vol. 19, pp. 1–9, 2020. [Google Scholar]
11. M. Halicek, J. Dormer, D. Little, J. V. Chen, A. Y. Myers et al., “Hyperspectral imaging of head and neck squamous cell carcinoma for cancer margin detection in surgical specimens from 102 patients using deep learning,” Cancers, vol. 11, no. 9, pp. 1–16, 2019. [Google Scholar]
12. W. Y. Chuang, S. H. Chang, W. H. Yu, C. K. Yang, C. J. Yeh et al., “Successful identification of nasopharyngeal carcinoma in nasopharyngeal biopsies using deep learning,” Cancers, vol. 12, no. 2, pp. 1–17, 2020. [Google Scholar]
13. L. Sapra, J. K. Sandhu, N. Goyal, G. S. Hura, A. K. Singh and L. S. Hoe, “Intelligent method for detection of coronary artery disease with ensemble approach,” in Advances in Communication and Computational Technology, Singapore: Springer, pp. 1033–1042, 2021. [Google Scholar]
14. A. Cardesa, L. Alos, A. Nadal and A. Franchi, “Nasal cavity and paranasal sinuses,” Pathology of the Head and Neck, vol. 2, pp. 49–127, 2016. [Google Scholar]
15. S. Thayammal, S. Priyadarshini and D. Selvathi, “Edge preserved multispectral image compression using PCA and hybrid transform,” Multimedia Tools and Applications, vol. 79, no. 27--28, pp. 20133–20148, 2020. [Google Scholar]
16. M. Kalfon and M. Porat, “A new approach to texture recognition using decorrelation stretching,” International Journal of Future Computer and Communication, vol. 2, no. 1, pp. 49–53, 2013. [Google Scholar]
17. R. Miotto, F. Wang, S. Wang, X. Jiang and J. T. Dudley, “Deep learning for healthcare: Review, opportunities and challenges,” Briefings in Bioinformatics, vol. 19, no. 6, pp. 1236–1246, 2018. [Google Scholar]
18. M. Sandler, A. Howard, M. Zhu, A. Zhmoginov and L.-C. Chen, “Mobilenetv2: Inverted residuals and linear bottlenecks,” in Conf. on Computer Vision and Pattern Recognition, Salt Lake City, UT, USA, pp. 4510–4520, 2018. [Google Scholar]
19. E. Ayan and H. M. Ünver, “Diagnosis of pneumonia from chest x-ray images using deep learning,” in 2019 Scientific Meeting on Electrical-Electronics & Biomedical Engineering and Computer Science (EBBTIstanbul, Turkey, pp. 1–5, 2019. [Google Scholar]
20. X. Liu, Q. Hu, Y. Cai and Z. Cai, “Extreme learning machine-based ensemble transfer learning for hyperspectral image classification, “IEEE Journal of Selected Topics in Applied Earth Observations and Remote Sensing, vol. 13, pp. 3892–3902, 2020. [Google Scholar]
21. A. Diamant, A. Chatterjee, M. Vallières, S. George, S. Jan et al., “Deep learning in head & neck cancer outcome prediction,” Scientific Reports, vol. 9, no. 1, pp. 1–10, 2019. [Google Scholar]
22. M. Talo, “Convolutional neural networks for multi-class histopathology image classification,” arXiv preprint arXiv:1903.10035, 2019. [Google Scholar]
23. P. Remagnino, J. H. Lim, C. S. Chan, S. Rajendran, T. G. Kallarakkal et al., “Automated detection and classification of oral lesions using deep learning for early detection of oral cancer,” IEEE Access, vol. 8, pp. 132677–132693, 2020. [Google Scholar]
24. M. Halicek, B. Fei, J. V. Little, X. Wang, M. Patel et al., “Optical biopsy of head and neck cancer using hyperspectral imaging and convolutional neural networks,” Proceedings of SPIE International Society of Optical Engineering, vol. 24, no. 3, pp. 1–14, 2018. [Google Scholar]
25. J. A. Shenson, G. S. Liu, J. Farrell and N. H. Blevins, “Multispectral imaging for automated tissue identification of normal human surgical specimens,” Otolaryngology Head and Neck Surgery, vol. 164, no. 2, pp. 328–335, 2021. [Google Scholar]
 | This work is licensed under a Creative Commons Attribution 4.0 International License, which permits unrestricted use, distribution, and reproduction in any medium, provided the original work is properly cited. |