DOI:10.32604/iasc.2022.019669
| Intelligent Automation & Soft Computing DOI:10.32604/iasc.2022.019669 | |
| Article |
Multi-Objective Adapted Binary Bat for Test Suite Reduction
1Department of Mathematics, Faculty of Science, Suez Canal University, Egypt
2Faculty of Informatics and Computer Science, British University in Egypt, Egypt
3Department of Electrical and Mechanical Engineering, Nagoya Institute of Technology, Japan
*Corresponding Author: Abeer Hamdy. Email: abeer.hamdy@bue.edu.eg
Received: 21 April 2021; Accepted: 16 June 2021
Abstract: Regression testing is an essential quality test technique during the maintenance phase of the software. It is executed to ensure the validity of the software after any modification. As software evolves, the test suite expands and may become too large to be executed entirely within a limited testing budget and/or time. So, to reduce the cost of regression testing, it is mandatory to reduce the size of the test suite by discarding the redundant test cases and selecting the most representative ones that do not compromise the effectiveness of the test suite in terms of some predefined criteria such as its fault-detection capability. This problem is known as test suite reduction (TSR); and it is known to be as nondeterministic polynomial-time complete (NP-complete) problem. This paper formulated the TSR problem as a multi-objective optimization problem; and adapted the heuristic binary bat algorithm (BBA) to resolve it. The BBA algorithm was adapted in order to enhance its exploration capabilities during the search for Pareto-optimal solutions. The effectiveness of the proposed multi-objective adapted binary bat algorithm (MO-ABBA) was evaluated using 8 test suites of different sizes, in addition to twelve benchmark functions. Experimental results showed that, for the same fault discovery rate, the MO-ABBA is capable of reducing the test suite size more than each of the multi-objective original binary bat (MO-BBA) and the multi-objective binary particle swarm optimization (MO-BPSO) algorithms. Moreover, MO-ABBA converges to the best solutions faster than each of the MO-BBA and the MO-BPSO.
Keywords: Binary bat algorithm; mutation testing; regression testing; software testing; test suite reduction; heuristic algorithms
Software testing is one of the crucial activities in the software development lifecycle. It is used to detect software defects and ensure that the software is delivered with high quality. Any modifications in one of the software components may affect one or more other components, which necessitates the re-execution of the earlier test cases in addition to the newly generated ones [1]. As a result, the test suite size expands over time and may include redundant test cases. Moreover, it may not execute in it is entirely within the testing budget and/or time. Testing the behavior of the whole system under test (SUT) after each modification is called regression testing [2]. Regression testing is expensive and it accounts for almost one half of the cost of testing [3]. Rothermel et al. [3] reported a case in the industry where executing a complete regression test suite (of a 20K LOC product) required seven weeks. In order to reduce the cost of regression testing, it is necessary to reduce the number of test cases in the test suite without compromising its effectiveness, in terms of some predefined criteria [4,5]. This problem is known as the test suite reduction (TSR) problem. One way to assess the capabilities of the reduced test suite, in discovering bugs, is through the utilization of a fault-based testing technique called mutation testing. Mutation testing [6] is a white-box testing technique, which calculates a score for the test suite that indicates its capability on discovering bugs in the SUT. The TSR problem is known to be a combinational multi-objective optimization problem, that can be described as a set covering problem; which is known to be NP-complete. In practice, there is no exact solution for NP-complete problems, however, suboptimal solutions could be found using search-based optimization algorithms [7].
Researchers have proposed various test suite reduction approaches [8]. The majority of these approaches are in the form of a white-box [9]. They aim at reducing the test suite without compromising test requirements such as statement coverage, fault detection capability rate, etc. Most of these approaches utilized greedy algorithms to solve a single objective TSR (SO-TSR) problem [8]. Recent approaches used heuristic algorithms to solve the multi-objective TSR (MO-TSR) problem [8,10–15] in addition to the SO-TSR [16,17]. Some studies demonstrate a comparison between the performance of heuristic and greedy algorithms in solving the TSR problem; Sun et al. [17] showed experimentally that the Binary Particle Swarm Optimization (BPSO) algorithm outperforms greedy algorithms in solving the SO-TSR problem. Most of heuristic based approaches for solving the MO-TSR problem utilized Non-dominated Sorting Genetic Algorithm II (NSGAII) or its variants [10,14,15]. Yoo et al. [12] showed experimentally that the NSGAII is superior to greedy approaches in solving the MO-TSR problem. Wang et al. [13] used three types of weighted-sum genetic algorithm (GA) and showed experimentally the superiority of the random-weighted GA over the NSGAII and some other popular multi-objective optimization algorithms. Moreover, Mohanty et al. [11] used Ant Colony (ACO) in their proposed approach for solving the MO-TSR problem.
Aims and Contributions
The main aim of this paper is to propose a heuristic based approach to solve the multi-objective TSR problem. The proposed approach is based on the Bat algorithm (BA) [18,19]; which is a swarm intelligence search algorithm inspired from the echolocation behavior of bats. Echolocation works as a type of sonar; a bat emits a loud sound, and an echo returns when that sound hits an object. The combination of echolocation with swarm intelligence enhances the properties of swarm-based algorithms; which makes BA more effective than other swarm-based algorithms in some contexts [18,20]. Yang [18] showed empirically that BA outperforms each of the GAs [21] and Particle swarm Optimization (PSO) [22,23] over some benchmark functions. Chawla et al. [20] surveyed some applications in the areas of computer science, medical and electrical engineering where the BA surpasses GA, PSO and ACO algorithms. However, the BBA occasionally fails to discover the global best solution for some multi-modal functions.
Our contributions to accomplish the above-mentioned aim can be summarized as follows:
Proposing modifications to the original Binary Bat algorithm (BBA) to enhance its exploration and exploitation capabilities; to reduce its occasional failure to converge to global optimum solutions.
Evaluating the performance of the adapted (modified) binary bat algorithm (ABBA) against each of the BBA and the binary PSO (BPSO) [24] algorithms, over a set of different unimodal and multi-modal benchmark functions of different ranges (the unimodal function has only one minima location which is the global best solution; while the multi-modal function has more than one local minima locations but only one of them is the global best solution).
Formulating the TSR problem as an optimization problem and defining a fitness function based on two objectives which are: (i) the execution cost of the reduced test suite and (ii) the effectiveness of the reduced test suite in terms of its mutation score. The variable weighted sum method [19] was utilized to form the multi-objective fitness functions, which guides the BBA to search for the non-dominated solutions that provides an optimum balance between the cost and effectiveness of the reduced test suites.
Evaluating the performance of the multi-objective ABBA (MO-ABBA) against each of the multi-objective BBA (MO-BBA) and the multi-objective BPSO (MO-BPSO) in solving the multi-objective TSR problem over eight test suites of different sizes.
The rest of the paper is organized as follows: Section 2 introduces some important preliminaries for this work. Section 3 discusses the previous studies that tackled the TSR problem. Section 4 presents the multi-objective adapted binary bat algorithm for solving the TSR problem. Section 5 discusses the experiments and results. Finally, Section 6 concludes the paper and introduces possible extensions to this work.
2.1 Test Suite Reduction Problem
Given: A test suite
Problem: Find an adequate subset
In the multi-objective optimization problems, there is no single solution but a set of multiple trade-offs solutions [25]. The vector of decision variables that optimizes the considered objective functions and satisfy the problem constraints is called a Pareto front. Thus, the Pareto front is a set of Pareto solutions which are not dominated by any other solution. A solution
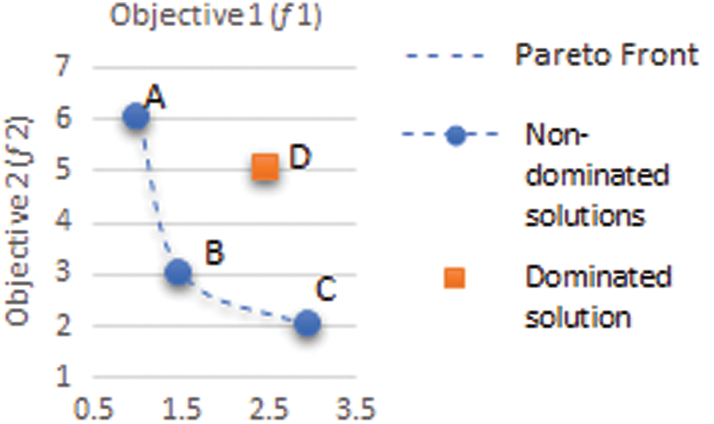
Figure 1: A sample representation of dominated non-dominated solutions and a Pareto front
Bat algorithm (BA) is one of the recent metaheuristic swarm intelligence optimization algorithms which is proposed by Yang [18]. BA was inspired by the behavior of the micro-bats. A bat
where,
where,
where,
Mirjalili et al. [26] proposed the BBA to solve optimization problems in the binary search space. In the BBA, the bat’s position is changed from one to zero or vice versa based on the probability of the bat’s velocity according to Eqs. (7) and (8).
where
Researchers proposed a significant number of approaches to minimize the size of the test suite. The majority of these approaches are based on greedy algorithms [27], while very few of them are based on clustering algorithms [28] or utilize hybrid algorithms (e.g., neuro fuzzy techniques) [29]. Greedy based approaches utilize one of the greedy algorithms to determine the reduced test suite based on the current best strategy. Over each iteration, the greedy algorithm adds to the reduced test suite the test case that has the highest greedy property, e.g., the highest statement coverage, which is a local optimal solution. It stops when the desired percentage of coverage is reached. Greedy approaches were proved empirically to be effective in solving the SO-TSR problem. On the other hand, clustering based approaches utilize one or more of the clustering algorithms to group similar test cases together according to a predefined similarity measure. Then a sampling mechanism is applied to select one or more test cases from each cluster to be included in the reduced test suite; while the rest of the test cases are discarded. Recently, heuristic algorithms where utilized to solve the single and multi-objective TSR [8,10–15,17]. According to a survey study conducted by Khan et al. [8] the majority of the heuristic search based TSR approaches, 79% of them, are single-objective optimization. Some researchers showed empirically that some heuristic algorithms are superior to greedy algorithms in solving each of the single and multi-objective TSR problem [12,17]. The work of Yoo et al. [12] is considered as the first work that applies multi-objective optimization for test suite minimization. The authors used the NSGAII algorithm and showed experimentally its superiority over the greedy approaches. Geng et al. [10] and Gupta et al. [15] also utilized the NSGA-II algorithm but with different objective drivers. The objectives of Geng et al. [10] were the code coverage and test suite cost; while the objectives of Gupta et al. [15] were the code coverage and mutation score. Wang et al. [13] proposed utilizing three types of weighted-based genetic algorithms for minimizing the test suite of the product lines software. Where, the authors weighted summed the different objective drivers to form a single objective fitness function that guides the GA during the search for a Pareto front. Their experimental results showed that the Random-Weight GA algorithm outperforms seven other popular multi-objective search algorithms including: NSGA-II, strength Pareto evolutionary algorithms (SPEA) and speed-constrained multi-objective Particle Swarm Optimization (SMPSO). Wei et al. [14] compared among six evolutionary multi-objective optimization algorithms including NSGAII and several variants of the multi-objective decomposition-based evolutionary algorithm (MOEA/D). Their experimental results showed the superiority of the NSGAII over small programs, but over large programs (space) the MOEA/D was superior. They tried different combinations of objective drivers including mutation score, code coverage and test suite cost. The experiments showed that for the same statement coverage, using the “mutation score” as an objective driver guided the evolutionary algorithms to the smallest test suite.
Difference from the previous work
The approach proposed in this paper is a heuristic search-based approach. We adapted one of the recent heuristic algorithms BBA which proved its superiority over other evolutionary algorithms in different contexts [20]. However, the BBA occasionally fails to discover the global best solution for some multi modal functions; in addition, the BBA is used for solving single objective optimization problems. So, we proposed modifications to the BBA and utilized it to minimize the test suite size without loss in the fault detection quality. We used mutation testing to measure the quality of the reduced test suite, because mutation testing has been studied by numerous researchers as a method to assess the quality of a test suite [24,30–32]. Previous research proved empirically that mutation testing is more effective than code coverage in evaluating and comparing test suites [24].
4 Proposed Multi-Objective ABBA (MO-ABBA) for TSR
Consider that each bat
4.2 Adapted Binary Bat Algorithm (ABBA)
Generally, the performance of any heuristic algorithm, including the BA, is affected by two crucial competencies which are: 1) exploration and 2) exploitation. Exploration is the ability of an algorithm to find promising solutions by searching various unknown regions, while exploitation leads the algorithm to the best solution among the discovered ones. Exploration capability can get the algorithm away from a local optimum it gets stuck in, while exploitation capability increases the convergence speed of an algorithm. It is important to keep the balance between the global and local search, such that the global search is amplified at the early iterations. While the local search is amplified at the late iterations so the algorithm converges to the global optimum.
The update formula of the bat velocities,
where
The other suggested modification is to assume that each bat emits two frequencies instead of one before the bat decides on its moving direction. The first frequency is directed towards the location of the
where
4.3 TSR Multi-Objective Fitness Function Formulation
In this paper the fitness function is composed of two objectives. The first objective aims at minimizing the cost of the test suite; which is expressed in terms of the execution time as recommended by Yoo et al. [12]. While the second objective aims at selecting a reduced test suite that is capable of detecting the largest number of faults. The fault detection capability of the reduced test suite is expressed in terms of the mutation score. Wei et al. [14] found out that the mutation score is the most effective objective for solving the TSR problem. The two objectives are defined using Eqs. (13)–(14).
where |
To formulate the fitness function, we used the weighted sum method which is simple and traditional method for multi-objective optimization. It produces a Pareto-optimal set of solutions by changing the weights among the objective functions. Yang [19] showed experimentally that the weighted sum method for combining the multi-objectives into a single-objective is very efficient even with highly nonlinear problems, complex constraints and diverse Pareto optimal sets. Moreover, Wang et al. [13] showed that the random weighted-based GA (multi-objective GA based on weighted sum method) is superior to some popular multi-objective algorithms, e.g., NSGAII and SPEA.
The fitness function used in this work is defined by Eqs. (15)–(17), the best solution is the one that maximizes the
where,
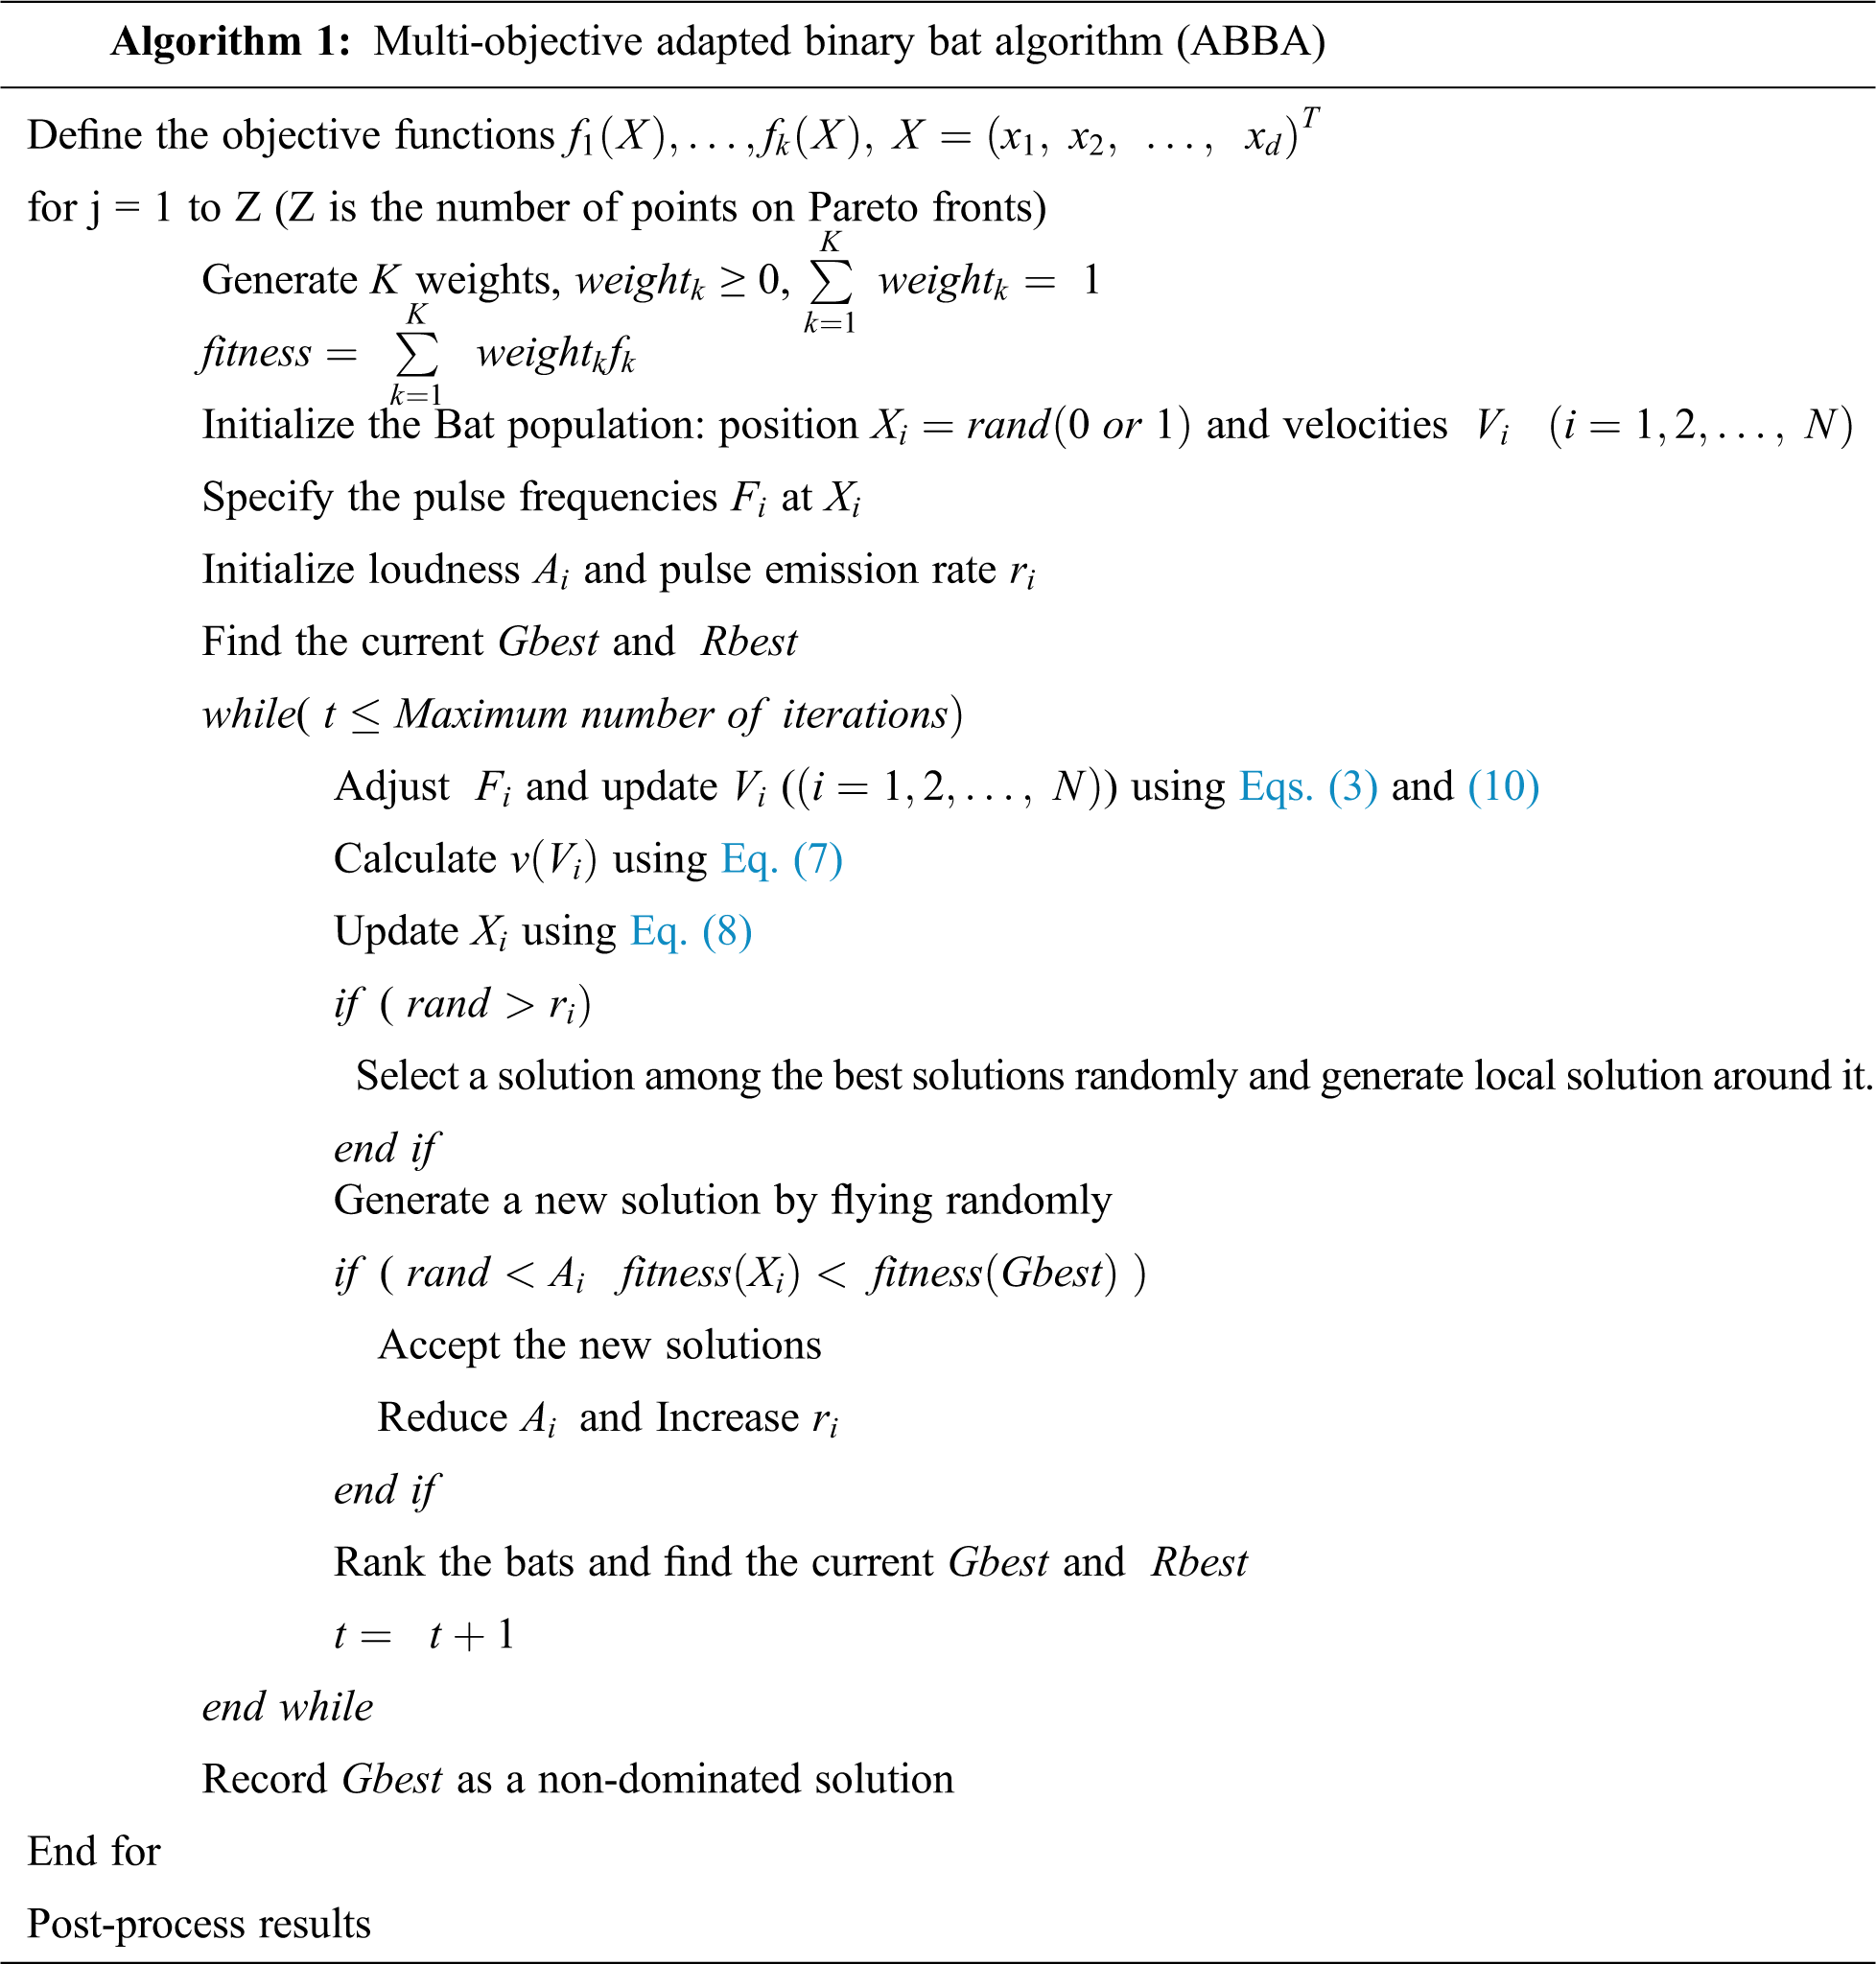
Algorithm 1 shows the basic steps of the multi-objective ABBA.
The experiments were designed to answer the following research questions:
RQ1: Does the performance of the single-objective (SO-ABBA) surpasses the performance of the SO-BBA and the SO-BPSO?
RQ2: Does the performance of the MO-ABBA surpasses the performance of the MO-BBA and the MO-BPSO in solving the MO-TSR problem?
RQ3: How does the increase in the test suite size of the SUT and the number of mutants impact the performance of the MO-ABBA?
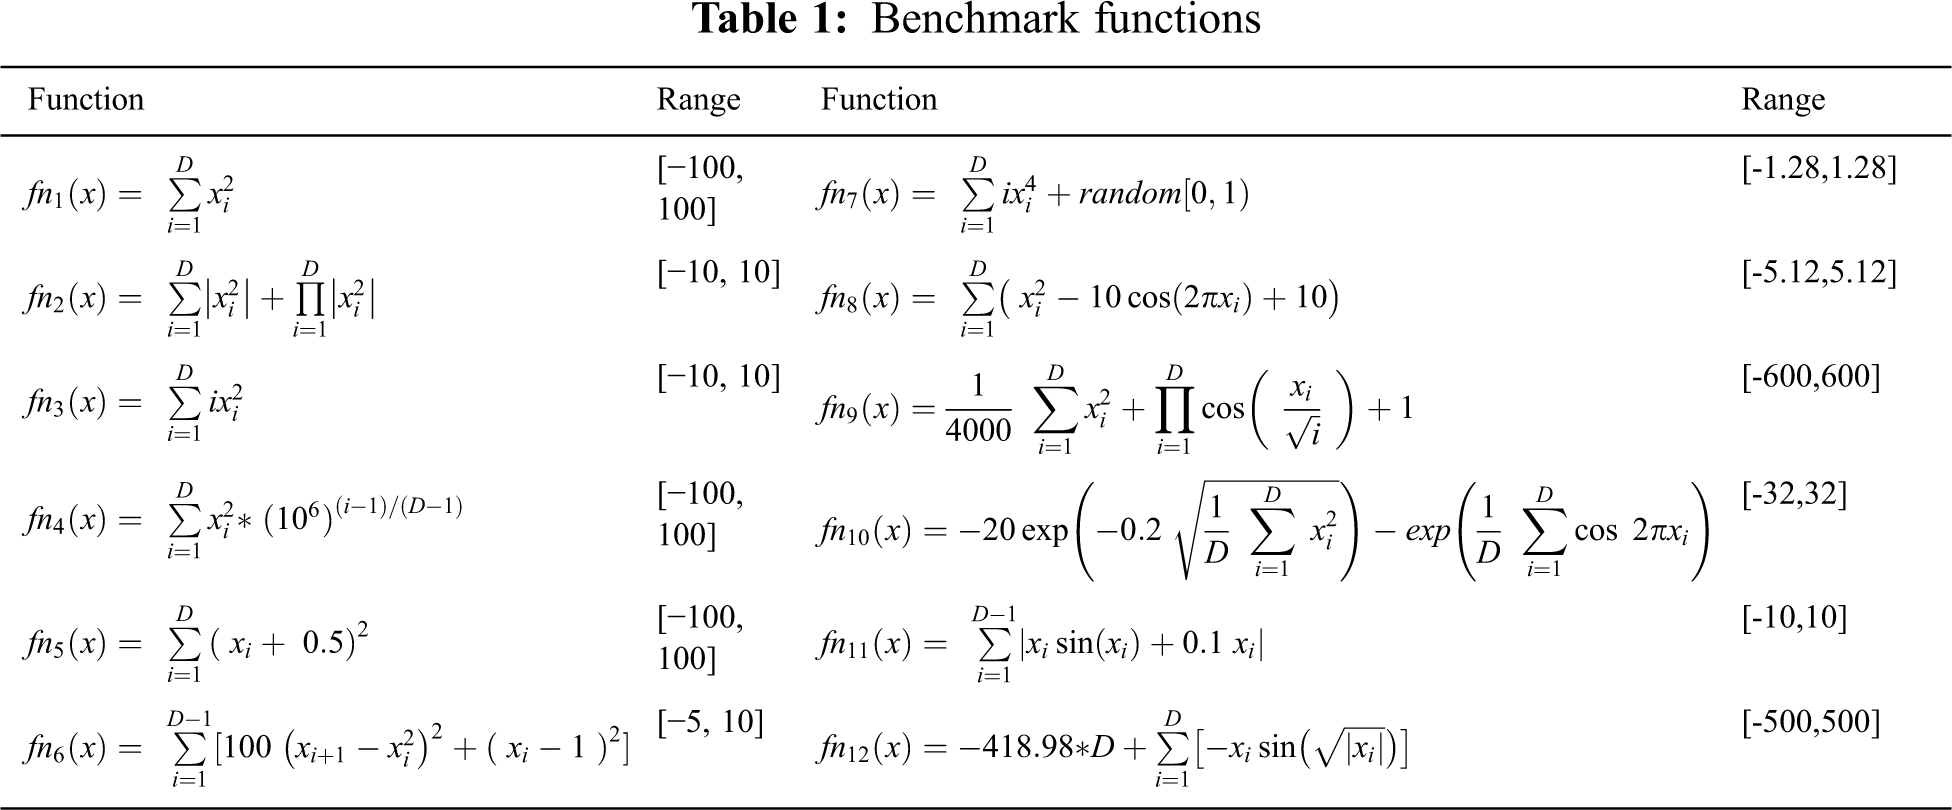
To answer RQ1, we used twelve unimodal and multimodal benchmark functions. Tab. 1 lists these functions along with their search boundaries (range).
where, nb is the dimension of the bats/particles.
To answer RQ2 and RQ3, we used eight programs, out of which, two are C open-source programs and their characteristics retrieved from a popular repository, Software-artifact Infrastructure Repository (SIR) [34], which are: flex v1 and make v1. While the other six java programs are from an available dataset(1)
(1)http://www.inf-cr.uclm.es/www/mpolo/stvr
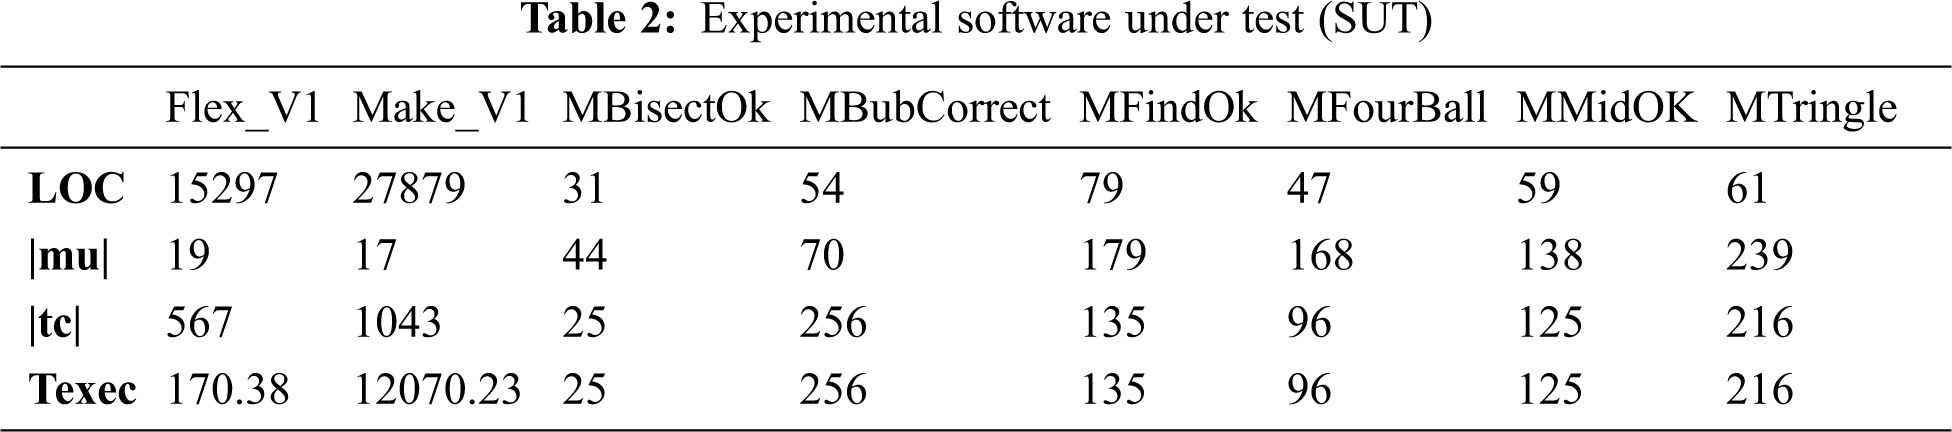
, provided by Polo et al. [35]. The execution time of the test cases of these six programs is not available, so we assumed that all the test cases have equal execution time equal to 1 unit time. The characteristics of the eight programs are listed in Tab. 2, which are the line of code (LOC), the test suite size |tc|, number of mutants |mu|, and the execution time of the original test suite (Texec).
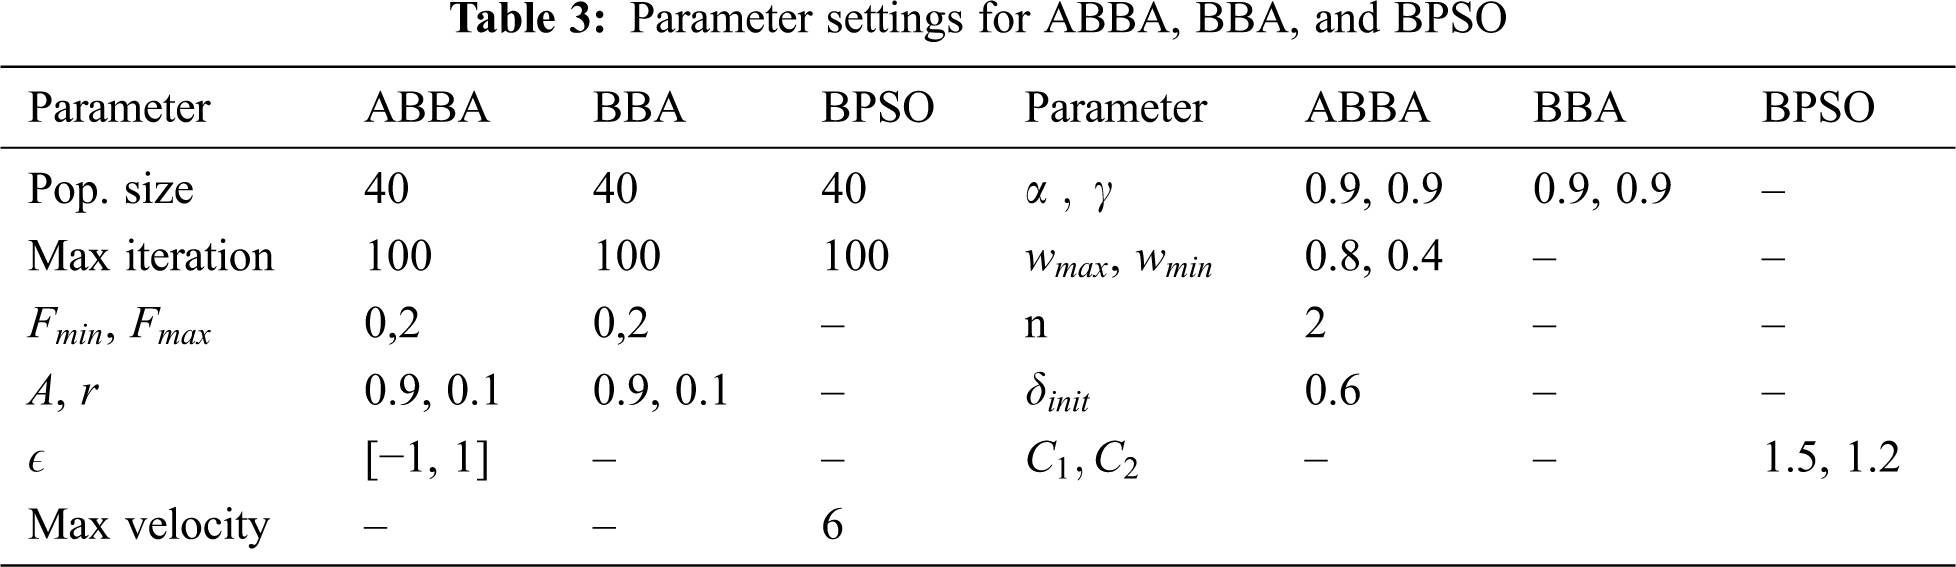
We experimented with the most recommended values for the parameters in the literature [36]. Tab. 3 lists the parameter values that achieved the best performance.
Two metrics were used to assess the performance of the heuristic algorithms in general which are the fitness
where, N is the number of runs,
As the evolutionary algorithms are stochastic, for each experiment, 10 independent runs were performed; then the
Extra three specific metrics were used which are: (i) Test suite size reduction rate (TSRR), (ii) Execution time reduction rate (
The higher the values of the TSRR, ETR and FDR, the better the performance of the search algorithm.
Answer to RQ1:
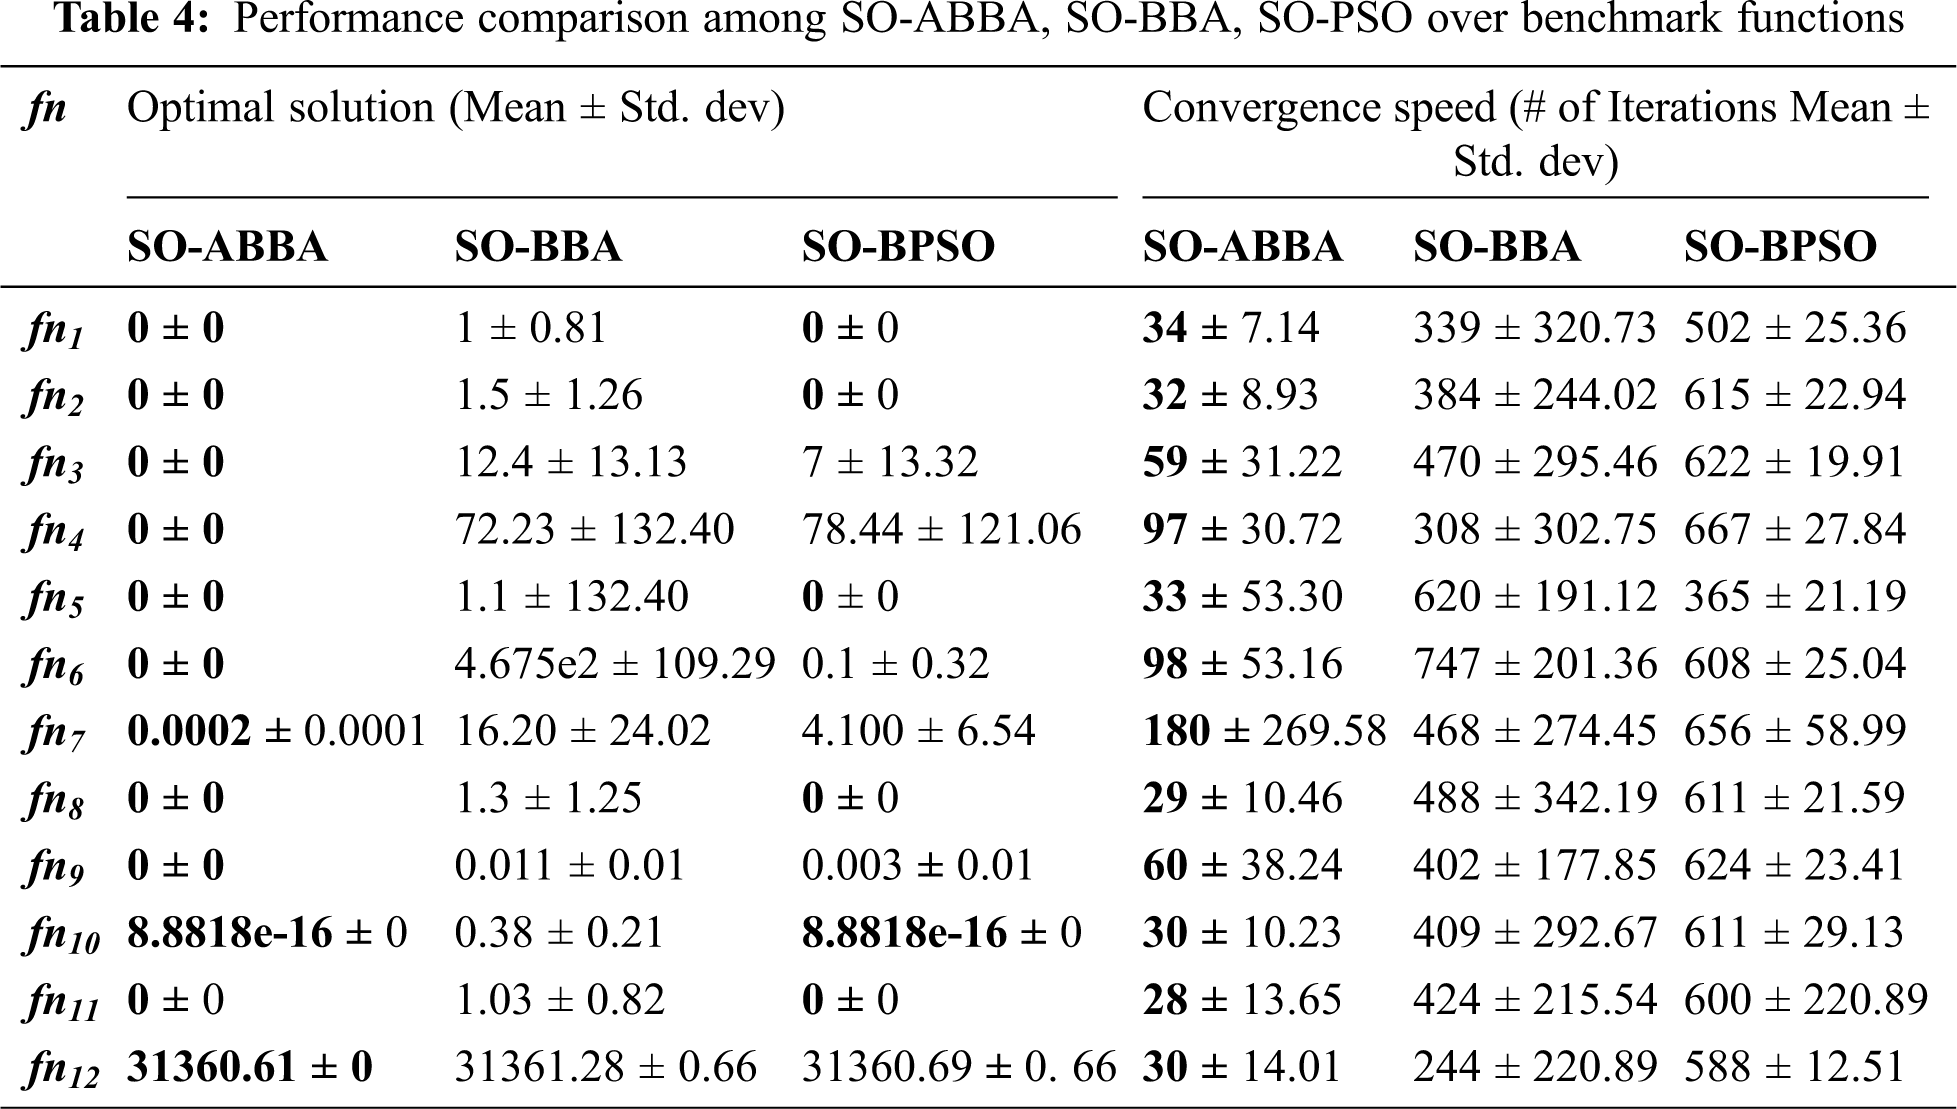
Tab. 4 lists the mean and SD of the optimal solutions discovered for each function over the ten runs, also lists the mean and SD of the number of iterations executed to reach the corresponding optimal solutions; the best results are pointed out in bold style. The maximum number of iterations was set to equal 1000 across all the experiments; however, the best solutions were achieved earlier than the predetermined maximum number of iterations. It should be noted that, for any of the previously mentioned benchmark functions, the best solution is the one that has the smallest mean value (minimization problem). Also, the smaller the mean value of the executed number of iterations, the faster the convergence speed of the heuristic algorithm.
As could be observed from Tab. 4 that the performance of the SO-ABBA algorithm is superior to the SO-BBA over all the unimodal and multimodal benchmark functions; as SO-ABBA could discover better solutions than the ones discovered by the SO-BBA, in terms of the mean values of the best solutions. In addition to, the SD values of the best solutions in case of using the SO-ABBA are smaller than when using SO-BBA over all the functions, which indicates that the SO-ABBA is more robust than the SO-BBA. Small SD values of the optimal solutions discovered by the SO-ABBA prove that the SO-ABBA is efficient in finding the best solutions without large variance among the different runs. When comparing the performance of the SO-ABBA to the SO-BPSO, it was found that the SO-ABBA was capable of discovering better solutions than the SO-BPSO for
Answer to RQ2:
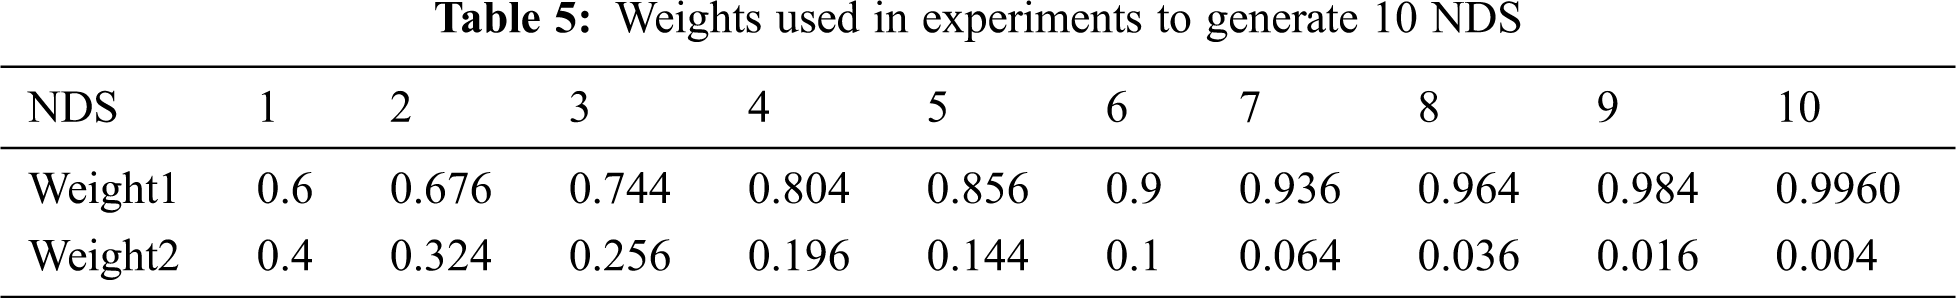
To answer RQ2 we conducted a set of experiments over the previously mentioned 8 programs. The results listed in the paper are the mean and SD of 10 independent runs over each program. The maximum number of iterations was set to equal 100 in all the experiments. Tab. 5 lists the generated values of weight1 and weight2 which were used to calculate 10 non-dominated solutions (NDS) on the Pareto surface. While Tab. 6 lists the mean and SD values of each of the fitness (F) and convergence speed of the discovered NDS. The convergence speed is measured in terms of the number of iterations executed by each algorithm to discover the best solution (#i). To simplify the visualization of the results, only three NDS (nu. 1, 5, 10) were listed in the table. Tab. 7 lists the FDR, TSRR and ETR of the three selected NDS.
As could be observed from Tab. 6, that the MO-ABBA algorithm surpasses both of the MO-BPSO and MO-BBA in terms of the mean fitness values of the discovered NDS, across the 8 programs. Moreover, the fitness standard deviation values of the NDS discovered by the MO-ABBA are very small; most of them are equal to zero or approaches zero, which indicates the stability of the MO-ABBA. E.g., the fitness mean and SD values of the NDS#5 discovered by the MO-ABBA, MO-BBA and MO-BPSO are as follows: Flex_V1 (1.53 ± 0.02, 1.25 ± 0.00, 1.23 ± 0.01), Make_V1 (2.12 ± 0.0, 1.76 ± 0.0, 1.66 ± 0.02), MBisectOk (4.42 ± 0, 4.31 ± 0.13, 4.41 ± 0.01), MBubCorrect (3.70 ± 0.61, 1.61 ± 0.06, 1.61 ± 0.07), MFindOk (20.13 ± 0.35, 2.13 ± 0.24, 2.45 ± 0.33), MFourBall (14.14 ± 0.02, 3.84 ± 3.64, 3.25 ± 0.64), MMidOK (3.70 ± 0.61, 2.34 ± 0.25, 2.48 ± 0.23), MTringle (3.82 ± 0.72, 1.58 ± 0.07, 1.58 ± 0.09).
In terms of the convergence speed, the MO-ABBA was able to converge to the best solutions faster than each of the MO-BBA and the MO-BPSO across all the programs except Flex_V1, NDS 1(#i = 95.5 ± 4.95 ABBA, 94.5 ± 1.77 BBA, 97.5 ± 1.1 BPSO), Make_V1(NDS 10) (#i = 100 ± 0 ABBA, 99 ± 0.71 BBA, 99.5 ± 0.35 BPSO), MBisectOk (NDS 10) (#i = 42.22 ± 30.97 ABBA, 21.90 ± 18.78 BBA, 71.90 ± 16.63 BPSO) and MbubCorrect (NDS 10) (#i = 92.5 ± 6.08 ABBA, 89.40 ± 8.37 BBA, 99.4 ± 10.84 BPSO); where, the MO-BBA converged faster than the MO-ABBA. Nevertheless, the MO-ABBA converged to better solutions than the ones discovered by the MO-BBA. So It could be stated that the MO-BBA was prematurely converged in these cases. Furthermore, the MO-BPSO was occasionally able to discover solutions close to the ones discovered by the MO-ABBA, e.g., MBisectOk NDS 1 (F = 10.57 ± 0 ABBA, 10.57 ± 0.01 BPSO) and MBisectOk NDS 10 (F = 1.05 ± 0 ABBA, 1.05 ± 0.01 BPSO). But the MO-BPSO needed a greater number of iterations than the MO-ABBA to converge to these solutions (MBisectOk NDS 1 #i = 15.33 ± 8.09 ABBA, 67.60 ± 22.08 BPSO ; MBisectOk NDS 10 #i = 42.22 ± 30.97ABBA, 71.90 ± 16.63 BPSO).
As could be observed from Tab. 7 that some of the solutions discovered by the three algorithms have the same FDR values, but the solutions discovered by the MO-ABBA have the highest TSRR and ETR values (e.g., Flex_V1 NDS#1 TSRR = (82.19 ± 2.12 ABBA, 72.40 ± 4.60 BBA, 70.46 ± 7.42 BPSO) ; ETR = (83.50 ± 0.65 ABBA, 73.78 ± 1.53 BBA, 71.71 ± 1.88 BPSO), Make NDS#1 TSRR = (68.41 ± 1.77 ABBA, 60.55 ± 0.35 BBA, 59.16 ± 0.71BPSO); ETR = (80.77 ± 69.0 ABBA, 81.89 ± 34.27 BBA, 81.98 ± 46.38 BPSO) and MFindOk NDS#1 TSRR = (99.3 ± 0 ABBA, 88.7 ± 3.80 BBA, 89.6 ± 1.78 BPSO); ETR = (99.3 ± 0 ABBA, 88.7 ± 3.80 BBA, 89.6 ± 1.78 BPSO)). Which means that for the same fault detection capability rate the MO-ABBA could select from a test suite a subset of test cases with smaller size and faster execution time (less expensive) than the subsets selected by each of the MO-BBA and MO-BPSO. While, some of the solutions discovered by the MO-ABBA are more cost effective (in terms of the TSRR and the ETR values) but with less fault detection capabilities (e.g., MFourBall NDS #1 FDR = (37.4 ± 4.02 ABBA, 83.4 ± 20.99 BBA, 61.7 ± 15.33BPSO); TSRR = (99.0 ± 0 ABBA, 91.8 ± 2.42 BBA, 96.4 ± 1.49 BPSO); ETR = (99.0 ± 0 ABBA, 91.8 ± 2.42 BBA,96.4 ± 1.49 BPSO) ; MFourBall NDS #2 FDR = (37.1 ± 4.06 ABBA, 97.6 ± 40.20 BBA, 85.7 ± 25.01 BPSO); TSRR = (99.0 ± 0 ABBA, 92.5 ± 3.05 BBA, 93.8 ± 1.94 BPSO); ETR = (99.0 ± 0 ABBA, 92.5 ± 3.05 BBA,93.8 ± 1.94 BPSO) ; MMidOk NDS #1; MTringle NDS #1 and MTringle NDS #2. So, the selection of the best algorithm depends on the testers’ targets and testing budgets. Fig. 2 shows sample convergence curves of the three algorithms over the programs. As could be observed that the MO-ABBA converge faster and to better solutions than the MO-BBA and the MO-BPSO, although the parameters settings of both of the MO-ABBA and the MO-BBA are the same.
Answer to RQ3:
As could be observed from the set of experiments over the benchmark functions that the performance of the SO-ABBA was not affected by the functions’ ranges or types. For example, the SO-ABBA was superior to SO-BBA and SO-BPSO over unimodal functions
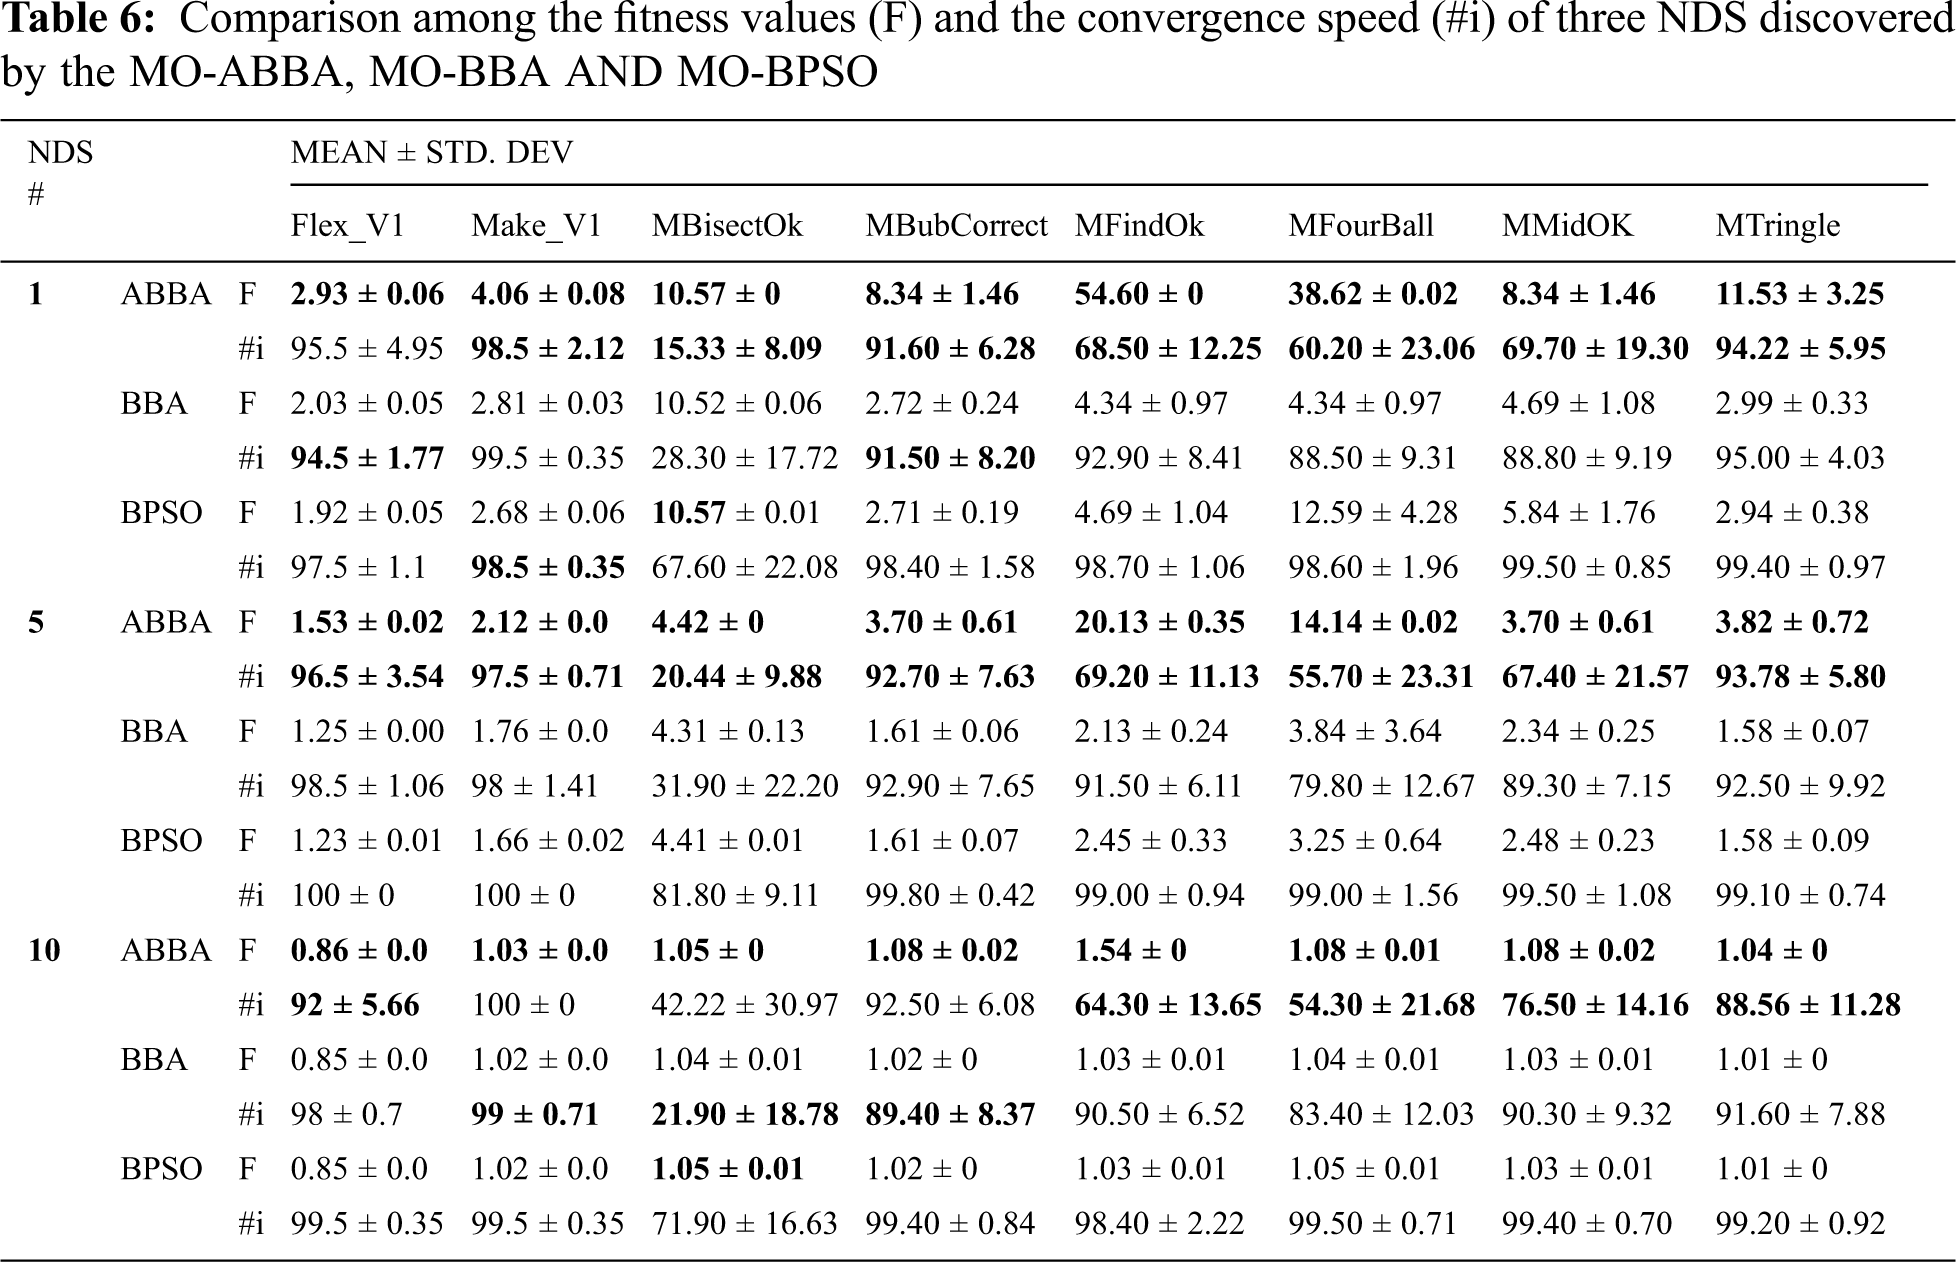
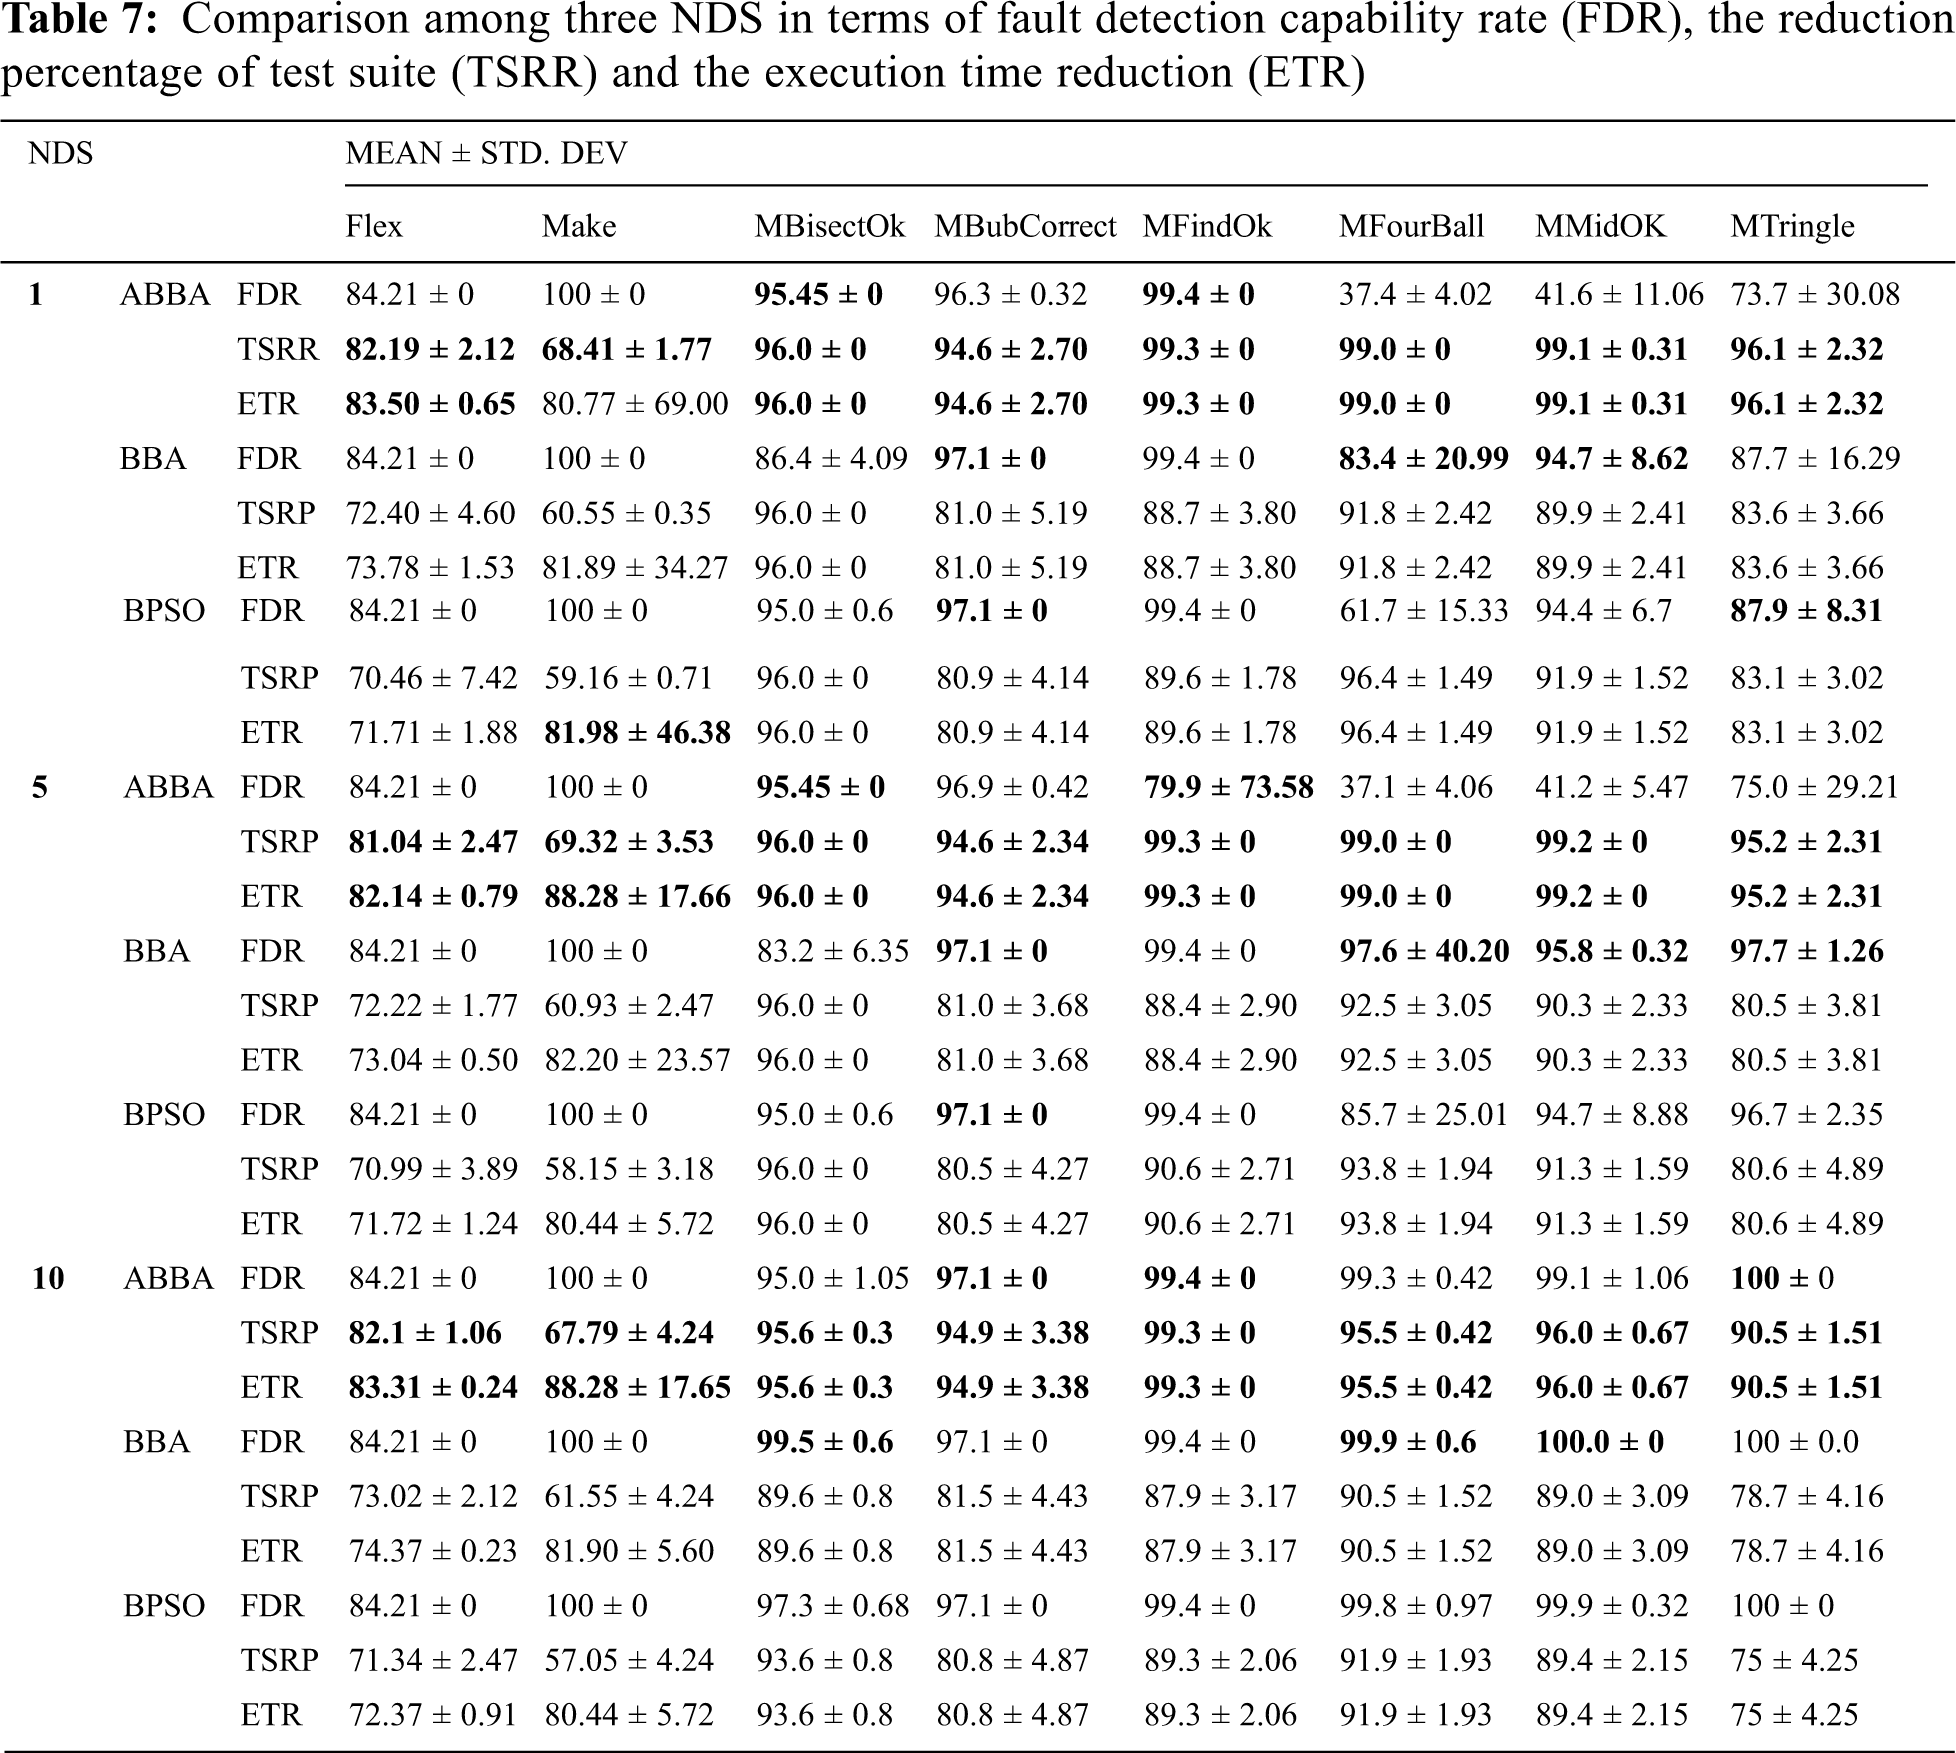
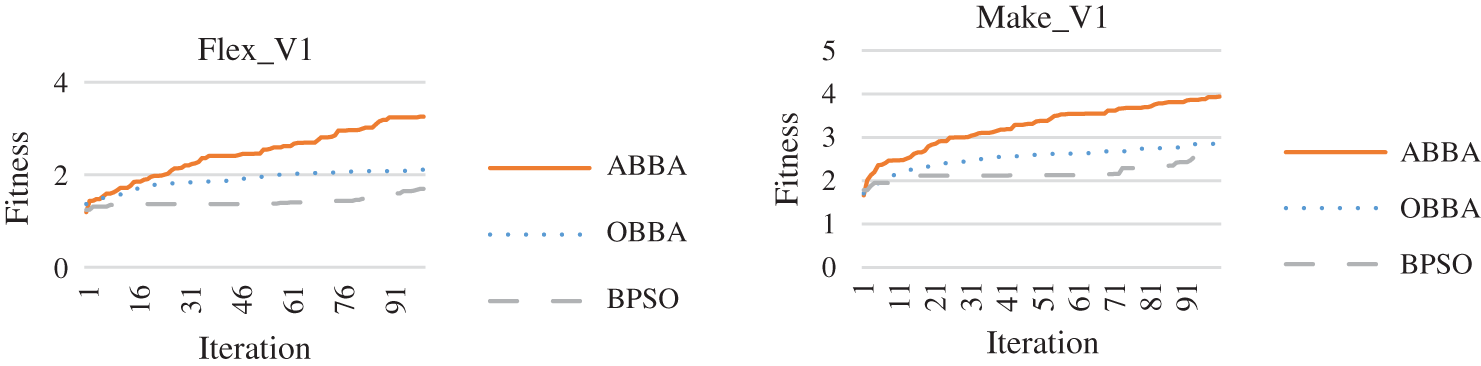
Figure 2: Sample convergence curves of the MO-ABBA, MO-BBA and MO-BPSO
This paper proposed solving the multi-objective test suite reduction problem using the Binary Bat algorithm, which is reported in the literature as one of the effective swarm intelligence based algorithms. The BBA algorithm was adapted for better exploration capabilities and consequently better performance. The TSR problem was formulated as a multi-objective optimization problem. The adapted binary bat algorithm was utilized to search for the non-dominated solutions that keep the balance between the cost of the reduced test suites and their fault detection capabilities. The effectiveness of the adapted binary bat algorithm was assessed over eight programs of different test suites sizes, in addition to a set of unimodal and multi modal benchmark functions. The experimental results showed that the performance of the proposed MO-ABBA is superior to each of the MO-BBA and MO-BPSO in terms of the previously defined five metrics. Moreover, The MO-ABBA converged to the best solutions faster than each of the MO-BBA and the MO-BPSO. As a further extension for this work, different weighting mechanisms could be tried for the weighted sum multi-objective optimization. In addition, the fitness function could be redefined to include more objectives such as branch coverage. Furthermore, different inertia formulas [24] could be experimented with.
Funding Statement: The authors received no specific funding for this study.
Conflicts of Interest: The authors declare that they have no conflicts of interest to report regarding the present study.
1. C. Catal and D. Mishra, “Test case prioritization: A systematic mapping study,” Software Quality Journal, vol. 21, no. 3, pp. 445–478, 2013. [Google Scholar]
2. R. H. Rosero, O. S. Gómez and G. Rodríguez, “15 years of software regression testing techniques—A survey,” International Journal of Software Engineering Knowledge Engineering, vol. 26, no. 5, pp. 675–689, 2016. [Google Scholar]
3. G. Rothermel and M. J. Harrold, “Experience with regression test selection,” Empirical Software Engineering, vol. 2, no. 2, pp. 178–188, 1997. [Google Scholar]
4. A. Nadeem and A. Awais, “TestFilter: A statement-coverage based test case reduction technique,” in 2006 IEEE Int. Multitopic Conf., Islamabad, Pakistan, IEEE, pp. 275–280, 2006. [Google Scholar]
5. A. Gotlieb and D. Marijan, “FLOWER: Optimal test suite reduction as a network maximum flow,” in Proc. of the 2014 Int. Symp. on Software Testing and Analysis, San Jose, CA, USA, ACM, pp. 171–180, 2014. [Google Scholar]
6. Y. Jia and M. Harman, “An analysis and survey of the development of mutation testing,” IEEE Transactions on Software Engineering, vol. 37, no. 5, pp. 649–678, 2010. [Google Scholar]
7. T. Y. Chen and M. F. Lau, “A simulation study on some heuristics for test suite reduction,” Information Software Technology, vol. 40, no. 13, pp. 777–787, 1998. [Google Scholar]
8. S. U. R. Khan, S. P. Lee, N. Javaid and W. Abdul, “A systematic review on test suite reduction: Approaches, experiment’s quality evaluation, and guidelines,” IEEE Access, vol. 6, pp. 11816–11841, 2018. [Google Scholar]
9. R. Pan, Z. Zhang, X. Li, K. Chakrabarty and X. Gu, “Black-box test-coverage analysis and test-cost reduction based on a Bayesian network model,” in 2019 IEEE 37th VLSI Test Symp., Monterey, CA, USA, IEEE, pp. 1–6, 2019. [Google Scholar]
10. J. Geng, Z. Li, R. Zhao and J. Guo, “Search based test suite minimization for fault detection and localization: A co-driven method,” in Int. Sym. on Search Based Software Engineering, Raleigh, USA, Springer, pp. 34–48, 2016. [Google Scholar]
11. S. Mohanty, S. K. Mohapatra and S. F. Meko, “Ant colony optimization (ACO-Min) algorithm for test suite minimization,” in Progress in Computing, Analytics and Networking. Berlin, Germany: Springer, pp. 55–63, 2020. [Google Scholar]
12. S. Yoo and M. Harman, “Pareto efficient multi-objective test case selection,” in Proc. of the 2007 Int. Symp. on Software Testing and Analysis, New York, NY, USA, pp. 140–150, 2007. [Google Scholar]
13. S. Wang, S. Ali and A. Gotlieb, “Cost-effective test suite minimization in product lines using search techniques,” Journal of Systems Software, vol. 103, pp. 370–391, 2015. [Google Scholar]
14. Z. Wei, W. Xiaoxue, Y. Xibing, C. Shichao, L. Wenxin et al., “Test suite minimization with mutation testing-based many-objective evolutionary optimization,” in 2017 Int. Conf. on Software Analysis, Testing and Evolution, Harbin, China, IEEE, pp. 30–36, 2017. [Google Scholar]
15. N. Gupta, A. Sharma and M. K. Pachariya, “Multi-objective test suite optimization for detection and localization of software faults,” Journal of King Saud University-Computer Information Sciences, vol. 82, no. 11, pp. 1780, 2020. [Google Scholar]
16. S. K. Mohapatra, A. K. Mishra and S. Prasad, “Intelligent local search for test case minimization,” Journal of The Institution of Engineers: Series B, vol. 101, no. 5, pp. 1–11, 2020. [Google Scholar]
17. J.-Z. Sun and S.-Y. Wang, “A novel chaos discrete particle swarm optimization algorithm for test suite reduction,” in The 2nd Int. Conf. on Information Science and Engineering, Hangzhou, China, IEEE, pp. 1–4, 2010. [Google Scholar]
18. X.-S. Yang, A new metaheuristic bat-inspired algorithm. in Nature Inspired Cooperative Strategies for Optimization. Berlin, Germany: Springer, pp. 65–74, 2010. [Google Scholar]
19. X.-S. Yang, “Bat algorithm for multi-objective optimisation,” International Journal of Bio-Inspired Computation, vol. 3, no. 5, pp. 267–274, 2011. [Google Scholar]
20. M. Chawla and M. Duhan, “Bat algorithm: A survey of the state-of-the-art,” Applied Artificial Intelligence, vol. 29, no. 6, pp. 617–634, 2015. [Google Scholar]
21. A. Hamdy, “Genetic fuzzy system for enhancing software estimation models,” International Journal of Modeling Optimization, vol. 4, no. 3, pp. 227, 2014. [Google Scholar]
22. A. Hamdy and A. Mohamed, “Greedy binary particle swarm optimization for multi-objective constrained next release problem,” International Journal of Machine Learning Computing, vol. 9, no. 5, pp. 561–568, 2019. [Google Scholar]
23. R. Eberhart and J. Kennedy, “A new optimizer using particle swarm theory,” in Proc. of the Sixth Int. Symp. on Micro Machine and Human Science, Nagoya, Japan, IEEE, pp. 39–43, 1995. [Google Scholar]
24. J. C. Bansal, P. Singh, M. Saraswat, A. Verma, S. S. Jadon et al., “Inertia weight strategies in particle swarm optimization,” in 2011 Third World Congress on Nature and Biologically Inspired Computing, Salamanca, Spain, IEEE, pp. 633–640, 2011. [Google Scholar]
25. P. Ngatchou, A. Zarei and A. El-Sharkawi, “Pareto multi objective optimization,” in Proc. of the 13th Int. Conf. on, Intelligent Systems Application to Power Systems, Arlington, VA, USA, IEEE, pp. 84–91, 2005. [Google Scholar]
26. S. Mirjalili, S. M. Mirjalili and X.-S. Yang, “Binary bat algorithm,” Neural Computing Applications, vol. 25, no. 3–4, pp. 663–681, 2014. [Google Scholar]
27. R. A. Assi, W. Masri and C. Trad, “Substate profiling for effective test suite reduction,” in 2018 IEEE 29th Int. Symp. on Software Reliability Engineering, Memphis, TN, USA, IEEE, pp. 123–134, 2018. [Google Scholar]
28. C. Coviello, S. Romano, G. Scanniello, A. Marchetto, G. Antoniol et al., “Clustering support for inadequate test suite reduction,” in 2018 IEEE 25th Int. Conf. on Software Analysis, Evolution and Reengineering, Campobasso, Italy, IEEE, pp. 95–105, 2018. [Google Scholar]
29. Z. Anwar, H. Afzal, N. Bibi, H. Abbas, A. Mohsin et al., “A hybrid-adaptive neuro-fuzzy inference system for multi-objective regression test suites optimization,” Neural Computing Applications, vol. 31, no. 11, pp. 7287–7301, 2019. [Google Scholar]
30. P. G. Frankl, S. N. Weiss and C. Hu, “All-uses vs mutation testing: An experimental comparison of effectiveness,” Journal of Systems Software, vol. 38, no. 3, pp. 235–253, 1997. [Google Scholar]
31. A. J. Offutt, A. Lee, G. Rothermel, R. H. Untch, C. Zapf et al., “An experimental determination of sufficient mutant operators,” ACM Transactions on Software Engineering, vol. 5, no. 2, pp. 99–118, 1996. [Google Scholar]
32. J. H. Andrews, L. C. Briand, Y. Labiche and A. S. Namin, “Using mutation analysis for assessing and comparing testing coverage criteria,” IEEE Transactions on Software Engineering, vol. 32, no. 8, pp. 608–624, 2006. [Google Scholar]
33. J. Xin, G. Chen and Y. Hai, “A particle swarm optimizer with multi-stage linearly-decreasing inertia weight,” in 2009 Int. Joint Conf. on Computational Sciences and Optimization, Sanya, China, vol. 1, pp. 505–508, 2009. [Google Scholar]
34. H. Do, S. Elbaum and G. Rothermel, “Supporting controlled experimentation with testing techniques: An infrastructure and its potential impact,” Empirical Software Engineering, vol. 10, no. 4, pp. 405–435, 2005. [Google Scholar]
35. M. Polo, M. Piattini and I. García-Rodríguez, “Decreasing the cost of mutation testing with second-order mutants,” Software Testing, Verification and Reliability, vol. 19, no. 2, pp. 111–131, 2009. [Google Scholar]
36. I. A. Carvalho, D. G. da Rocha, J. G. R. Silva, V. da Fonseca Vieira and C. R. Xavier, “Study of parameter sensitivity on bat algorithm,” in Int. Conf. on Computational Science and Its Applications, Trieste, Italy, Springer, pp. 494–508, 2017. [Google Scholar]
 | This work is licensed under a Creative Commons Attribution 4.0 International License, which permits unrestricted use, distribution, and reproduction in any medium, provided the original work is properly cited. |